Probing the Effect of Molecular Structure Saddling on Ultrafast Charge Migration via Time-Resolved X-ray Diffraction
Abstract
Metal-corroles are macrocycle organic molecules with numerous practical applications. In particular, copper corroles exhibit an interesting saddled geometry, which has attracted significant attention from theoreticians and experimentalists over the years. The present work is dedicated to understand the effect of structural saddling in a copper corrole on potential probe signals via imaging ultrafast coherent electron dynamics. A linearly polarized pulse is used to trigger the electron dynamics and time-resolved x-ray diffraction is employed to image the triggered dynamics. It is found that the symmetry reduction in the time-resolved diffraction signals and electronic flux densities is a signature of the saddling in a copper corrole during ultrafast charge migration. Moreover, analysis of the electronic flux density reveals that the diagonal nitrogen atoms mediate coherent charge migration between them via a central copper atom. Correlation of the flux densities and the diffraction signals indicates that the signature of the charge migration is encoded in time-resolved diffraction signals. A comparison of the static diffraction signals of nonsaddled planar copper porphyrin and saddled nonplanar copper corrole in their ground states is made.
I Introduction
The chemistry of porphyrins and corroles is a never-ending field of exciting problems, for both fundamental and practical reasons Mingos et al. (2012). Corroles and porphyrins are macrocyclic organic molecules as they sustain a conjugation channel bearing a large number (18) of electrons. Due to a slightly smaller number of atoms, corroles are commonly known as reduced dimensional models for porphyrins Johnson and Kay (1965), with whom they share similar electronic properties. Over the years, many significant research works have been performed to understand ultrafast light-induced processes in porphyrins from a theoretical perspective Tremblay et al. (2021); Nam et al. (2020); Köksal and Koç (2017); Barth and Manz (2006); Barth et al. (2006). In contrast, corroles have not received similar attention in the context of light-induced ultrafast processes Lemon (2020). The present work is a first step towards exploring ultrafast coherent electron dynamics in metal-coordinated corroles.
Technological advancements in recent years have allowed one to control the synthesis of different types of corroles with interesting coordination chemistry. The properties of the central metal in metal-corroles are always the focus of ample attention. Due to the intriguing coordination chemistry and its compatibility with a variety of transition metals Nardis et al. (2019), metal-corroles have demonstrated potential for applications as photosensitizers Jiang et al. (2019); Mahammed and Gross (2019) and catalysts Dogutan et al. (2011); Gross et al. (2000); Mahammed et al. (2003), to name but a few. Copper corrole is one of the first systems bearing a transition metal in which copper was experimentally inserted in the N4 coordination core of the corrole ring. Unlike other metal-corrole complexes, copper corrole is found to have a saddling in its equilibrium structure (see Fig. 1), which makes this molecule very interesting for different applications Ghosh et al. (2000); Luobeznova et al. (2004); Bröring et al. (2007); Pierloot et al. (2010). A combined study of x-ray absorption spectroscopy and time-dependent density functional theory (TDDFT) have been performed to understand the electronic structure of copper corrole Lim et al. (2019). Moreover, the role of the saddling on the electronic structure properties of low-lying electronic states in copper corrole was explored by analyzing the results of planar and saddled geometries Pierloot et al. (2010). Furthermore, static x-ray diffraction with density functional analysis confirmed the saddling feature of copper corroles Alemayehu et al. (2009); Bröring et al. (2007). Several theoretical works have been carried out to understand the saddling in copper corroles Ghosh et al. (2000); Luobeznova et al. (2004); Alemayehu et al. (2009); Lim et al. (2019).
A priori, it is not obvious how the saddling in a molecular structure will affect the coherent electron dynamics on attosecond timescales, during which the effect of nuclear vibrations is insignificant. Moreover, what would be the signature of saddling in any experimental probe signal, if any? The main aim of the present work is to address such crucial questions. In this work, we present time-resolved imaging of coherent electron dynamics in an unsubstituted copper corrole within a pump-probe configuration. An ultrashort pump pulse induces a coherent electron dynamics, which is imaged by time-resolved x-ray diffraction (TRXD) at various pump-probe delay times. The availability of ultrashort, intense x-ray pulses from various free-electron laser sources around the globe Ishikawa et al. (2012); Emma et al. (2010) has opened a new array of possibilities to extend x-ray diffraction from static to time domain. Furthermore, there are successful reports of x-ray pulse generation in the attosecond time domain Hartmann et al. (2018); Duris et al. (2020). TRXD is an emerging method to probe ultrafast processes in nature with atomic-scale spatial and temporal resolutions and has triggered significant theoretical Töpfer et al. (2021); Giri et al. (2021); Simmermacher et al. (2020); Hermann et al. (2020); Simmermacher et al. (2017); Kowalewski et al. (2017); Dixit and Santra (2017); Slowik et al. (2014); Bredtmann et al. (2014); Dixit and Santra (2013); Dixit et al. (2013, 2012); Simmermacher et al. (2019) and experimental Zhang et al. (2022); Yong et al. (2021, 2018); Glownia et al. (2016); Minitti et al. (2015) research on TRXD from different molecules in recent years. Additionally, we will analyze time-dependent electronic flux densities to understand the mechanistic details of the charge migration associated with the induced dynamics. The time-dependent electronic flux densities provide additional information about the direction of the electron flow during charge migration.
II Computational Methods
The following expression of the differential scattering probability is used to simulate the TRXD corresponding to a coherent electron dynamics as Dixit et al. (2014)
| (1) |
Here, is the Thomson scattering cross section of a free electron, is an electronic wavepacket with as the pump-probe delay time, is an eigenstate of the unperturbed electronic Hamiltonian of the system, is the photon momentum transfer, and is the density operator. The above equation is valid for probe x-ray pulses shorter than the characteristic timescale of the dynamics.
The one-electron density can be used to describe relevant quantities corresponding to coherent many-electron dynamics. It can be obtained as the expectation value of the one-electron density operator from the electronic wavepacket as
| (2) |
To calculate , the -electron wavepacket is obtained by solving the many-electron time-dependent Schrödinger equation. In this work, the -electron wavepacket is represented as a linear combination of the ground-state wave function, , and of the lowest-lying many-body excited states of the system as
| (3) |
In the generic time-dependent configuration interaction formulation, the excited states are expressed as a linear combination of configuration state functions, , obtained from a reference ground-state wave function. In order to keep the computational cost low, only single excitations are taken into account, as
| (4) |
This provides a physically sound representation to the one-electron process investigated here. In the single-excited configuration state functions, and represent the excitation from occupied molecular orbital to unoccupied orbital . In the framework of the hybrid time-dependent density functional theory (TDDFT)/configurational interaction (CI) methodology Klinkusch and Tremblay (2016); Hermann and Tremblay (2016), all expansion coefficients are obtained from linear-response TDDFT (LR-TDDFT). The LR-TDDFT calculation is performed once prior to all dynamical simulations using standard quantum chemistry packages. The expansion coefficients of the excited states in Eq. (4) are renormalized to form pseudo-CI eigenfunctions. In the basis of pseudo-CI eigenfunctions chosen for the propagation, the Hamiltonian is diagonal to a good approximation. The time evolution of the coefficients in Eq. (3) is simulated by direct numerical integration of the time-dependent Schrödinger equation using a preconditioned adaptive step size Runge-Kutta algorithm Tremblay and Carrington Jr. (2004). The electronic flux density is calculated using Eqs. (3) and (4), as the expectation value of the operator of the following form
| (5) |
where represents the momentum operator. The open-source toolbox detCI@ORBKIT is used for post-processing the information obtained from the quantum chemistry package Hermann et al. (2016); Pohl et al. (2017); Hermann et al. (2017).
In this work, lowest-lying excited states below the ionization threshold are used to achieve the convergence of the excitation dynamics induced by the pump pulse. The states are computed using the CAM-B3LYP functional Yanai et al. (2004) and aug-cc-pVDZ basis sets Dunning and Thom (1989) on all atoms, as implemented in Gaussian16 Frisch et al. (2016). The frozen nuclei approximation is used throughout this work, as the motion of nuclei is typically much slower in comparison to the electronic motion. The computation of the one-electron integrals from the many-body wave function is performed using the detCI@ORBKIT toolbox Hermann et al. (2016); Pohl et al. (2017); Hermann et al. (2017). All many-electron dynamical simulations are performed using in-house codes Tremblay et al. (2011); Tremblay and Carrington Jr. (2004); Tremblay et al. (2008); Tremblay and Saalfrank (2008); Tremblay et al. (2010). The integrals required to compute the TRXD signals and electronic flux densities are calculated using ORBKIT OKg .
III Results and Discussion
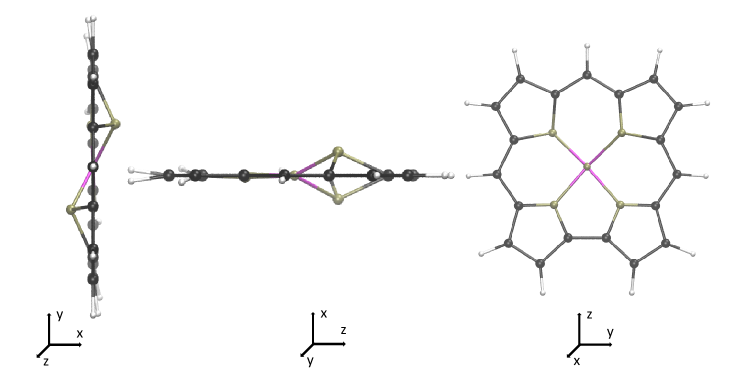
The molecular structure of the unsubstituted copper corrole is shown in Fig. 1 in ball-stick representation. All axes and coordinates are described in the molecular frame of reference, and it is assumed that the molecule is oriented in the -plane of the laboratory frame. From the projections in the two other planes, the saddling in copper corrole is evident, which makes this particular type of corrole appealing for detailed investigations.
To trigger the electron dynamics, a 10 fs cosine-squared pulse linearly polarized along the -axis is employed. The wavelength and the peak intensity of the pump pulse are chosen to 360 nm and 3.51013 W/cm2, respectively. For an ionization potential of about 6.78 eV, the Keldysh parameter is found to be 2.8, such that electron loss to the ionization channel via multiphoton processes is not dominant. It has been experimentally demonstrated that a coherent transfer of population from ground to excited states is possible with such intensity in molecular systems Prokhorenko et al. (2005). The resulting population dynamics of the electronic states during the pump pulse is presented in Fig. 2.
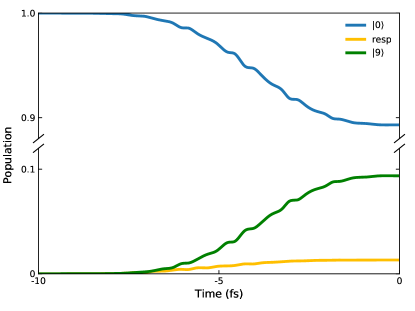
Transfer of population from the electronic ground state to other excited states starts as the pump pulse interacts and the electron dynamics in copper corrole sets into motion. As evident from Fig. 2, only a small amount of population around is transferred to the ninth electronic excited state, and most of the population remains in the ground state, i.e., at the end of the pulse. Small population transfer from the ground to excited states is common in various excitation schemes during experiments Liu et al. (2018); Glownia et al. (2016), as it can be achieved in a more controlled manner with lower field intensities. The rest of the electronic populations, termed as “resp” in Fig. 2, is distributed among other excited states with insignificant probability. The insignificant contributions from other states involved in the electronic response during the excitation can be neglected for further analysis. The energy difference between the ground and the ninth excited states is eV. Focusing only on the dominantly populated state allows one to estimate a characteristic timescale for the electron dynamics as = 1.2 fs, which is used for discussions. Time zero in Fig. 2 represents the onset of field-free charge migration, i.e., after the pump pulse ended.
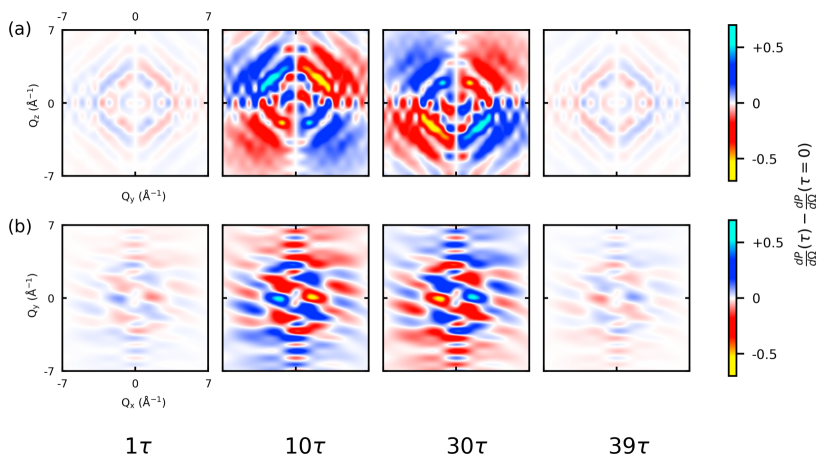
After triggering the coherent electron dynamics by a short, intense pump pulse, we employ TRXD in a pump-probe configuration to probe the dynamics using a probe pulse much shorter than = 30 as. Figure 3 presents time-resolved diffraction signals at different pump-probe time delays during the field-free charge migration dynamics. As the saddling is present in both the and planes, while the molecule lies in the plane without any saddling (see Fig. 1), the diffraction signals are presented in and planes, which are used to emphasize the role of saddling during the electron dynamics. For representation purposes, the total signal at the zero pump-probe delay time is subtracted from the total signals at different subsequent delay times. Ground and the 10 lowest-lying excited states are used to simulate the TRXD signal, i.e., in Eq. (1).
At a glance, it seems that the overall intensity variation of the diffraction signals in the [Fig. 3(a)] and [Fig. 3(b)] planes is approximately the same at all delay times, up to the phase and the signal magnitude. The global maxima and smaller local features migrate up and down in the plane. In the upper panels, the signal is found to be antisymmetric with respect to reflection about the line. At the beginning of the charge migration, i.e., at delay time , the signal also exhibits reflection symmetry with respect to the line around low region. This feature in the signal is also true around the characteristic timescale fs , which is clearly visible from the signal at [the last figure of Fig. 3(a)]. Note that the total signal, which is not the difference signal, is strictly anti-symmetric at and , and the snapshots at and are chosen at the onset of symmetry reduction. This scenario changes significantly at the two intermediate delay times, and . The intensity of the signal exhibits an extremum close to the center, with local maxima at around values of in and . The extremum is initially more intense and diffused in the upper half of the plane, i.e., at positive values along the axis at delay time . The symmetry reduction can be understood using a simplified model of the charge migration as a superposition of and electronic states. As derived from Eq. (1) (see also SI of Ref. [28]), the time-dependent part of the TRXD signal in such superposition state reads
| (6) |
where is the transition frequency between the and states, and
| (7) |
As evident from Fig. 4, the real and imaginary parts of in the plane have different symmetry under reflection over the axis. Thus, symmetry reduction occurs by oscillation between these two and terms.
Let us analyze the signal at , which deserves a separate discussion. Signal depletion is observed in the direction at both delay times as documented in the top panels of Fig. 3. In real space, this direction includes the nitrogen atom that buckles above the molecular () plane. Regions of signal enhancements (in blue and cyan) are found along the direction, coinciding with the direction, which contains the nitrogen atom buckling below the molecular () plane. Left-right reflection about the line is the only symmetry element remaining in the projection of the molecule in the plane, which gives rise to the pattern observed in the TRXD signal. Hence, interference effects due to electronic coherences lead to the symmetry reduction of the TRXD signal. The asymmetry of the maxima with respect to the line observed at both delay times, 10 and 30, correlates in both cases with signal depletion for the nitrogen above the corrole plane or with signal enhancement for the nitrogen below the plane.
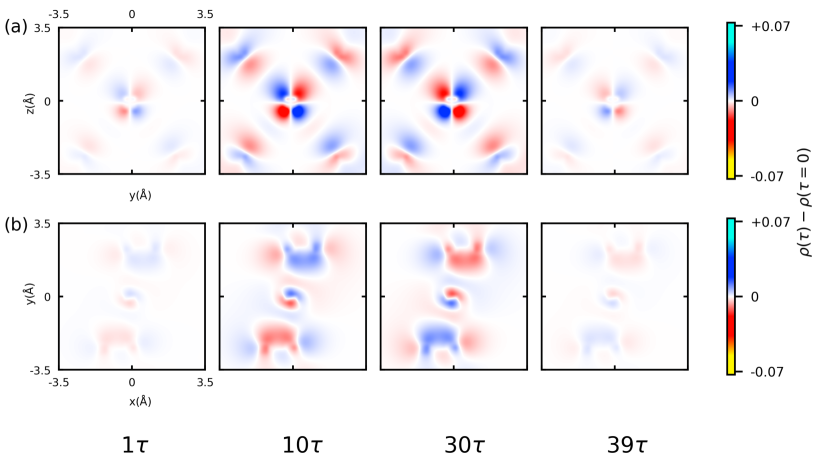
The signal in the plane at the beginning and end of the characteristic timescale transforms according to the B1 irreducible representation (IRREP) of the C2v point group. However, at other delay times, the signal transforms according to the A” IRREP of the Cs point group [see the second and third figures of Fig. 3(a)]. Incidentally, this is also the point group of the molecule projected in the plane; see right panel of Fig. 1. Let us understand this symmetry alteration by analyzing the time-dependent difference density during field-free charge migration, as shown in Fig. 5. As reflected from the top panels, the difference density in the plane is found to transform according to the A” IRREP of the Cs point group. This IRREP belongs to the point group of the plane projection of the molecule. Also, it is known that the Fourier transform of a transition density belonging to the Cs point group corresponds to the C2v point group Defranceschi and Berthier (1990).
The temporal evolution of the signals in the plane for different delay times is significantly different than the signals in the plane [see Figs. 3(a) and 3(b)]. The presence of the twisted structures in the diffraction signals seems a signature of the saddled structure of copper corrole during charge migration. Both the TRXD signal [Fig. 3(b)] and the difference density [Fig. 5(b)] retain exactly the same structure at all times, albeit with phase reversal and intensity variations during the dynamics. Both the signal and the difference density transform according to the Au IRREP of the Ci point group, to which belongs the projection of the molecule in the plane. It was shown that the Fourier transform of a transition density belonging to the Ci point group will belong to the same group Defranceschi and Berthier (1990).
To better understand the connection between the results shown in Figs. 3 and 5, let us analyze the key expression for TRXD, which reveals that the difference diffraction signal encodes the Fourier transform of the transition electron density [see Eq. (1)]. Also, the difference density of an electronic wave packet consists of several terms of transition electron density, i.e., . Note that it is well established that the TRXD is simply not related to the Fourier transform of the instantaneous electron density of the wave packet, ; and electronic coherences and the transition electron density play a crucial role in TRXD Dixit et al. (2012). From the top panels of Fig. 3, it is evident that the electronic coherences do not destroy the symmetry relations between the transition density and its Fourier transform at early and later delay times, but they induce symmetry reduction in the TRXD signal at intermediate delay times during the dynamics. This finding is specific to this particular example and the choice of exciting field is likely to affect the times at which symmetry reduction occurs due to interferences.
Let us explore the coherent electron dynamics in real space to complement the mechanistic picture of the charge migration, which could provide a deeper understanding of the time-resolved diffraction signal in detail. Knowledge of the dominant components of the electronic wave packet allows one to analyze the electron dynamics at different instances in real space. Recently, it has been discussed that the analysis of the transient electronic flux density provides a detailed understanding of the electron dynamics as the flux density maps the direction of the electron flow in real space Hermann et al. (2020); Carrascosa et al. (2021); Tremblay et al. (2021).
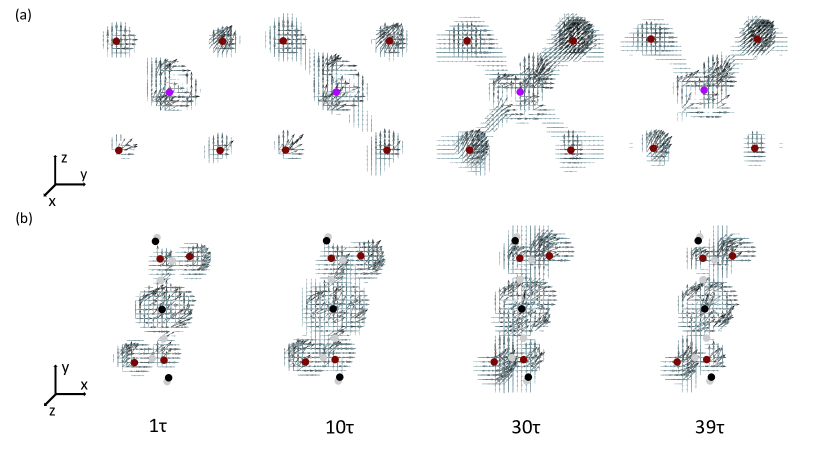
Figure 6 presents the electronic flux densities associated with the laser-induced charge migration at the same instances as in Fig. 3. The central part of the corrole ring containing the nitrogens and the copper is zoomed in to emphasize the dominant contribution to the flux densities. It is evident from Fig. 6(a) that the charge migration is taking place between the nitrogen atoms via the copper atom. Most of the charge seems to be displaced from the in-plane nitrogen in the bottom left to the nitrogen atom saddled above the surface in the top right, which corresponds to the line in momentum space. As reflected from Fig. 3, the TRXD signals decrease along the line, so we assign this migration pattern to a hole displacement during the dynamics. Synchronously, the nitrogen atom below the plane (top left) and the one in the bottom right appear to feed electrons to the copper atom, which corresponds well to the region of the TRXD signal increase along the line in the TRXD signal; see Fig. 3(a). The view of the flux densities in the plane provides complementary information. As evident from Fig. 6(b), out-of-plane nitrogen atoms are also connected to each other via the copper atom. This is revealed by the synchronous changes in the direction of the rotation of the flux densities around the nitrogen atoms. At 1 and 10, the flux densities in the upper two nitrogen atoms rotate anti-clockwise, whereas they rotate clockwise for the bottom ones. This picture is reversed in the last two time steps at 30 and 39.
Analysis of the electronic flux densities in Fig. 6 also shows that the flux densities in the diagonal nitrogen atoms are different in magnitudes and directions. The present findings are in stark contrast with similar laser-induced charge migration dynamics in planar molecules, such as benzene and porphyrin in which the flux densities and the charge migration dynamics are observed to be symmetric at all times Hermann et al. (2020); Barth and Manz (2006); Barth et al. (2006). However, the laser-induced dynamics in a chiral molecule was also studied, which reveals that such molecules without any symmetry also exhibit asymmetric current transport Giri et al. (2021, 2020). In this sense, the asymmetry in the electronic flux densities appears to be a signature of the saddling in copper corrole during charge migration dynamics, which could be measured as a symmetry reduction in the time-resolved diffraction signals. Although the distortion of the molecular structure due to the saddling occurs in the -plane, the signature of this symmetry reduction would rather be observed in the projection in the plane of the molecule, i.e., the plane. On the other hand, the connection between nitrogen atoms diametrically opposite of the copper atom is present in both the real-space and momentum-space views of the electron dynamics.
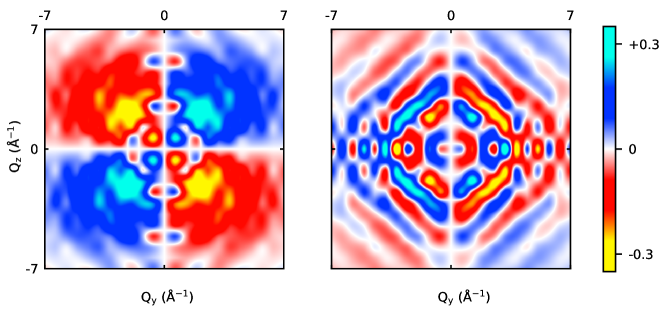
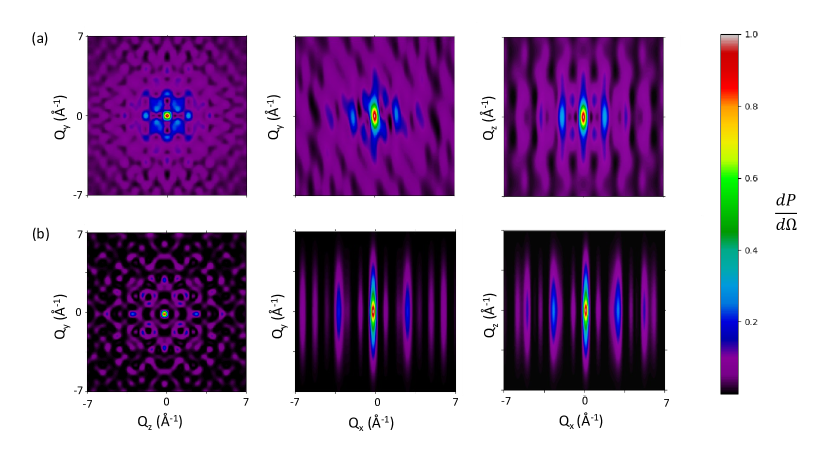
To further confirm our claim that the diagonal symmetry is related to the saddled structure of the copper corrole, we simulate the static diffraction signal of copper porphyrin in the ground state, which exhibits a non-saddled structure. For copper porphyrin in the ground state, the static diffraction signals are perfectly symmetric along the = 0 and = 0 planes. Moreover, owing to the non-saddled planar structure of copper porphyrin, the static diffraction signals in the and planes are identical, as reflected in Fig. 7(b). This is not the case for the signal of the saddled, nonplanar copper corrole shown in Fig. 7(a).
IV Conclusion
In summary, the present work is the first step towards understanding the interplay between ultrafast electron dynamics, structural deformation, and symmetry reduction in time-resolved x-ray imaging. We investigate laser-induced dynamics in copper corrole, which has an interesting saddled geometry with only slightly reduced symmetry. A linearly-polarized pump pulse is used to trigger electron dynamics, which is imaged by TRXD with atomic-scale spatiotemporal resolution. We find that the difference diffraction signals are sensitive to the saddled structure, and this asymmetry is reflected in the electronic flux densities. For the studied excitation, the saddled nitrogen atoms in copper corrole are found to facilitate the coherent charge migration between nitrogen and copper atoms. We believe that our results on imaging electron dynamics in symmetry-reduced systems will motivate further theoretical and experimental research, in particular on light-induced ultrafast processes in various metal-corroles.
Acknowledgements
S. G. acknowledges the Council of Scientific and Industrial Research (CSIR) for a senior research fellowship (SRF). G. D. acknowledges support from the Science and Engineering Research Board (SERB) India (Project No. ECR/2017/001460) and the Ramanujan Fellowship (Grant No. SB/S2/ RJN-152/2015).
References
- Mingos et al. (2012) D. M. P. Mingos, P. Day, and J. P. Dahl, Molecular Electronic Structures of Transition Metal Complexes I, vol. 142 (Springer Science & Business Media, 2012).
- Johnson and Kay (1965) A. Johnson and I. Kay, J. Chem. Soc 1620 (1965).
- Tremblay et al. (2021) J. C. Tremblay, V. Pohl, G. Hermann, and G. Dixit, Faraday Discussions 228, 82 (2021).
- Nam et al. (2020) Y. Nam, J. R. Rouxel, J. Y. Lee, and S. Mukamel, Physical Chemistry Chemical Physics 22, 26605 (2020).
- Köksal and Koç (2017) K. Köksal and F. Koç, Computational and Theoretical Chemistry 1099, 203 (2017).
- Barth and Manz (2006) I. Barth and J. Manz, Angewandte Chemie International Edition 45, 2962 (2006).
- Barth et al. (2006) I. Barth, J. Manz, Y. Shigeta, and K. Yagi, Journal of the American Chemical Society 128, 7043 (2006).
- Lemon (2020) C. M. Lemon, Pure and Applied Chemistry 92, 1901 (2020).
- Nardis et al. (2019) S. Nardis, F. Mandoj, M. Stefanelli, and R. Paolesse, Coordination Chemistry Reviews 388, 360 (2019).
- Jiang et al. (2019) X. Jiang, R.-X. Liu, H.-Y. Liu, and C. K. Chang, Journal of the Chinese Chemical Society 66, 1090 (2019).
- Mahammed and Gross (2019) A. Mahammed and Z. Gross, Coordination Chemistry Reviews 379, 121 (2019).
- Dogutan et al. (2011) D. K. Dogutan, R. McGuire Jr, and D. G. Nocera, Journal of the American Chemical Society 133, 9178 (2011).
- Gross et al. (2000) Z. Gross, G. Golubkov, and L. Simkhovich, Angewandte Chemie International Edition 39, 4045 (2000).
- Mahammed et al. (2003) A. Mahammed, H. B. Gray, A. E. Meier-Callahan, and Z. Gross, Journal of the American Chemical Society 125, 1162 (2003).
- Ghosh et al. (2000) A. Ghosh, T. Wondimagegn, and A. B. Parusel, Journal of the American Chemical Society 122, 5100 (2000).
- Luobeznova et al. (2004) I. Luobeznova, L. Simkhovich, I. Goldberg, and Z. Gross, European Journal of Inorganic Chemistry 2004, 1724 (2004).
- Bröring et al. (2007) M. Bröring, F. Brégier, E. Cónsul Tejero, C. Hell, and M. C. Holthausen, Angewandte Chemie International Edition 46, 445 (2007).
- Pierloot et al. (2010) K. Pierloot, H. Zhao, and S. Vancoillie, Inorganic Chemistry 49, 10316 (2010).
- Lim et al. (2019) H. Lim, K. E. Thomas, B. Hedman, K. O. Hodgson, A. Ghosh, and E. I. Solomon, Inorganic Chemistry 58, 6722 (2019).
- Alemayehu et al. (2009) A. B. Alemayehu, E. Gonzalez, L. K. Hansen, and A. Ghosh, Inorganic Chemistry 48, 7794 (2009).
- Ishikawa et al. (2012) T. Ishikawa, H. Aoyagi, T. Asaka, Y. Asano, N. Azumi, T. Bizen, H. Ego, K. Fukami, T. Fukui, Y. Furukawa, et al., Nature Photonics 6, 540 (2012).
- Emma et al. (2010) P. Emma, R. Akre, J. Arthur, R. Bionta, C. Bostedt, J. Bozek, A. Brachmann, P. Bucksbaum, R. Coffee, F. J. Decker, et al., Nature Photonics 4, 641 (2010).
- Hartmann et al. (2018) N. Hartmann, G. Hartmann, R. Heider, M. Wagner, M. Ilchen, J. Buck, A. Lindahl, C. Benko, J. Grünert, J. Krzywinski, et al., Nature Photonics 12, 215 (2018).
- Duris et al. (2020) J. Duris, S. Li, T. Driver, E. G. Champenois, J. P. MacArthur, A. A. Lutman, Z. Zhang, P. Rosenberger, J. W. Aldrich, R. Coffee, et al., Nature Photonics 14, 30 (2020).
- Töpfer et al. (2021) K. Töpfer, G. Dixit, and J. C. Tremblay, The Journal of Physical Chemistry C 125, 19032 (2021).
- Giri et al. (2021) S. Giri, J. C. Tremblay, and G. Dixit, Phys. Rev. A 104, 053115 (2021).
- Simmermacher et al. (2020) M. Simmermacher, A. Kirrander, and N. E. Henriksen, Phys. Rev. A 102, 052825 (2020).
- Hermann et al. (2020) G. Hermann, V. Pohl, G. Dixit, and J. C. Tremblay, Phys. Rev. Lett. 124, 013002 (2020).
- Simmermacher et al. (2017) M. Simmermacher, N. E. Henriksen, and K. B. Møller, Phys. Chem. Chem. Phys. 19, 19740 (2017).
- Kowalewski et al. (2017) M. Kowalewski, K. Bennett, and S. Mukamel, Structural Dynamics 4, 054101 (2017).
- Dixit and Santra (2017) G. Dixit and R. Santra, Phys. Rev. A 96, 053413 (2017).
- Slowik et al. (2014) J. M. Slowik, S. K. Son, G. Dixit, Z. Jurek, and R. Santra, New J. Phys. 16, 073042 (2014).
- Bredtmann et al. (2014) T. Bredtmann, M. Ivanov, and G. Dixit, Nature Communications 5, 5589 (2014).
- Dixit and Santra (2013) G. Dixit and R. Santra, J. Chem. Phys. 138, 134311 (2013).
- Dixit et al. (2013) G. Dixit, J. M. Slowik, and R. Santra, Phys. Rev. Lett. 110, 137403 (2013).
- Dixit et al. (2012) G. Dixit, O. Vendrell, and R. Santra, Proc. Natl. Acad. Sci. U.S.A. 109, 11636 (2012).
- Simmermacher et al. (2019) M. Simmermacher, A. Moreno Carrascosa, N. E. Henriksen, K. B. Møller, and A. Kirrander, Journal of Chemical Physics 151, 174302 (2019).
- Zhang et al. (2022) M. Zhang, Z. Guo, X. Mi, Z. Li, and Y. Liu, J. Phys. Chem. Letts. 13, 1668 (2022).
- Yong et al. (2021) H. Yong, X. Xu, J. M. Ruddock, B. Stankus, A. M. Carrascosa, N. Zotev, D. Bellshaw, W. Du, N. Goff, Y. Chang, et al., Proc. Natl. Acad. Sci. U.S.A. 118, e2021714118 (2021).
- Yong et al. (2018) H. Yong, N. Zotev, B. Stankus, J. M. Ruddock, D. Bellshaw, S. Boutet, T. J. Lane, M. Liang, S. Carbajo, J. S. Robinson, et al., J. Phys. Chem. Lett. 9, 6556 (2018).
- Glownia et al. (2016) J. M. Glownia, A. Natan, J. P. Cryan, R. Hartsock, M. Kozina, M. P. Minitti, S. Nelson, J. Robinson, T. Sato, T. van Driel, et al., Phys. Rev. Lett. 117, 153003 (2016).
- Minitti et al. (2015) M. P. Minitti, J. M. Budarz, A. Kirrander, J. S. Robinson, D. Ratner, T. J. Lane, D. Zhu, J. M. Glownia, M. Kozina, H. T. Lemke, et al., Phys. Rev. Lett. 114, 255501 (2015).
- Dixit et al. (2014) G. Dixit, J. M. Slowik, and R. Santra, Phys. Rev. A 89, 043409 (2014).
- Klinkusch and Tremblay (2016) S. Klinkusch and J. C. Tremblay, J. Chem. Phys. 144, 184108 (2016).
- Hermann and Tremblay (2016) G. Hermann and J. C. Tremblay, J. Chem. Phys. 145, 174704 (2016).
- Tremblay and Carrington Jr. (2004) J. C. Tremblay and T. Carrington Jr., J. Chem. Phys. 121, 11535:1 (2004).
- Hermann et al. (2016) G. Hermann, V. Pohl, J. C. Tremblay, B. Paulus, H. C. Hege, and A. Schild, J. Comp. Chem. 37, 1511 (2016).
- Pohl et al. (2017) V. Pohl, G. Hermann, and J. C. Tremblay, J. Comput. Chem. 38, 1515 (2017).
- Hermann et al. (2017) G. Hermann, V. Pohl, and J. C. Tremblay, J. Comput. Chem. 38, 2378 (2017).
- Yanai et al. (2004) T. Yanai, D. Tew, and N. Handy, Chem. Phys. Lett. 393, 51 (2004).
- Dunning and Thom (1989) J. Dunning and H. Thom, J. Chem. Phys. 90, 1007 (1989).
- Frisch et al. (2016) M. J. Frisch, G. W. Trucks, H. B. Schlegel, G. E. Scuseria, M. A. Robb, J. R. Cheeseman, G. Scalmani, V. Barone, G. A. Petersson, H. Nakatsuji, et al., Inc., Wallingford CT (2016).
- Tremblay et al. (2011) J. C. Tremblay, S. Klinkusch, T. Klamroth, and P. Saalfrank, J. Chem. Phys. 134, 044311 (2011).
- Tremblay et al. (2008) J. C. Tremblay, T. Klamroth, and P. Saalfrank, J. Chem. Phys. 129, 084302:1 (2008).
- Tremblay and Saalfrank (2008) J. C. Tremblay and P. Saalfrank, Phys. Rev. A 78, 063408:1 (2008).
- Tremblay et al. (2010) J. C. Tremblay, P. Krause, T. Klamroth, and P. Saalfrank, Phys. Rev. A 81, 063420:1 (2010).
- (57) orbkit download link, https://github.com/orbkit/orbkit, accessed: 2020-10-05.
- Prokhorenko et al. (2005) V. I. Prokhorenko, A. M. Nagy, and R. D. Miller, J. Chem. Phys. 122, 184502 (2005).
- Liu et al. (2018) C. Liu, J. Manz, K. Ohmori, C. Sommer, N. Takei, J. C. Tremblay, and Y. Zhang, Phys. Rev. Lett. 121, 173201 (2018).
- Defranceschi and Berthier (1990) M. Defranceschi and G. Berthier, J. Phys. France 51, 2791 (1990).
- Carrascosa et al. (2021) A. M. Carrascosa, M. Yang, H. Yong, L. Ma, A. Kirrander, P. M. Weber, and K. Lopata, Faraday Discussions 228, 60 (2021).
- Giri et al. (2020) S. Giri, A. M. Dudzinski, J. C. Tremblay, and G. Dixit, Phys. Rev. A 102, 063103 (2020).