Comparison of the star formation of X-ray selected active galactic nuclei in eFEDS with star-forming galaxies
We use X-ray Active Galactic Nuclei (AGN) in the eROSITA Final Equatorial-Depth Survey (eFEDS), that span over two orders of magnitude in X-ray luminosity, , and compare their star-formation rate (SFR) relative to that of non-AGN star-forming systems, at . For that purpose, we compile a reference galaxy catalogue with sources. Both samples have the same photometric coverage, from optical to far-infrared. We construct the spectral energy distributions (SEDs) of all sources and fit them using the CIGALE code, utilizing the same templates and parametric grid for both samples. We account for the mass incompleteness and exclude quiescent systems from both datasets. These allow us to compare the SFR of the two populations in a uniform manner, minimising systematic effects. Based on our analysis, AGN at low and moderate LX (), have SFR that is lower, or at most, equal to that of star-forming galaxies, in agreement with previous studies. The large number of luminous X-ray AGN available in the eFEDS dataset, enable us to expand our investigations at higher LX to test previous, tentative results. At , the SFR of AGN appears enhanced, by , compared to that of star-forming sources, for systems with stellar mass, , confirming indications found in previous studies. The most massive sources , present a flat SFRnorm-LX relation up to , with SFR similar to that of star-forming galaxies. However, at higher LX (), we find indications that the SFR of these massive AGN hosts may be enhanced compared to that of non-AGN systems.
Key Words.:
1 Introduction
It has been more than two decades since a relation was found between the large scale properties of galaxies and the mass of the supermassive black holes (SMBH) that live in their centres (e.g. Magorrian et al., 1998; Ferrarese & Merritt, 2000; Gebhardt et al., 2000; Kormendy & Ho, 2013). It still is, though, a matter of debate how SMBHs and galaxies interact with each other, despite their difference in physical scale (e.g. Alexander & Hickox, 2012).
To shed light on this question it is important to uncover the mechanisms that drive cold gas onto the SMBH, causing its growth and giving birth to an Active Galactic Nuclei (AGN). Various fuelling processes have been proposed in the literature (for a review see Alexander & Hickox, 2012), depending on the redshift, the AGN power (X-ray luminosity, LX) and the stellar mass, M∗, of the galaxy. Major mergers provide a possible triggering mechanism in the case of luminous AGN (e.g., Bower et al., 2006; Hopkins et al., 2008), while for lower luminosity AGN alternative processes have been suggested, such as minor mergers and disk instabilities (e.g., Genzel et al., 2008; Ciotti et al., 2010). In these cases, large amounts of gas are driven to the centre of galaxies, fuelling the SMBH and setting off the star-formation (SF) of the host galaxy. Therefore, the same mechanism is responsible for triggering both the growth of SMBH and the growth of the galaxy itself. However, alternative processes have been proposed that activate the SMBH, but are decoupled from the SF of the (host) galaxy. For example, in massive systems, diffuse hot gas can be accreted onto the SMBH without first being cooled onto the galactic plane (e.g., Fanidakis et al., 2013).
AGN feedback can also regulate the SF activity either by heating the gas reservoir of the host galaxy (negative feedback, e.g., Di Matteo et al., 2005; Croton et al., 2006) or by triggering the SF via e.g., AGN outflows during the gas-rich phase of galaxies (positive feedback, e.g., Zubovas et al., 2013). Understanding the physical mechanisms that trigger the AGN activity and the interplay between AGN and SF, over a wide range of LX, redshift and M∗ is fundamental to understand the galaxy formation and evolution.
Towards this end, a number of works have studied the SF of galaxies that host AGN as a function of AGN power (e.g., Lutz et al., 2010; Rosario et al., 2012; Rovilos et al., 2012). More information can be gained, though, by comparing the SFR of AGN host galaxies with the SFR of non-AGN systems. At low redshifts (), studies found that the SFR of AGN is consistent with that of main sequence (MS) star-forming galaxies (e.g., Santini et al., 2012; Shimizu et al., 2015; Leslie et al., 2016; Shimizu et al., 2017). Caution should be taken, though, when comparing results from different studies, since different works use galaxy control samples that include sources with different properties. For instance, as mentioned above, the SFR of X-ray AGN is consistent with that of star-forming galaxies, but appears higher, compared with a galaxy sample that includes both star-forming and quiescent systems (Santini et al., 2012) or with a simple mass-matching control sample (see Sect. 7.4 in Shimizu et al., 2017).
Luminous AGN are more rare compared to their lower LX counterparts and therefore larger cosmic volumes need to be probed to sample them. At higher redshifts, the scarcity of galaxies compelled most X-ray studies to use analytical expressions from the literature to measure the SFR of MS star-forming galaxies (e.g., Schreiber et al., 2015) and compare it with the SFR of AGN (e.g., Rosario et al., 2013; Mullaney et al., 2015; Masoura et al., 2018; Bernhard et al., 2019; Masoura et al., 2021). The majority of these works utilized the SFRnorn parameter to quantify this comparison. SFRnorm is defined as the ratio of the SFR of AGN dominated systems to the SFR of star-forming galaxies with the same M∗ and redshift. Based on their findings, SFRnorm is independent of redshift (Mullaney et al., 2015). Moreover, there is a strong dependence of SFRnorm with the X-ray luminosity (Masoura et al., 2021), with more luminous AGN to have a narrower SFRnorm distribution, shifted to higher values and close to those of MS galaxies compared to their lower LX counterparts (Bernhard et al., 2019).
Recently, a number of studies compiled large non-AGN galaxy samples and compared their SFR with that of X-ray AGN. Florez et al. (2020) used AGN with in the Botes field and compared their SFR with a large, comparison sample of sources without X-ray AGN. Based on their analysis, the average SFR of galaxies that host luminous AGN is higher by a factor of compared to sources without AGN, at fixed M∗ and redshift.
Mountrichas et al. (2021c) using luminous X-ray AGN in the Botes field (), demonstrated the importance of using a galaxy control sample to compare the SFR of X-ray with non-AGN systems. Their analysis showed that, utilizing an analytical expression from the literature to calculate the SFR of star-forming MS systems, may introduce systematics that affect the comparison of the SFR of the two populations. Their results indicated that at high LX (), AGN hosted by galaxies with stellar mass , have enhanced SFR by compared to their galaxy reference sample. Mountrichas et al. (2022) used X-ray sources from the COSMOS-Legacy survey and applied the same methodology with Mountrichas et al. (2021c). Their AGN spanned lower luminosities () compared to their X-ray counterparts in Botes. Based on their results, low to moderate luminosity AGN have SFR that is lower, or at most equal, to that of MS galaxies.
In this work, we use X-ray AGN from the eROSITA Final Equatorial Depth Survey (eFEDS) field and compare their SFR with a galaxy reference catalogue, within the same spatial volume. The datasets are described in detail in Sect. 2. We follow the same methodology applied in the previous works of Mountrichas et al. (2021c, 2022) which allows us to compare and complement the results, covering in total a luminosity baseline of more than 2.5 orders of magnitude (). Specifically, we construct the spectral energy distributions (SEDs) of all galaxies and fit them, using the CIGALE code (Boquien et al., 2019; Yang et al., 2020, 2022). The models, parametric grid and quality criteria are described in Sect. 3 and are identical to those used in Mountrichas et al. (2021c, 2022), to avoid systematic effects introduced by different templates and parameter space. Our main goal is to use the large number of luminous AGN available in the eFEDS field and examine whether the tentative results presented in Mountrichas et al. (2021c) are confirmed. Our measurements are presented in Sect. 4.
Throughout this work, we assume a flat CDM cosmology with km s-1 Mpc-1 and (Komatsu et al., 2011).
2 Data
2.1 X-ray sample
In our analysis, we use the X-ray sources observed in the eFEDS field. The catalogue is presented in Brunner et al. (2021). eROSITA (extended ROentgen Survey with an Imaging Telescope Array; Predehl et al., 2021) is the primary instrument on the Spektrum-Roentgen-Gamma (SRG) orbital observatory (Sunyaev et al., 2021). SRG was built to provide a sensitive, wide field-of-view X-ray telescope with improved capabilities compared to those of XMM-Newton and Chandra, the two most sensitive targeting X-ray telescopes in operation.
The catalogue includes 27910 X-ray sources111An updated catalogue was released on December 3rd, 2021. This updated version is used in our analysis., detected in the keV energy band with detection likelihoods , that corresponds to a flux limit of erg cm in the keV energy range (Brunner et al., 2021). About of the sources are located at the borders of the field, which implies shorter exposure times, stronger vignetting and higher background. These sources are excluded from our analysis (”inArea90” flag). Salvato et al. (2021) presented the multiwavelength counterparts and redshifts of the X-ray sources, by identifying their optical counterparts. The DESI Legacy Imaging Survey DR8 (LS8; Dey et al., 2019) was used for the counterparts identification, due to its homogeneous coverage of the field and its depth. The catalogue also includes Gaia (Collaboration et al., 2020) and WISE (Lang, 2014) photometry. Two independent methods were utilized to find the counterparts of the X-ray sources, NWAY (Salvato et al., 2018) and ASTROMATCH (Ruiz et al., 2018). NWAY is based on Bayesian statistics and ASTROMATCH on the Maximum Likelihood Ratio (Sutherland & Saunders, 1992). For of the eFEDS point like sources, the two methods point at the same counterpart. Each counterpart is assigned a quality flag, CTP_quality. Counterparts with are considered reliable, in the sense that either both methods agree on the counterpart and have assigned a counterpart probability above threshold ( for 20873 sources), or both methods agree on the counterpart but one method has assigned a probability above threshold (, 1379 sources), or there is more than one possible counterparts (, 2522 sources). Only sources with are included in our analysis (). We note, however, that sources with represent only of our final X-ray sample and their exclusion from our analysis would not affect our results and conclusions (for the final selection of X-ray sources, see Sect. 3). Sources were, then, classified into Galactic and extragalactic, using a combination of methods and various information (for more details see Sect. 5 in Salvato et al., 2021). 21952 out of the 24,774 X-ray sources are characterised as extragalactic. Galactic sources are rejected from our analysis.
eFEDS has been observed by a number of spectroscopic surveys, such as GAMA (Baldry et al., 2018), SDSS (Blanton et al., 2017) and WiggleZ (Drinkwater et al., 2018). Only sources with secure spectroscopic redshift, specz, from the parent catalogues were considered in the eFEDS catalogue (Salvato et al., 2021). 6640 sources have reliable specz. Photometric redshifts, photoz, were computed for the remaining sources using the LePHARE code (Arnouts et al., 1999; Ilbert et al., 2006) and following the procedure outlined in e.g., Salvato et al. (2009, 2011); Fotopoulou et al. (2012). These estimates were compared with those using DNNz, a machine learning algorithm that uses exclusively HSC photometry (Nishizawa et al., in prep.). A redshift flag is assigned to each source, CTP_REDSHIFT_GRADE. Only sources with (26047/27910) are considered in this work. This criterion includes sources with either spectroscopic redshift () or the photoz estimates of the two methods agree () or agree within a tolerance level (, for more details see Sect. 6.3 of Salvato et al., 2021). We note, that of the X-ray sources in our final sample (see Sect. 3) have . Furthermore, we restrict our sources to those within the KiDS+VIKING area (Kuijken et al., 2019; Hildebrandt et al., 2020). Near-infrared (NIR) photometry outside of this region is shallow which significantly affects the accuracy and reliability of the photoz calculations (Sect. 6.1 in Salvato et al., 2021). Based on the numbers quoted in Table 7 of Salvato et al. (2021), the accuracy of photoz within the KiDs area, is and the fraction of outliers () is . 10,294/21,952 extragalactic X-ray sources are included in this area. Applying the and criteria, reduces the available number of X-ray sources to 10,098 AGN for our analysis.
Liu et al. (2021) performed a systematic X-ray spectral fitting analysis on all the X-ray systems, providing fluxes and luminosities, among other X-ray properties, for the eFEDS sources. Based on their results only of the sources are X-ray obscured. The power-law slope calculations are described by a Gaussian distribution with mean value and dispersion of . In this work, we use their posterior median, intrinsic (absorption corrected) X-ray fluxes in the keV energy band.
In our analysis, we measure (host) galaxy properties via SED fitting. In order to get reliable results, it is essential to measure these galaxy properties with the highest possible accuracy. Therefore, we require all X-ray AGN to have available the following photometric bands , where W1, W2, W4 are the photometric bands of WISE (Wright et al., 2010), at 3.4 , 4.6 and 22] , respectively, and the others are the optical and NIR photometric bands of KiDS/VIKING. These criteria, reduce the X-ray sources to 5921, i.e. of the 10,098 are rejected. This is due to our requirement for W4 ( of the 10098 do not have a W4 measurement). However, W4 is important to fit the mid-infrared (mid-IR) continuum, in particular at . We note that, although, we do not apply a requirement for availability of the W3 band (WISE band at 12 ), of the X-ray sources in the final sample (see Sect. 3) have W3 measurement.
The X-ray catalogue is also cross-matched with the GAMA-09 photometric catalogue produced by the HELP collaboration (Shirley et al., 2019, 2021), that covers of the eFEDS area. HELP provides data from 23 extragalactic survey fields, imaged by the Herschel Space Observatory which form the Herschel Extragalactic Legacy Project (HELP). The position of NIR/IRAC sources are then used as prior information to extract sources in the Herschel maps. The XID+ tool (Hurley et al., 2017), developed for this purpose, uses a Bayesian probabilistic framework and works with prior positions. The cross-match between the two catalogues was performed using 1″radius and the optical coordinates of the counterpart of each X-ray source. About of the X-ray sources have available Herschel/SPIRE photometry.
As mentioned earlier, the main goal of this work is to compare the SFR of X-ray AGN with that of non-AGN systems. In particular, we focus at high X-ray luminosities () and examine whether the indications found by Mountrichas et al. (2021c) in the Botes field, are confirmed by using an X-ray sample with more than twice the number of X-ray sources at high luminosities. Lower luminosities have already been the subject of examination from Mountrichas et al. (2022) using the COSMOS sample. AGN at low redshifts do not contribute to . Therefore, we exclude sources below . Furthermore, in our SED fitting process, we use the Gaussian Aperture and Photometry (GAAP) photometry that is available in the eFEDS X-ray catalogue and the KiDS/VIKING dataset of the galaxy reference sample. GAAP photometry is performed twice, with aperture setting and 1″.0. A value for each photometric band with the optimal MIN_APER is provided (for the choice of GAAP aperture size, see Kuijken et al., 2015). GAAP is optimised for calculating photoz that require colour measurements. In the case of extended and low redshift sources, total fluxes may be underestimated (Kuijken et al., 2019). For these reasons, in the following analysis we will use sources at .
2.2 Galaxy reference catalogue
To compare the SFR of X-ray AGN with non-AGN systems in a consistent manner, we compile a galaxy (non-AGN) reference catalogue. We require the same photometric coverage and apply the same SED fitting analysis in both datasets (see next section). We use the fourth data release catalogue of the KiDS/VIKING imaging survey (Kuijken et al., 2019) that has available optical and NIR photometry and photoz measurements for about 100 million galaxies over 1006 square degrees. We restrict the sample to those sources within the eFEDS region ( deg2 overlap) and apply the same requirements for photometric coverage of the X-ray sample. We also restrict the sample to sources with (see previous section). These requirements give us galaxies. We cross-match these sources with spectroscopic catalogues from SDSS, WiggleZ and GAMA which results in sources with available specz. For the remaining sources we use the photoz calculations provided in the KiDS/VIKING dataset. This allows us to significantly increase the size of our reference catalogue, in particular at , where a large fraction of the X-ray sources lie. photoz have been estimated using the BPZ code Benitez (2000). Wright et al. (2019) tested BPZ photoz, using the KiDS/VIKING photometry, against several deep spectroscopic surveys. Based on their analysis, the accuracy of photoz is found at . The fraction of outliers () is . Finally, we cross-match the galaxy reference catalogue with the GAMA-09 photometric catalogue of HELP. of the galaxies have been detected by Herschel.
| Parameter | Model/values |
|---|---|
| Star formation history: delayed model and recent burst | |
| Age of the main population | 1500, 2000, 3000, 4000, 5000 Myr |
| e-folding time | 200, 500, 700, 1000, 2000, 3000, 4000, 5000 Myr |
| Age of the burst | 50 Myr |
| Burst stellar mass fraction | 0.0, 0.005, 0.01, 0.015, 0.02, 0.05, 0.10, 0.15, 0.18, 0.20 |
| Simple Stellar population: Bruzual & Charlot (2003) | |
| Initial Mass Function | Chabrier (2003) |
| Metallicity | 0.02 (Solar) |
| Galactic dust extinction | |
| Dust attenuation law | Charlot & Fall (2000) law |
| V-band attenuation | 0.2, 0.3, 0.4, 0.5, 0.6, 0.7, 0.8, 0.9, 1, 1.5, 2, 2.5, 3, 3.5, 4 |
| Galactic dust emission: Dale et al. (2014) | |
| slope in | 2.0 |
| AGN module: SKIRTOR) | |
| Torus optical depth at 9.7 microns | 3.0, 7.0 |
| Torus density radial parameter p () | 1.0 |
| Torus density angular parameter q () | 1.0 |
| Angle between the equatorial plan and edge of the torus | |
| Ratio of the maximum to minimum radii of the torus | 20 |
| Viewing angle | |
| AGN fraction | 0.0, 0.1, 0.2, 0.3, 0.4, 0.5, 0.6, 0.7, 0.8, 0.9, 0.99 |
| Extinction law of polar dust | SMC |
| of polar dust | 0.0, 0.2, 0.4 |
| Temperature of polar dust (K) | 100 |
| Emissivity of polar dust | 1.6 |
| X-ray module | |
| AGN photon index | 1.9 |
| Maximum deviation from the relation | 0.2 |
| LMXB photon index | 1.56 |
| HMXB photon index | 2.0 |
| Total number of models (X-ray/reference galaxy catalogue) | 427,680,000/24,552,000 |
3 Analysis
3.1 CIGALE
To measure the (host) galaxy properties of the sources in our datasets, we apply SED fitting. For that, we use the CIGALE algorithm (Boquien et al., 2019; Yang et al., 2020, 2022). CIGALE allows for the inclusion of the X-ray flux in the fitting process and has the ability to account for the extinction of the UV and optical emission in the poles of AGN (Yang et al., 2020; Mountrichas et al., 2021b, a; Buat et al., 2021).
For consistency with our previous similar studies in the Botes (Mountrichas et al., 2021c) and the COSMOS (Mountrichas et al., 2022) fields, we use the same grid used in these works. This minimises any systematic effects that may be introduced due to the different modules and parametric grid used in the SED fitting process. Table LABEL:table_cigale present the templates and the values for the free parameters. In summary, to fit the galaxy component, we utilized a delayed star formation history (SFH) model with a function form ). A star formation burst is included (Ciesla et al., 2017; Małek et al., 2018; Buat et al., 2019) as a constant ongoing star formation of 50 Myr. Stellar emission is modelled using the single stellar population templates of Bruzual & Charlot (2003) and is attenuated following Charlot & Fall (2000). The emission of the dust heated by stars is modelled based on Dale et al. (2014), without any AGN contribution. The AGN emission is fit using the SKIRTOR models of Stalevski et al. (2012, 2016). SED decomposition is able to uncover AGN that remain undetected by X-rays (e.g., Pouliasis et al., 2020). To identify such objects in the galaxy reference sample, we also include the AGN module when we fit the SEDs of these sources.
3.2 Quality and reliability examination of the fitting results
To exclude from the analysis sources that are badly fitted, we impose a reduced threshold, . This threshold is based on visual inspection of the SEDs and has been used in previous studies (e.g., Masoura et al., 2018; Mountrichas et al., 2021c; Buat et al., 2021). of the X-ray AGN and of the galaxies in the reference catalogue satisfy this criterion. Applying a more strict criterion, e.g., , reduces the number of sources ( of the X-ray AGN and of the galaxies in the reference catalogue satisfy this criterion), but does not affect the results, presented in the next section. We also exclude systems for which CIGALE could not constrain the parameters of interest (SFR, M∗). For that we apply the same criteria used in previous recent studies (e.g., Mountrichas et al., 2021c, 2022; Koutoulidis et al., 2021; Buat et al., 2021). The method uses the two values that CIGALE provides for each estimated galaxy property. One value corresponds to the best model and the other value (bayes) is the likelihood weighted mean value. A large difference between the two calculations suggests a complex likelihood distribution and important uncertainties. Thus, we only include in our analysis sources with and , where SFRbest, M∗,best are the best fit values of SFR and M∗, respectively and SFRbayes and M∗,bayes are the Bayesian values, estimated by CIGALE. and of the sources in the initial X-ray and galaxy reference catalogues meet these requirements.
In previous studies in the Botes (Mountrichas et al., 2021c), the XMM-XXL (Mountrichas et al., 2021a) and the COSMOS (Mountrichas et al., 2022) fields, it has been demonstrated that CIGALE can provide reliable SFR and M∗ measurements for AGN and galaxies with the same photometric coverage as in the present work, at similar redshifts. We repeat these tests for our samples and reach similar conclusions. Furthermore, the aforementioned studies have shown that lack of far-IR photometry does not affect the SFR calculation of CIGALE. Using the of our X-ray AGN and of the galaxies in the reference sample, with Herschel detection, we confirm these previous findings.
Finally, throughout our analysis, we take into account the uncertainties of the SFR and M∗ calculations, provided by CIGALE. Specifically, we calculate the significance () of each stellar mass, , and SFR, , measurement and weight each source based on these values. The total weight, , assigned to each source is given by the equation
| (1) |
| total | |||
|---|---|---|---|
| X-ray catalogue | 1,867 (1,763) | 1,145 (1,092) | 722 (671) |
| reference galaxy catalogue | 17,783 (17,305) | 15,261 (14,926) | 2,522 (2,379) |
3.3 Identification of non-X-ray AGN systems
In the SED fitting analysis, we model the AGN emission in the case of sources in the galaxy reference catalogue, too. We use CIGALE results to identify systems with an AGN component and exclude them from the galaxy sample. Specifically, we exclude sources with (without taking into account the uncertainties on the estimates), consistently with our previous studies (Mountrichas et al., 2021c, 2022). is defined as the ratio of the AGN IR emission to the total IR emission of the galaxy. This excludes of the sources in the galaxy reference catalogue. The percentage of sources with a significant AGN component rises from at to at .
This increase of the fraction of sources with an AGN component as we move to higher redshifts, was also found in Mountrichas et al. (2021c, 2022), in Botes and COSMOS. However, in these studies the percentage was ranging from , at to , at . The higher percentages we find using the eFEDS dataset can be explained by the different M∗ distributions in the three samples (e.g., Georgakakis et al., 2017; Aird et al., 2018). At , galaxies from the COSMOS and Botes catalogues, have mean and 10.7, respectively. However, galaxies in the eFEDS field, at the same redshift interval are more massive, with mean . At , there is also a difference of the mean M∗, for all three fields. Specifically, and 11.1 in COSMOS and Botes, respectively, while mean . We split the eFEDS sources in stellar mass bins and confirm that the median value of increases, with increasing M∗. Specifically, for , and , the median is 0.05, 0.09 and 0.16, respectively. For the above M∗ bins, the fraction of sources with is , , .
We, also, note that , and of the excluded sources have at , respectively, i.e., , , . The corresponding fractions for the reference catalogue in Botes are , and and in COSMOS are , and , respectively. Therefore, the accuracy with which CIGALE calculates the parameter is similar in the three fields.
Finally, we examine if our results are sensitive to the value of the we select. We apply a more strict criterion to identify sources with an AGN component, i.e., (without taking into account the uncertainties on the estimates). In this case, of the sources in the reference catalogue, are excluded. The distributions of SFR and M∗ of the remaining sources in the reference sample using and are identical. The median values of SFR and M∗ when we use and are: , and , , respectively. Furthermore, we confirm that the choice of the value for the does not affect the results presented in the next section.
We conclude that an increased number of sources with (significant) AGN emission is found as we move to higher redshifts and more massive systems. This is in accordance with studies that traced the AGN activity using the distribution of the specific black hole accretion rate and found that the probability of a galaxy to host an AGN (AGN duty cycle) is higher at earlier epochs and for more massive galaxies (e.g., Georgakakis et al., 2017; Yang et al., 2017, 2018; Aird et al., 2018).
This criterion significantly reduces the number of available sources in the galaxy reference catalogue, at . Therefore, we restrict our analysis to systems that lie at .
3.4 Mass completeness
Our goal is to compare the SFR of X-ray AGN with that of non-AGN galaxy systems, at different X-ray luminosities and redshifts. We also examine the role of stellar mass. This comparison could be affected by possible biases that may be introduced by the different mass completeness limits at different redshift intervals. To minimise these biases, we calculate the mass completeness at each redshift bin, following the method described in Pozzetti et al. (2010). For these calculations, we use the galaxy reference catalogue due to its larger size. The same method has been applied in previous, similar studies (e.g., Florez et al., 2020; Mountrichas et al., 2021c, 2022).
To estimate the mass completeness limits of our data, we, first, calculate the limiting stellar mass, M∗,lim, of each galaxy, using the following expression:
| (2) |
where M∗ is the stellar mass of each source, measured by CIGALE, m is the AB magnitude of the source and mlim is the AB magnitude limit of the survey. This expression estimates the mass the galaxy would have if its apparent magnitude was equal to the limiting magnitude of the survey for a specific photometric band. Then, we use the of the 20% of the faintest galaxies at each redshift bin. The minimum stellar mass at each redshift interval for which our sample is complete is the 95th percentile of , of the faintest galaxies in each redshift bin.
We use as the limiting band of the samples, in accordance with previous studies (Laigle et al., 2016; Florez et al., 2020; Mountrichas et al., 2021c, 2022) and set (Hildebrandt et al., 2020; Salvato et al., 2021). We find that the stellar mass completeness of our galaxy reference catalogue is and 10.67 at and , respectively. Using the J or H NIR bands does not change significantly the mass completeness limits. Specifically, we find that and 9.97, at , for the J and H bands, respectively and and 10.57, for J and H, at . We confirm that using, any other near-IR band does not affect the overall results and conclusions of our work. This is also true, if we use a more dense redshift grid () to calculate the mass completeness of our dataset.

3.5 Exclusion of quiescent systems
In this section, we describe how we identify and reject quiescent systems from our data. Mountrichas et al. (2021c) and Mountrichas et al. (2022) used the specific SFR, sSFR (), of their reference catalogues, to define quiescent galaxies. We follow their approach, which enable us to make a more consistent and fair comparison with their measurements, in the next section.
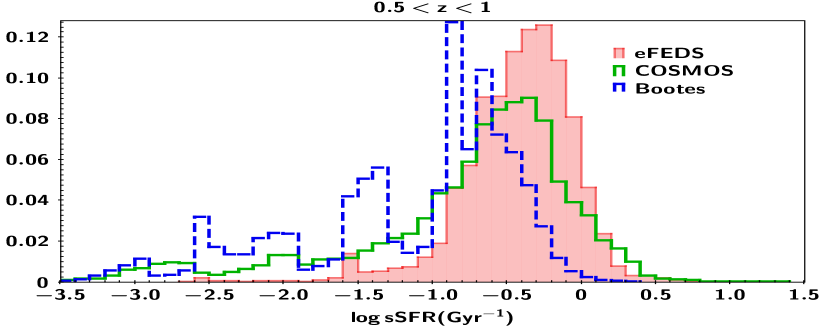
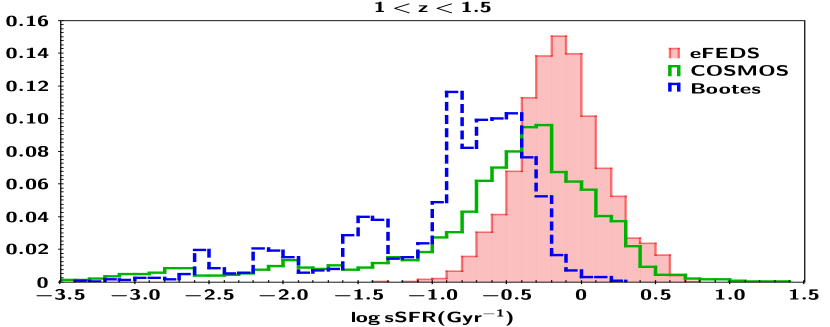
In Fig. 1, we plot the distributions of the sSFR of our galaxy catalogue, in two redshifts intervals (red shaded histograms). The mean values are and , at and , respectively. This evolution of the mean sSFR with redshift is consistent with that from MS studies (see Fig. 11 in Schreiber et al., 2015). Mountrichas et al. (2021c, 2022) identified quiescent systems, based on the location of a second lower peak present in the sSFR distributions. Following their approach, we locate these secondary peaks in our distributions. At , this lower peak is at . At , the sSFR distribution does not present a second peak. We choose to apply a cut at , which is lower compared to the cut at the lower redshift bin, consistently with the shift of mean sSFR values for the two redshift ranges.
Table LABEL:table_data shows the number of sources remaining, after excluding quiescent systems, from both the X-ray and the galaxy samples. About and of AGN and sources in the reference catalogue, reside in quiescent systems. These percentages appear low compared to those found in Mountrichas et al. (2022), in the COSMOS field ( and , for the AGN and galaxies in the reference sample, respectively) and in Mountrichas et al. (2021c), for sources in Botes ( for both datasets). For comparison, in Fig. 1, we overplot the sSFR distributions of the reference catalogues in COSMOS and Botes, for the same redshift intervals. We notice, that in both datasets there is a large tail that expands to lower sSFR values. This tail is less prominent in the case of eFEDS sources, for galaxies within , and absent for sources in the highest redshift bin. Sources in the Botes field present the highest fraction of quiescent systems. This could be due to the high mass completeness limits of the Botes samples that biased these datasets towards systems with low sSFR values. On the other hand, the brighter luminosities spanned by our X-ray and reference galaxy catalogues compared to the datasets in the COSMOS field, may bias our samples against sources with low sSFR values (median value of mag in eFEDS, compared to 21.6 and 23.2 for the sources in Botes and COSMOS.
We explore other possible methods to exclude quiescent systems. Alternatively, we identify as quiescent those sources that have sSFR 1 dex below the mean value, at each redshift range (e.g., Salim et al., 2018). Following this approach, we exclude sources with and , at and , respectively. Regarding the low redshift interval, the sSFR value is practically the same with that we used in our analysis above. At the high redshift range, the indicated sSFR value does not exclude nearly any quiescent system.
Next, we try a more strict definition to select quiescent systems. We exclude those sources that have sSFR values 0.3 dex below the mean value, at each redshift range. The results from following these approach are presented in Appendix A. We find that our results do not change (same trends are observed) regardless of how quiescent systems are defined. Following the more strict definition, SFRnorm values are slightly higher, by on average only , and well within the quoted errors of the two measurements. This effect will be discussed further in the next section.
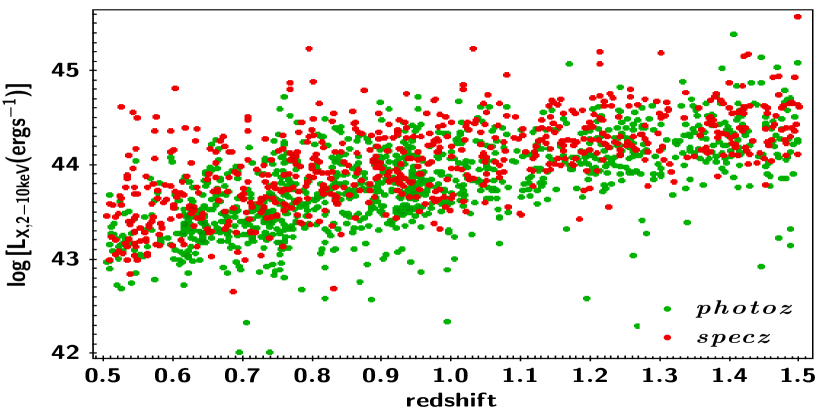
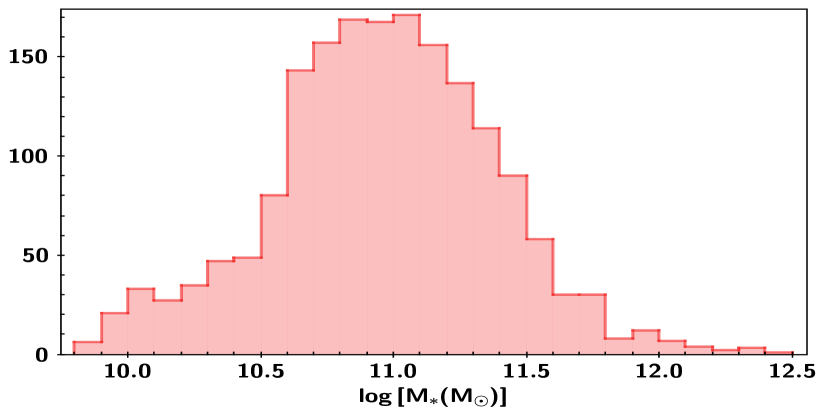
Based on these results, in the following analysis, we exclude quiescent systems from our datasets, using the location of the secondary, low peaks of the sSFR distributions. The number of sources in our final samples are shown in Table LABEL:table_data. The top panel of Fig. 2 presents the position of the X-ray AGN in the LX-redshift plane. There are 751 ( of them with specz) X-ray sources with . This number is higher compared to the corresponding number in the Botes field (Mountrichas et al., 2021c). The middle and bottom panels of Fig. 2, show the SFR and M∗ distributions of our X-ray sample. The median SFR and M∗ values are and , respectively.
4 Results
4.1 Comparison of the SFR of X-ray AGN with star-forming non-AGN systems, as a function of LX
To compare the SFR of X-ray AGN with star-forming systems from the reference galaxy catalogue, we use the SFRnorm parameter. SFRnorm is defined as the ratio of the SFR of galaxies that host AGN to the SFR of star-forming galaxies. For its calculation, we use the SFRs that CIGALE has calculated for the 1,763 X-ray sources and the 17,305 sources in the reference galaxy. This approach has certain merits. Both samples have the same photometric coverage, the same method (SED fitting) has been applied for the estimation of (host) galaxy properties (SFR, M∗), the same grid has been utilized for both datasets and quiescent systems have been excluded following the same criteria for both samples. These minimize a number of systematic effects that may have affected the results of previous studies that utilized, for the estimation of the SFR of star-forming galaxies, analytical expressions from the literature (e.g., Mullaney et al., 2015; Masoura et al., 2018; Bernhard et al., 2019).
For the calculation of SFRnorm, we follow the method presented in Mountrichas et al. (2021c, 2022). In brief, the SFR of each X-ray AGN is divided by the SFR of sources in the reference galaxy catalogue that have M∗ within from the M∗ of the AGN and lie within from the AGN. Our measurements are not sensitive to the choice of the box size around the AGN. Changing the above boundaries does not change the observed trends, but affects the errors of the calculations (Mountrichas et al., 2021c). The SFRnorm is then the median value of these ratios. In this process, each source is weighted based on the uncertainty of its SFR and M∗ measurement (see Sect. 3.2). We keep only X-ray AGN for which their SFRnorm has been measured using at least 30 sources from the reference catalogue.
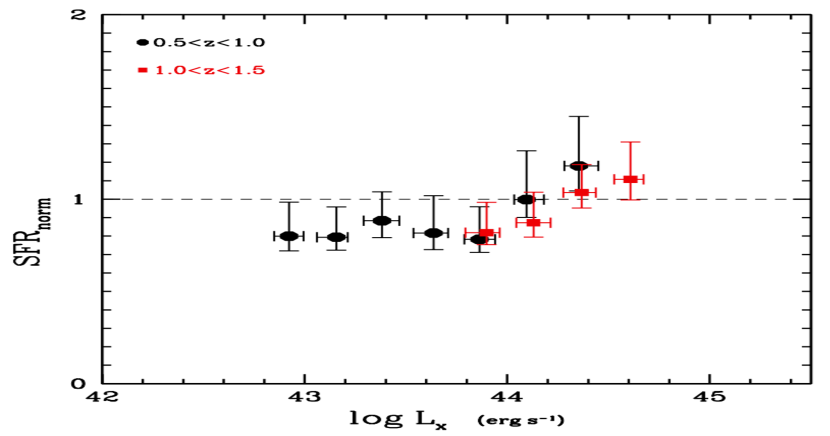
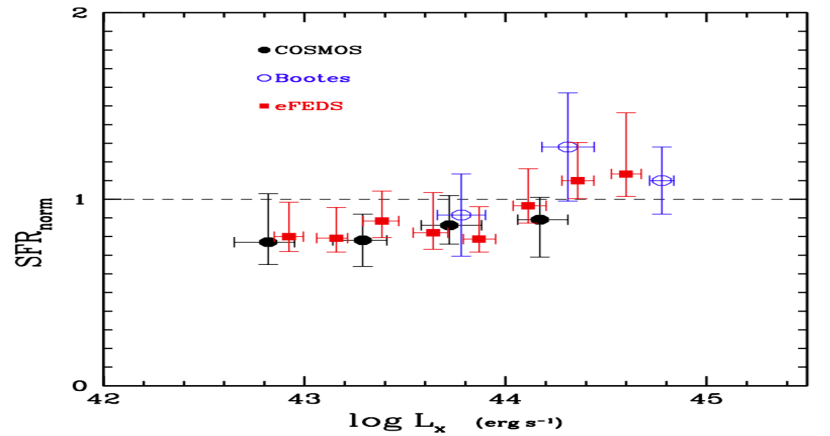
In Fig. 3, we plot the SFRLX relation, for the two redshift intervals, we use in our analysis. In overlapping X-ray luminosities, we do not find dependence of SFRnorm on redshift. This is in agreement with previous studies (Mullaney et al., 2015; Mountrichas et al., 2021c, 2022). Based on this result, in Fig. 4, we plot SFRLX in the total redshift range spanned by our datasets, i.e., at . Our goal is to examine the SFR of X-ray AGN relative to the SFR of star-forming galaxies, as a function of the AGN activity, i.e., the X-ray luminosity. We also present, in Fig. 4, the results from the Botes (0.5¡z¡2.0; Mountrichas et al., 2021c) and the COSMOS (0.5¡z¡2.5; Mountrichas et al., 2022) fields. At low to intermediate X-ray luminosities () our measurements are in very good agreement with those from COSMOS. Both results show that, in this LX regime, SFRnorm values are systematically below the dashed line, i.e. the SFR of AGN is lower compared to that of star-forming galaxies. However, the difference is not statistically significant (). This implies that galaxies that host X-ray AGN have lower or similar SFR compared to that of star-forming galaxies (SFR). At higher LX our measurements are in agreement with those in Botes, showing a small enhancement (on average ) which is only significant at a level of .
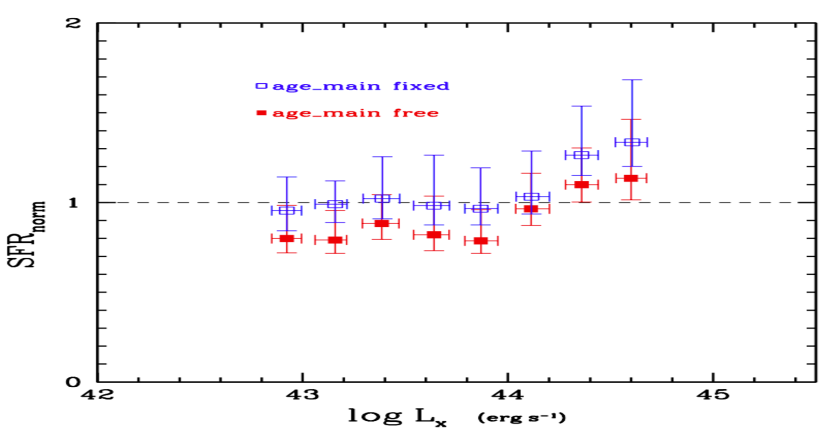
We perform an additional analysis to check if the SED fitting parameters influence the obtained results. In Appendix B, we examine the reliability of CIGALE to constrain the age of the stellar population of X-ray AGN and sources in the reference catalogue. Based on our analysis, the algorithm cannot effectively calculate this parameter. When we fix the stellar age and rerun the SED fitting analysis, we find that, although the observed trends of the SFRnorm-LX relation are not affected, SFRnorm values are increased by, on average, , bringing SFRnorm close to one.
The SFR found at may indicate that the SFR of AGN is lower than that of star-forming galaxies, i.e., the AGN reduces the star-formation of its host (e.g., Zubovas et al., 2013; Appleby et al., 2020; Lacerda et al., 2020; Shen et al., 2020). However, SFRnorm values are statistically consistent with SFR (within 1 ). Moreover, our analysis showed that the exact amplitude of SFRnorm is susceptible to the analysis we follow, e.g., depends on the criteria we apply to exclude quiescent systems (Appendix A) and on the SFH template and parametric grid adopted (Appendix B). We note, that in the case of the results from the COSMOS field, the SFRnorm values are less affected by the method to exclude quiescent systems and do not change when we fix the stellar ages. However, these SFRnorm measurements are, too, statistically consistent with one.
We conclude that, the SFR of AGN with is lower but consistent with that of star-forming galaxies. At higher LX, we observe an increase of the SFRnorm values, which is mild but in agreement with that found in previous studies (Mountrichas et al., 2021c, 2022).
The trends found by our analysis are consistent with those from previous studies. Masoura et al. (2021) found a strong dependence of SFR on LX, using X-ray AGN from the XMM-XXL dataset. Although our results do not present such a strong evolution of SFRnorm with LX, the overall trends are similar. Specifically, at low to moderate luminosities AGN tend to have lower or consistent SFR with non-AGN systems, while at higher LX the SFR of X-ray AGN appears enhanced compared to that of SF galaxies. We also note that in Masoura et al. (2021), they calculated SFRnorm using the analysitcal expression of Schreiber et al. (2015). As shown in Mountrichas et al. (2021c), this approach may introduce systematics that could affect the overall results. Bernhard et al. (2019) found that the SFRnorm distribution of AGN with is lower compared to that of MS galaxies, while more luminous X-ray sources have SFR that is consistent with that of MS SF systems, in agreement with our findings. Santini et al. (2012) used X-ray AGN from the GOODS-S, GOODS-N and XMM-COSMOS fields and compared their SFR with that of a mass-matched galaxy control sample. Based on their results the star formation of AGN is consistent with that of SF MS galaxies. Finally, Florez et al. (2020), used X-ray AGN from the Stripe 82 field and compared their SFR with a sample of non X-ray galaxies. Their analysis showed that X-ray sources have higher SFR compared to their control galaxy sample, by a factor of . Although our results agree with theirs regarding the enhancement of the SFR of luminous AGN compared to non-AGN systems, this enhancement is lower based on our measurements.
4.2 SFRLX for different M∗
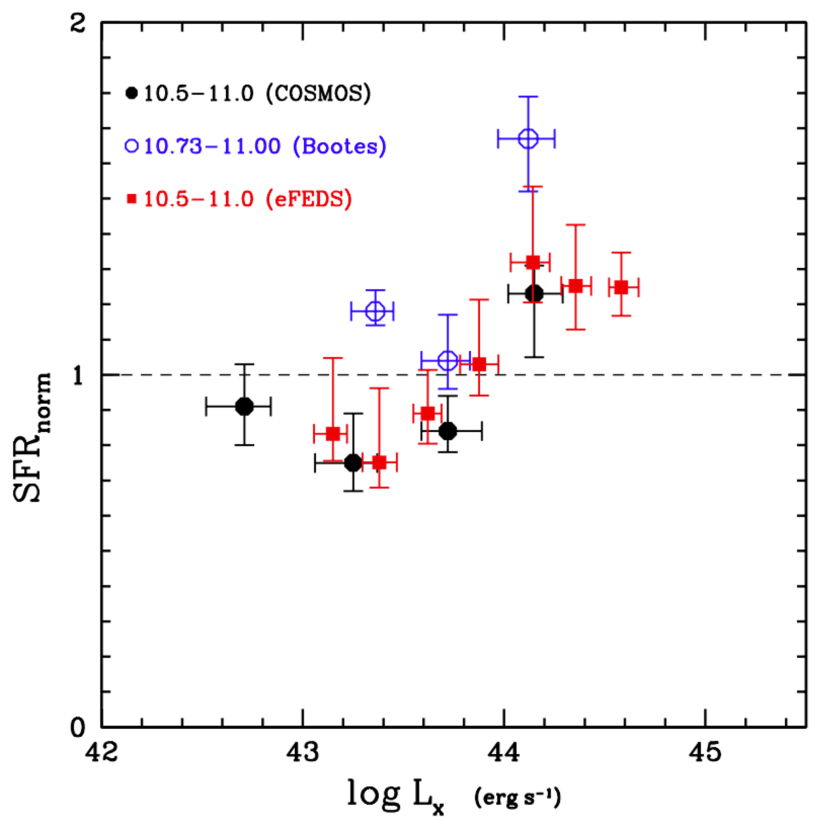
Mountrichas et al. (2021c) found indications that the small enhancement of SFRnorm with LX, at , becomes (more) evident when we take into account the M∗ of the host galaxy. Following their analysis, we then split our measurements into four M∗ bins. Our goal is to use the larger size of the eFEDS sample compared to the Botes X-ray catalogue and add more datapoints (bins) at the high LX regime. This will allows us to see whether this increase of SFRnorm is systematic. Our measurements also include a significantly larger number of X-ray sources in each bin which will improve the statistical significance of the measurements.
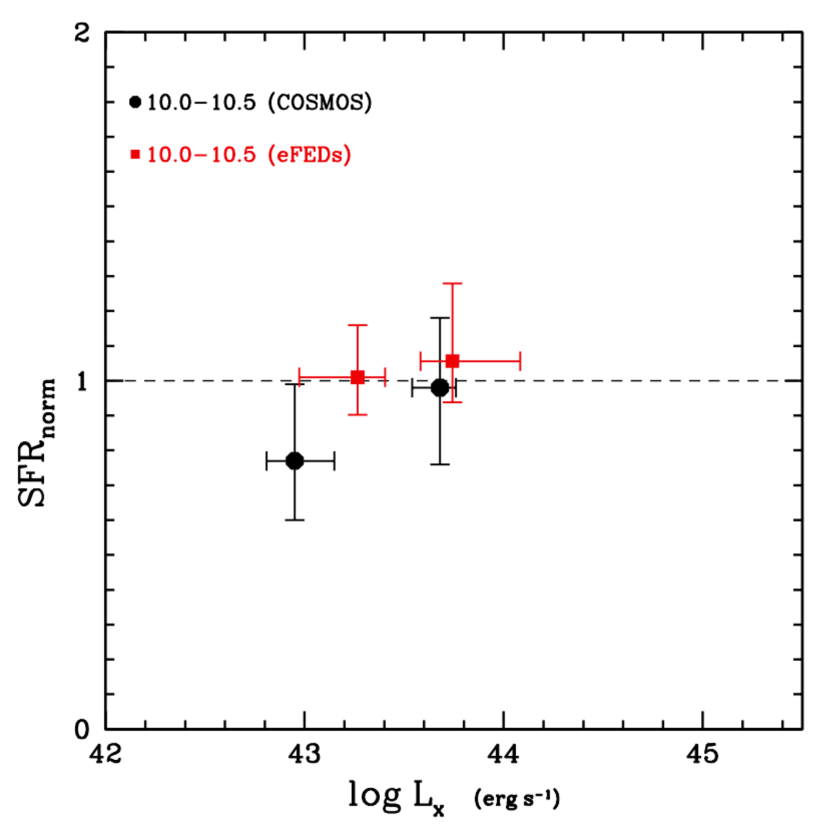
The top, left panel of Fig. 5, presents SFRnorm vs. LX, for galaxies with . In agreement with the results in the COSMOS field (Mountrichas et al., 2022), the SFR of galaxies that host AGN is consistent with the SFR of star-forming galaxies (dashed line). There are no results from Botes in this stellar mass range, due to the mass completeness limits of the Botes sample. The eFEDS and COSMOS datasets do not provide us with enough AGN at , in this M∗ regime, to examine whether the SFR of X-ray AGN changes compared to star-forming galaxies, at higher LX.
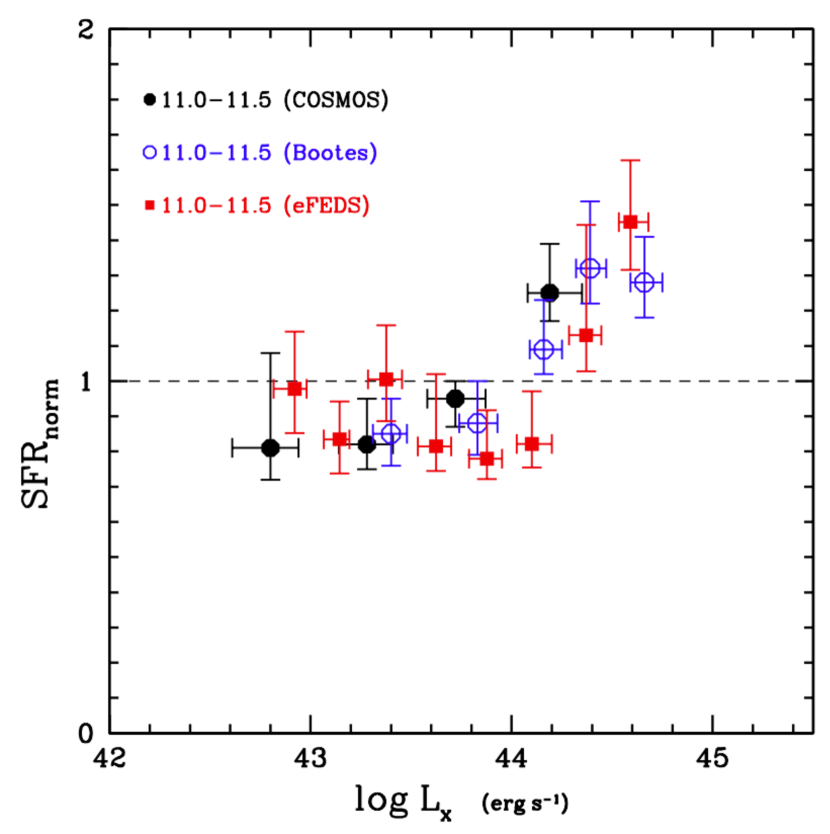
In the top, right panel of Fig. 5, we plot SFRnorm as a function of LX for AGN that live in galaxies with stellar mass, . We also plot the measurements from the COSMOS and Botes fields. For the latter, the M∗ interval is slightly different due to the high mass completeness values of this dataset. At low to intermediate luminosities (), our results are in agreement with those from previous studies and in particular with those from the COSMOS dataset, which has larger size compared to the Botes sample, in this luminosity interval. At , our measurements confirm the results from the previous studies for increased SFRnorm. More importantly, the eFEDS dataset extends this trend at higher X-ray luminosities, i.e., up to . Based on our results, X-ray AGN that live in galaxies with , at have enhanced SFR compared to star-forming galaxies, by a , with a statistical significance of .
In the bottom, left panel of Fig. 5, we plot SFRnorm as a function of LX for AGN that live in galaxies with M∗, . The trends observed are similar to those we described in the previous stellar mass bin. Specifically, at , the SFR of systems that host AGN is enhanced (by ) compared to non-AGN sources. We note, that the three bins at this LX interval, from the eFEDS sample, include 326 X-ray sources compared to 128 from the Botes catalogue.
We conclude that X-ray AGN that live in galaxies with , at , present enhanced SFR (by ) compared to sources in the reference galaxy catalogue. This increase was also seen in Fig. 4, but when M∗ is taken into account the enhancement is higher and the statistical significance increases.
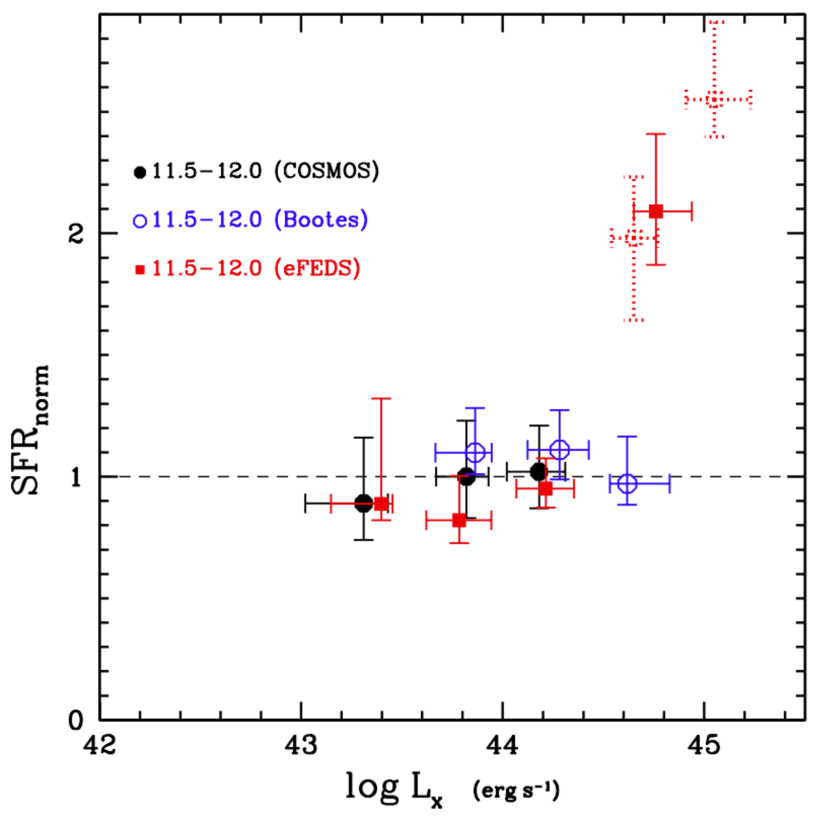
The bottom, right panel of Fig. 5, presents the SFR LX plane for galaxies with . Previous studies found a flat SFRLX relation for the most massive systems. Although, our measurements are in agreement with the previous results, we find an increase of SFRnorm, SFR , at . COSMOS datapoints do not go up to such high X-ray luminosities. However, X-ray sources in Botes, reach similar LX, but SFR. The highest LX bin from the Botes sample, includes 47 X-ray sources compared to 31 sources from eFEDS. Albeit, the size of the galaxy reference sample is significantly smaller in Botes. Specifically, in this stellar mass interval, in the Botes field there are 926 galaxies as opposed to 2,753 in eFEDS. As a consequence, for the calculation of the SFRnorm of each AGN, in the Botes sample, each X-ray source has been matched on average with 155 galaxies compared to 495 in the case of AGN in eFEDSs. Restricting the Botes X-ray sample to those AGN that are matched with galaxies from the reference sample, does not change the SFRnorm values. The quality of the SED fits of AGN in eFEDS and in Botes is similar for the sources under investigation, as implied by the median values (1.6 in eFEDS vs. 2.0 in Botes).
About half of the eFEDS AGN () have compared to () of the AGN in Botes. eFEDS sources also expand to (5/31), but the median LX of the two bins is similar (median and , for the eFEDS and Botes sources, respectively) and we do not observe a correlation of SFR with LX, at the narrow LX range probed by the 78 () AGN. Although, previous works did not find dependence of SFRnorm with redshift (e.g., Mullaney et al., 2015; Mountrichas et al., 2021c, 2022), we compare the redshift of the sources included in the two bins of interest. The 31 eFEDS AGN lie at (median ), whereas the 47 X-ray sources from Botes are within (median ).
Previous studies have not detected dependence of SFRnorm with the X-ray obscuration (e.g., Masoura et al., 2021; Mountrichas et al., 2021c). Nevertheless, we examine the X-ray obscuration of the AGN as a possible source of the different results found for this particular high LX bin. 32/47 () of the X-ray sources in Botes are X-ray obscured (N cm-2) compared to 10/31 () of the eFEDS AGN. However, we do not find a tendency for lower SFRnorm values for the obscured sources, in any of the two fields. This is also true, if we increase the NH value used for the X-ray classification (N cm-2). Similar results are found when we classify sources based on their inclination angle, , estimated by CIGALE.
Investigating further the properties of the sources in the two bins (e.g. AGN fraction, dust attenuation), we find similar distributions and median/average values. Their photometric coverage is also similar. eFEDS AGN, though, are more optically luminous compared to their Botes counterparts (median compared to 21.5).
We also split the highest LX bin from eFEDS into two, using a luminosity cut at . 23/31 AGN have lower LX than this cut and 8/31 have higher LX. The results are shown by the dotted, red squares in the bottom, right panel of Fig. 5. Although the number of sources included in the two bins is small and no strong conclusions can be drawn, we observe an increase of SFRnorm within the LX range probed by the 31 AGN. However, the lowest LX bin, of the two newly created, is still significantly higher compared to the highest LX bin from Botes, although the LX ranges spanned by the two bins are very similar.
A strong conclusion cannot be drawn, but we cannot rule out the possibility, the SFR of the most massive AGN hosts to be enhanced compared to MS galaxies at high LX, in accordance with our findings for less massive systems, but this enhancement to occur at even higher luminosities (). The reason that this trend was not observed in the Botes field could be a selection effect related to the significantly smaller size (by ) of that field compared to eFEDS.
5 Summary-Conclusions
We used X-ray selected AGN from the eFEDS field and more than galaxies in the same spatial volume () and compared the SFR of the two populations. Both samples have the same photometric coverage. We performed SED fitting, using the CIGALE algorithm and the same templates and parametric grid for both datasets. We accounted for the mass completeness of the two catalogues and applied a uniform method to exclude quiescent sources from both samples. These allowed us to compare the SFR of X-ray AGN and non-AGN systems in a uniform manner, minimizing systematic effects. Furthermore, our analysis and SED fitting grid are identical to those applied in previous studies (Mountrichas et al., 2021c, 2022), that used X-ray sources from different fields (COSMOS, Botes) and spanned different X-ray luminosities. This allows us to compare and complement our results with theirs and draw a picture regarding the location of X-ray AGN relative to the MS, in over 2.5 order of magnitude in LX ().
Our results showed that at low to moderate X-ray luminosities, , X-ray AGN have SFR that is below, or at most equal, to that of star-forming galaxies. This is in agreement with the results of Mountrichas et al. (2022) that used X-ray sources in the COSMOS field. Mountrichas et al. (2021c) used X-ray data from the Botes field, that span high LX, and found indications that the SFR of AGN is higher compared to that of MS galaxies, at . The eFEDS sample is times larger at these luminosities compared to the Botes dataset, enabling us to increase the number of datapoints in this LX regime. Our results confirm these previous tentative results. Specifically, luminous AGN that live in galaxies with have SFR that is by higher than that of non-AGN star-forming galaxies.
Finally, for the most massive systems (, we find a flat SFRLX relation up to , with SFR. Although, this picture holds at even higher LX, based on X-ray AGN from the Botes field (Mountrichas et al., 2021c), in our analysis, we detect significant enhancement of SFRnorm, at , by a factor of . Based on our investigations, we cannot rule out the possibility that in the case of the most massive AGN host galaxies, the SFR is enhanced compared to star-forming galaxies at high LX, in agreement with our results for less massive systems, but this enhancement occurs at even higher LX.
X-ray AGN, due to their different triggering mechanisms, constitute a diverse extragalactic population, hosted by a variety of galaxies. Our current analysis, complemented by the results from (Mountrichas et al., 2021c) and (Mountrichas et al., 2022), in the Botes and COSMOS fields, showed that is not only important to compare the SFR of AGN host galaxies with non-AGN systems in a uniform manner, but to study it in a wide range of X-ray luminosities and galaxy properties.
Acknowledgements.
GM acknowledges support by the Agencia Estatal de Investigación, Unidad de Excelencia María de Maeztu, ref. MDM-2017-0765. The project has received funding from Excellence Initiative of Aix-Marseille University - AMIDEX, a French ’Investissements d’Avenir’ programme. MB gratefully acknowledges support by the ANID BASAL project FB210003. K.M. is supported by the Polish National Science Centre grant UMO-2018/30/E/ST9/00082.References
- Aird et al. (2018) Aird, J., Coil, A. L., & Georgakakis, A. 2018, Monthly Notices of the Royal Astronomical Society, 474, 1225
- Alexander & Hickox (2012) Alexander, D. M. & Hickox, R. C. 2012, NewAR, 56, 93
- Appleby et al. (2020) Appleby, S., Davé, R., Kraljic, K., Anglés-Alcázar, D., & Narayanan, D. 2020, Monthly Notices of the Royal Astronomical Society, 494, 6053
- Arnouts et al. (1999) Arnouts, S., Cristiani, S., Moscardini, L., et al. 1999, MNRAS, 310, 540
- Baldry et al. (2018) Baldry, I. K., Liske, J., Brown, M. J. I., et al. 2018, Monthly Notices of the Royal Astronomical Society, 474, 3875
- Benitez (2000) Benitez, N. 2000, ApJ, 536, 571
- Bernhard et al. (2019) Bernhard, E., Grimmett, L. P., Mullaney, J. R., et al. 2019, Monthly Notices of the Royal Astronomical Society: Letters, 483, L52
- Blanton et al. (2017) Blanton, M. R., Bershady, M. A., Abolfathi, B., et al. 2017, AJ [1703.00052]
- Boquien et al. (2019) Boquien, M., Burgarella, D., Roehlly, Y., et al. 2019, Astronomy & Astrophysics, 622, A103
- Bower et al. (2006) Bower, R. G., Benson, A. J., Malbon, R., et al. 2006, MNRAS, 370, 645
- Brunner et al. (2021) Brunner, H., Liu, T., Lamer, G., et al. 2021, A&A [2106.14517]
- Bruzual & Charlot (2003) Bruzual, G. & Charlot, S. 2003, MNRAS, 344, 1000
- Buat et al. (2019) Buat, V., Ciesla, L., Boquien, M., Małek, K., & Burgarella, D. 2019, Astronomy & Astrophysics, 632, A79
- Buat et al. (2021) Buat, V., Mountrichas, G., Yang, G., et al. 2021, A&A, 654, A93
- Charlot & Fall (2000) Charlot, S. & Fall, S. M. 2000, ApJ, 539, 718
- Ciesla et al. (2017) Ciesla, L., Elbaz, D., & Fensch, J. 2017, Astronomy & Astrophysics, 608, A41
- Ciotti et al. (2010) Ciotti, L., Ostriker, J. P., & Proga, D. 2010, The Astrophysical Journal, 717, 708
- Collaboration et al. (2020) Collaboration, G., Brown, A. G. A., Vallenari, A., et al. 2020, A&A [2012.01533]
- Croton et al. (2006) Croton, D. J. et al. 2006, MNRAS, 365, 11
- Dale et al. (2014) Dale, D. A., Helou, G., Magdis, G. E., et al. 2014, ApJ, 784, 83
- Dey et al. (2019) Dey, A., Schlegel, D. J., Lang, D., et al. 2019, The Astronomical Journal, 157, 168
- Di Matteo et al. (2005) Di Matteo, T., Springel, V., & Hernquist, L. 2005, Nature, 433, 604
- Drinkwater et al. (2018) Drinkwater, M. J., Byrne, Z. J., Blake, C., et al. 2018, Monthly Notices of the Royal Astronomical Society, 474, 4151
- Fanidakis et al. (2013) Fanidakis, N., Georgakakis, A., Mountrichas, G., et al. 2013, Monthly Notices of the Royal Astronomical Society, 435, 679
- Ferrarese & Merritt (2000) Ferrarese, L. & Merritt, D. 2000, ApJ, 539, 9
- Florez et al. (2020) Florez, J., Jogee, S., Sherman, S., et al. 2020, Monthly Notices of the Royal Astronomical Society, 497, 3273
- Fotopoulou et al. (2012) Fotopoulou, S., Salvato, M., Hasinger, G., et al. 2012, The Astrophysical Journal Supplement Series, 198, 1
- Gebhardt et al. (2000) Gebhardt, K. et al. 2000, ApJ, 543, 5
- Genzel et al. (2008) Genzel, R. et al. 2008, ApJ, 687, 59
- Georgakakis et al. (2017) Georgakakis, A., Aird, J., Schulze, A., et al. 2017, Monthly Notices of the Royal Astronomical Society, 471, 1976
- Hildebrandt et al. (2020) Hildebrandt, H., Köhlinger, F., van den Busch, J. L., et al. 2020, Astronomy & Astrophysics, 633, A69
- Hopkins et al. (2008) Hopkins, P. F., Hernquist, L., Cox, T. J., & Keres, D. 2008, ApJS, 175, 356
- Hurley et al. (2017) Hurley, P. D., Oliver, S., Betancourt, M., et al. 2017, Monthly Notices of the Royal Astronomical Society, 464, 885
- Ilbert et al. (2006) Ilbert, O. et al. 2006, A&A, 457, 841
- Komatsu et al. (2011) Komatsu, E., Smith, K. M., Dunkley, J., et al. 2011, The Astrophysical Journal Supplement Series, 192, 18
- Kormendy & Ho (2013) Kormendy, J. & Ho, L. C. 2013, ARAA, 51, 511
- Koutoulidis et al. (2021) Koutoulidis, L., Mountrichas, G., Georgantopoulos, I., Pouliasis, E., & Plionis, M. 2021, A&A accepted [2111.02539]
- Kuijken et al. (2019) Kuijken, K., Heymans, C., Dvornik, A., et al. 2019, Astronomy & Astrophysics, 625, A2
- Kuijken et al. (2015) Kuijken, K., Heymans, C., Hildebrandt, H., et al. 2015, Monthly Notices of the Royal Astronomical Society, 454, 3500
- Lacerda et al. (2020) Lacerda, E. A. D., Sánchez, S. F., Fernandes, R. C., et al. 2020, Monthly Notices of the Royal Astronomical Society, 492, 3073
- Laigle et al. (2016) Laigle, C., McCracken, H. J., Ilbert, O., et al. 2016, ApJS, 224, 24
- Lang (2014) Lang, D. 2014, The Astronomical Journal, 147, 108
- Leslie et al. (2016) Leslie, S. K., Kewley, L. J., Sanders, D. B., & Lee, N. 2016, Monthly Notices of the Royal Astronomical Society: Letters, 455, L82
- Liu et al. (2021) Liu, T., Buchner, J., Nandra, K., et al. 2021, A&A [2106.14522]
- Lutz et al. (2010) Lutz, D. et al. 2010, ApJ, 712, 1287
- Magorrian et al. (1998) Magorrian, J. et al. 1998, AJ, 115, 2285
- Małek et al. (2018) Małek, K., Buat, V., Roehlly, Y., et al. 2018, Astronomy & Astrophysics, 620, A50
- Masoura et al. (2021) Masoura, V. A., Mountrichas, G., Georgantopoulos, I., & Plionis, M. 2021, Astronomy & Astrophysics, 646, A167
- Masoura et al. (2018) Masoura, V. A., Mountrichas, G., Georgantopoulos, I., et al. 2018, A&A, 618, 31
- Mountrichas et al. (2021a) Mountrichas, G., Buat, V., Georgantopoulos, I., et al. 2021a, Astronomy & Astrophysics, 653, A70
- Mountrichas et al. (2021b) Mountrichas, G., Buat, V., Yang, G., et al. 2021b, Astronomy & Astrophysics, 646, A29
- Mountrichas et al. (2021c) Mountrichas, G., Buat, V., Yang, G., et al. 2021c, Astronomy & Astrophysics, 653, A74
- Mountrichas et al. (2022) Mountrichas, G., Masoura, V., Xilouris, E., et al. 2022, A&A [arXiv:2203.04949]
- Mullaney et al. (2015) Mullaney, J. R., Alexander, D. M., Aird, J., et al. 2015, Monthly Notices of the Royal Astronomical Society: Letters, 453, L83
- Oesch et al. (2016) Oesch, P. A., Brammer, G., van Dokkum, P. G., et al. 2016, The Astrophysical Journal, 819, 129
- Pouliasis et al. (2020) Pouliasis, E., Mountrichas, G., Georgantopoulos, I., et al. 2020, Monthly Notices of the Royal Astronomical Society, 495, 1853
- Pozzetti et al. (2010) Pozzetti, L. et al. 2010, A&A, 523, 23
- Predehl et al. (2021) Predehl, P., Andritschke, R., Arefiev, V., et al. 2021, Astronomy & Astrophysics, 647, A1
- Rosario et al. (2013) Rosario, D. J., Trakhtenbrot, B., Lutz, D., et al. 2013, Astronomy & Astrophysics, 560, A72
- Rosario et al. (2012) Rosario, D. J. et al. 2012, A&A, 545, 18
- Rovilos et al. (2012) Rovilos, E. et al. 2012, A&A, 546, 16
- Ruiz et al. (2018) Ruiz, A., Corral, A., Mountrichas, G., & Georgantopoulos, I. 2018, Astronomy & Astrophysics, 618, A52
- Salim et al. (2018) Salim, S., Boquien, M., & Lee, J. C. 2018, The Astrophysical Journal, 859, 11
- Salvato et al. (2018) Salvato, M., Buchner, J., Budavári, T., et al. 2018, Monthly Notices of the Royal Astronomical Society, 473, 4937
- Salvato et al. (2009) Salvato, M., Hasinger, G., Ilbert, O., et al. 2009, ApJ, 690, 1250
- Salvato et al. (2021) Salvato, M., Wolf, J., Dwelly, T., et al. 2021, A&A [2106.14520]
- Salvato et al. (2011) Salvato, M. et al. 2011, ApJ, 742, 61
- Santini et al. (2012) Santini, P., Rosario, D. J., Shao, L., et al. 2012, Astronomy & Astrophysics, 540, A109
- Schreiber et al. (2015) Schreiber, C. et al. 2015, A&A, 575, 29
- Shen et al. (2020) Shen, L., Lemaux, B. C., Lubin, L. M., et al. 2020, Monthly Notices of the Royal Astronomical Society, 494, 5374
- Shimizu et al. (2015) Shimizu, T. T., Mushotzky, R. F., Meléndez, M., Koss, M., & Rosario, D. J. 2015, Monthly Notices of the Royal Astronomical Society, 452, 1841
- Shimizu et al. (2017) Shimizu, T. T., Mushotzky, R. F., Meléndez, M., et al. 2017, Monthly Notices of the Royal Astronomical Society, 466, 3161
- Shirley et al. (2021) Shirley, R., Duncan, K., Varillas, M. C. C., et al. 2021, MNRAS, 507, 129
- Shirley et al. (2019) Shirley, R., Roehlly, Y., Hurley, P. D., et al. 2019, Monthly Notices of the Royal Astronomical Society, 490, 634
- Stalevski et al. (2012) Stalevski, M., Fritz, J., Baes, M., Nakos, T., & Popović, L. Č. 2012, Monthly Notices of the Royal Astronomical Society, 420, 2756
- Stalevski et al. (2016) Stalevski, M., Ricci, C., Ueda, Y., et al. 2016, Monthly Notices of the Royal Astronomical Society, 458, 2288
- Sunyaev et al. (2021) Sunyaev, R., Arefiev, V., Babyshkin, V., et al. 2021, A&A [2104.13267]
- Sutherland & Saunders (1992) Sutherland, W. & Saunders, W. 1992, MNRAS, 259, 413
- Wright et al. (2019) Wright, A. H., Hildebrandt, H., Kuijken, K., et al. 2019, Astronomy & Astrophysics, 632, A34
- Wright et al. (2010) Wright, E. L., Eisenhardt, P. R. M., Mainzer, A. K., et al. 2010, AJ, 140, 1868
- Yang et al. (2022) Yang, G., Boquien, M., Brandt, W. N., et al. 2022, A&A [2201.03718]
- Yang et al. (2020) Yang, G., Boquien, M., Buat, V., et al. 2020, Monthly Notices of the Royal Astronomical Society, 491, 740
- Yang et al. (2018) Yang, G., Brandt, W. N., Vito, F., et al. 2018, Monthly Notices of the Royal Astronomical Society, 475, 1887
- Yang et al. (2017) Yang, G., Chen, C. T. J., Vito, F., et al. 2017, ApJ, 842, 72
- Zubovas et al. (2013) Zubovas, K., Nayakshin, S., King, A., & Wilkinson, M. 2013, Monthly Notices of the Royal Astronomical Society, 433, 3079
Appendix A Identification of quiescent systems
In this section, we examine whether our measurements are affected by the method we apply to exclude quiescent systems from the X-ray and galaxy reference catalogues. In our analysis, we exclude such sources based on the sSFR distributions. Specifically, we follow the approach of Mountrichas et al. (2021c, 2022) and select quiescent systems based on the location of a second lower peak in the sSFR distributions. However, this peak is not prominent in our sample, for sources within , and the fraction of quiescent galaxies identified is small.
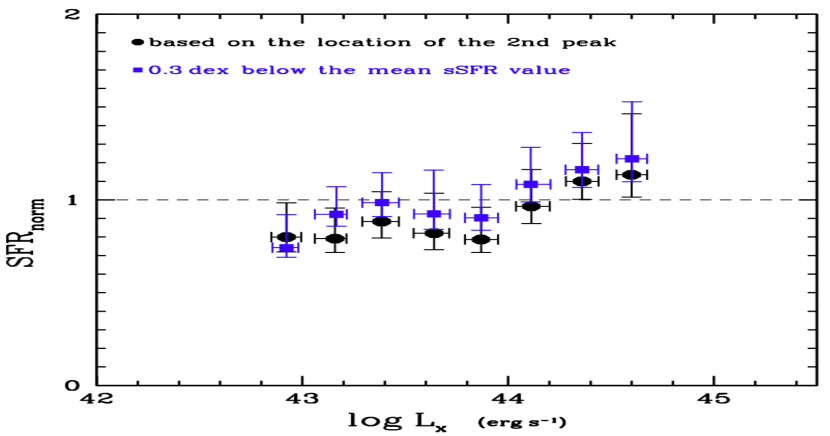
We apply a more strict criterion to exclude quiescent galaxies and examine its effect on our results. Specifically, we reject from our analysis sources that have sSFR that is 0.3 dex below the mean values of the sSFR of galaxies in the reference catalogue. At , we exclude systems with , while at , we exclude sources with . These criteria, identify of the X-ray sources and of the sources in the reference catalogue, as quiescent systems.
We, then, measure the SFRnorn of each X-ray AGN, as described in Sect. 4 and bin the results in LX bins with width 0.25 dex, for the total redshift range spanned by our datasets. The results are presented in Fig. 6. Errors have been estimated, using bootstrap resampling. For comparison, we also plot the measurements from the samples used in our analysis, i.e., excluding quiescent systems based on the location of the lower, second peak of the sSFR distributions. We notice that the results using the more strict criterion to identify quiescent galaxies are slightly higher (by on average ). The difference, though, is marginal, i.e., the results are consistent within the errors of the two measurements. Most importantly, the observed trends are identical between the two results. In detail, SFRnorm is below one at and there is a small increase at higher luminosities, where SFRnorm becomes larger than one. This result shows that the (mild) increase of SFRnorm we observe at high LX is not sensitive to how effectively we remove quiescent systems from our samples.
We conclude, that the method we choose to identify quiescent systems from our X-ray and galaxy reference catalogues does not affect our overall results and conclusions.
Appendix B The effect of the adopted SFH on SFRnorm calculations
In this section, we examine the effectiveness of CIGALE to constrain the age of the stellar populations of AGN and sources in the reference sample and its effect on the SFRnorm measurements. For that purpose, we use the ability of CIGALE to create mock catalogues. These catalogues can be used to assess the validity of a parameter estimation. To create them the algorithm considers the best fit of each source in the dataset. The code uses the best model flux of each galaxy and inserts a noise, extracted from a Gaussian distribution with the same standard deviation as the observed flux. Then the mock data are analysed following the same process as for the data (Boquien et al. 2019).
Based on the results, presented in Fig. 7, CIGALE cannot constrain this parameter. Specifically, the algorithm overestimates the ages of the stellar populations both for the X-ray AGN and the sources in the reference catalogue for stellar ages Myrs and underestimates them for ages Myrs. Furthermore, the parameter measurements are systematically lower in the case of non-AGN systems, at least for stellar ages Myrs. We, also, examine whether these results are susceptible to the selection of the SFH module. For that purpose, we run again CIGALE, both for the X-ray and the galaxy reference catalogue, using a delayed SFH template that allows both an instantaneous recent variation of the SFR upwards (burst) and downwards (quenching; Ciesla et al. 2017; Boquien et al. 2019). The results are not affected by the different SFH module.
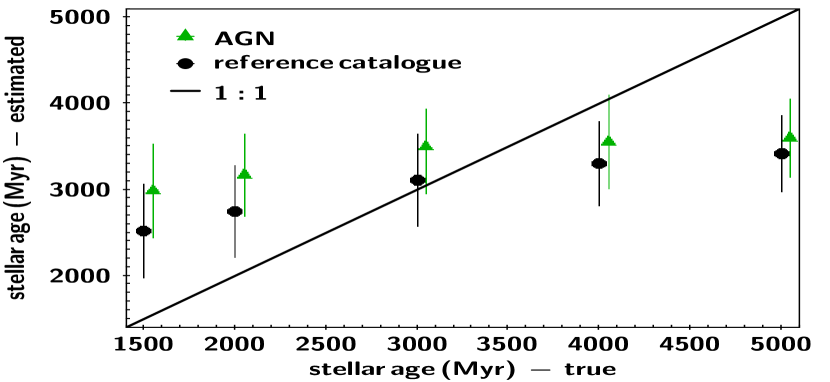
We conclude that, CIGALE cannot effectively constrain the stellar age of the sources. Now, we examine, if and how this affects the SFRnorm calculations. For that purpose, we fix the stellar age of each system to a value that is equal to the age of the universe (in Myrs) at the redshift of the source, minus 10%-15% and rerun CIGALE, both for the AGN and the reference catalogues. This is based on the expectation that the first galaxies started forming stars a few hundred Myr after the big bang (e.g., Oesch et al. 2016).
In Fig. 8, we plot the SFRnorm vs. LX, for the X-ray AGN within , for the two runs. We notice that the trends are similar, i.e., SFRnorm remains constant at and increases at higher LX. However, SFRnorm values are consistently higher, by on average when the stellar age is fixed in the SED fitting process. Both measurements, though, are in statistical agreement and therefore our overall conclusion does not change, i.e., the SFR of X-ray AGN up to is consistent with that of star-forming galaxies, while an increase of SFRnorm is observed at higher LX.