Neural Language Taskonomy: Which NLP Tasks are the most Predictive of fMRI Brain Activity?
Abstract
Several popular Transformer based language models have been found to be successful for text-driven brain encoding. However, existing literature leverages only pretrained text Transformer models and has not explored the efficacy of task-specific learned Transformer representations. In this work, we explore transfer learning from representations learned for ten popular natural language processing tasks (two syntactic and eight semantic) for predicting brain responses from two diverse datasets: Pereira (subjects reading sentences from paragraphs) and Narratives (subjects listening to the spoken stories). Encoding models based on task features are used to predict activity in different regions across the whole brain. Features from coreference resolution, NER, and shallow syntax parsing explain greater variance for the reading activity. On the other hand, for the listening activity, tasks such as paraphrase generation, summarization, and natural language inference show better encoding performance. Experiments across all 10 task representations provide the following cognitive insights: (i) language left hemisphere has higher predictive brain activity versus language right hemisphere, (ii) posterior medial cortex, temporo-parieto-occipital junction, dorsal frontal lobe have higher correlation versus early auditory and auditory association cortex, (iii) syntactic and semantic tasks display a good predictive performance across brain regions for reading and listening stimuli resp.
1 Introduction
Brain encoding aims at constructing neural brain activity given an input stimulus. Since the discovery of the relationship between language stimuli and functions of brain networks using fMRI [for ex., (Constable et al., 2004)], researchers have been interested in understanding how the neural encoding models predict the fMRI brain activity. Several brain encoding models have been developed to (i) understand the ventral stream in biological vision (Yamins et al., 2014; Kietzmann et al., 2019; Bao et al., 2020), and (ii) to study the higher-level cognition like language processing (Gauthier and Levy, 2019; Schrimpf et al., 2021; Schwartz et al., 2019).
Some recent studies Nishida et al. (2015); Huth et al. (2016) have been able to identify brain ROIs (Region of Interest) that respond to words that have a similar meaning and have thus built a “semantic atlas” of how the human brain organizes language. Further, several studies Oota et al. (2018); Jain and Huth (2018); Hollenstein et al. (2019) have used a wide variety of word embeddings where words represented as vectors in an embedding space are mapped to brain activation for improved neural coding.
Recently, Transformer Vaswani et al. (2017) based models like BERT Devlin et al. (2019) have been found to be very effective across a large number of natural language processing (NLP) tasks. These Transformer based models have been pretrained on millions of text instances in an unsupervised manner and further finetuned to specialize for various NLP tasks. Natural language understanding requires integrating several cognitive skills like syntactic parsing of the language structure, identifying the named entities, capturing the word meaning in the context, coreference resolution, etc. Learning from massive corpora enables these models to excel at cognitive skills required for language understanding. Interestingly, such Transformer-based neural representations have been found to be very effective for brain encoding as well Schrimpf et al. (2021).
Despite the recent advances in mapping between language Transformers and the brain activity recorded with reading Schrimpf et al. (2021), the Transformer features themselves are notoriously difficult to interpret. In recent works, Caucheteux et al. (2021a); Antonello et al. (2021) address this issue by disentangling the high-dimensional Transformer representations of language models into four combinatorial classes: lexical, compositional, syntactic, and semantic representations to explore which class is highly associated with language cortical ROIs. Representations do not exist in a vacuum but become meaningful only when they accomplish a task. Therefore, the next logical step is to see which of these Transformer representations most effectively drive the linear mapping between language models and the brain in the context of NLP tasks. Gauthier and Levy (2019) fine-tune a pretrained BERT model on multiple tasks to find tasks best correlated with high decoding performance. In this study, we investigate the correlation between brain activation and feature representations learned by different task-specific networks, and ask which tasks lead to improvements in brain-encoding performance.
Recently, a study using multiple computer vision tasks has shown that 3D vision task models predict better fMRI brain activity than 2D vision task models Wang et al. (2019) for visual stimuli. Inspired by the success of correlations in the vision field Wang et al. (2019), and brain encoding study of a variety of language Transformer models Schrimpf et al. (2021); Caucheteux et al. (2021b, a), we build neural language taskonomy models for brain encoding and aim to find NLP tasks that are most explanatory of brain activations for reading and listening tasks.
In this paper, we uncover insights about the association between fMRI voxel activations and representations of diverse NLP tasks representations. The predictive power of task-specific representations with brain activation is ascertained by (1) using ridge regression on such representations and predicting activations and (2) computing popular metrics like 2V2 accuracy and Pearson correlation between actual and predicted activations.
Specifically, we make the following contributions in this paper.
-
•
Given Transformer models finetuned for various NLP tasks, we propose the problem of finding which of these are the most predictive of fMRI brain activity for reading and listening tasks.
-
•
Our language taskonomy results reveal that Coreference Resolution, Named Entity Recognition, and Shallow Syntax Parsing tasks have higher predictive performance while reading the text. On the other hand, paraphrase detection, summarization, and Natural Language Inference tasks display better correlation during listening.
-
•
We also perform similarity analysis between task representations from transfer learning and neural taskonomy and derive interesting cognitive insights from brain maps.
2 Related Work
Older methods for text-based stimulus representation include text corpus co-occurrence counts Mitchell et al. (2008); Pereira et al. (2013); Huth et al. (2016), syntactic and discourse features Wehbe et al. (2014). In recent times, both semantic and experiential attribute models have been explored for text-based stimuli. Semantic representation models include distributed word embeddings Pereira et al. (2016); Anderson et al. (2017a); Pereira et al. (2018); Toneva and Wehbe (2019); Hollenstein et al. (2019); Wang et al. (2020), sentence representation models Sun et al. (2019); Toneva and Wehbe (2019); Sun et al. (2020), recurrent neural networks Jain and Huth (2018); Oota et al. (2019), and Transformer-based language models Gauthier and Levy (2019); Toneva and Wehbe (2019); Schwartz et al. (2019); Oota et al. (2022a, b). Experiential attribute models represent words in terms of human ratings of their degree of association with different attributes of experience, typically on a scale of 0-6 Anderson et al. (2019, 2020); Berezutskaya et al. (2020); Jat et al. (2020); Caucheteux et al. (2021a); Antonello et al. (2021) or binary Handjaras et al. (2016); Wang et al. (2017). Fine-grained details such as lexical, compositional, syntactic, and semantic representations of narratives are factorized from Transformer-based models and utilized for training encoding models. The resulting models are better able to disentangle the corresponding brain responses in fMRI Caucheteux et al. (2021a).
In this paper, we focus on Transformer-based linguistic stimuli representations since they have been found to be most effective. Unlike previous studies which directly used existing task-agnostic pretrained models, we train task-specific Transformer models and aim to find which model leads to the best encoding accuracy given reading and listening language stimuli.
3 Brain Imaging Datasets
We work with two datasets: Pereira and Narratives-Pieman. Results on Narratives-Lucy and Narratives-SlumLord show similar trends. Hence, we also show results on Narratives-Lucy and Narratives-SlumLord in the appendix.
Pereira Dataset (Reading Sentences from Passages) For the Pereira dataset, similar to earlier work Sun et al. (2019, 2020), we combine the data from sentence-based experiments (experiments-2 and 3) from Pereira et al. (2018). Five subjects were presented a total of 627 sentences from 48 broad topics, spanning over 168 passages, where each passage consists of 3-4 sentences. As in Pereira et al. (2018), we focused on nine brain ROIs (regions of interest) corresponding to four brain networks: (i) Default Mode Network (DMN) (linked to the functionality of semantic processing), (ii) Language Network (related to language processing, understanding, word meaning, and sentence comprehension), (iii) Task Positive Network (TP) (related to attention, salience information), and (iv) Visual Network (related to the processing of visual objects, object recognition). We briefly summarize the details of the dataset and the number of voxels corresponding to each ROI in Table 1. We use the AAL parcellation Atlas (116 116 brain ROIs) to present the brain map results, since Pereira dataset contains annotations tied to this atlas.
| ROIs | Language | Vision | DMN | Task Positive | |||||
|---|---|---|---|---|---|---|---|---|---|
| Subj | LH | RH | Body | Face | Object | Scene | Vision | RH | LH |
| P01 | 5265 | 6172 | 3774 | 4963 | 8085 | 4141 | 12829 | 17190 | 35120 |
| M02 | 4930 | 5861 | 3873 | 4782 | 7552 | 3173 | 11729 | 15070 | 30594 |
| M04 | 5906 | 5401 | 3867 | 4803 | 7812 | 3602 | 12278 | 18011 | 34024 |
| M07 | 5629 | 5001 | 4190 | 4993 | 8617 | 3721 | 12454 | 17020 | 30408 |
| M15 | 5315 | 6141 | 4112 | 4941 | 8323 | 3496 | 12383 | 15995 | 31610 |
| ROIs | EAC | AAC | PMC | TPOJ | DFL | |||||
|---|---|---|---|---|---|---|---|---|---|---|
| LH | RH | LH | RH | LH | RH | LH | RH | LH | RH | |
| # Voxels | 808 | 638 | 1420 | 1493 | 1198 | 1204 | 847 | 1188 | 1061 | 875 |
Narratives-Pieman (Listening to Stories) The “Narratives” collection aggregates a variety of fMRI datasets collected while human subjects listened to naturalistic spoken stories. The Narratives dataset that includes 345 subjects, 891 functional scans, and 27 diverse stories of varying duration totaling 4.6 hours of unique stimuli (43,000 words) was proposed in Nastase et al. (2021). Similar to earlier works Caucheteux et al. (2021b), we analyze data from 82 subjects listening to the story titled ‘PieMan’ with 259 TRs (repetition time – fMRI recorded every 1.5 sec.). We list number of voxels per ROI in this dataset in Table 2. We use the multi-modal parcellation of the human cerebral cortex (Glassar Atlas: consists of 180 ROIs in each hemisphere) to display the brain maps Glasser et al. (2016), since Narratives dataset contains annotations tied to this atlas. The data covers ten brain ROIs in the human brain, i.e., Left hemisphere (L), and Right hemisphere (R) for each of the following: (i) early auditory cortex (EAC: A1, LBelt, MBelt, PBelt, and R1) which plays a key role for sound perception since it represents one of the first cortical processing stations for sounds; (ii) auditory association cortex (AAC: A4, A5, STSdp, STSda, STSvp, STSva, STGa, and TA2) which is concerned with the memory and classification of sounds; (iii) posterior medial cortex (PMC: POS1, POS2, v23ab, d23ab, 31pv, 31pd, 7m); (iv) the temporo parieto occipital junction (TPOJ: TPOJ1, TPOJ2, TPOJ3, STV, PSL) which is a complex brain territory heavily involved in several high-level neurological functions, such as language, visuo-spatial recognition, writing, reading, symbol processing, calculation, self-processing, working memory, musical memory, and face and object recognition; and (v) the dorsal frontal lobe (DFL: L_55b, SFL, L_44, L_45, IFJA, IFSP) which covers the aspects of pragmatic processing such as discourse management, integration of prosody, interpretation of nonliteral meanings, inference making, ambiguity resolution, and error repair.
4 Encoding Model
To explore how and where contextual language features are represented in the brain when reading sentences and listening to stories, we extract different features spaces describing each stimulus sentence and use them in an encoding model to predict brain responses. Our reasoning is as follows. If a feature is a good predictor of a specific brain region, information about that feature is likely encoded in that region. In this paper, for both datasets, we train fMRI encoding models using Ridge regression on stimuli representations obtained using a variety of NLP tasks. The main goal of each fMRI encoder model is to predict brain responses associated with each brain region given a stimuli. In all cases, we train a model per subject separately. Following literature on brain encoding Caucheteux et al. (2021b); Toneva et al. (2020), we choose to use a ridge regression model instead of more complicated models. We plan to explore more such models as part of future work. We follow K-fold (K=10) cross-validation. All the data samples from K-1 folds were used for training, and the model was tested on samples of the left-out fold. We used sklearn’s ridge-regression with default parameters, 10-fold cross-validation, Stochastic-Average-Gradient Descent Optimizer, Huggingface for Transformer models, MSE loss function, and L2-decay () as 1.0. We used BERT Word-Piece tokenizer for the linguistic Transformer input. All experiments were conducted on a machine with 1 NVIDIA GEFORCE-GTX GPU with 16GB GPU RAM. We make the code publicly available111https://tinyurl.com/langTask.
4.1 Feature Spaces
To simultaneously test representations from multiple NLP tasks, we used the latent space features from each of the following ten popular NLP tasks: coreference resolution (CR), named entity recognition (NER), natural language inference (NLI), paraphrase detection (PD), question answering (QA), sentiment analysis (SA), semantic role labeling (SRL), shallow syntax parsing (SS), summarization (Sum) and word sense disambiguation (WSD). All of these are discriminative NLP tasks, and thus we use models obtained by task-specific finetuning of the same pretrained Transformer encoder model (BERT-base-cased with dimensionality=768). Given an input sentence, each task Transformer outputs token representations at the final layer. We use the #tokens 768 dimension vector obtained from the last hidden layer to obtain latent features for the stimuli. We then build individual ridge regression models with the extracted latent features to predict brain responses and measure the correlation between the prediction and the true response.
Pereira: Since individual sentences were presented to the subjects while modeling, sentences were passed one by one to the task Transformer model, and average-pooled representations were used to encode the sentence stimuli.
Narratives-Pieman: Due to the constraint on input sequence length for BERT (512), we considered a window size of 10 sentences with the last two sentences of one window overlapping with the next to be given as input to the BERT model. We use the average-pooled representation from BERT to encode text stimuli. To get the representation for a TR, we pooled the representations of only those words of the sentences in that TR.
4.2 Task Descriptions
Here we describe the functionality of each NLP task that we used for fMRI encoding. CR: involves finding all expressions that refer to the same entity in a text. PD: involves taking a passage – either spoken or written – and rewording it in shorter or own words. Summarization (Sum): involves selecting a few important sentences from a document or paragraph. NER: involves detection of the named entities such as person names, location names, company names from a given text. NLI: investigates the entailment relationship between two texts: premise and hypothesis. QA: aims to select an answer given a passage, a question, and a set of candidate answers. SA: involves determining whether a piece of text is positive, negative, or neutral. SRL: assigns labels to words or phrases in a sentence that indicates their semantic role in the sentence, such as that of an agent, goal, or result. SS: provides an approximation of phrase-syntactic structure of sentences. WSD: involves determining which sense (meaning) of a word is activated by the use of the word in a particular context.
Syntactic reasoning is rather shallow compared to deep semantic reasoning. Syntactic reasoning follows somewhat objective grammar rules. Comparatively semantic reasoning is often subjective in nature and complex. The emerging evidence from fMRI studies Fedorenko et al. (2020, 2012) also points out that processing of both syntax and semantics is distributed in the brain and it is only when violations of these processes are probed, we see localization of function Friederici et al. (2003). Thus, in this work, we explore syntactic and semantic tasks separately. Of the above mentioned tasks, NER and SS are syntactic, while the others involve semantic reasoning.
Our selection of these tasks was based on the following design principles: (1) We wanted to select a set of tasks covering diverse cognitive-linguistic skills. (2) We wanted to select tasks that are a part of popular NLP benchmarks like GLUE Wang et al. (2018). (3) We selected tasks for which BERT-base-cased finetuned models were available. Note that we did not finetune any of these models ourselves but leveraged the state-of-the-art finetuned models available on Huggingface. Details of the specific finetuned model checkpoints are mentioned in Table 3 in the Appendix.
4.3 Evaluation Metrics
We evaluate our models using popular brain encoding evaluation metrics described in the following. Given a subject and a brain region, let be the number of samples. Let and denote the actual and predicted voxel value vectors for the sample. Thus, and where is the number of voxels in that region.
2V2 Accuracy is computed as 2V2Acc= where is the cosine distance function. is an indicator function such that if is true, else it is 0. The higher the 2V2 accuracy, the better.
Pearson Correlation (PC) is computed as PC= where corr is the correlation function.
Mean Absolute Error (MAE) is computed as MAE=.
Statistical Significance: In order to estimate the statistical significance of the performance differences (across all results), we performed one-way ANOVA on the mean values for the subjects. In all such cases we report p-values corrected using Bonferroni correction.
4.4 Neural Language Tasks Similarity Computation
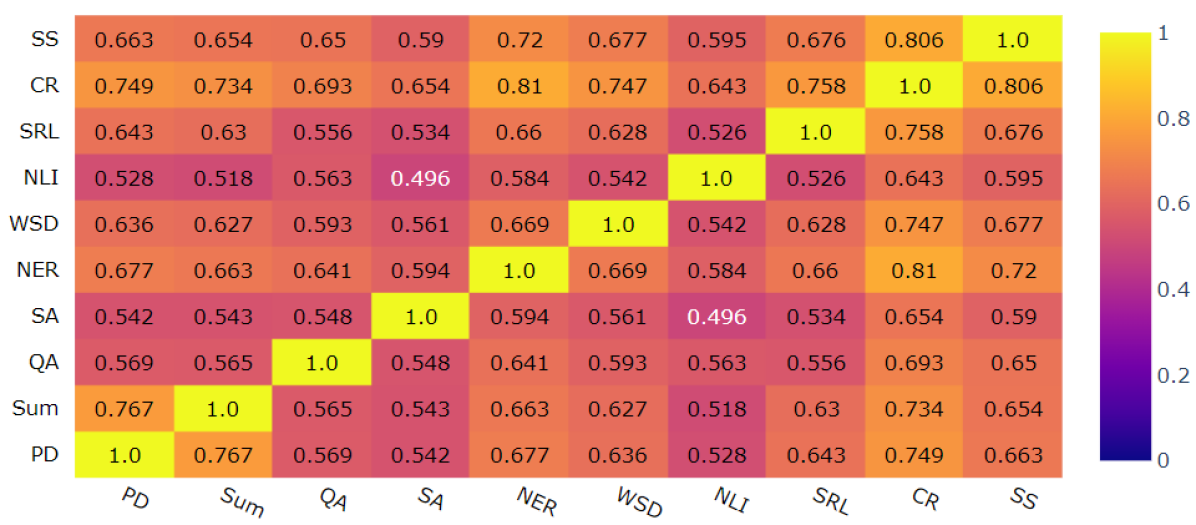
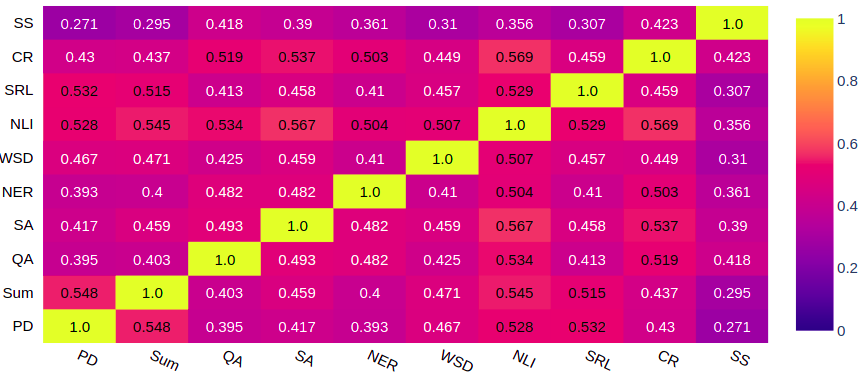
To estimate the similarity between 10 language tasks, we took the prediction performance scores across all the voxels in Pereira (97,539) and Narratives-Pieman datasets (10,732). To analyze the relationship between tasks based on neural representations, we calculated the Pearson correlation between predicted voxels of each task with the remaining tasks. These Pearson correlation values were used to construct heatmaps and the task similarity trees(dendograms) using hierarchical clustering for Pereira and Narratives-Pieman datasets.
5 Results
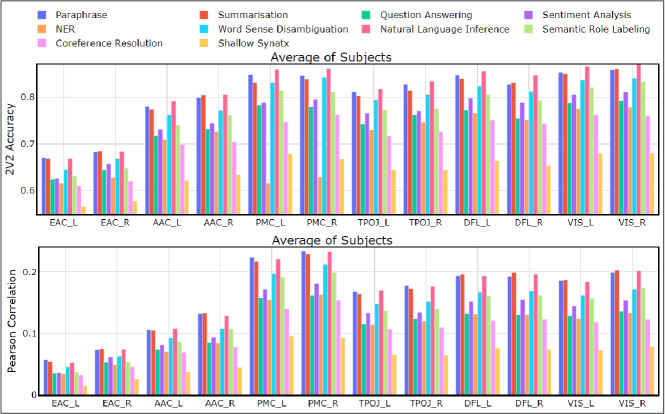
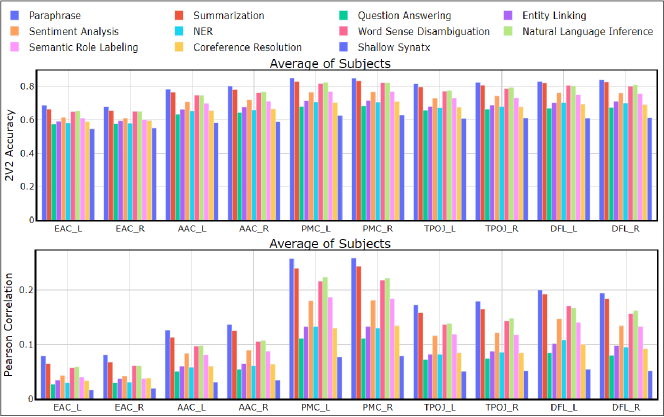
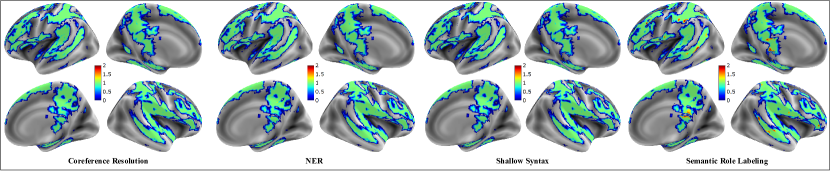
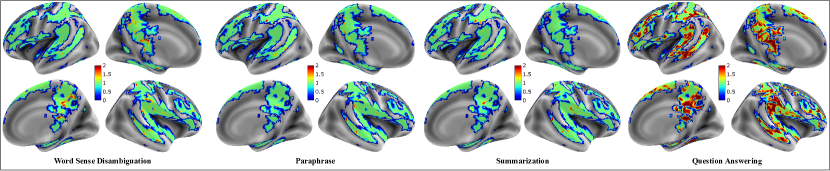
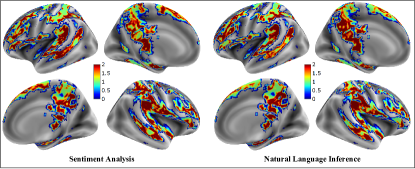
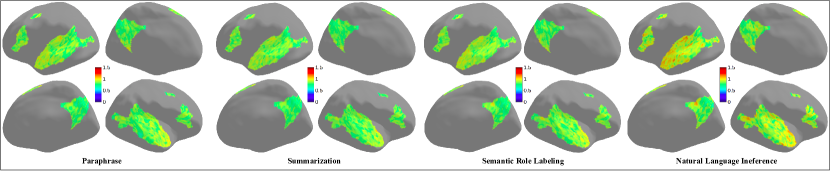
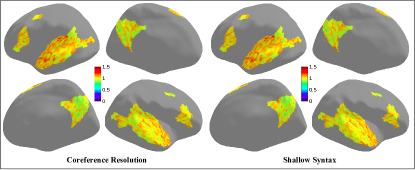
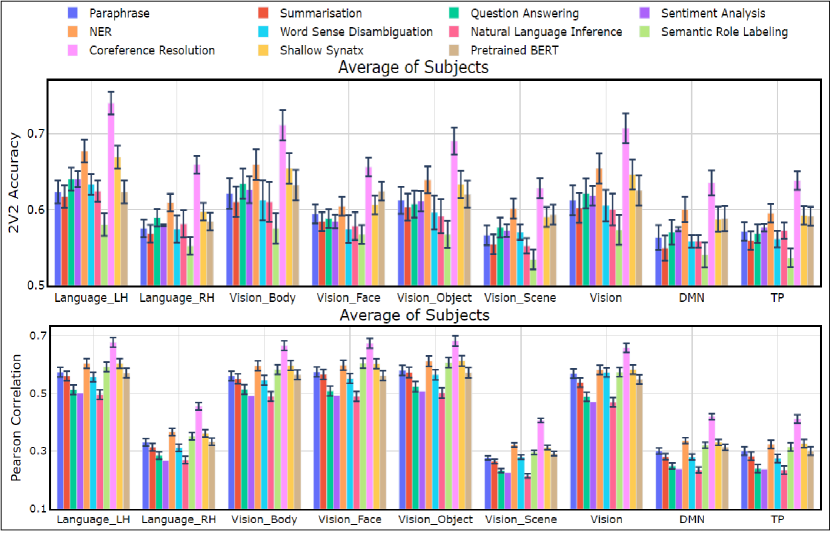
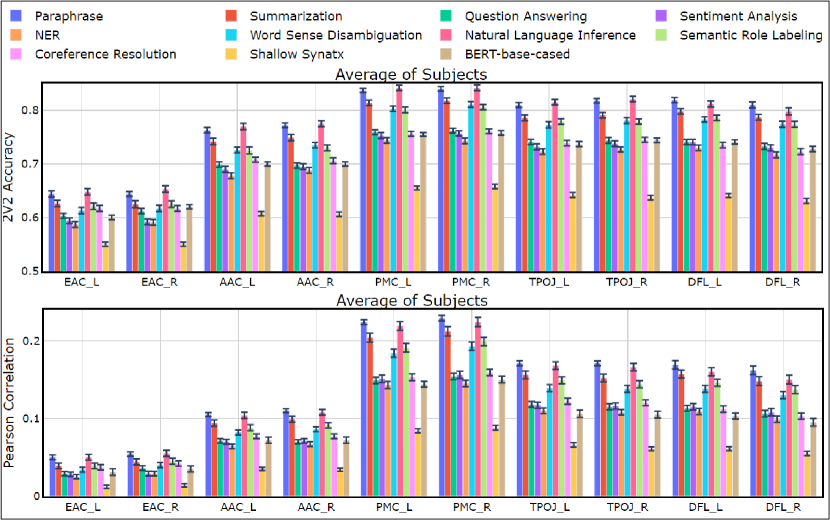
In order to assess the performance of the fMRI encoder models learned using the representations from a variety of NLP tasks, we computed the 2V2 accuracy and Pearson correlation coefficient between the predicted and true responses across various ROIs for both the reading (Pereira) dataset (Fig. 1) as well as the listening (Narratives-Pieman) dataset (Fig. 2).
5.1 Encoding performance of Language Task models for reading vs listening tasks
Reading Sentences (Pereira): From Fig. 1, we observe that tasks such as CR, NER, SRL, and SS appear to have a better correlation to the brain responses compared to the other tasks. In order to estimate the statistical significance of the performance differences, we performed one-way ANOVA on the mean correlation values for the subjects across the ten language tasks for the nine brain ROIs. The main effect of the ANOVA test was significant for all the ROIs with p with confidence 95% (see Appendix for detailed ANOVA results). Further, post hoc pairwise comparisons Ruxton and Beauchamp (2008) confirmed the visual observations that on both 2V2 accuracy and Pearson correlation measures, tasks such as CR, NER, SRL, and SS performed significantly better compared to other tasks (see Appendix for pairwise comparison results). These results demonstrate that when reading a sentence, information processing operations related to recognizing named entities, labeling semantic roles to the constituents of a sentence, identifying the references from a sentence to the given topic (concept), and syntactic processing may be engaged.
Further, we observe that the ROI corresponding to language processing in the left hemisphere (Language_LH) has higher encoding performance than that of the right hemisphere (Language_RH). This is in line with the left hemisphere dominance for language processing Binder et al. (2009). Also, lateral visual ROIs such as Vision_Object, Vision_Body, Vision_Face, and Vision ROIs display higher correlation with the language tasks associated with named entities (NER), relating the entities (CR), and syntax processing (SS). Higher correlations with all the visual brain regions point to the possible alignment of visual and language regions for semantic understanding Popham et al. (2021) in a reading task. Finally, across all regions, pretrained BERT model has worse correlation compared to at least 5 other task models.
Listening Stories (Narratives-Pieman): From Fig. 2, we observe that the profiles of performance show low scores in the early auditory cortex (EAC), auditory association cortex (AAC); average scores in TPOJ and DFL; and superior scores in PMC. This aligns with the known language hierarchy for spoken language understanding Nastase et al. (2020). Tasks such as PD, Summarization, and NLI seem to yield better performance in predicting the brain responses than the other NLP tasks across all the ROIs. These Pearson correlation () results are comparatively much higher compared to those obtained using pretrained (task-agnostic) GPT2 model in Caucheteux et al. (2021a) ( ranging from ). As shown in Fig. 2, our method obtains much higher correlations ( ranging from ). Similar to the Pereira dataset, we estimate the statistical significance of the performance differences using the one-way ANOVA test. The main effect of task was significant for all the ROIs with p with confidence 95% (see Appendix for detailed ANOVA results). Also, Post hoc pairwise comparisons Ruxton and Beauchamp (2008) revealed that on both 2V2 accuracy and Pearson correlation measures, tasks such as PD, Sum, and NLI performed significantly better compared to other tasks (see Appendix for pairwise comparison results).
Further, from Fig. 2, we see that the bilateral posterior medial cortex (PMC) associated with higher language function exhibits a higher correlation among all the brain ROIs. ROIs, including bilateral TPOJ and bilateral DFL, yield higher correlations with the five NLP tasks, which is in line with the language processing hierarchy in the human brain. Finally, across all regions, pretrained BERT model has worse correlation compared to at least 5 other task models.
In summary, different and distinct language Taskonomy features seem to be related to the encoding performance in reading versus listening tasks. CR, NER, SRL, and SS perform better for reading. PD, Sum, and NLI perform better for listening. While listening the subject is cognitively more involved in the activity compared to reading Buchweitz et al. (2009). Thus, it makes sense that shallow tasks like NER and SS are useful for reading while more complex NLP tasks like PD, Sum and NLI are effective for encoding listening stimuli.
5.2 Language Task Similarity Computation
Pearson correlation values between predicted responses for each pair of tasks were used to construct the similarity matrix with heatmap for both Pereira and Narratives-Pieman datasets, as shown in Figs. 3 and 4. We observe that the following task pairs are highly correlated for the Pereira dataset: (NER and CR), (SS and CR) and (PD and Sum). Also these task pairs are highly correlated for the Narratives-Pieman dataset: (CR and NLI), (NLI and SA) and (PD and Sum). Similarities are relatively higher for Narratives-Pieman compared to the Pereira dataset. Surprisingly, the (NLI, SA) pair has lowest similarity for Pereira (reading) and close to highest in Narratives-Pieman (listening). We hypothesize that this is because sentiment is best conveyed while the subject is listening.
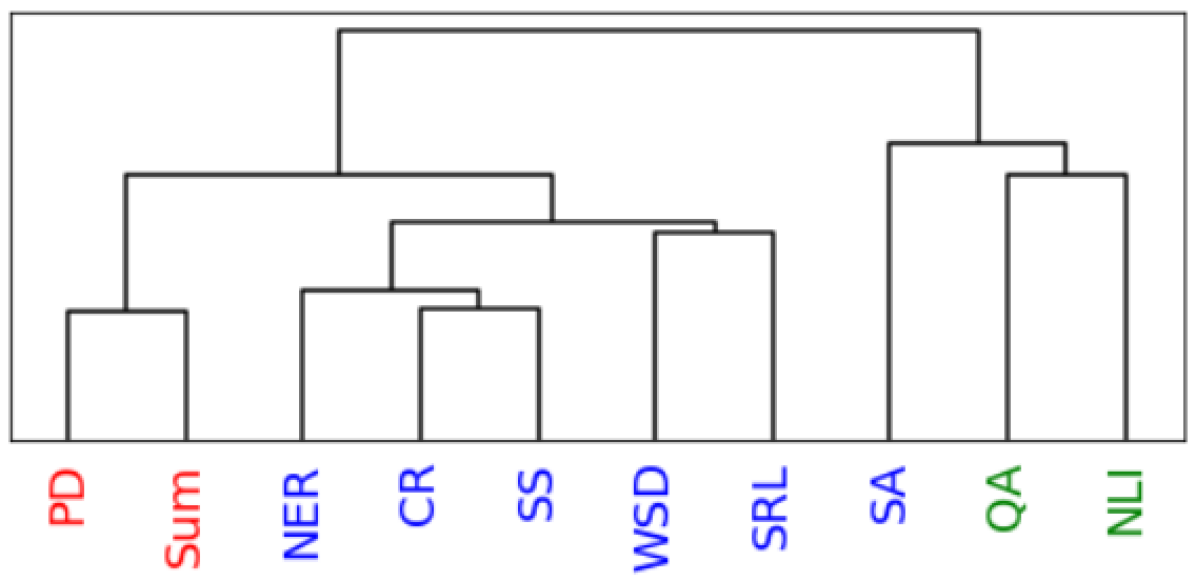
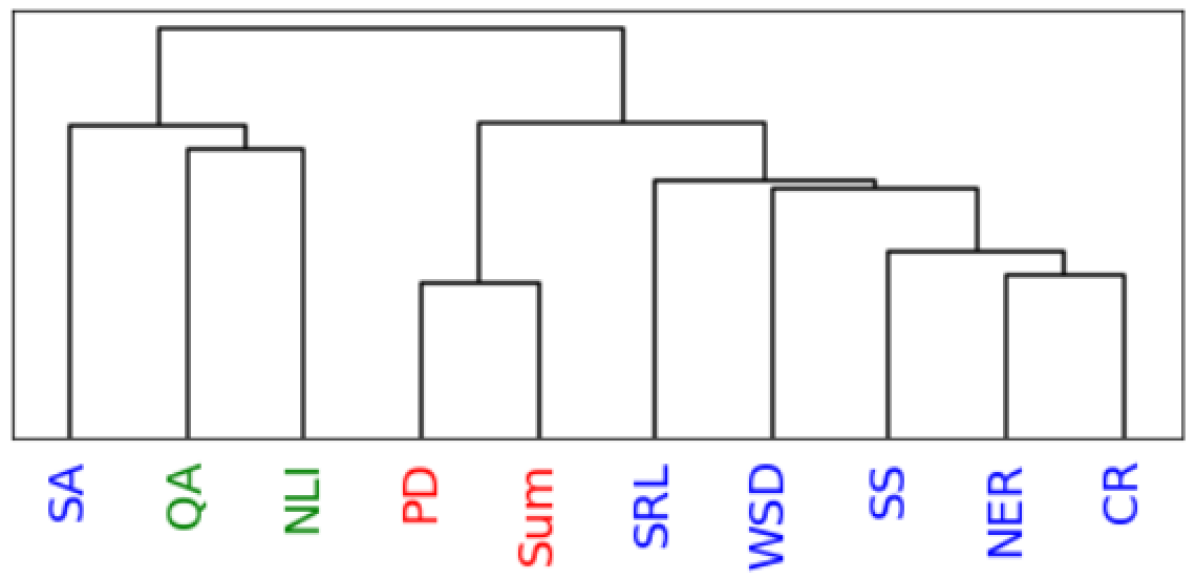
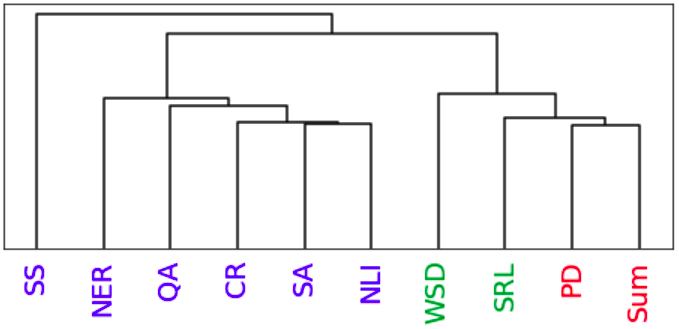
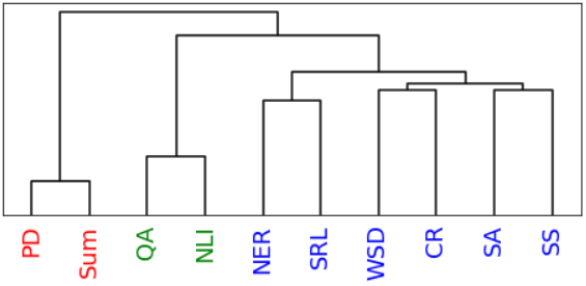
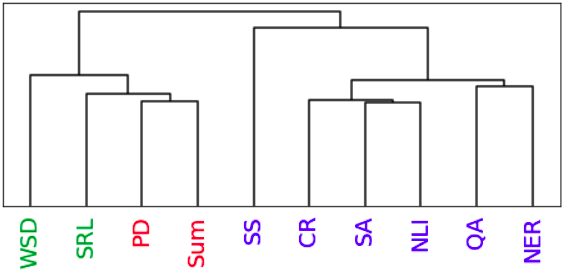
Reading sentences (Pereira): The stimulus sentences from the Pereira dataset were fed as input to each of the 10 task Transformers. The similarity among the resulting representations was analyzed using hierarchical clustering, and the clusters are visualized as dendrograms in Fig. 5 (left). We observe that the tasks are clustered into three groups denoted using red, green, and blue colors. Next, we wished to check if similar task grouping is observed on brain activations predicted by ridge regression trained on task-specific representations. Hence, similar clustering analysis was conducted on the neural space representations, and the clusters are visualized as dendrograms in Fig. 5 (right) across all subjects. Interestingly, the tree derived from brain representation also shows a similar distribution of tasks across the three groups. Similar dendrograms for individual subjects are illustrated in Appendix-Fig. 11.
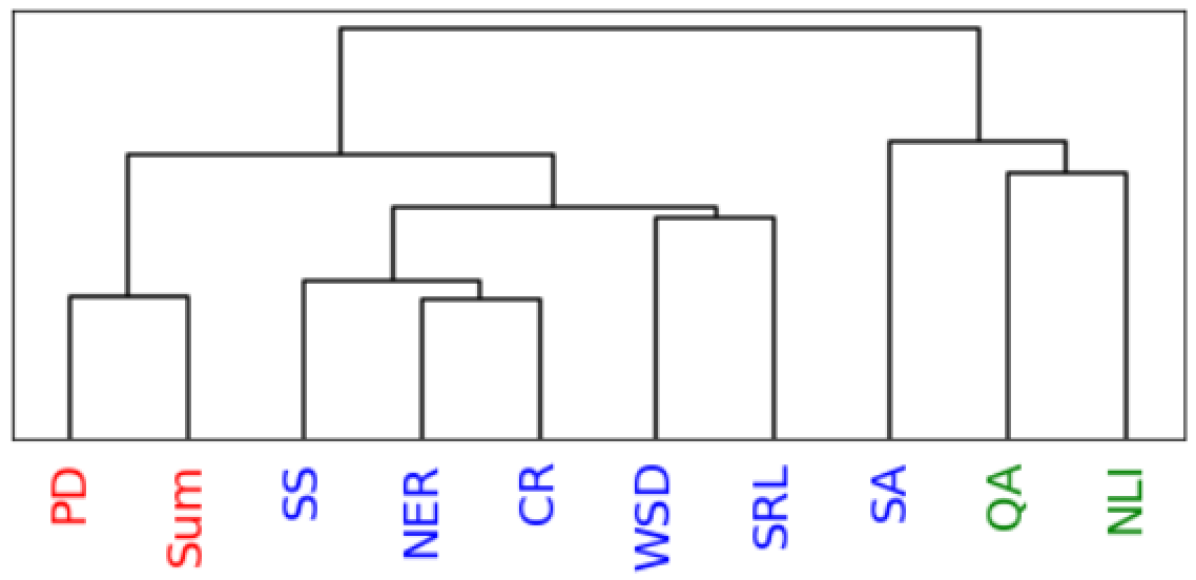
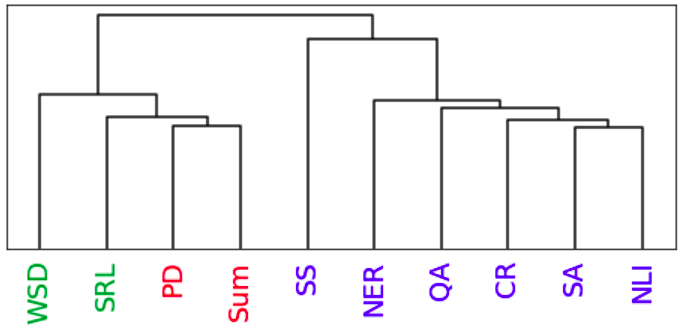
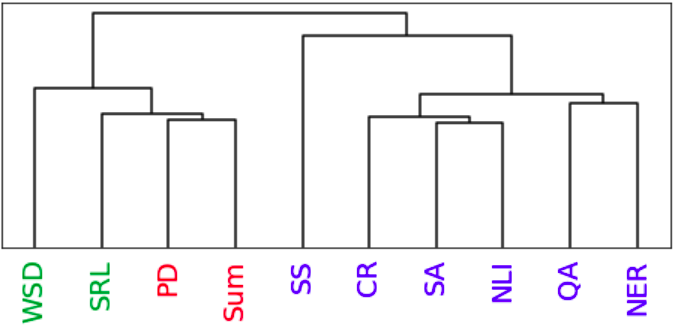
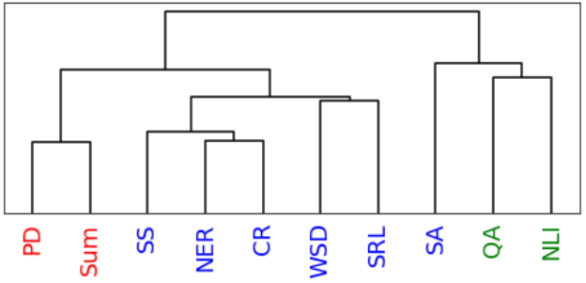
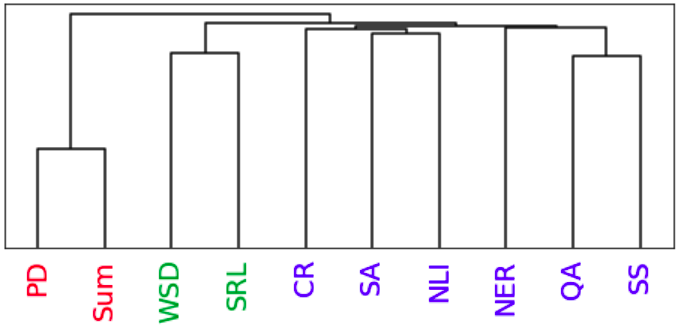
Listening Stories (Narratives-Pieman): Fig. 6 compares the task similarity tree based on the patterns from the pretrained task Transformers, with the task similarity tree generated based on similarity in brain response prediction performance averaged across all subjects. We observe that the tasks are clustered into three groups denoted using red, green, and blue colors. Again, the tree derived from brain representation also shows a similar distribution of tasks across the three groups. Dendrograms for individual subjects are in the Appendix-Fig. 12.
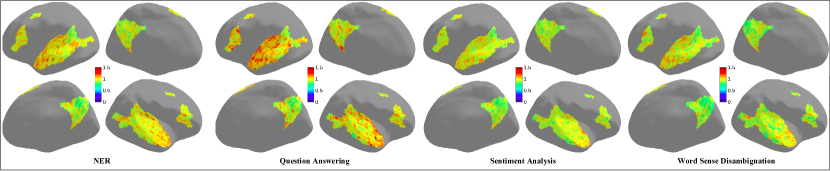
5.3 Brain maps for whole brain predictions
The mean absolute error (MAE) between predictive and actual responses is obtained using individual task features from the taskonomy. MAE values are obtained for all the voxels in the brain for both the reading (Fig. 7) and listening datasets (Fig. 8).
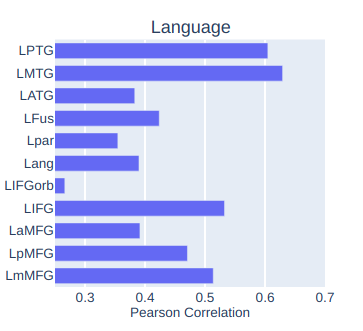
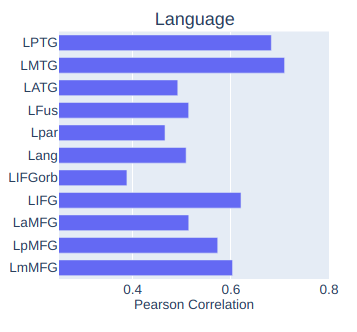
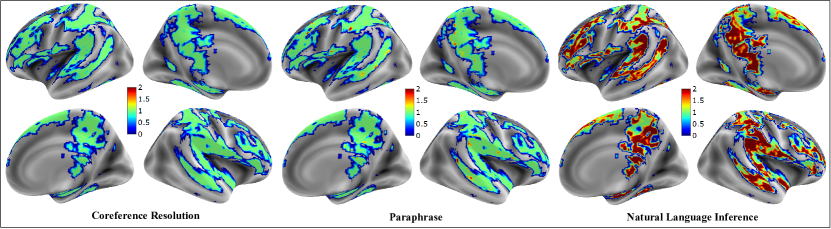
In the reading task, we observe from Fig. 7 that CR has lower MAE compared to PD which in turn has lower MAE compared to the NLI task (brain maps for the other tasks are reported in Fig. 17 in the Appendix). Overall, for the reading stimuli, tasks such as NLI, QA, and SA display higher MAE values. To further investigate which sub ROIs (LPTG, LMTG, LATG, LFus, Lpar, Lang, LIFGorb, LIFG, LaMFG, LpMFG, and LmMFG) of the Language network are related to the predictive task features, we train encoding models for all the sub ROIs for the best encoding task, i.e., for the CR task (see Fig. 14 in Appendix). We notice that both LMTG (middle temporal gyrus) and LPTG (posterior temporal gyrus) are more accurately predicted than the other sub ROIs. On the other hand, LIFG-orb displays a lower Pearson correlation for the CR task. The presence of superior encoding information in the ROIs in the temporal gyrus as compared to those in the inferior frontal gyrus seems to mirror similar observations seen in decoder performance Anderson et al. (2017b).
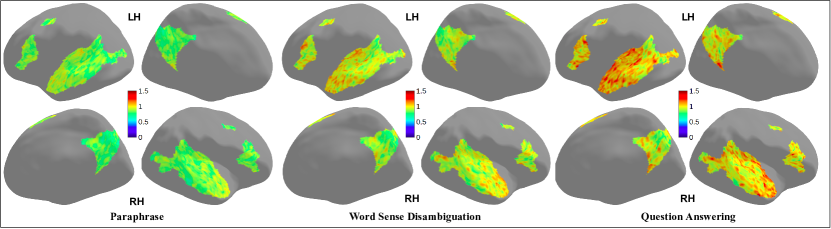
On the other hand, in the listening task, we observe from Fig. 8 that Paraphrase and WSD display lower MAE values compared to QA task (brain maps for the other tasks are reported in Fig. 18 in the Appendix). Taken together, for listening stimuli, tasks such as NER, QA, SA, CR, and SS display higher MAE values. From Fig. 8, we see that ROIs such as EAC and AAC have higher MAE compared to PMC and TPOJ brain ROIs.
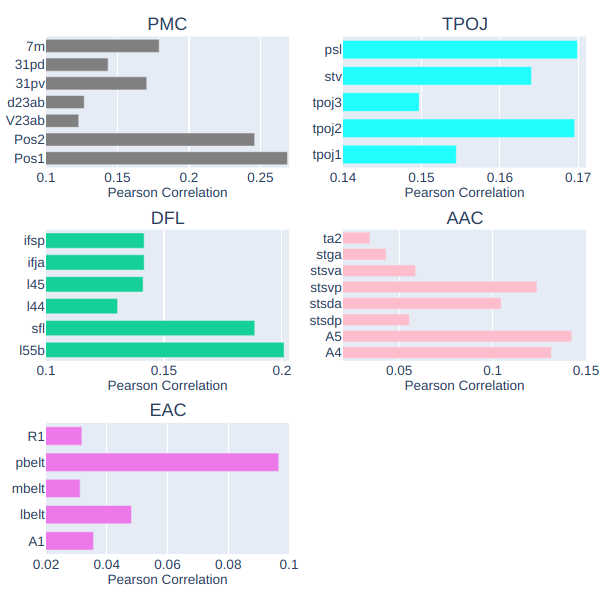
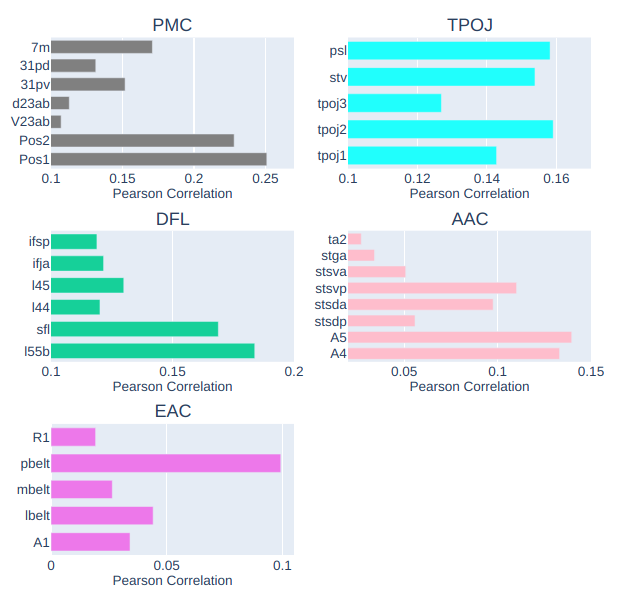
We further demonstrate the prediction performance of the encoder model trained on sub ROIs for the paraphrase task in Fig. 15 in the Appendix. It can be observed that sub ROIs such as Pos1 and Pos2 have a higher Pearson correlation than other sub ROIs of the PMC region. Both sfl and l55b display a higher correlation among all the sub ROIs for the DFL ROI. However, all the sub ROIs in the TPOJ yield higher correlation, as shown in Fig. 15. The control and attention ROIs in the posterior cingulate cortex (for ex., POS1 in PMC), together with the superior frontal language region (sfl in DFL) and TPOJ, are part of the well-known language network associated with narrative comprehension Nastase et al. (2020), and it is heartening to see that task features from PD task also relate to semantic analysis of the ongoing narrative.
5.4 Discussion
(1) We used a ridge regression model instead of more complicated models for encoding. We believe that more complex models can lead to further exciting insights. (2) We experimented with 10 NLP tasks. Models can be pretrained for more such tasks to check if other tasks are better predictive of voxel activations. (3) We leveraged models finetuned using datasets of different sizes across tasks. While a fair comparison of dataset sizes across tasks is impossible, we understand that this could have resulted in some bias in our results. (4) We used a different dataset for reading vs listening. While we believe that the differences in task-specific model performances across reading and listening are mainly due to the learned stimulus representations, but they could also arise from other factors such as experimental conditions, the text domain of the stimuli or number of voxels, etc. (5) On Natural Language Understanding tasks such as NLI, SA, QA and PD, Gauthier and Levy (2019) observed that scrambled sentence representations gave better decoding performance. But encoding models (especially for the listening task), scrambled order would be detrimental to making sense of what is being heard. It is an interesting future task to see if the opposite result is seen in the case of brain encoding models. It is plausible that brain uses encoding models in a flexible way when it comes to decoding Kriegeskorte and Douglas (2019). Kriegeskorte and Douglas (2019) mention that “Decoding models can help reveal whether particular information is present in a brain region in a format the decoder can exploit. Encoding models make comprehensive predictions about representational spaces.” In this sense, results of current work are not directly comparable to those of Gauthier and Levy (2019).
6 Conclusion
In this paper, we studied the effectiveness of task specific NLP models for brain encoding. We observe that building individual encoding models and exploiting existing relationships among models can provide a more in-depth understanding of the neural representation of language information. Our experiments on Pereira and Narrative datasets lead to interesting cognitive insights.
7 Ethical Statement
We reused publicly available datasets for this work: Pereira and Narratives. We did not collect any new dataset.
Pereira dataset can be downloaded from https://osf.io/crwz7/. Please read their terms of use222https://github.com/CenterForOpenScience/cos.io/blob/master/TERMS_OF_USE.md for more details.
Narratives dataset can be dowloaded from https://datasets.datalad.org/?dir=/labs/hasson/narratives. Please read their terms of use333https://datasets.datalad.org/labs/hasson/narratives/stimuli/README for more details.
We do not foresee any harmful uses of this technology.
References
- Anderson et al. (2017a) Andrew J Anderson, Douwe Kiela, Stephen Clark, and Massimo Poesio. 2017a. Visually grounded and textual semantic models differentially decode brain activity associated with concrete and abstract nouns. Transactions of the Association for Computational Linguistics, 5:17–30.
- Anderson et al. (2017b) Andrew James Anderson, Jeffrey R Binder, Leonardo Fernandino, Colin J Humphries, Lisa L Conant, Mario Aguilar, Xixi Wang, Donias Doko, and Rajeev DS Raizada. 2017b. Predicting neural activity patterns associated with sentences using a neurobiologically motivated model of semantic representation. Cerebral Cortex, 27(9):4379–4395.
- Anderson et al. (2019) Andrew James Anderson, Jeffrey R Binder, Leonardo Fernandino, Colin J Humphries, Lisa L Conant, Rajeev DS Raizada, Feng Lin, and Edmund C Lalor. 2019. An integrated neural decoder of linguistic and experiential meaning. Journal of Neuroscience, 39(45):8969–8987.
- Anderson et al. (2020) Andrew James Anderson, Kelsey McDermott, Brian Rooks, Kathi L Heffner, David Dodell-Feder, and Feng V Lin. 2020. Decoding individual identity from brain activity elicited in imagining common experiences. Nature communications, 11(1):1–14.
- Antonello et al. (2021) Richard Antonello, Javier Turek, Vy Vo, and Alexander Huth. 2021. Low-dimensional structure in the space of language representations is reflected in brain responses. arXiv preprint arXiv:2106.05426.
- Bao et al. (2020) Pinglei Bao, Liang She, Mason McGill, and Doris Y Tsao. 2020. A map of object space in primate inferotemporal cortex. Nature, 583(7814):103–108.
- Berezutskaya et al. (2020) Julia Berezutskaya, Zachary V Freudenburg, Luca Ambrogioni, Umut Güçlü, Marcel AJ van Gerven, and Nick F Ramsey. 2020. Cortical network responses map onto data-driven features that capture visual semantics of movie fragments. Scientific reports, 10(1):1–21.
- Binder et al. (2009) Jeffrey R Binder, Rutvik H Desai, William W Graves, and Lisa L Conant. 2009. Where is the semantic system? a critical review and meta-analysis of 120 functional neuroimaging studies. Cerebral cortex, 19(12):2767–2796.
- Buchweitz et al. (2009) Augusto Buchweitz, Robert A Mason, Lêda Tomitch, and Marcel Adam Just. 2009. Brain activation for reading and listening comprehension: An fmri study of modality effects and individual differences in language comprehension. Psychology & neuroscience, 2(2):111–123.
- Caucheteux et al. (2021a) Charlotte Caucheteux, Alexandre Gramfort, and Jean-Remi King. 2021a. Disentangling syntax and semantics in the brain with deep networks. In International Conference on Machine Learning, pages 1336–1348. PMLR.
- Caucheteux et al. (2021b) Charlotte Caucheteux, Alexandre Gramfort, and Jean-Rémi King. 2021b. Model-based analysis of brain activity reveals the hierarchy of language in 305 subjects. arXiv preprint arXiv:2110.06078.
- Constable et al. (2004) R Todd Constable, Kenneth R Pugh, Ella Berroya, W Einar Mencl, Michael Westerveld, Weijia Ni, and Donald Shankweiler. 2004. Sentence complexity and input modality effects in sentence comprehension: an fmri study. NeuroImage, 22(1):11–21.
- Devlin et al. (2019) Jacob Devlin, Ming-Wei Chang, Kenton Lee, and Kristina Toutanova. 2019. Bert: Pre-training of deep bidirectional transformers for language understanding. In Proceedings of the 2019 Conference of the North American Chapter of the Association for Computational Linguistics: Human Language Technologies, Volume 1 (Long and Short Papers), pages 4171–4186.
- Fedorenko et al. (2020) Evelina Fedorenko, Idan Asher Blank, Matthew Siegelman, and Zachary Mineroff. 2020. Lack of selectivity for syntax relative to word meanings throughout the language network. Cognition, 203:104348.
- Fedorenko et al. (2012) Evelina Fedorenko, Alfonso Nieto-Castanon, and Nancy Kanwisher. 2012. Lexical and syntactic representations in the brain: an fmri investigation with multi-voxel pattern analyses. Neuropsychologia, 50(4):499–513.
- Friederici et al. (2003) Angela D Friederici, Shirley-Ann Rüschemeyer, Anja Hahne, and Christian J Fiebach. 2003. The role of left inferior frontal and superior temporal cortex in sentence comprehension: localizing syntactic and semantic processes. Cerebral cortex, 13(2):170–177.
- Gauthier and Levy (2019) Jon Gauthier and Roger Levy. 2019. Linking artificial and human neural representations of language. In Proceedings of the 2019 Conference on Empirical Methods in Natural Language Processing and the 9th International Joint Conference on Natural Language Processing (EMNLP-IJCNLP), pages 529–539.
- Glasser et al. (2016) Matthew F Glasser, Timothy S Coalson, Emma C Robinson, Carl D Hacker, John Harwell, Essa Yacoub, Kamil Ugurbil, Jesper Andersson, Christian F Beckmann, Mark Jenkinson, et al. 2016. A multi-modal parcellation of human cerebral cortex. Nature, 536(7615):171–178.
- Handjaras et al. (2016) Giacomo Handjaras, Emiliano Ricciardi, Andrea Leo, Alessandro Lenci, Luca Cecchetti, Mirco Cosottini, Giovanna Marotta, and Pietro Pietrini. 2016. How concepts are encoded in the human brain: a modality independent, category-based cortical organization of semantic knowledge. Neuroimage, 135:232–242.
- Hollenstein et al. (2019) Nora Hollenstein, Antonio de la Torre, Nicolas Langer, and Ce Zhang. 2019. Cognival: A framework for cognitive word embedding evaluation. In Proceedings of the 23rd Conference on Computational Natural Language Learning (CoNLL), pages 538–549.
- Huth et al. (2016) Alexander G Huth, Wendy A De Heer, Thomas L Griffiths, Frédéric E Theunissen, and Jack L Gallant. 2016. Natural speech reveals the semantic maps that tile human cerebral cortex. Nature, 532(7600):453–458.
- Jain and Huth (2018) Shailee Jain and Alexander G Huth. 2018. Incorporating context into language encoding models for fmri. In Proceedings of the 32nd International Conference on Neural Information Processing Systems, pages 6629–6638.
- Jat et al. (2020) S Jat, H Tang, P Talukdar, and T Mitchel. 2020. Relating simple sentence representations in deep neural networks and the brain. In ACL 2019-57th Annual Meeting of the Association for Computational Linguistics, Proceedings of the Conference, pages 5137–5154. Association for Computational Linguistics (ACL).
- Kietzmann et al. (2019) Tim C Kietzmann, Courtney J Spoerer, Lynn KA Sörensen, Radoslaw M Cichy, Olaf Hauk, and Nikolaus Kriegeskorte. 2019. Recurrence is required to capture the representational dynamics of the human visual system. Proceedings of the National Academy of Sciences, 116(43):21854–21863.
- Kriegeskorte and Douglas (2019) Nikolaus Kriegeskorte and Pamela K Douglas. 2019. Interpreting encoding and decoding models. Current opinion in neurobiology, 55:167–179.
- Mitchell et al. (2008) Tom M Mitchell, Svetlana V Shinkareva, Andrew Carlson, Kai-Min Chang, Vicente L Malave, Robert A Mason, and Marcel Adam Just. 2008. Predicting human brain activity associated with the meanings of nouns. science, 320(5880):1191–1195.
- Nastase et al. (2020) Samuel A Nastase, Yun-Fei Liu, Hanna Hillman, Kenneth A Norman, and Uri Hasson. 2020. Leveraging shared connectivity to aggregate heterogeneous datasets into a common response space. NeuroImage, 217:116865.
- Nastase et al. (2021) Samuel A Nastase, Yun-Fei Liu, Hanna Hillman, Asieh Zadbood, Liat Hasenfratz, Neggin Keshavarzian, Janice Chen, Christopher J Honey, Yaara Yeshurun, Mor Regev, et al. 2021. Narratives: fmri data for evaluating models of naturalistic language comprehension. bioRxiv, pages 2020–12.
- Nishida et al. (2015) Satoshi Nishida, Alexander G Huth, Jack L Gallant, and Shinji Nishimoto. 2015. Word statistics in large-scale texts explain the human cortical semantic representation of objects, actions, and impressions. In Society for Neuroscience Annual Meeting, volume 333.
- Oota et al. (2022a) Subba Reddy Oota, Jashn Arora, Manish Gupta, and Raju S Bapi. 2022a. Cross-view brain decoding. arXiv preprint arXiv:2204.09564.
- Oota et al. (2022b) Subba Reddy Oota, Jashn Arora, Vijay Rowtula, Manish Gupta, and Raju S Bapi. 2022b. Visio-linguistic brain encoding. arXiv preprint arXiv:2204.08261.
- Oota et al. (2018) Subba Reddy Oota, Naresh Manwani, and Raju S Bapi. 2018. fmri semantic category decoding using linguistic encoding of word embeddings. In International Conference on Neural Information Processing, pages 3–15. Springer.
- Oota et al. (2019) Subba Reddy Oota, Vijay Rowtula, Manish Gupta, and Raju S Bapi. 2019. Stepencog: A convolutional lstm autoencoder for near-perfect fmri encoding. In 2019 International Joint Conference on Neural Networks (IJCNN), pages 1–8. IEEE.
- Pereira et al. (2013) Francisco Pereira, Matthew Botvinick, and Greg Detre. 2013. Using wikipedia to learn semantic feature representations of concrete concepts in neuroimaging experiments. Artificial intelligence, 194:240–252.
- Pereira et al. (2016) Francisco Pereira, Bin Lou, Brianna Pritchett, Nancy Kanwisher, Matthew Botvinick, and Evelina Fedorenko. 2016. Decoding of generic mental representations from functional mri data using word embeddings. bioRxiv, page 057216.
- Pereira et al. (2018) Francisco Pereira, Bin Lou, Brianna Pritchett, Samuel Ritter, Samuel J Gershman, Nancy Kanwisher, Matthew Botvinick, and Evelina Fedorenko. 2018. Toward a universal decoder of linguistic meaning from brain activation. Nature communications, 9(1):1–13.
- Popham et al. (2021) Sara F Popham, Alexander G Huth, Natalia Y Bilenko, Fatma Deniz, James S Gao, Anwar O Nunez-Elizalde, and Jack L Gallant. 2021. Visual and linguistic semantic representations are aligned at the border of human visual cortex. Nature Neuroscience, 24(11):1628–1636.
- Ruxton and Beauchamp (2008) Graeme D Ruxton and Guy Beauchamp. 2008. Time for some a priori thinking about post hoc testing. Behavioral ecology, 19(3):690–693.
- Schrimpf et al. (2021) Martin Schrimpf, Idan Blank, Greta Tuckute, Carina Kauf, Eghbal A Hosseini, Nancy Kanwisher, Joshua Tenenbaum, and Evelina Fedorenko. 2021. The neural architecture of language: Integrative reverse-engineering converges on a model for predictive processing. PNAS, Vol:To appear.
- Schwartz et al. (2019) Dan Schwartz, Mariya Toneva, and Leila Wehbe. 2019. Inducing brain-relevant bias in natural language processing models. Advances in Neural Information Processing Systems, 32:14123–14133.
- Sun et al. (2019) Jingyuan Sun, Shaonan Wang, Jiajun Zhang, and Chengqing Zong. 2019. Towards sentence-level brain decoding with distributed representations. In Proceedings of the AAAI Conference on Artificial Intelligence, volume 33, pages 7047–7054.
- Sun et al. (2020) Jingyuan Sun, Shaonan Wang, Jiajun Zhang, and Chengqing Zong. 2020. Neural encoding and decoding with distributed sentence representations. IEEE Transactions on Neural Networks and Learning Systems, 32(2):589–603.
- Toneva et al. (2020) Mariya Toneva, Otilia Stretcu, Barnabás Póczos, Leila Wehbe, and Tom M Mitchell. 2020. Modeling task effects on meaning representation in the brain via zero-shot meg prediction. Advances in Neural Information Processing Systems, 33.
- Toneva and Wehbe (2019) Mariya Toneva and Leila Wehbe. 2019. Interpreting and improving natural-language processing (in machines) with natural language-processing (in the brain). arXiv preprint arXiv:1905.11833.
- Vaswani et al. (2017) Ashish Vaswani, Noam Shazeer, Niki Parmar, Jakob Uszkoreit, Llion Jones, Aidan N Gomez, Łukasz Kaiser, and Illia Polosukhin. 2017. Attention is all you need. In Advances in neural information processing systems, pages 5998–6008.
- Wang et al. (2018) Alex Wang, Amanpreet Singh, Julian Michael, Felix Hill, Omer Levy, and Samuel Bowman. 2018. Glue: A multi-task benchmark and analysis platform for natural language understanding. In Proceedings of the 2018 EMNLP Workshop BlackboxNLP: Analyzing and Interpreting Neural Networks for NLP, pages 353–355.
- Wang et al. (2019) Aria Wang, Michael Tarr, and Leila Wehbe. 2019. Neural taskonomy: Inferring the similarity of task-derived representations from brain activity. Advances in Neural Information Processing Systems, 32:15501–15511.
- Wang et al. (2017) Jing Wang, Vladimir L Cherkassky, and Marcel Adam Just. 2017. Predicting the brain activation pattern associated with the propositional content of a sentence: Modeling neural representations of events and states. Human brain mapping, 38(10):4865–4881.
- Wang et al. (2020) Shaonan Wang, Jiajun Zhang, Haiyan Wang, Nan Lin, and Chengqing Zong. 2020. Fine-grained neural decoding with distributed word representations. Information Sciences, 507:256–272.
- Wehbe et al. (2014) Leila Wehbe, Brian Murphy, Partha Talukdar, Alona Fyshe, Aaditya Ramdas, and Tom Mitchell. 2014. Simultaneously uncovering the patterns of brain regions involved in different story reading subprocesses. in press.
- Yamins et al. (2014) Daniel LK Yamins, Ha Hong, Charles F Cadieu, Ethan A Solomon, Darren Seibert, and James J DiCarlo. 2014. Performance-optimized hierarchical models predict neural responses in higher visual cortex. Proceedings of the national academy of sciences, 111(23):8619–8624.
Appendix A Details of the Finetuned Models
We selected tasks for which BERT-base-cased finetuned models were available. Note that we did not finetune any of these models ourselves but leveraged the state-of-the-art finetuned models available on Huggingface. Details of the specific finetuned model checkpoints are mentioned in Table 3.
Appendix B ANOVA test results
B.1 Pereira dataset
The main effect of model was significant for the ROIs with 95% confidence with these statistics:
-
•
Language_LH: [F(9, 40) = 3.95, p=0.0052]
-
•
Language_RH: [F(9, 40) = 4.53, p=0.0015]
-
•
Vision_Body: [F(9, 40) = 4.397, p=0.00227]
-
•
Vision_Face: [F(9, 40) = 3.46, p=0.0085]
-
•
Vision_Object: [F(9, 40) = 3.40, p=0.0121]
-
•
Vision_Scenes: [F(9, 40) = 4.917, p=0.0007]
-
•
Vision: [F(9, 40) = 3.945, p=0.00385]
-
•
DMN: [F(9, 40) = 6.28, p=0.00034]
-
•
TP: [F(9, 40) = 6.54, p=0.00042]
| T1 | T2 | p-value |
|---|---|---|
| CR | QA | 0.024 |
| CR | SA | 0.015 |
| CR | NLI | 0.010 |
| T1 | T2 | p-value |
|---|---|---|
| CR | SS | 0.021 |
| CR | SRL | 0.0003 |
| CR | Sum | 0.003 |
| CR | QA | 0.039 |
| CR | SA | 0.013 |
| CR | WSD | 0.016 |
| T1 | T2 | p-value |
|---|---|---|
| CR | SRL | 0.0011 |
| CR | Sum | 0.0092 |
| CR | SA | 0.039 |
| CR | NLI | 0.0061 |
| T1 | T2 | p-value |
|---|---|---|
| CR | SA | 0.0404 |
| CR | nli | 0.036 |
| T1 | T2 | p-value |
| CR | SRL | 0.0027 |
| T1 | T2 | p-value |
|---|---|---|
| CR | Sum | 0.027 |
| CR | QA | 0.0036 |
| CR | SA | 0.0022 |
| CR | NLI | 0.0010 |
| T1 | T2 | p-value |
|---|---|---|
| CR | SRL | 0.0014 |
| CR | Sum | 0.0431 |
| CR | NLI | 0.0177 |
| T1 | T2 | p-value |
|---|---|---|
| CR | NLI | 0.027 |
| CR | Sum | 0.008 |
| CR | PD | 0.0147 |
| NLI | SA | 0.056 |
| NLI | SS | 0.000011 |
| SA | Sum | 0.0188 |
| SA | PD | 0.032 |
| SS | Sum | 0.000002 |
| SS | WSD | 0.0059 |
| SS | PD | 0.000004 |
| SRL | Sum | 0.0545 |
| SRL | PD | 0.08876 |
| T1 | T2 | p-value |
|---|---|---|
| NLI | SS | 0.00157 |
| Sum | SS | 0.0015 |
| PD | SS | 0.002 |
| SA | SS | 0.0565 |
| SS | WSD | 0.052 |
| T1 | T2 | p-value |
|---|---|---|
| NLI | SS | 0.000007 |
| SA | SS | 0.029 |
| SS | SRL | 0.0084 |
| SS | PD | 0.000023 |
| SS | QA | 0.00128 |
| T1 | T2 | p-value |
|---|---|---|
| CR | NLI | 0.0203 |
| CR | PD | 0.0072 |
| NER | PD | 0.0291 |
| NLI | SS | 0.0000013 |
| SA | SS | 0.0299 |
| SS | SRL | 0.0011 |
| SS | PD | 2.97929e-7 |
| SS | WSD | 0.0444 |
| SS | QA | 0.00099 |
| PD | Sum | 0.039 |
| T1 | T2 | p-value |
|---|---|---|
| CR | NER | 1.07034e-10 |
| CR | NLI | 0.000001 |
| CR | SRL | 0.0014 |
| CR | PD | 0.0000047 |
| CR | QA | 0.0023 |
| NER | NLI | 9.02023e-11 |
| NER | SA | 9.02993e-11 |
| NER | SS | 0.000157159 |
| NER | SRL | 9.02116e-11 |
| NER | PD | 9.02023e-11 |
| NER | Sum | 9.03064e-11 |
| NER | WSD | 9.03172e-11 |
| NER | QA | 9.02116e-11 |
| NLI | SA | 0.0207013 |
| NLI | SS | 9.03255e-11 |
| NLI | Sum | 0.0043 |
| NLI | WSD | 0.00036 |
| SA | SS | 0.0000072 |
| SS | SRL | 4.47012e-10 |
| SS | PD | 9.04392e-11 |
| SS | Sum | 0.00011 |
| SS | WSD | 0.00084 |
| SS | QA | 6.36666e-10 |
| PD | Sum | 0.012 |
| PD | WSD | 0.0012 |
| T1 | T2 | p-value |
|---|---|---|
| CR | NER | 1.52787e-9 |
| CR | NLI | 0.0000042 |
| CR | SS | 0.0039 |
| CR | PD | 0.00011 |
| CR | QA | 0.0101 |
| NER | NLI | 8.86012e-11 |
| NER | SA | 8.87732e-11 |
| NER | SRL | 8.88714e-11 |
| NER | PD | 8.86092e-11 |
| NER | Sum | 1.05034e-10 |
| NER | WSD | 1.01319e-10 |
| NER | QA | 8.86657e-11 |
| NLI | SA | 0.0059 |
| NLI | SS | 8.87066e-11 |
| NLI | Sum | 0.000371 |
| NLI | WSD | 0.000191 |
| SA | SS | 0.0000021 |
| SS | SRL | 0.00000142 |
| SS | PD | 8.87554e-11 |
| SS | Sum | 0.000126402 |
| SS | WSD | 0.000128239 |
| SS | QA | 1.31249e-10 |
| PD | Sum | 0.00619 |
| PD | WSD | 0.0036 |
| T1 | T2 | p-value |
|---|---|---|
| CR | NLI | 0.00069 |
| CR | PD | 0.00395 |
| NER | NLI | 0.0051 |
| NER | SS | 0.0286244 |
| NER | PD | 0.0235 |
| NLI | SS | 4.43074e-10 |
| NLI | Sum | 0.0068987 |
| NLI | WSD | 0.02709 |
| SA | SS | 0.0001732 |
| SS | SRL | 0.0000530 |
| SS | PD | 4.37008e-9 |
| SS | Sum | 0.0219850 |
| SS | WSD | 0.005447 |
| SS | QA | 0.0000016 |
| PD | Sum | 0.0306 |
| T1 | T2 | p-value |
|---|---|---|
| CR | NLI | 0.0064 |
| CR | PD | 0.0148564 |
| NER | NLI | 0.0449 |
| NLI | SS | 3.74353e-8 |
| NLI | WSD | 0.0321627 |
| SA | SS | 0.0036278 |
| SS | SRL | 0.001054 |
| SS | PD | 1.33146e-7 |
| SS | Sum | 0.025420 |
| SS | QA | 0.000049 |
| T1 | T2 | p-value |
|---|---|---|
| CR | NLI | 0.000032 |
| CR | PD | 0.000019 |
| NER | NLI | 0.000619887 |
| NER | SS | 0.040 |
| NER | PD | 0.000399 |
| NLI | SS | 1.61916e-10 |
| NLI | Sum | 0.00074 |
| NLI | WSD | 0.000462932 |
| SA | SS | 0.000221241 |
| SS | SRL | 0.0000123345 |
| SS | PD | 1.30279e-10 |
| SS | Sum | 0.0356814 |
| SS | WSD | 0.0496343 |
| SS | QA | 0.00000162 |
| PD | Sum | 0.0004803 |
| PD | WSD | 0.000296713 |
| T1 | T2 | p-value |
|---|---|---|
| CR | NLI | 0.000191 |
| CR | PD | 0.00010 |
| NER | NLI | 0.0168115 |
| NER | SS | 0.0168115 |
| NER | PD | 0.000674 |
| NLI | SS | 1.05897e-10 |
| NLI | Sum | 0.001194 |
| NLI | WSD | 0.003894 |
| SA | SS | 0.0000256 |
| SS | SRL | 0.00000224 |
| SS | PD | 9.81710e-11 |
| SS | Sum | 0.0165866 |
| SS | WSD | 0.0057237 |
| SS | QA | 2.98083e-7 |
| PD | Sum | 0.000685 |
| PD | WSD | 0.00231873 |
| T1 | T2 | p-value |
|---|---|---|
| CR | NLI | 0.0188070 |
| CR | PD | 0.0099703 |
| NER | PD | 0.0321010 |
| NLI | SS | 6.37802e-7 |
| SA | SS | 0.00642888 |
| SS | SRL | 0.00051148 |
| SS | PD | 2.42829e-7 |
| SS | QA | 0.000162 |
| PD | WSD | 0.0476 |
| T1 | T2 | p-value |
|---|---|---|
| CR | NLI | 0.00498313 |
| CR | PD | 0.000298933 |
| NER | NLI | 0.024695 |
| NER | PD | 0.0020556 |
| NLI | SS | 4.16645e-8 |
| NLI | Sum | 0.0449825 |
| NLI | WSD | 0.0352242 |
| SA | SS | 0.00120394 |
| SS | SRL | 0.00002939 |
| SS | PD | 7.70669e-10 |
| SS | Sum | 0.0417081 |
| SS | QA | 0.00000742881 |
| PD | Sum | 0.00434934 |
| PD | WSD | 0.0031 |
B.2 Narratives-Pieman dataset
The main effect of model was significant for the ROIs with 95% confidence with these statistics:
-
•
EAC_L [F(9,810)=3.88, p=.00009]
-
•
EAC_R [F(9,810)=3.34, p=.00055]
-
•
AAC_L [F(9,810)=5.37, p=.0000007]
-
•
AAC_R [F(9,810)=6.955, p=.00000]
-
•
PMC_L [F(9,810)=37.21, p=.00000]
-
•
PMC_R [F(9,810)=31.62, p=.00000]
-
•
TPOJ_L [F(9,810)=9.166, p=.00000]
-
•
TPOJ_R [F(9,810)=7.797, p=.00000]
-
•
DFL_L [F(9,810)=12.445, p=.00000]
-
•
DFL_R [F(9,810)=12.27, p=.00000]