Unveiling the outer dust disc of TW Hya with deep ALMA observations
Abstract
The radial extent of millimetre dust in protoplanetary discs is often far smaller than that of their gas, mostly due to processes such as dust growth and radial drift. However, it has been suggested that current millimetre continuum observations of discs do not trace their full extent due to limited sensitivity. In this Letter, we present deep (19 Jy beam-1) moderate resolution (0.37″) ALMA observations at 1 mm of the nearest protoplanetary disc, TW Hya. Using the visibility analysis tool frank, we reveal a structured millimetre intensity distribution out to 100 au, well beyond previous estimates of 60–70 au. Our analysis suggests the presence of a new millimetre continuum gap at 82 au, coincident with similar features seen in optical/near-infrared scattered light and millimetre molecular line observations. Examination of the fit residuals confirms the presence of the previously reported au-scale continuum excess at 52 au (). Our results demonstrate the utility of combining deep, moderate resolution observations with super-resolution analysis techniques to probe the faintest regions of protoplanetary discs.
keywords:
protoplanetary discs – stars: individual: TW Hya – techniques: interferometric – submillimetre: planetary systems1 Introduction
Observations of planet-forming discs have shown that the radial extent of their millimetre dust component is, generally, smaller than the extent of molecular gas in the disc (e.g. Panić et al., 2009; Andrews et al., 2012). Initially, this difference was attributed to limited sensitivity (see Dutrey et al., 1998), but further observations revealed that the gas and dust cannot be reproduced with the same surface density profile (Hughes et al., 2008). In particular, observations with the Atacama Large Millimetre/submillimetre Array (ALMA) demonstrated that a sharp decrease in dust surface at the outer edge is required (e.g. de Gregorio-Monsalvo et al., 2013; Andrews et al., 2016).
A proposed explanation for these differing radial extents involves the growth and inward drift of dust grains through the disc. Observations of discs at cm wavelengths have confirmed that dust can grow to mm-cm sizes (see, e.g., Rodmann et al., 2006; Ricci et al., 2012) and that the maximum grain size increases toward the inner disc (Pérez et al., 2012; Tazzari et al., 2016). These characteristics are predicted by models of growth and radial drift (Birnstiel et al., 2010; Birnstiel et al., 2012). Indeed, such models naturally result in a sharp outer edge of the dust distribution (or sharp decrease in the dust-to-gas mass ratio) that is compatible with observations (Birnstiel & Andrews, 2014). However, observed continuum fluxes and radial extents suggest that drift needs to be halted (or significantly slowed) in the majority of discs (Pinilla et al., 2012). This can be achieved via local pressure maxima induced by substructure in discs, e.g. rings and gaps (see Andrews, 2020).
Despite this apparently self-consistent picture, Rosotti et al. (2019) suggested that even the most recent observations of the millimetre dust continuum in discs are still limited by sensitivity. In contrast to Birnstiel & Andrews (2014), they argue that currently measured disc radii do not trace the sharp outer edge in the dust distribution, but rather the radius out to which the grains are large enough to possess significant (sub-)millimetre opacity. The dust surface density extends further, but in these regions the grains are small and the opacity significantly lower (factor 10). If this interpretation is correct, then observations of the outer regions of discs in the (sub-)millimetre should reveal faint emission, given sufficient sensitivity.
Such observations require optimal targets for which the surface brightness sensitivity can be maximised. TW Hya is a young star of spectral type M0.5, stellar mass 0.6 M⊙ and age 8 Myr (Sokal et al., 2018). It is surrounded by a well studied protoplanetary disc, due to its close proximity (59.5 pc, Bailer-Jones et al. 2018) and near face-on inclination (5°, Huang et al. 2018). The TW Hya disc has been characterised across multiple wavelengths, from scattered light (Debes et al., 2017; van Boekel et al., 2017) to both thermal dust and molecular line emission (Andrews et al., 2016; Teague et al., 2017; Huang et al., 2018; Tsukagoshi et al., 2019; Nomura et al., 2021; Macías et al., 2021). Each of these investigations has revealed a diverse array of substructure in both the gas and dust within the disc.
In this Letter, we present deep observations of the TW Hya disc at 1 mm obtained with ALMA (19 Jy beam-1, 0.37″). We perform our analysis in the visibility plane to increase the effective signal-to-noise (S/N), and characterise the dust continuum emission and substructure in the outer (60 au) disc for the first time.
2 Observations
TW Hya was observed by ALMA in Band 7 on the 3rd of December 2016 for an on-source time of 5.7 hours in configuration C40-4 under project code 2016.1.00464.S (P.I. C. Walsh). Baselines ranged from 15–704 m with 39–46 antennas depending on execution, with precipitable water vapour measurements of 1.0 mm. Quasar J10372934 was used as both a phase and flux calibrator, while J10580133 was used as a bandpass calibrator. The correlator was configured for a continuum spectral window from 292.8–294.8 GHz with a spectral resolution of 32.0 km s-1. Data (self-)calibration and imaging were performed with CASA v5.6.2 (McMullin et al., 2007). A continuum visibility measurement set was created by combining all channels after flagging those with line emission. Two rounds of phase self-calibration and one round of amplitude self-calibration were undertaken, improving the peak S/N by a factor of 14. The phase centre was set to , throughout. Initial continuum imaging was performed with tclean using Briggs weighting (robust = 0.5) and multi-scale synthesis (nterms = 1) with scales of 0, 0.36, 1.8, 4.2 and 6.0 arcsec, respectively. The synthesised beam was arcsec ( au) with a position angle of °. The final continuum rms was 18.8 Jy beam-1 (0.11 mJy arcsec-2) measured from a signal-free region of the image. We highlight that, in terms of a surface brightness sensitivity per standardised area, our rms is a factor of 160–210 times lower than recent high resolution observations of TW Hya at similar frequencies (e.g. 18.3 mJy arcsec-2 in Huang et al. 2018 and 22.8 mJy arcsec-2 in Macías et al. 2021).
3 Analysis
Despite the depth of our observations, the limited spatial resolution of our data (0.37″, 22 au) prevents a detailed investigation in the image plane. We therefore fit the visibilities directly with the frankenstein code (Jennings et al. 2020, v1.1.0, hereafter frank). Such analysis can achieve ‘super’ resolution (factors of 3 better than traditional imaging techniques, Jennings et al. 2022) and also acts to improve S/N for axisymmetric structure (see also Walsh et al., 2014; Zhang et al., 2015; Ilee et al., 2020).
Briefly, frank reconstructs the radial intensity at a set of locations, , by using a Discrete Hankel Transform to relate the intensity at these positions, , to the visibilities. The intensity is then inferred directly from the observed visibilities using a non-parametric Gaussian Process prior to regularise the fit. The frank code accounts for the inclination of the source by assuming the emission comes from an optically thick and geometrically thin disk, for which the inclination () and position angle () can be taken account via
| (1) | ||||
| (2) | ||||
| (3) |
where is the observed visibility, and the corresponding -points, and primed quantities refer to the de-projected coordinates. We assume the inclination and position angle that have been already well determined from high-resolution observations by Huang et al. (2018), namely and , respectively.
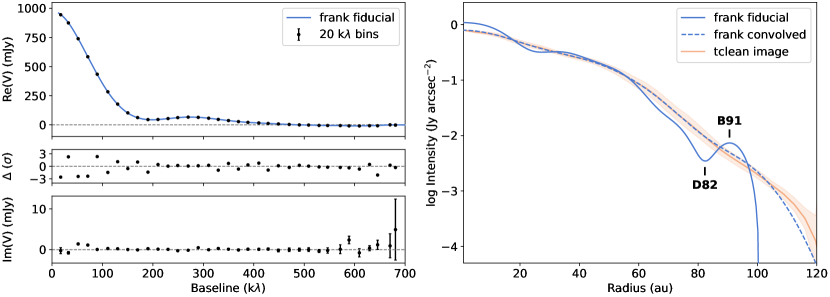
Figure 1 (left) shows the comparison between the visibilities and our fiducial frank fit, where we adopt the fit parameters , , ″ and Jy2 using 300 radial points. The fit shows good agreement with maximum residuals of less than 3 across all baselines. Figure 1 (right) shows the derived intensity profile from this model, along with the intensity profile of the deprojected tclean image and the frank intensity profile convolved to the same beam, demonstrating agreement at all radii.
The frank intensity profile exhibits two features not seen in previous millimetre observations of TW Hya. Firstly, the emission extends to 100 au, well beyond the typical radial extent of 60-70 au reported previously (e.g. Andrews et al., 2016; Huang et al., 2018; Macías et al., 2021). Secondly, we detect new substructure in this outer region of the disc, notably a dark gap centred at 82 au (hereafter D82) and a bright ring at 91 au (hereafter B91). We note that the extremely sharp drop of intensity at 100 au is a result of the log-scaling of the plot and the intensity profile approaching zero.
3.1 Robustness of the derived intensity profile
Determining a robust estimate of the uncertainty on the radial intensity profile reconstructed from the visibilities is challenging because intensity reconstruction is formally an ill-posed problem, with the intensity depending on the visibilities at unobserved -spacings. It is therefore necessary to regularise the fit, which frank achieves via an informative prior that damps power on unobserved small scales. This means that an uncertainty estimated directly from the posterior (here 0.1mJy arcsec-2) is a lower bound. Due to the high S/N of the data at the largest observed baselines, the uncertainty due to missing baselines dominates over this estimate. The high S/N also prevents us from investigating the uncertainty of the fit by varying the hyperparameters and as it is insensitive to these choices.
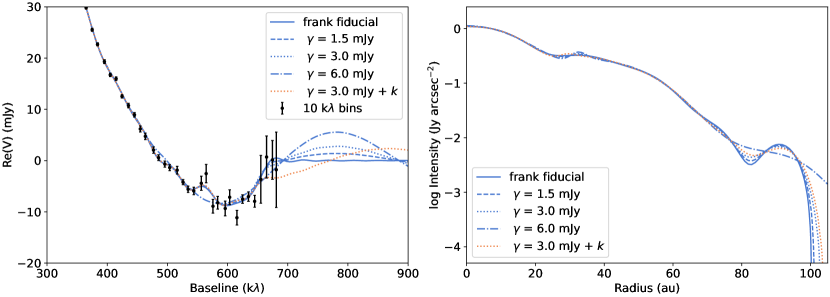
We therefore explore how the frank profile changes when estimating the contribution from the missing long baseline data via several sensible extrapolations beyond the longest observed baselines in our data. In Figure 2 (left), we show the impact of decaying sinusoidal oscillations with amplitudes of and 6 mJy and a wavelength that approximates the variation in the visibilities between 500–700 k (also shifted by half a wavelength, ). We also damp the oscillations on very long baselines by a Gaussian with width 1 M to prevent small-scale artefacts in the intensity profile.
Figure 2 (right) shows the corresponding intensity profiles for these extrapolations, demonstrating how the properties of the disc substructure change. Our frank fits to extrapolations with smaller amplitudes (e.g. fiducial, mJy and mJy) all recover gap and ring structures with slightly different locations and depths, but a similar goodness-of-fit (calculated across the 400–700 k range, which are those sensitive to linear size scales of 30 au and less). The gap and ring structure is mostly removed for a frank fit to the mJy extrapolation, but this is a mildly worse reproduction of the visibilities compared to the fiducial fit (where , corresponding to ). Therefore, while the extrapolations demonstrate that the precise morphology of the substructure depends on the behaviour of the visibilities beyond the largest baselines, we have been unable to remove the substructure entirely and remain consistent with the observed visibilities. In the absence of a formal uncertainty, we propagate a representative uncertainty based on the mJy extrapolation in all subsequent analysis.
We also considered other extrapolations, such as a constant visibility amplitude (a point source) and varying the oscillation wavelength by a factor 2. Although not shown, they produce very similar levels of variation as discussed above. In addition, we tested frank intensity profiles truncated at 80 au, which produced residual images with artefacts out to 100 au, further demonstrating the increased radial extent of the disc in our observations.
4 Discussion
4.1 The intensity profile compared to previous observations
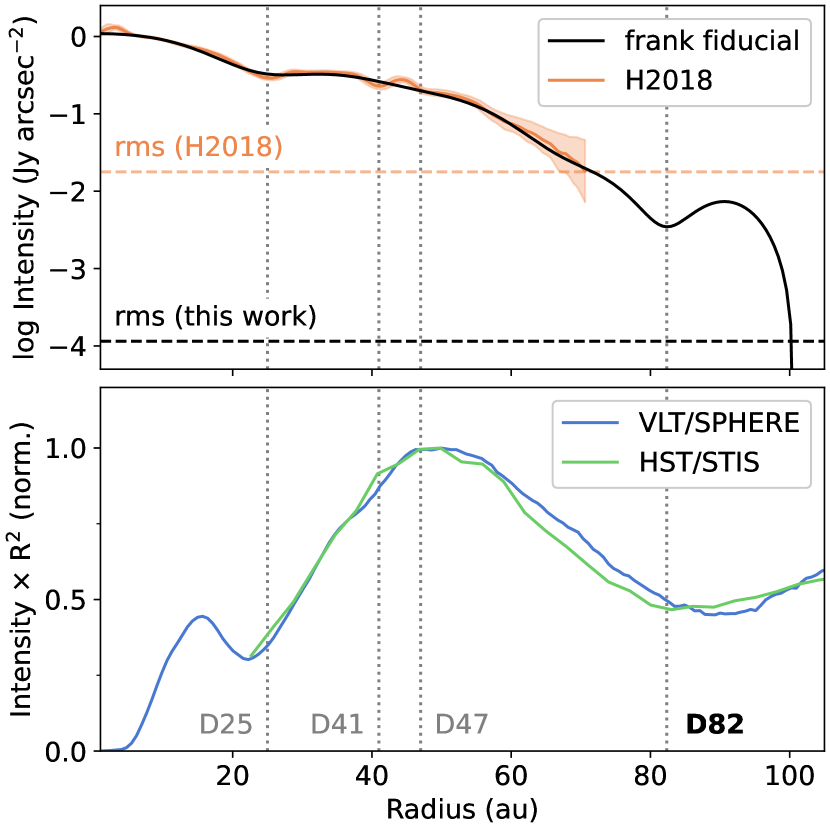
Huang et al. (2018) present high resolution (0.13″) observations of TW Hya at 290 GHz, providing a useful comparison. They recover the previously identified continuum gaps D25, D41 and D47 au, with their emission dropping below detectable levels between 60–70 au. Figure 3 (top) shows a comparison between our fiducial frank intensity profile and the Huang et al. (2018) observations calculated with GoFish (Teague, 2019) assuming the geometry discussed above. The profiles show excellent agreement both in terms of absolute flux level, slope, and substructure. Even with the limited spatial resolution of our observations (a CLEAN beam size of 22 au) we recover the D25 gap, however the D41 and D47 gaps are likely too shallow and narrow to be visible in our data. We highlight the respective rms of our observations, which is a factor 100 lower, allowing us to detect the millimetre continuum emission beyond 60–70 au.
We can also compare our millimetre continuum intensity profile with observations at other wavelengths, particularly those in scattered light. Debes et al. (2017) present observations of TW Hya with HST/STIS in the R band (1.6µm) tracing emission out to 180 au, noting the presence of a wide gap at a radius of 1.43″ (85 au). Similarly, van Boekel et al. (2017) observed TW Hya with VLT/SPHERE at H band (1.6µm) detecting a gap centred at 1.52″ (90.5 au). Figure 3 (bottom) shows the normalised radial profiles of these data scaled by to account for geometric dilution of the illuminating starlight. The location of our newly-identified millimetre gap (D82) is coincident with the location of these scattered light gaps to within several au. Variations between the precise gap locations are not unexpected, given that the millimetre continuum and scattered light observations are tracing different sized grains and also due to different physical mechanisms (thermal emission and scattered light, respectively).
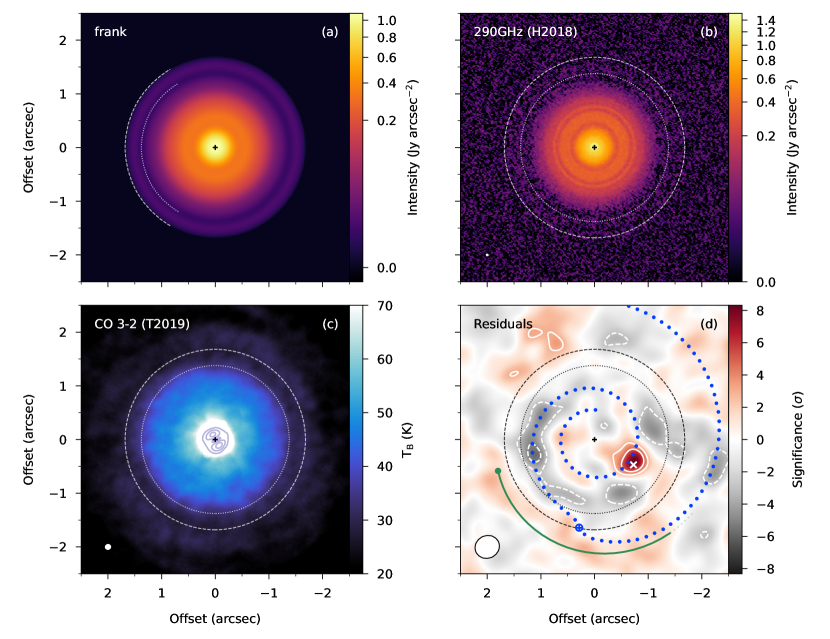
We can also examine how our derived intensity profile would appear on the sky. Figure 4a shows the profile swept in azimuth and reprojected to the observed position angle and inclination of TW Hya. Figure 4b shows the corresponding 290 GHz continuum image from Huang et al. (2018) overlaid with the location of the D82 gap and profile edge at 100 au, which lie beyond the radial extent probed by these high resolution observations.
Given the extended radial range across which our newly identified substructure lies, we can compare it to observations of molecular line emission at similarly large radii. Figure 4c shows the brightness temperature of the 12CO –2 emission toward TW Hya as presented in Huang et al. (2018) and Teague et al. (2019). The intensity scale has been cropped to highlight the ‘break’ in emission between 80–100 au, the beginning of which is coincident with the continuum gap D82. It is also interesting to note that the D82 gap shares a similar radial location to the gap in CS –4 emission at 1.6″ (95 au) presented in Teague et al. (2017). In addition, Nomura et al. (2021) recently presented high resolution maps of 13CO –2, C18O –2, CS –6 and CN –2 toward TW Hya, all of which show breaks in emission between 80–90 au that are coincident with D82. Taken together, these observations are consistent with a scenario in which there is a large gas surface density depletion close to these radii, and that slight offsets can be attributed to imaging limitations or the fact that each molecular line is probing a slightly different region of the depletion. Therefore, it appears that our millimetre continuum intensity profile shares a similar structure to both the gas and micron-sized dust in the outer disc.
4.2 The extent of the millimetre continuum emission
Our detection of millimetre emission in the outer disc has several implications. Firstly, our observations appear to support the hypothesis of Rosotti et al. (2019), in that we confirm that deep observations reveal faint continuum emitting material beyond what has been previously reported as the outer edge of millimetre dust in the TW Hya disc. However, our observations are unable to differentiate whether this emission originates from grains of a different size that would support the idea of an ‘opacity cliff’, or whether the faint millimetre emission reflects a change in surface density. To investigate this, similarly deep observations at multiple wavelengths would be required to calculate a spectral index in these outer disc regions.
Secondly, disc sizes are commonly calculated with respect to some radius enclosing a percentage of total flux, e.g. the 68 per cent radius (). Our frank radial intensity profile has au, very close to previous measurements for TW Hya at similar frequencies (e.g. au; Tripathi et al., 2017). However, this is clearly not an accurate representation of the ‘true’ continuum disc based on our results. In order to capture the larger extent enclosing this faint outer emission, much higher percentage flux radii are required (e.g. we find au, and au). If this faint millimetre emission at large radii is a common feature amongst many other protoplanetary discs beyond TW Hya, then this would effectively steepen correlations between disc size and other quantities (such as mass and luminosity) based on observations with lower sensitivity (e.g. Andrews et al., 2018; Hendler et al., 2020).
4.3 Characteristics of the outermost gap at 82 au
The potential detection of the millimetre counterpart of the outermost gap in TW Hya raises questions as to its origin, in particular whether such a gap could be opened by a planet in the disc. Following the procedure of Rosotti et al. (2016), we measure a gap width of au at 82 au, which translates to a planet mass of M⊕. Previous studies have performed a similar analysis on the gap observed in scattered light. Debes et al. (2013) placed an upper limit of the mass of the planetary companion of between 6–28 M⊕ based on HST observations, and van Boekel et al. (2017) found their observed VLT/SPHERE gap depth could be reproduced by a 34 M⊕ mass planet. Taken as a range of possibilities, these values are in agreement with our derived planet mass based on the millimetre continuum. Taking a slightly different approach, Mentiplay et al. (2019) used hydrodynamic models coupled with radiative transfer to simulate multiple observations of TW Hya. They found that planets with masses between 32–95 M⊕ were able to reproduce the outermost gap seen in scattered light, but note that such planets excite a spiral arm in the disc that should be apparent in scattered light observations (but is as yet undetected). These masses are somewhat higher than our estimate from D82, but are within a factor of 3. The addition of the extra constraints provided by our intensity profile between 60–100 au may help refine this planet mass for future studies.
4.4 Investigating non-axisymmetric structure
Despite the axisymmetric nature of our intensity profile, we can investigate any potential non-axisymmetric features in the observations by imaging the residual visibilities of the fiducial frank fit. We adopted the same imaging parameters as outlined in Section 2, but explored various robust parameters, finding that provided the best image fidelity (with beam size arcsec and position angle ). The resulting residual image is shown in Figure 4d. The strongest residual feature is a localised excess at a position of , , corresponding to a radial distance of au () from the central star. It is detected at approximately with an integrated flux density of mJy. A blue cross marks the position of the small scale continuum excess first identified in Tsukagoshi et al. (2019), coincident with the peak of our excess within 0.05″(3 au, close to the astrometric precision of ALMA). Estimating the dust mass of the continuum excess assuming optically thin emission and adopting the same assumptions as Tsukagoshi et al. (2019) (but extrapolated to our observing frequency) gives a value of M⊕, in good agreement with their dust mass of M⊕. This suggests our deep observations are tracing the same feature within the disc, which is impressive given the size of our nominal beam (0.44″, 26 au) compared to the resolved size of the excess (2–3 au).
In addition to the localised excess, there are several arc-like structures in the residuals between radii of 40–120 au detected with a S/N of between 2–6. We can compare their morphology to non-axisymmetric structure that has been previously identified in the TW Hya disc. Teague et al. (2019) identified spiral structure in the intensity of 12CO –2 emission in the disc, overlaid Figure 4d as a green line, which appears coincident with our continuum residuals in this region. Sturm et al. (2020) further analysed these residuals, finding that a hydrodynamic model with planet at a radius of 1.65″ (100 au) would generate a spiral wake consistent with their observed morphology. We have overlaid this spiral morphology on Figure 4d with a blue dotted line, demonstrating remarkable agreement with the continuum residual arcs. It therefore appears that our residual map is detecting the millimetre continuum counterpart to the spiral structure previously identified in 12CO molecular line emission.
5 Conclusions
We have analysed deep millimetre observations of TW Hya using the visibility modelling code frank. We summarise our findings below:
-
•
We detect faint, but structured, millimetre continuum emission out to radius of approximately 100 au. While our 68 per cent flux radius remains relatively unchanged with respect to previous estimates, our 95 and 98 per cent flux radii are 64.8 and 88.1 au, respectively, suggesting that these metrics may be more appropriate measures of the true sizes of discs at millimetre wavelengths.
-
•
Our findings support the hypothesis of Rosotti et al. (2019) in that previous millimetre continuum observations of discs are limited by sensitivity. If ubiquitous, this has implications for the many scaling relations derived from the continuum sizes of protoplanetary discs.
-
•
Our derived intensity profile shows tentative evidence of a gap in the millimetre dust disc at 82 au (D82) and a bright ring at 91 au (B91), although their exact properties are dependent on the behaviour of the visibilities at unobserved baselines. The gap at 82 au is coincident with several other features observed in both the gas and dust of the TW Hya disc, including a gap in scattered light and several molecular lines.
-
•
If a planet were to be responsible for opening such a gap, then it would be a sub-Neptune with mass M⊕, in broad agreement with similar analyses of multiple scattered light observations, and forward hydrodynamic modelling.
-
•
Examining our fit residuals, we confirm the detection of the localised au-scale millimetre continuum excess at 52 au in the TW Hya disc first reported by Tsukagoshi et al. (2019) and derive a similar dust mass of M⊕. We also find tentative hints of non-axisymmetric spiral structure, which may be the continuum counterpart to similar structures observed in 12CO emission.
The nature of the radial extension of the millimetre continuum could be further probed by sensitive multi-frequency observations to shed light on the properties of the dust emitting in the outer disc. In addition, complementary analysis techniques in both the visibility and image plane may help to further refine the properties of substructure in these regions. Nevertheless, our results demonstrate the utility of deep millimetre observations at intermediate spatial resolution which, when combined with super-resolution analysis techniques, can i) recover emission from the faint outer regions of protoplanetary discs, and ii) characterise any disc substructure. It is likely that this technique can be extended to study the outer regions of many other discs that exhibit substructure in scattered light observations (e.g. Avenhaus et al., 2018) beyond what would normally considered the edge of the millimetre dust disc.
Acknowledgements
We are grateful to Jane Huang, Roy van Boekel and John Debes for making their data available. We thank the referee, Simon Casassus, for a thorough report. JDI acknowledges support from the STFC under ST/R000287/1. CW acknowledges support from the University of Leeds, STFC and UKRI (grant numbers ST/T000287/1, MR/T040726/1). RAB is supported by a Royal Society University Research Fellowship. GPR acknowledges support from the Netherlands Organisation for Scientific Research (NWO, program number 016.Veni.192.233) and from an STFC Ernest Rutherford Fellowship (grant number ST/T003855/1). This paper makes use of the following ALMA data: ADS/JAO.ALMA#2016.1.00464.S.
Data Availability
The data underlying this article will be shared on reasonable request.
References
- Andrews (2020) Andrews S. M., 2020, ARA&A, 58, 483
- Andrews et al. (2012) Andrews S. M., et al., 2012, ApJ, 744, 162
- Andrews et al. (2016) Andrews S. M., et al., 2016, ApJ, 820, L40
- Andrews et al. (2018) Andrews S. M., Terrell M., Tripathi A., Ansdell M., Williams J. P., Wilner D. J., 2018, ApJ, 865, 157
- Avenhaus et al. (2018) Avenhaus H., et al., 2018, ApJ, 863, 44
- Bailer-Jones et al. (2018) Bailer-Jones C. A. L., Rybizki J., Fouesneau M., Mantelet G., Andrae R., 2018, AJ, 156, 58
- Birnstiel & Andrews (2014) Birnstiel T., Andrews S. M., 2014, ApJ, 780, 153
- Birnstiel et al. (2010) Birnstiel T., et al., 2010, A&A, 516, L14
- Birnstiel et al. (2012) Birnstiel T., Klahr H., Ercolano B., 2012, A&A, 539, A148
- Debes et al. (2013) Debes J. H., Jang-Condell H., Weinberger A. J., Roberge A., Schneider G., 2013, ApJ, 771, 45
- Debes et al. (2017) Debes J. H., et al., 2017, ApJ, 835, 205
- Dutrey et al. (1998) Dutrey A., Guilloteau S., Prato L., Simon M., Duvert G., Schuster K., Menard F., 1998, A&A, 338, L63
- Hendler et al. (2020) Hendler N., Pascucci I., Pinilla P., Tazzari M., Carpenter J., Malhotra R., Testi L., 2020, ApJ, 895, 126
- Huang et al. (2018) Huang J., et al., 2018, ApJ, 852, 122
- Hughes et al. (2008) Hughes A. M., Wilner D. J., Qi C., Hogerheijde M. R., 2008, ApJ, 678, 1119
- Ilee et al. (2020) Ilee J. D., Hall C., Walsh C., Jiménez-Serra I., Pinte C., Terry J., Bourke T. L., Hoare M., 2020, MNRAS, 498, 5116
- Jennings et al. (2020) Jennings J., Booth R. A., Tazzari M., Rosotti G. P., Clarke C. J., 2020, MNRAS, 495, 3209
- Jennings et al. (2022) Jennings J., Booth R. A., Tazzari M., Clarke C. J., Rosotti G. P., 2022, MNRAS, 509, 2780
- Macías et al. (2021) Macías E., Guerra-Alvarado O., Carrasco-González C., Ribas Á., Espaillat C. C., Huang J., Andrews S. M., 2021, A&A, 648, A33
- McMullin et al. (2007) McMullin J. P., Waters B., Schiebel D., Young W., Golap K., 2007, in Shaw R. A., Hill F., Bell D. J., eds, Astronomical Society of the Pacific Conference Series Vol. 376, Astronomical Data Analysis Software and Systems XVI. p. 127
- Mentiplay et al. (2019) Mentiplay D., Price D. J., Pinte C., 2019, MNRAS, 484, L130
- Nomura et al. (2021) Nomura H., et al., 2021, ApJ, 914, 113
- Panić et al. (2009) Panić O., Hogerheijde M. R., Wilner D., Qi C., 2009, A&A, 501, 269
- Pérez et al. (2012) Pérez L. M., et al., 2012, ApJ, 760, L17
- Pinilla et al. (2012) Pinilla P., Birnstiel T., Ricci L., Dullemond C. P., Uribe A. L., Testi L., Natta A., 2012, A&A, 538, A114
- Ricci et al. (2012) Ricci L., Trotta F., Testi L., Natta A., Isella A., Wilner D. J., 2012, A&A, 540, A6
- Rodmann et al. (2006) Rodmann J., Henning T., Chandler C. J., Mundy L. G., Wilner D. J., 2006, A&A, 446, 211
- Rosotti et al. (2016) Rosotti G. P., Juhasz A., Booth R. A., Clarke C. J., 2016, MNRAS, 459, 2790
- Rosotti et al. (2019) Rosotti G. P., Tazzari M., Booth R. A., Testi L., Lodato G., Clarke C., 2019, MNRAS, 486, 4829
- Sokal et al. (2018) Sokal K. R., Deen C. P., Mace G. N., Lee J.-J., Oh H., Kim H., Kidder B. T., Jaffe D. T., 2018, ApJ, 853, 120
- Sturm et al. (2020) Sturm J. A., Rosotti G. P., Dominik C., 2020, A&A, 643, A92
- Tazzari et al. (2016) Tazzari M., et al., 2016, A&A, 588, A53
- Teague (2019) Teague R., 2019, Journal of Open Source Software, 4, 1632
- Teague et al. (2017) Teague R., et al., 2017, ApJ, 835, 228
- Teague et al. (2019) Teague R., Bae J., Huang J., Bergin E. A., 2019, ApJ, 884, L56
- Tripathi et al. (2017) Tripathi A., Andrews S. M., Birnstiel T., Wilner D. J., 2017, ApJ, 845, 44
- Tsukagoshi et al. (2019) Tsukagoshi T., et al., 2019, ApJ, 878, L8
- Walsh et al. (2014) Walsh C., et al., 2014, ApJ, 791, L6
- Zhang et al. (2015) Zhang K., Blake G. A., Bergin E. A., 2015, ApJ, 806, L7
- de Gregorio-Monsalvo et al. (2013) de Gregorio-Monsalvo I., et al., 2013, A&A, 557, A133
- van Boekel et al. (2017) van Boekel R., et al., 2017, ApJ, 837, 132