Insider stories: Analyzing Internal Sustainability Efforts of major US companies from online reviews
Abstract
It is hard to establish whether a company supports internal sustainability efforts (ISEs) like gender equality, diversity, and general staff welfare, not least because of lack of methodologies operationalizing these internal sustainability practices, and of data honestly documenting such efforts. We developed and validated a six-dimension framework reflecting Internal Sustainability Efforts (ISEs), gathered more than 350K employee reviews of 104 major companies across the whole US for the (2008-2020) years, and developed a deep-learning framework scoring these reviews in terms of the six ISEs. Commitment to ISEs manifested itself at micro-level — companies scoring high in ISEs enjoyed high stock growth. This new conceptualization of ISEs offers both theoretical implications for the literature in corporate sustainability, and practical implications for companies and policy makers. To further explore these implications, researchers need to add potentially missing ISEs, to do so for more companies, and establish the causal relationship between company success and ISEs.
Introduction
Investments in sustainability are becoming paramount as many companies are under constant pressure to reduce the social and environmental impact of their operations [1] and increase accountability towards stakeholders and the wider society [2, 3, 4]. While corporate sustainability efforts tend to focus primarily on external stakeholders (e.g., customers, supply-chain partners, governmental organizations) [5], internal stakeholders (e.g., employees) represent a critical, and sometimes overlooked, target group to ensure effective corporate engagement with the sustainability agenda [6, 7, 8].
Internal sustainability efforts (ISEs) encompass a wide range of corporate policies directed towards internal stakeholders, including, for example, promoting a healthy employee work-life balance [9], investing in gender equality and diversity [10], and ensuring an harassment-free working environment [11]. These ISEs can reduce staff turnover [12] and improve market competitiveness [13]. However, although many companies openly advertise their commitment to internal sustainability, employees often report contrasting accounts of their experience of such efforts [14], and the extent to which ISEs successfully propagate throughout the organization remains unclear.
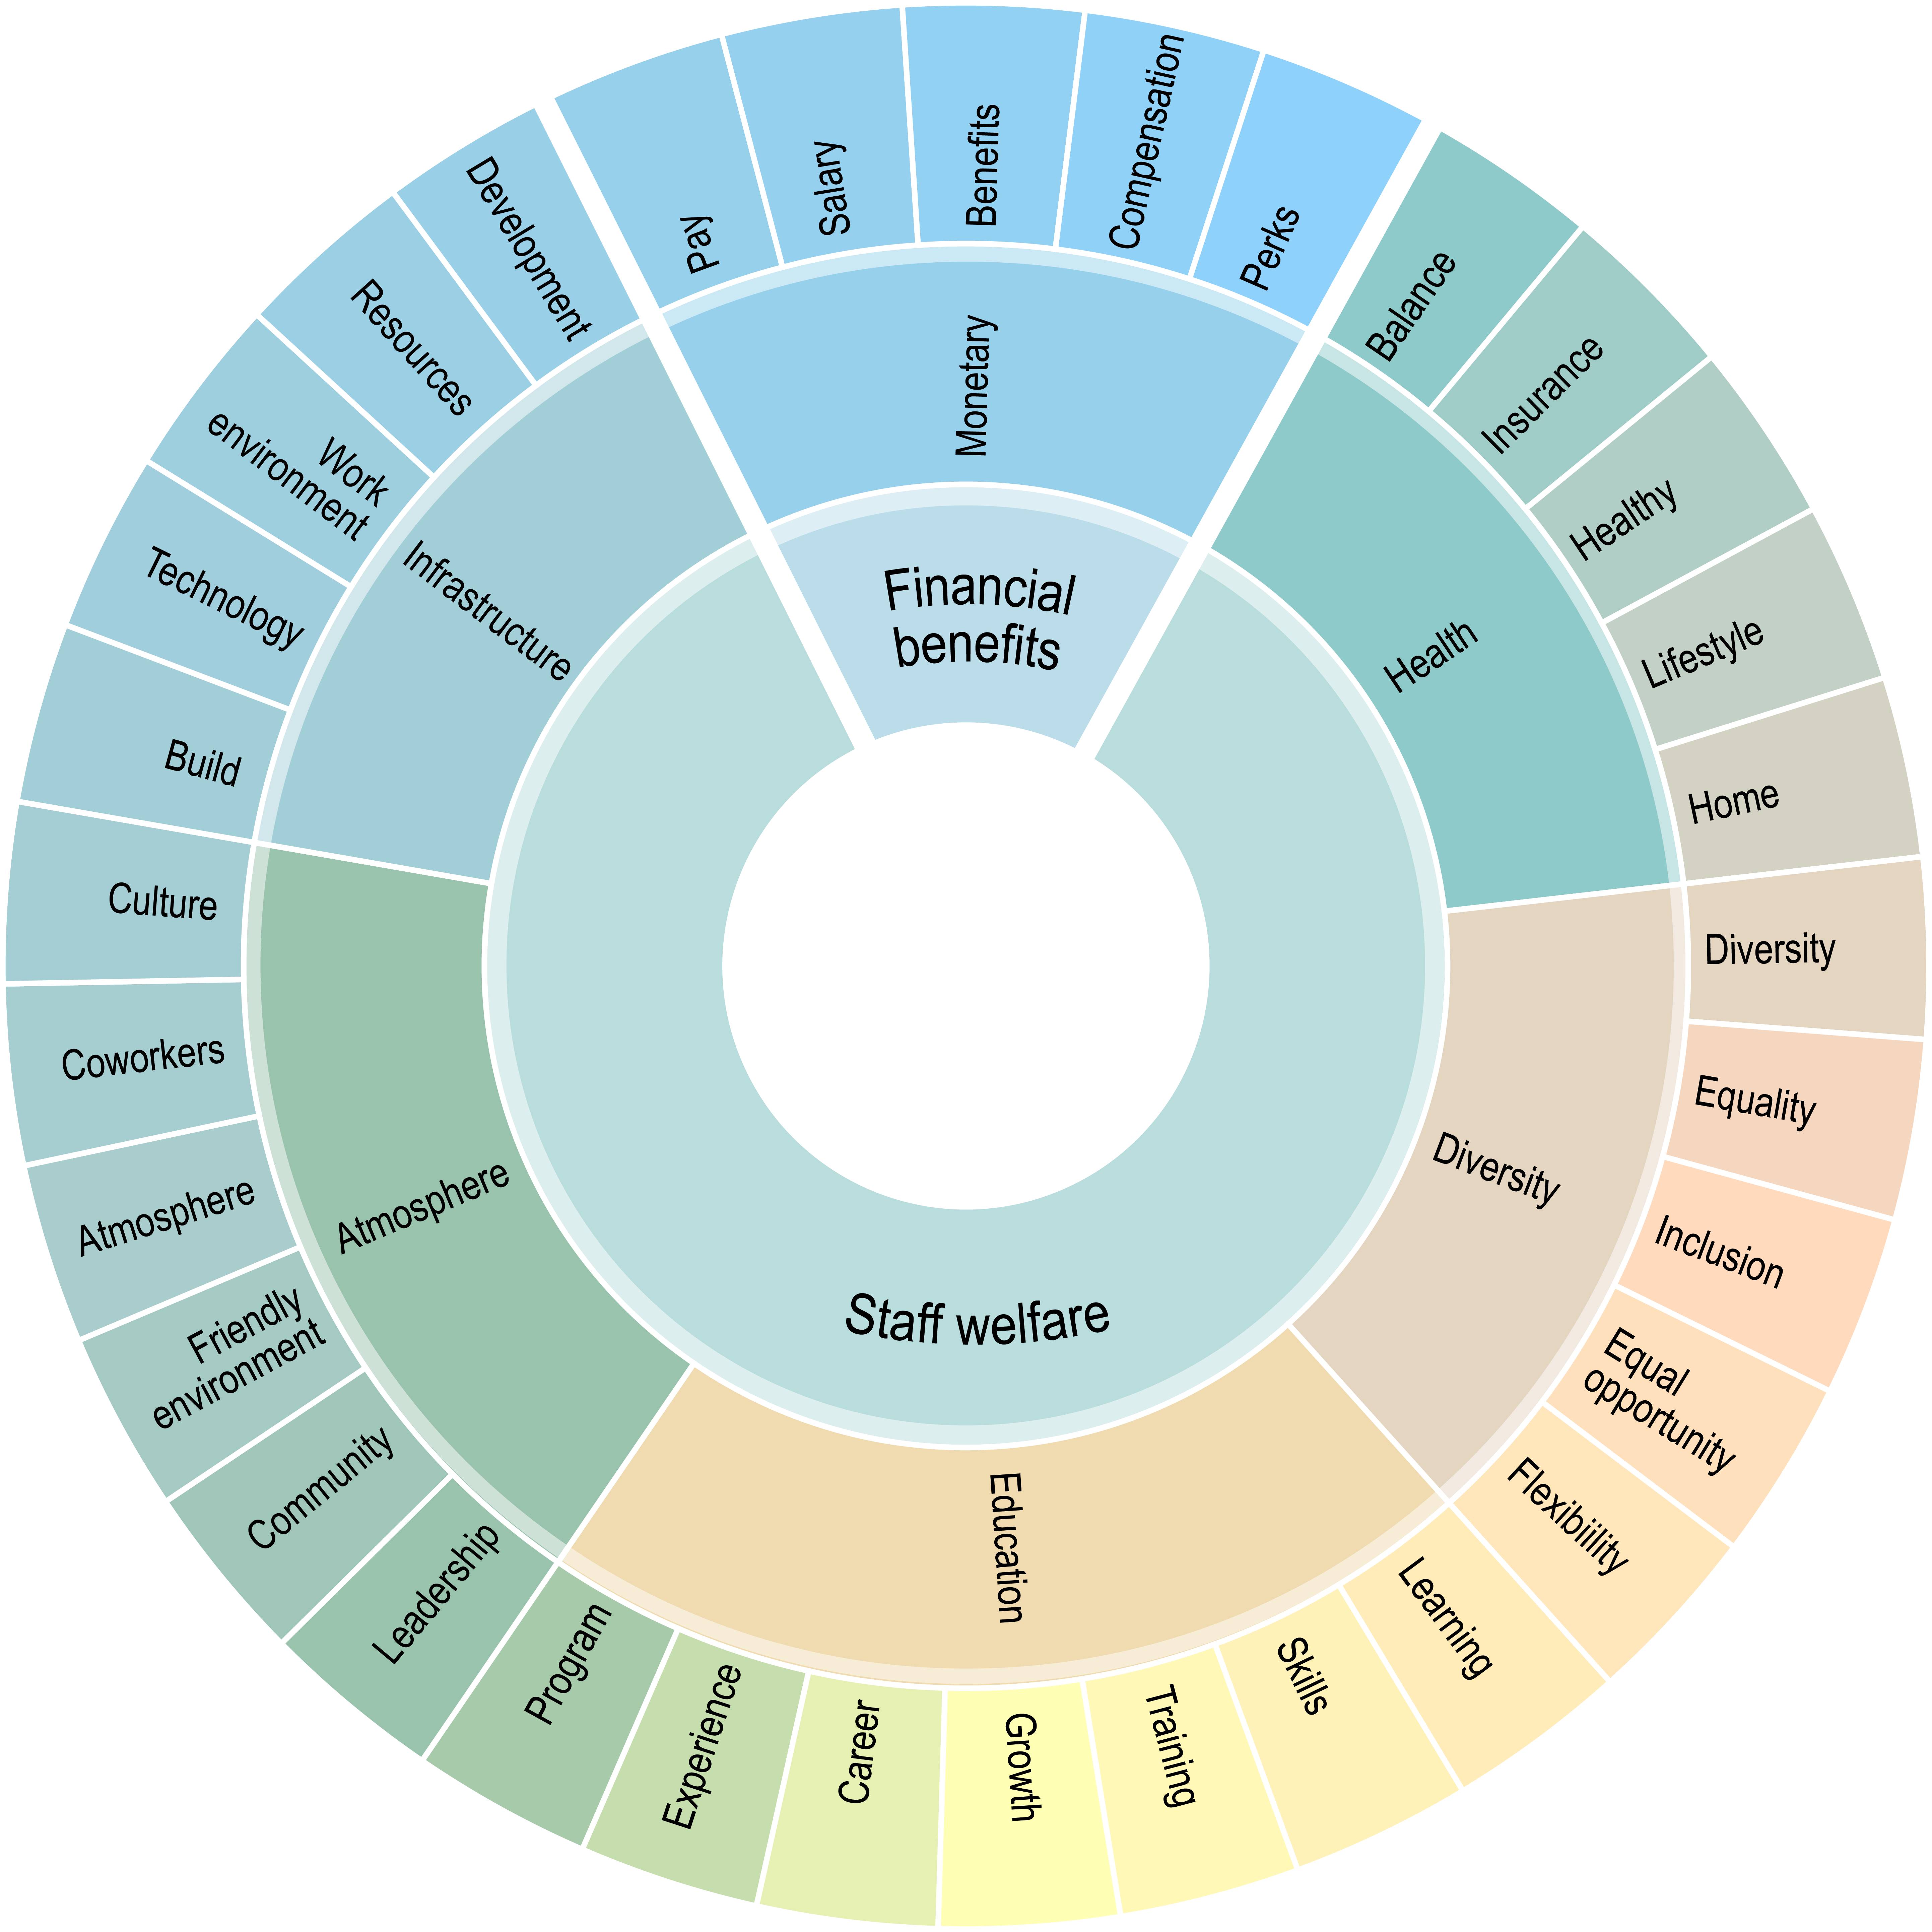
We partly tackle those issues by running a large-scale assessment of organizational practices aligned with ISEs. Since there exists no agreed-upon definition of corporate ISEs, to inform our research we started from the United Nations (UN) World Commission on Environment and Development (WCED) definition of sustainability as a strategy oriented towards “meeting the needs of the present without compromising the ability of future generations to meet their own needs” [15]. This definition is operationalized in the UN 17 Sustainable Development Goals (SDGs), which represent both a framework and a call-to-action for organizations to invest in addressing critical societal issues such as “good health and well-being”, “decent work and economic growth”, and “peace, justice and strong institutions” [16]. Not all 17 UN SDGs are relevant to a company’s internal stakeholders (this is the case, for example, for SDG “life under water”). To identify the relevant ones and sharpen their definitions in the internal corporate context, we developed and validated a mixed-method approach that ended up paraphrasing the broad UN SDGs into six corporate-relevant ISEs. These ISEs concerned health, education, diversity, monetary benefits, infrastructure, and atmosphere (Figure 1). Core to the approach is a state-of-the-art Natural Language Processing (NLP) framework that processed more than 350K geo-referenced reviews about 104 S&P 500 companies.
Data
Our aim was to understand and capture the microfoundations of ISEs; we did so in a bottom-up fashion, starting from the perspectives of employees. More specifically, we collected data from a popular company reviewing site, where current and, more likely, former employees write reviews about their own corporate experiences, ranging from job interviews to salaries to workplace culture. These reviews have been recently used in studies exploring corporate culture at scale [17]. As of 2021, there are 50M monthly visitors on the platform, and 70M reviews of 1.3M companies. To ensure quality reviews, the site: a) performs both automatic and manual content moderation; b) allows for full access to content only to users who register on the site and write at least one review each (encouraging neutral and unbiased reviews); and c) allows for posting maximum one review per employee per year. Our dataset consisted of reviews published over twelve years, from 2008 to 2020.
Each review consists of a title; a ‘pro’ portion (i.e., positive aspects of the company); a ‘con’ portion (i.e., its negative aspects); a set of four ratings on a [0,5] scale scoring the company’s balance, career, culture, and management; and a final overall rating of the company. Since reviewers have the option to include their location, we were able to identify the states for part of the reviews. To ensure the robustness of our text processing method, we retained companies that had at least 1,000 reviews and were present in at least 10 states, leaving us with a dataset of 358,527 reviews of 104 US-based companies (which represented 88.7% of the original dataset); 80% of these are S&P 500. As detailed in Supplementary Information, these 104 companies offer the same level of representativeness as the S&P 500 companies, in terms of the distribution of industry sectors and the geographic distribution across states. In addition to the reviews, we collected yearly stock growth values of the 104 companies from the Yahoo Finance Portal[18].
Methods
The three-step mixed-method approach for defining ISEs
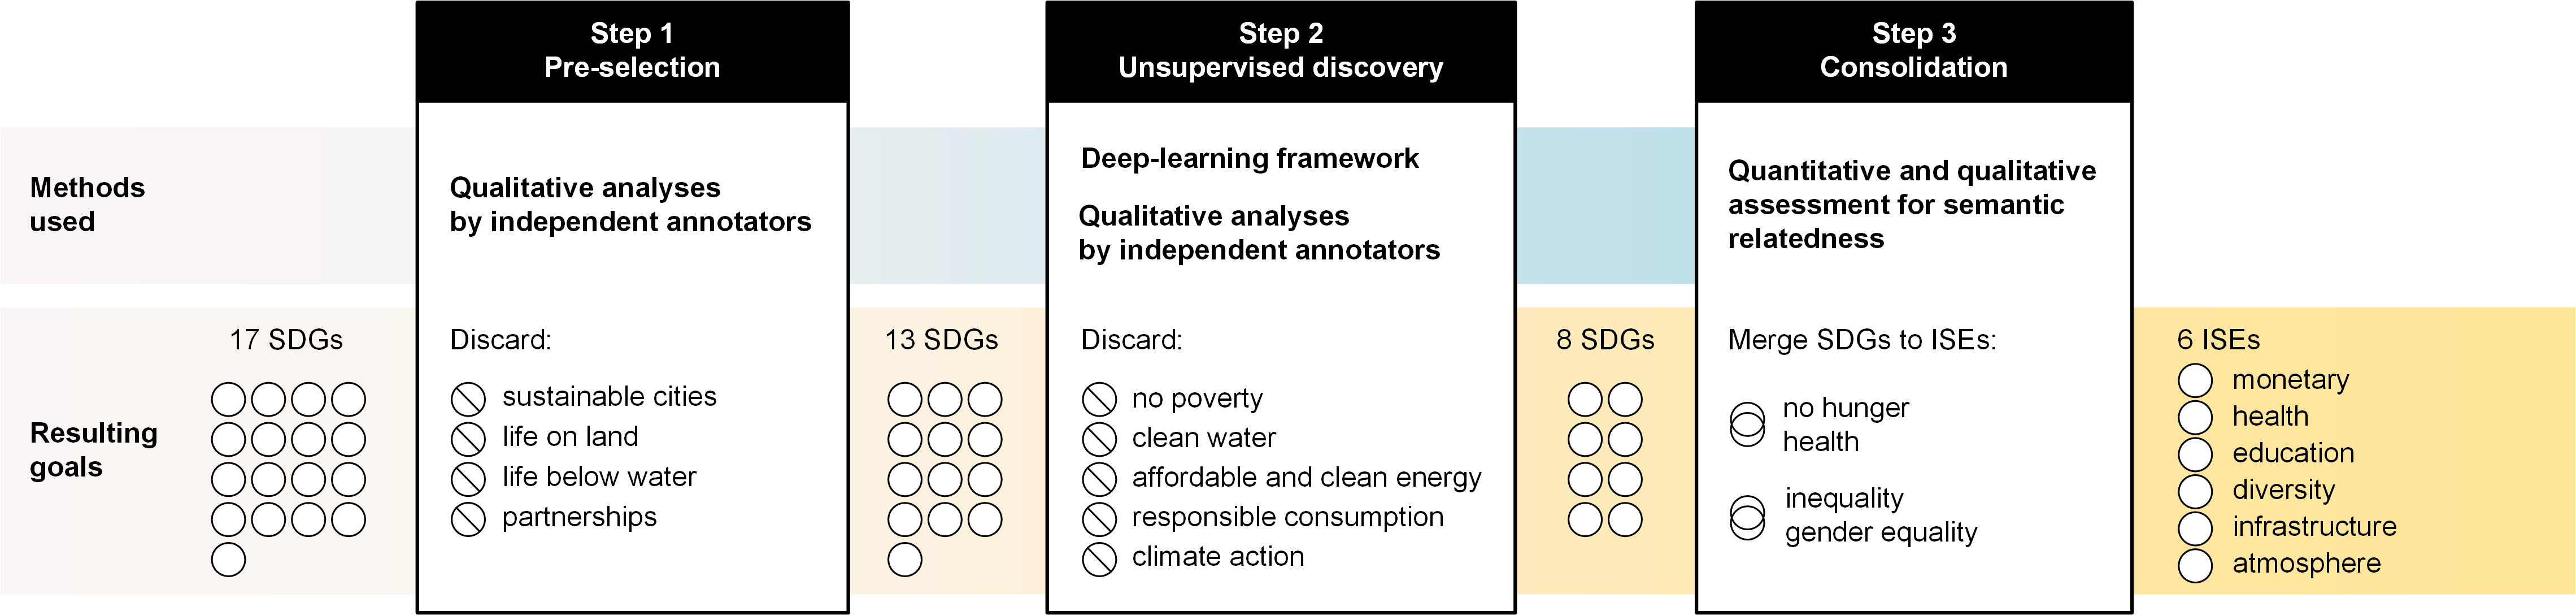
We developed a mixed-method approach to operationalize ISEs. This approach unfolded in three main steps, which are detailed in Supplementary Information and summarized here as follows (Figure 2):
- Step 1 - Pre-selection of goals:
-
Using a deductive content analysis [19], three independent annotators assessed each of the UN seventeen goals’ definitions and decided whether they applied to the corporate context or not. We took a conservative approach and discarded the goals that the annotators unanimously discarded, which ended up being four, leaving us with thirteen potentially relevant goals (after step 1 in Figure 2).
- Step 2 - Unsupervised discovery of goals:
-
An unsupervised deep-learning framework based on the sentence-level BERT algorithm [20] was developed (its technical architecture is discussed in Supplementary Information). This framework scored each employee’s review against the 13 goals found in the previous step. The framework identified the five reviews most relevant to each goal, and three other independent annotators then manually assessed the relevance of these reviews. To conservatively retain only the goals that were accurately identified by the framework, we discarded any goal for which the majority of the annotators marked less than 4 of the goal’s 5 reviews as relevant (overall, the agreement among the annotators was high, i.e., Fleiss ). As a result, five goals were dropped; these had more to do with environmental sustainability (e.g., “clean water”, “climate change”) than with internal corporate affairs. This left us with eight goals (after step 2 in Figure 2).
- Step 3 - Consolidation of goals:
-
Finally, the three annotators assessed if any of the eight goals ended up acquiring very similar meanings in company reviews. Two pairs were merged, ultimately leaving us with six ISEs (after step 3 in Figure 2). Table 1 reports the names of these ISEs (first column), corresponding original UN SDGs (second column), and related excerpts of real reviews (third column).
Metrics
We studied the six ISEs at the company-level to test whether commitment to ISEs manifests itself at a micro-level (e.g., in a company’s growth). To that end, we computed the score of the ISE for company as the fraction of ’s reviews that mentioned :
| (1) |
where is the set of ’s reviews, is the SBERT (Sentence-BERT) vector of ISE (the six vectors/phrases for the ISEs are in Supplementary Information in Table 4), and is the thresholded SBERT similarity score [20] between the SBERT vector of review and the SBERT vector of ISE . More precisely, is defined as:
| (2) |
We chose the threshold of by computing the mean SBERT similarity for each of the 8 goals left after stage 2 of our 3-step ISE selection procedure as we had established that the NLP method worked well for these 8 goals. We then took the average value of the eight means (which was ). Based on further validation, we also established that the SBERT values for all ISEs were not equally distributed and, as such, the fixed generalized threshold of had to be paired with an ISE-specific threshold: based on our experiments reported in Supplementary Information, this latter threshold value (denoted as ) was the 95% percentile of the ISE’s distribution, which is the very same threshold found in previous studies [21]. We finally ranked companies by their score for each ISE. Note that, by review, we mean the pro portion of the review. That is because we were mostly interested in positive initiatives (pros) rather than shortcomings (cons). In Supplementary Information, we indeed show that, if we were to instead take cons (or combine cons with pros together), our deep-learning framework would perform worse in the two validation steps of our mixed-method approach (steps 2 and 3).
| Internal Sustainability Efforts (ISEs) | UN Goal | Example of Review Sentence | |||||
|
|
|
|||||
| Health | good health and wellbeing |
|
|||||
|
quality education |
|
|||||
|
gender equality | “Respect for gender equality”. | |||||
|
|
“Good infrastructure to support the work environment”. | |||||
|
|
|
Results
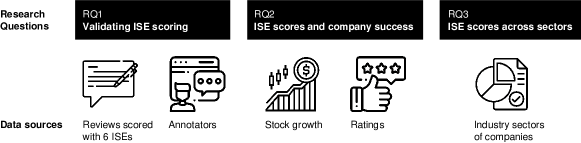
We identified each ISE’s keywords from all reviews associated with it (e.g., the keyword ‘salary’ for the ‘monetary’ ISE), and ascertained through a principled linguistic validation that the keywords are semantically related to the ISE (RQ1). After establishing that our ISE scoring is valid, we scored the companies, and studied the relationship between a company’s ISE scores and its success in the forms of company ratings and stock growth (RQ2), and uncovered ISE scores variability across industry sectors (RQ3). Figure 3 summarizes our analyses and the data used for them.
RQ1: Does our machine learning method capture Internal Sustainability Efforts?
We validated our deep learning method for detecting ISEs based on a triangulation approach [22], during which we first established its face validity by inspecting the language used in reviews, and subsequently examined our results with respect to external reports. We discuss the former next, while the latter is detailed in Supplementary Information.
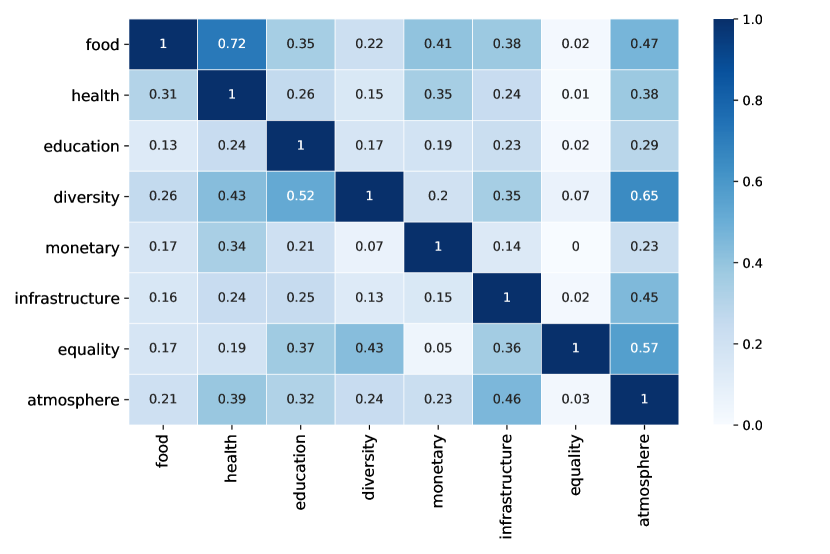
To establish the face validity of the proposed ISE detection method, we took the linguistic approach explored by Das Swain et al. [17] First, for each of the six ISEs, we obtained the most frequent keywords — 1, 2, 3, and 4-grams from the reviews deemed relevant by our method. We then computed the TF-IDF scores for such n-grams, where each document was comprised of all shortlisted reviews for each ISE. Finally, we ranked keywords for each ISE based on their TF-IDF score. This allowed us to find the keywords judged to be important for a certain ISE by our embedding-based method. The top ranked keywords for the six ISEs are visualized as a heatmap in Figure 4.
We observed many keywords to be highly discriminative of the ISE they associated with: for example, keywords ‘pay good’ and ‘salary’ were (correctly) ranked highly for ISE ‘monetary’ only; ‘health’, ‘health benefits’, and ‘take care’ were ranked highly for ISE ‘health’ instead. Keywords ‘opportunities learn’, ‘experience’, ‘good train’, and ‘program’ were uniquely strongly associated with ISE ‘education’. Keyword ‘flexibility’ was highly discriminative of ISE ‘diversity’; ‘industry’ and ‘technology’ were strongly associated with ISE ‘infrastructure’; lastly, n-grams like ‘positive work environment’ and ‘friendly work environment’ strongly associated with ISE ‘atmosphere’. Other keywords ranked highly in more than one ISE instead: this was the case, for example, for keywords ‘benefit worklife balance’ and ‘family’, which were highly associated with both the ‘health’ ISE (as one might expect), and to the ‘diversity’ ISE. Health-enhancing factors like work-life balance and flexible working conditions options have been shown to facilitate gender equality and improve the diversity of employees [23, 24], therefore it was promising that our method was capable of picking up these semantically-related concepts too.
Indeed the 6 ISEs we identified were not mutually exclusive concerns (and neither are the UN SDGs), and one may wonder to what extent they are semantically related. To shed light onto this question, we conducted a Principal Component Analysis (PCA) on s(u, i) at a company level to assess how much of the variance in the data could be explained by different principal components, and how those components related to the 6 ISEs. We found that, at company level, just two components explained 88% of the variance — specifically, the first component explained 73% and the second component explained 15%. We report the correlation between the first two PCA components and the six ISEs in the last two columns of Table 2.
We observed that all ISEs with the exception of ‘monetary’ were strongly correlated with the first component and weakly negatively correlated with the second component; on the other hand, ‘monetary’ was moderately correlated with both the first and second principal components. These two findings suggested that the ‘monetary’ ISE was orthogonal to the other five, and that these other five were strongly interconnected with one another. Indeed, one may expect that improving work-life balance has a positive impact on both the ‘health’ ISE and the ‘diversity’ ISE; on the other hand, improving monetary conditions may not directly affect other aspects of corporate internal sustainability. Overall, we thus found two main facets of employee-centred sustainability — a staff welfare-related one () and a financial benefits-related one (). To avoid multicollinearity, we used these two main facets of ISEs (rather than the six individual ones) to answer the following research questions.
| Monetary | Health | Education | Diversity | Infrastructure | Atmosphere |
|
|
|||||
| Monetary | 1.00 | 0.74 | 0.39 | 0.43 | 0.41 | 0.55 | 0.67 | 0.68 | ||||
| Health | 0.74 | 1.00 | 0.55 | 0.76 | 0.74 | 0.85 | 0.90 | 0.32 | ||||
| Education | 0.39 | 0.55 | 1.00 | 0.72 | 0.77 | 0.73 | 0.82 | -0.39 | ||||
| Diversity | 0.43 | 0.76 | 0.72 | 1.00 | 0.82 | 0.92 | 0.90 | -0.19 | ||||
| Infrastructure | 0.41 | 0.74 | 0.77 | 0.82 | 1.00 | 0.92 | 0.90 | -0.25 | ||||
| Atmosphere | 0.55 | 0.85 | 0.73 | 0.92 | 0.92 | 1.00 | 0.96 | -0.07 | ||||
| Staff Welfare (PC1) | 0.67 | 0.90 | 0.82 | 0.90 | 0.90 | 0.96 | 1.00 | 0.00 | ||||
| Financial Benefits (PC2) | 0.68 | 0.32 | -0.39 | -0.19 | -0.25 | -0.07 | 0.00 | 1.00 |
RQ2: Is sustainability associated with company success?
There are several ways to measure a company’s success. We considered two complementary ones: the online ratings it received from its employees (available from the company reviewing site), and its financial position (measured as stock growth).
Sustainability and company online ratings. Employees have the option to rate the company they are reviewing based on four different facets — balance, career, culture, management, plus a fifth company’s overall one. We thus investigated to what extent a company’s success across these five facets could be predicted based on the company’s commitments to the ISEs. We did so by first aggregating ISE scores and ratings at a company level. The aggregation reduces the endogenous association between company ratings and ISEs in individual reviews. We then conducted an OLS regression using our two main sustainability facets as predictors (‘staff welfare’ and ‘financial benefits’) while also controlling for a company’s total number of reviews. As reported in Table 3, we found that these two sustainability facets could explain up to 64% of the variance in a company’s ratings; particularly noteworthy was that the staff welfare facet of corporate internal sustainability was strongly positively correlated with all aspects of a company’s success, including balance and culture, in line with previous research findings [25, 26].
| Balance | Career | Culture | Management | Overall | |
| Const | 16.465∗∗ | 29.995∗∗∗ | 30.165∗∗∗ | 24.863∗∗∗ | 5.651 |
| (6.286) | (4.723) | (5.990) | (5.614) | (4.740) | |
| Staff Welfare (PC1) | 0.732∗∗∗ | 0.681∗∗∗ | 0.721∗∗∗ | 0.615∗∗∗ | 0.766∗∗∗ |
| (0.095) | (0.071) | (0.090) | (0.085) | (0.067) | |
| Financial Benefits (PC2) | 0.183∗ | -0.164∗∗ | -0.160 | -0.201∗∗ | 0.313∗∗∗ |
| (0.109) | (0.082) | (0.104) | (0.097) | (0.076) | |
| Total Reviews | 0.102 | ||||
| (0.063) | |||||
| Observations | 84 | 84 | 84 | 84 | 84 |
| 0.443 | 0.534 | 0.444 | 0.405 | 0.658 | |
| Adjusted | 0.429 | 0.523 | 0.430 | 0.390 | 0.645 |
| Residual Std. Error | 16.283(df = 81) | 12.234(df = 81) | 15.515(df = 81) | 14.541(df = 81) | 11.355(df = 80) |
| F Statistic | 32.174∗∗∗ | 46.461∗∗∗ | 32.289∗∗∗ | 27.518∗∗∗ | 51.319∗∗∗ |
| (df = 2.0; 81.0) | (df = 2.0; 81.0) | (df = 2.0; 81.0) | (df = 2.0; 81.0) | (df = 3.0; 80.0) | |
| Note: | ∗p0.1; ∗∗p0.05; ∗∗∗p0.01 | ||||
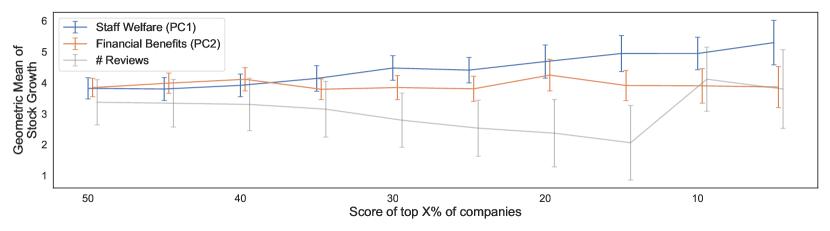
Sustainability and company stock growth. We obtained stock data for 84 of the 104 companies in our dataset, from 2009 to 2019, using the Yahoo Finance portal [18]. For each company, we calculated the geometric mean of its stock growth during such period; we used the geometric mean since the distribution of stock growth values across companies was heavy-tailed (as reported in Supplementary Information). To inspect whether a company’s financial success (measured as stock growth) was associated with its sustainability efforts, we then plotted in Figure 5 the geometric mean of its stock growth ( axis) against its ranking in terms of the staff welfare facet of sustainability and the financial benefits facet of sustainability ( axis). We also included in the figure the total number of reviews, to check whether stock growth was merely associated with the company’s popularity rather than its internal sustainability practices.
As showed in Figure 5, companies that focused on both staff welfare and financial benefits sustainability tended to have high stock growth; between the two facets, it was staff welfare that most strongly associated with high stock growth, in line with previous research [27]. Notably, companies with high stock growth did not invest as heavily in financial sustainability only, bolstering previous work which noted that focusing on staff welfare sustainability could lead to greater stakeholder engagement even without high pay [28]. Overall, our results suggest that a company’s financial success is associated with its investment in internal sustainability practices, but only if they focus on a holistic approach to sustainability that tackles both staff welfare and financial benfits.
RQ3: Is sustainability associated with specific industry sectors?
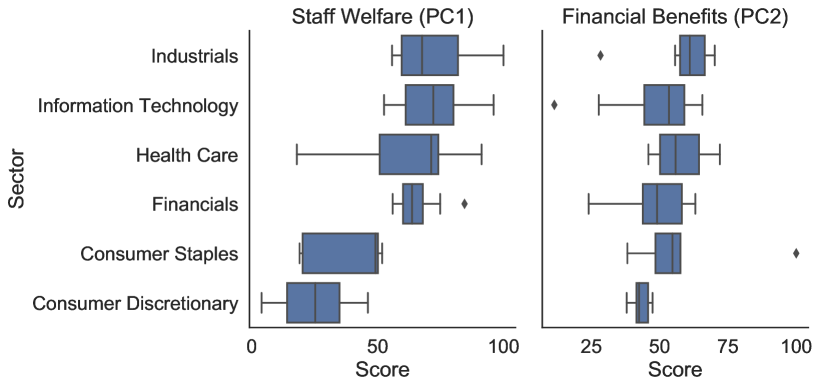
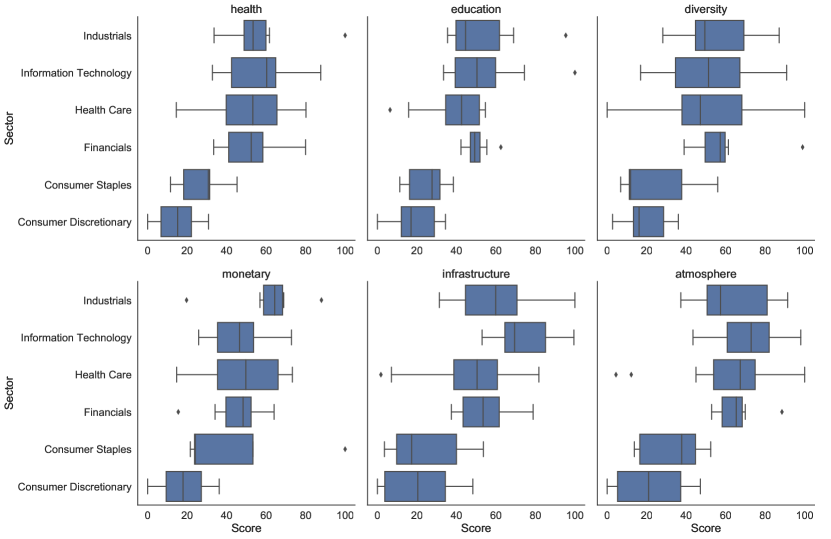
To examine whether certain industry sectors were leading the corporate sustainability agenda, we plotted in Figure 6 the distribution of the two facets of sustainability for each industry sector. We further conducted a MANOVA analysis and found the differences in sustainability scores to be significant across sectors. In terms of staff welfare sustainability efforts, we found Industrials and IT to lead, possibly due to recent investment in this type of sustainability initiatives [29]. The Financial sector followed, while the health care one exhibited very high variability. This could be explained by health care professionals often sacrificing personal well-being and work-life balance due to the highly demanding nature of their work [30, 31]. We found consumer staples and consumer discretionary to lag significantly behind. This was also the case when looking at financial benefits, although differences between sectors were smaller along this facet of internal sustainability efforts.
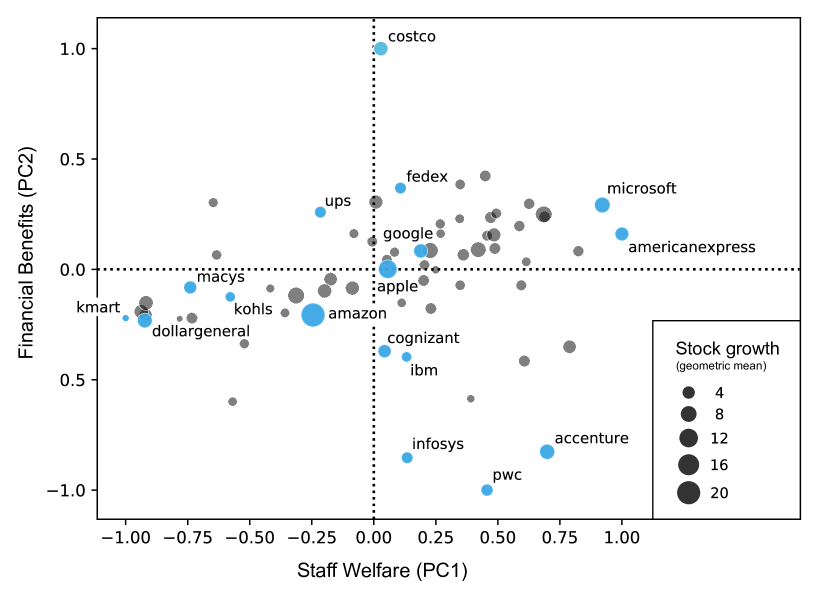
Figure 6 offered an overview of engagement with sustainability efforts at industry sector level. To reveal more nuanced variations within the same sector, we plotted individual companies’ engagement with each of the two main sustainability facets in Figure 7. Notable variations emerged: our sector-based analysis revealed low sustainability scores for consumer discretionary and staples companies overall; upon closer inspection, we found some companies (e.g., Dollar General, K-mart) to indeed score low on both facets of ISEs, while others (e.g., Costco) to score low on staff welfare but high in the financial benefits facet of sustainability, a phenomenon noted in previous work too [32]. Variations emerged also within the IT sector, previously showed to be leading sustainability efforts on both dimensions: a more nuanced investigation revealed high sustainability scores on both financial benefits and staff welfare ISEs for companies like Microsoft, Google, and Apple; however, more traditional IT companies like Infosys, IBM, and Cognizant scored high on staff welfare sustainability only.
One must be mindful that comparisons among (same-sector) companies were further affected by the type of employees reviewing their employer. In our study, this was apparent for companies like Amazon, that enjoyed high stock growth but surprisingly scored low for both types of sustainability. Despite the company employing a large number of software engineers as well as warehouse workers, upon close inspection, we found the most common roles of Amazon employees in our reviews to be ‘warehouse associate’ and ‘warehouse worker’. Previous research did find logistic workers at Amazon to face poor working conditions [33, 34], corroborating the low sustainability scores that our method computed for this company. Furthermore, previous literature noted that Amazon’s lack of focus on sustainability practices has yet to hurt its profitability [33, 34].
Discussion
Many companies are under constant pressure to invest in a wide range of internal sustainability practices designed to enhance working conditions [35, 36]. However, the benefits of such investments for both the company and its stakeholders are often difficult to assess. By examining how employees form perceptions of their company’s engagement with ISEs, this research spells out the microfoundations of internal sustainability and provides evidence of the strategic importance of investing in business practices and policies geared towards ISEs [2, 37].
By examining how the wider UN SDGs agenda can be translated into diverse internal corporate efforts directed towards employees, our work offers substantive methodological, conceptual, and empirical contributions to internal sustainability research and managerial practice. More specifically, it offers two main theoretical contributions. The first has to do with the conceptualization of ISEs. We have shown how the sustainability agenda brought forward by the introduction of the UN SDGs informs and shapes six sustainability efforts within a company. Efforts to do with health, education, diversity, monetary benefits, supporting infrastructure, and a supportive atmosphere. While the existing literature often presents sustainability as a monolithic construct [38, 39], our two-factor conceptualization of ISEs delineated the two core strategic aspects that companies should carefully balance when implementing ISEs: one aspect had to do with traditional financial benefits (e.g., salary, bonuses), and the other had to do with broader aspects of staff welfare (e.g., diversity, atmosphere). The second theoretical implication enhances the understanding of what makes companies economically successful and how internal sustainability practices differ by sector, especially in emerging sectors like IT.
This work also offers practical implications, and it does so for three main stakeholders. The first stakeholder consists of scholars. Our method is grounded in the UN SDGs and performed consistently well across several rounds of external validation. By providing a robust framework for examining mentions of ISEs through automated text analysis, new textual datasets could be academically studied in the future.
The second stakeholder consists of policy makers. We showed that high levels of ISEs engagement (not only for financial aspects but also for general staff welfare) were associated with high economic growth. This result supports policies in recent years that have fostered a corporate culture that goes beyond financial rewards and are oriented towards equality and well-being [40]. Beyond company efforts, policy makers themselves would be able to strategically decide which ISEs to incentivize with taxation schemes or set out a legislation agenda that would attract workers who care about specific ISEs. To inform more targeted interventions, we also showed that the impact of engaging with ISEs varies across sectors: companies in the IT and business-to-business industrial goods sectors outperformed companies that produce and commercialize consumer goods. This finding is noteworthy as previous research shows that sustainability signals tend to be stronger in business-to-consumer than in business-to-business market contexts (c.f., [41])
The third stakeholder consists of company managers. By reflecting employees’ perceptions, our analytical framework represents an invaluable tool to operationalize the microfoundations of internal sustainability, assess how corporate efforts in this area directly impact employees, and quantify and qualify the extent to which corporate engagement with ISEs becomes visible to employees across different organizational levels.
Our work comes with five main limitations though. The first is that our list of ISEs may not be accurate or exhaustive. While the corporate sustainability literature has focused on initiatives that are external to a company and have an impact on the wider world’s sustainability, the practices that are internal to a company and have an impact on employees received less attention. As a result we only found non-comprehensive frameworks for internal sustainability practices suggested, such as those focusing on social aspects only [42]. To tackle that, we started from the well-grounded definitions of the UN sustainability goals, used a principled mixed-method approach to paraphrase those most relevant to the corporate context, and validated the resulting list with both qualitative and quantitative approaches. These approaches are generalizable, in that they could be used to study other constructs appearing in reviews in the future (e.g., how employees in a company deal with stress).
The second limitation is that, since the reviewing site was founded in 2008, key financial events prior 2008 (e.g., the dot-com bubble in the late 1990s) may have impacted our results but could not be accounted for because of lack of data.
The third limitation is that the number of companies under study is invariably limited. We were able to study 104 major companies, largely because the other companies had a limited number of reviews that did not allow for automatic processing. Future work should explore alternative mixed-method approaches (likely qualitative ones) to study ISEs for these companies.
The fourth limitation is the lack of causal claims. Given our data, we could not assess the causal direction between ISEs and socio-economic returns. More specifically, we could not assess whether focusing on ISEs led to better socio-economic returns (e.g., stock growth), whether better socio-economic conditions created a breeding ground for fostering ISEs, or whether these two causal relations were in a self-reinforcing cycle.
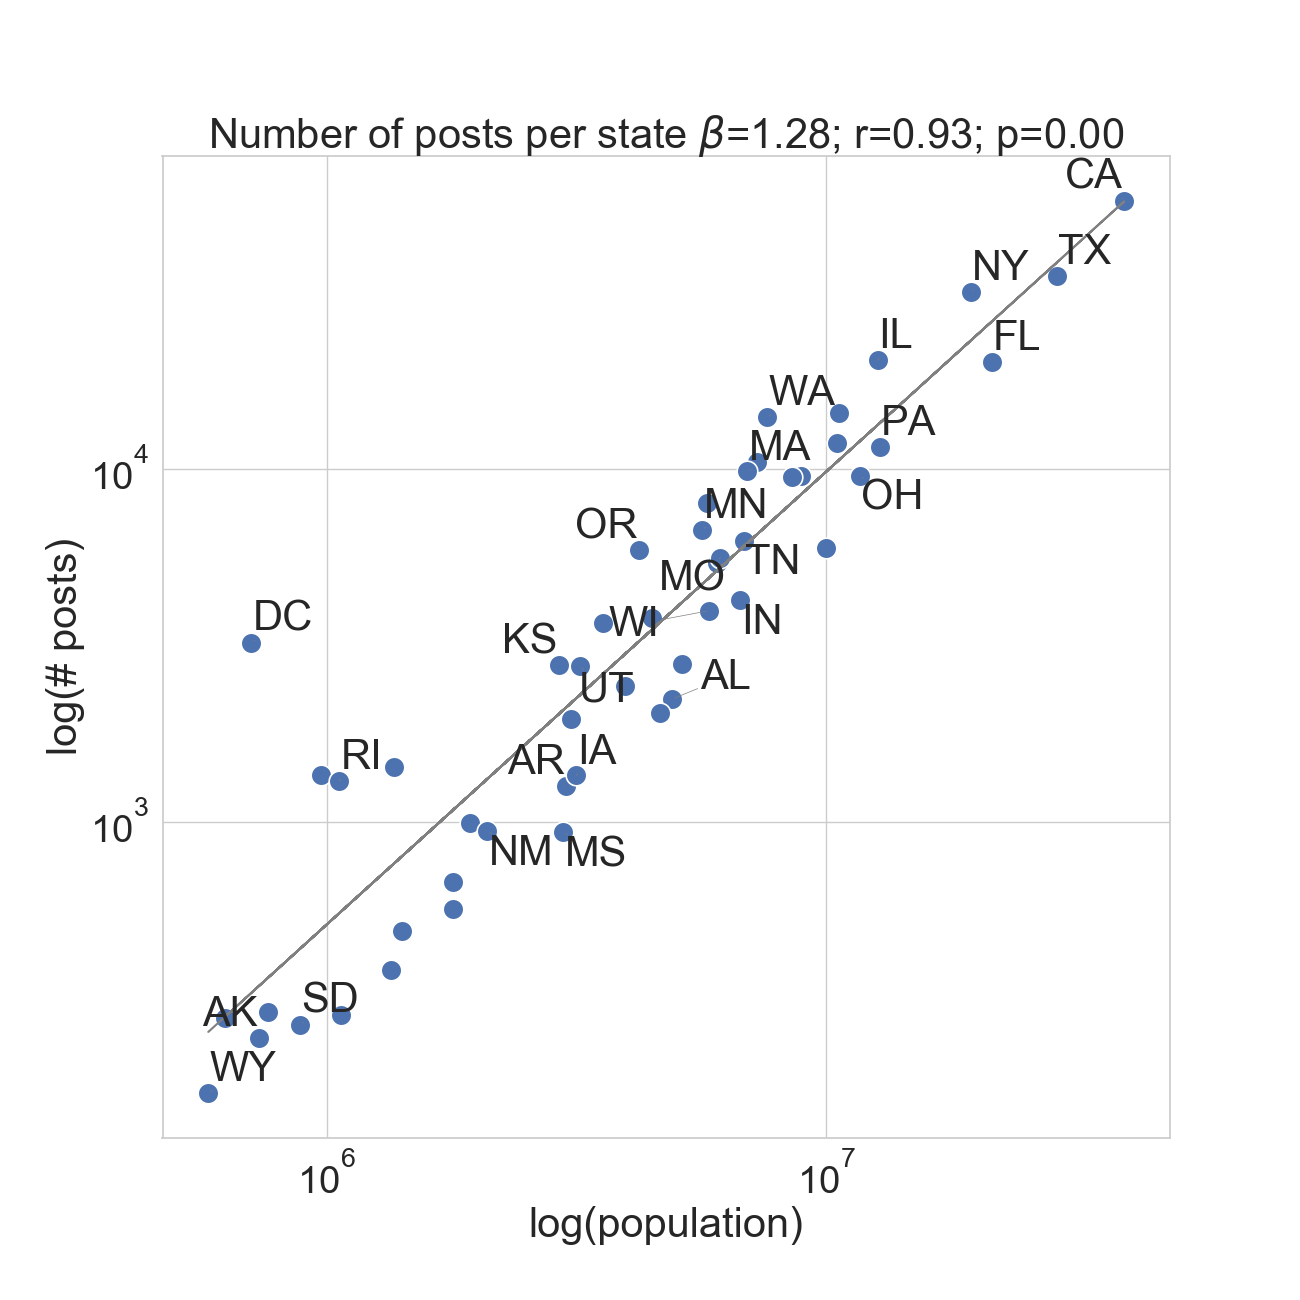
The fifth and final limitation has to do with the representativeness of our data. Companies in certain sectors (e.g., IT) may have been reviewed more often than those in other sectors (e.g., consumer discretionary). Despite that possibility, in Supplementary Information, we show that our data was still representative along three major dimensions: a) the distribution of industry sectors of the S&P 500 companies, which our data matched without over-representing any specific sector; b) official population in a state, which scaled linearly with the number of employees in the state in our data; and c) number of company headquarters in a state from official sources, which has a nearly perfect correlation with the number of headquarters per state in our data. Finally, despite the platform’s mechanisms to guarantee review quality, as discussed in the section Data, we acknowledge that potential self-selection bias could cause our reviewers’ sample to be non-representative. To reduce the impact of such a bias and ensure robustness, we restricted our analyses to companies having at least 1000 reviews.
Data availability
We made our code and data available in a readily usable format (http://social-dynamics.net/InsiderStories/) for reproducibility. For each company, we shared the following attributes: company name, #total reviews, #ISE reviews, average rating, rating of work-life balance, rating of career prospects, rating of the company, rating of the culture, rating of the management, ISE type, stock values/growth for: 2009, 2012, 2014, 2019, and industry sector.
References
- [1] Bai, C. & Sarkis, J. A supply chain transparency and sustainability technology appraisal model for blockchain technology. \JournalTitleInternational Journal of Production Research 58, 2142–2162 (2020).
- [2] de Ruyter, K. et al. Reimagining marketing strategy: driving the debate on grand challenges (2021).
- [3] Serafeim, G. Social-impact efforts that create real value. \JournalTitleHarvard Business Review 98, 38–48 (2020).
- [4] Wang, H., Jia, M., Xiang, Y. & Lan, Y. Social performance feedback and firm communication strategy. \JournalTitleJournal of Management 48, 2382–2420 (2022).
- [5] Gonzalez-Arcos, C., Joubert, A. M., Scaraboto, D., Guesalaga, R. & Sandberg, J. “how do i carry all this now?” understanding consumer resistance to sustainability interventions. \JournalTitleJournal of Marketing 85, 44–61, DOI: 10.1177/0022242921992052 (2021). https://doi.org/10.1177/0022242921992052.
- [6] Martín-de Castro, G. Exploring the market side of corporate environmentalism: Reputation, legitimacy and stakeholders’ engagement (2021).
- [7] Paine, L. S. Sustainability in the boardroom. \JournalTitleHarvard Business Review 92, 86–94 (2014).
- [8] Chatzopoulou, E.-C., Manolopoulos, D. & Agapitou, V. Corporate social responsibility and employee outcomes: Interrelations of external and internal orientations with job satisfaction and organizational commitment. \JournalTitleJournal of Business Ethics 179, 795–817 (2022).
- [9] Kelliher, C., Richardson, J. & Boiarintseva, G. All of work? all of life? reconceptualising work-life balance for the 21st century. \JournalTitleHuman Resource Management Journal 29, 97–112 (2019).
- [10] Nadeem, M., Zaman, R. & Saleem, I. Boardroom gender diversity and corporate sustainability practices: Evidence from australian securities exchange listed firms. \JournalTitleJournal of Cleaner Production 149, 874–885, DOI: https://doi.org/10.1016/j.jclepro.2017.02.141 (2017).
- [11] Cassino, D. & Besen-Cassino, Y. Race, threat and workplace sexual harassment: The dynamics of harassment in the united states, 1997–2016. \JournalTitleGender, Work and Organization 26, 1221–1240 (2019).
- [12] Giauque, D., Anderfuhren-Biget, S. & Varone, F. Stress and turnover intents in international organizations: social support and work–life balance as resources. \JournalTitleThe International Journal of Human Resource Management 30, 879–901 (2019).
- [13] Wang, J. & Verma, A. Explaining organizational responsiveness to work-life balance issues: The role of business strategy and high-performance work systems. \JournalTitleHuman Resource Management 51, 407–432 (2012).
- [14] Peloza, J. & Shang, J. How can corporate social responsibility activities create value for stakeholders? a systematic review. \JournalTitleJournal of the Academy of Marketing Science (2011).
- [15] WCED, S. W. S. World commission on environment and development. \JournalTitleOur common future 17, 1–91 (1987).
- [16] Nations, U. Transforming our world: The 2030 agenda for sustainable development. \JournalTitleNew York: United Nations, Department of Economic and Social Affairs (2015).
- [17] Das Swain, V. et al. Modeling organizational culture with workplace experiences shared on glassdoor. In Proceedings of the 2020 CHI conference on human factors in computing systems, 1–15 (2020).
- [18] Yahoo Finance portal. https://finance.yahoo.com. Accessed: 2021-08-02.
- [19] Elo, S. & Kyngäs, H. The qualitative content analysis process. \JournalTitleJournal of advanced nursing 62, 107–115 (2008).
- [20] Reimers, N. & Gurevych, I. Sentence-bert: Sentence embeddings using siamese bert-networks. In Proceedings of the 2019 Conference on Empirical Methods in Natural Language Processing and the 9th International Joint Conference on Natural Language Processing (EMNLP-IJCNLP), 3982–3992 (2019).
- [21] Choi, M., Aiello, L. M., Varga, K. Z. & Quercia, D. Ten social dimensions of conversations and relationships. In Proceedings of The ACM Web Conference (WWW), 1514–1525, DOI: 10.1145/3366423.3380224 (2020).
- [22] Denzin, N. K. Triangulation 2.0. \JournalTitleJournal of mixed methods research 6, 80–88 (2012).
- [23] Chung, H. & Van der Lippe, T. Flexible working, work–life balance, and gender equality: Introduction. \JournalTitleSocial Indicators Research 1–17 (2018).
- [24] Lyonette, C. Part-time work, work–life balance and gender equality. \JournalTitleJournal of Social Welfare and Family Law 37, 321–333 (2015).
- [25] Rao, I. Work-life balance for sustainable human development: Cultural intelligence as enabler. \JournalTitleJournal of Human Behavior in the Social Environment 27, 706–713 (2017).
- [26] Isensee, C., Teuteberg, F., Griese, K.-M. & Topi, C. The relationship between organizational culture, sustainability, and digitalization in smes: A systematic review. \JournalTitleJournal of Cleaner Production 122944 (2020).
- [27] Diversity, Equity, and Inclusion Still Matter in a Pandemic. https://www.bcg.com/publications/2020/value-of-investing-in-diversity-equity-and-inclusion-during-a-pandemic. Accessed: 2021-08-06.
- [28] Ziegler, A., Schröder, M. & Rennings, K. The effect of environmental and social performance on the stock performance of european corporations. \JournalTitleEnvironmental and Resource Economics 37, 661–680 (2007).
- [29] Higón, D. A., Gholami, R. & Shirazi, F. Ict and environmental sustainability: A global perspective. \JournalTitleTelematics and Informatics 34, 85–95 (2017).
- [30] Schwartz, S. P. et al. Work-life balance behaviours cluster in work settings and relate to burnout and safety culture: a cross-sectional survey analysis. \JournalTitleBMJ Quality and Safety 28, 142–150 (2019).
- [31] Shanafelt, T. D. et al. Changes in burnout and satisfaction with work-life balance in physicians and the general us working population between 2011 and 2014. In Mayo clinic proceedings, vol. 90, 1600–1613 (Elsevier, 2015).
- [32] Cascio, W. F. Decency means more than “always low prices”: A comparison of costco to wal-mart’s sam’s club. \JournalTitleAcademy of Management perspectives 20, 26–37 (2006).
- [33] Amazon’s no show on sustainability. https://www.theguardian.com/sustainable-business/amazon. Accessed: 2021-08-06.
- [34] Chan, I. Examining the cost of Amazon. com’s success using the triple bottom line. Master’s thesis, Humboldt State University (2015).
- [35] Barko, T., Cremers, M. & Renneboog, L. Shareholder engagement on environmental, social, and governance performance. \JournalTitleJournal of Business Ethics 180, 777–812 (2022).
- [36] Jakob, E. A., Steinmetz, H., Wehner, M. C., Engelhardt, C. & Kabst, R. Like it or not: when corporate social responsibility does not attract potential applicants. \JournalTitleJournal of Business Ethics 178, 105–127 (2022).
- [37] Zhao, X., Wu, C., Chen, C. C. & Zhou, Z. The influence of corporate social responsibility on incumbent employees: A meta-analytic investigation of the mediating and moderating mechanisms. \JournalTitleJournal of Management 48, 114–146 (2022).
- [38] Chen, Z., Hang, H., Pavelin, S. & Porter, L. Corporate social (ir) responsibility and corporate hypocrisy: Warmth, motive and the protective value of corporate social responsibility. \JournalTitleBusiness Ethics Quarterly 30, 486–524 (2020).
- [39] Liu, A. Z., Liu, A. X., Wang, R. & Xu, S. X. Too much of a good thing? the boomerang effect of firms’ investments on corporate social responsibility during product recalls. \JournalTitleJournal of Management Studies 57, 1437–1472 (2020).
- [40] Triana, M. d. C., Jayasinghe, M., Pieper, J. R., Delgado, D. M. & Li, M. Perceived workplace gender discrimination and employee consequences: A meta-analysis and complementary studies considering country context. \JournalTitleJournal of management 45, 2419–2447 (2019).
- [41] Hoejmose, S., Brammer, S. & Millington, A. “green” supply chain management: The role of trust and top management in b2b and b2c markets. \JournalTitleIndustrial Marketing Management 41, 609–620 (2012).
- [42] Baumgartner, R. J. & Ebner, D. Corporate sustainability strategies: sustainability profiles and maturity levels. \JournalTitleSustainable development 18, 76–89 (2010).
- [43] Devlin, J., Chang, M.-W., Lee, K. & Toutanova, K. Bert: Pre-training of deep bidirectional transformers for language understanding. \JournalTitlearXiv preprint arXiv:1810.04805 (2018).
- [44] Morgan, J. The employee experience advantage: How to win the war for talent by giving employees the workspaces they want, the tools they need, and a culture they can celebrate (John Wiley and Sons, 2017).
- [45] Burritt, R. L. & Schaltegger, S. Sustainability accounting and reporting: fad or trend? \JournalTitleAccounting, Auditing and Accountability Journal (2010).
- [46] GENDER EQUALITY IN THE U.S. assessing 500 leading companies on workplace equality including healthcare benefits. https://equileap.com/wp-content/uploads/2020/12/Equileap_US_Report_2020.pdf. Accessed: 2021-08-06.
- [47] The Fashion Transparency Index 2021. https://www.fashionrevolution.org/about/transparency/. Accessed: 2021-08-06.
- [48] Webber, W., Moffat, A. & Zobel, J. A similarity measure for indefinite rankings. \JournalTitleACM Transactions on Information Systems (TOIS) 28, 1–38 (2010).
Ethical approval and informed consent statement
This article does not contain any studies with human participants performed by any of the authors.
Contributions of the authors
All authors contributed to the research design and writing of the paper. IS was mainly responsible for the linguistics and statistical analysis with guidance from SS, LC, and DQ. SS cleaned, collected and pre-processed the data. MM provided theoretical guidance. All authors wrote, read, and approved the final manuscript.
Competing interests
The authors declare no competing interests.
Acknowledgements
We thank Dr. Edyta Bogucka for her help with some of the figures in this manuscript.
Supplementary Information
Appendix A Details of the dataset
We collected a total of 713,018 reviews published by current and former employees on a popular company reviewing site from the start of 2008 up until the first quarter of 2020. We filtered out reviews belonging to non-US based companies, yielding a total of 439,163 reviews across unique companies, including 378 S&P 500 companies. The average rating across companies ranges from a minimum value of up to a maximum value of (.
Appendix B Data Representativeness
We analyzed a total of 358,527 reviews of companies with at least 1000 reviews and presence in at least 10 U.S. states. The period analyzed was between 2008 to 2020. All 51 U.S. states are represented in our sample (Table 4), with California (57,512 reviews) and Wyoming (171 reviews) accounting for the highest and the lowest number of reviews respectively. The reviews span across 11 industries that were classified according to the Global Industry Classification Standard (GICS). Companies in the Consumer Discretionary industry accumulated the highest number of reviews, while companies operating in the Materials industry had the lowest (Table 5). The reviews were written by managers, sales associates, software engineers, analysts, among others (Table 6).
| States | # Reviews | # Offices |
| CA | 57512 | 104 |
| TX | 35208 | 104 |
| NY | 31645 | 103 |
| IL | 20313 | 103 |
| FL | 20097 | 104 |
| GA | 14437 | 103 |
| WA | 14015 | 100 |
| NC | 11812 | 102 |
| PA | 11548 | 101 |
| AZ | 10459 | 102 |
| MA | 9839 | 99 |
| NJ | 9574 | 99 |
| OH | 9567 | 102 |
| VA | 9480 | 101 |
| CO | 7988 | 102 |
| MN | 6725 | 93 |
| TN | 6274 | 99 |
| MI | 5982 | 100 |
| OR | 5892 | 99 |
| MO | 5601 | 99 |
| MD | 5417 | 98 |
| IN | 4262 | 98 |
| WI | 3967 | 89 |
| KY | 3788 | 94 |
| CT | 3659 | 91 |
| DC | 3222 | 93 |
| SC | 2807 | 94 |
| KS | 2776 | 92 |
| UT | 2759 | 96 |
| OK | 2426 | 88 |
| AL | 2230 | 89 |
| LA | 2042 | 91 |
| NV | 1963 | 89 |
| NH | 1427 | 84 |
| DE | 1359 | 67 |
| IA | 1358 | 82 |
| RI | 1311 | 66 |
| AR | 1263 | 82 |
| NE | 993 | 87 |
| NM | 944 | 79 |
| MS | 934 | 73 |
| ID | 676 | 69 |
| WV | 568 | 68 |
| HI | 491 | 56 |
| ME | 382 | 71 |
| ND | 290 | 53 |
| MT | 285 | 50 |
| VT | 278 | 44 |
| SD | 267 | 45 |
| AK | 244 | 42 |
| WY | 171 | 43 |
| GICSSector | # Reviews | # Companies |
| Consumer Discretionary | 55543 | 13 |
| Information Technology | 48677 | 12 |
| Financials | 40116 | 11 |
| Health Care | 26524 | 11 |
| Consumer Staples | 21703 | 5 |
| Industrials | 15568 | 7 |
| Communication Services | 10677 | 3 |
| Energy | 1468 | 1 |
| Materials | 1045 | 1 |
| Employee Title | # Reviews |
| Sales Associate | 7786 |
| Cashier | 3610 |
| Manager | 3514 |
| Software Engineer | 3409 |
| Customer Service Representative | 3202 |
| Director | 1999 |
| Store Manager | 1903 |
| Assistant Manager | 1837 |
| Project Manager | 1802 |
| Senior Manager | 1797 |
| Associate | 1745 |
| Pharmacy Technician | 1739 |
| Delivery Driver | 1584 |
| Senior Software Engineer | 1575 |
| Sales Associate/Cashier | 1498 |
| Employee Status | # Reviews |
| Current Employee | 143384 |
| Former Employee | 111551 |
| Former Intern | 5020 |
| Former Contractor | 3183 |
| Current Intern | 2789 |
Appendix C Methodological Details of our Approach for Detecting ISEs
In what follows, we provide further details on the mixed-method approach employed to conceptualize and operationalize the construct of Internal Sustainability Efforts (ISEs) from the broader sustainability agenda embedded in the United Nations (UN) Sustainable Development Goals (SDGs) (Table 7).
Step 1 - Human-driven pre-selection of goals
The SDGs are a collection of 17 interlinked global goals designed to be a ´´blueprint to achieve a better and more sustainable future for all". The SDGs were set up in 2015 by the United Nations General Assembly and are intended to be achieved by the year 2030. They are included in a UN Resolution called the 2030 Agenda.
Specifically, the 17 SDGs are: (1) No Poverty, (2) Zero Hunger, (3) Good Health and Well-being, (4) Quality Education, (5) Gender Equality, (6) Clean Water and Sanitation, (7) Affordable and Clean Energy, (8) Decent Work and Economic Growth, (9) Industry, Innovation and Infrastructure, (10) Reducing Inequality, (11) Sustainable Cities and Communities, (12) Responsible Consumption and Production, (13) Climate Action, (14) Life Below Water, (15) Life On Land, (16) Peace, Justice, and Strong Institutions, and (17) Partnerships for the Goals.
Given their broad scope, not all 17 UN goals might be relevant to internal corporate practices. To decide whether to retain or discard some UN SDGs, three independent annotators qualitatively assessed the definition and scope of each goal. They unanimously decided to discard the following four: ‘life below water’, ‘life on land’, ‘sustainable cities’, and ‘partnerships for goals’. More precisely, ‘life below water’, ‘life on land’, ‘sustainable cities’ mainly focus on the health of water bodies, land conservation, and cities, respectively. With the exception of highly specialized companies focused on the conservation of water bodies, land conservation, or cities, these goals are unlikely to be featured in employees’ reviews. ‘Partnership on goals’, on the other hand, was explicitly designed to foster collaboration between countries to facilitate sustainability. Since we focused entirely on US-based companies, we also excluded any goals that pertain to international co-operations. This initial qualitative stage resulted in the selection of 13 UN SDGs.
Step 2 - Unsupervised discovery of relevant reviews and goals
| id | Goal | Definition | |||
| SDG1 | no poverty | to end poverty in all its forms, everywhere | |||
| SDG2 | zero hunger |
|
|||
| SDG3 | good health and wellbeing | To ensure healthy lives and promote well-being for all at all ages. | |||
| SDG4 | quality education |
|
|||
| SDG5 | gender equality | Achieve gender equality and empower all women and girls | |||
| SDG6 | clean water and sanitation |
|
|||
| SDG7 | affordable and clean energy |
|
|||
| SDG8 | decent work and economic growth |
|
|||
| SDG9 | industry, innovation, and infrastructure |
|
|||
| SDG10 | reducing inequality | Reduce inequality within and among countries | |||
| SDG11 | sustainable cities and communities | Make cities inclusive, safe, resilient and sustainable | |||
| SDG12 | responsible consumption and production | To ensure sustainable consumption and production patterns | |||
| SDG13 | climate action | Take urgent action to combat climate change and its impacts | |||
| SDG14 | life below water |
|
|||
| SDG15 | life on land |
|
|||
| SDG16 | peace, justice, and strong institutions |
|
|||
| SDG17 | partnerships for the goals |
|
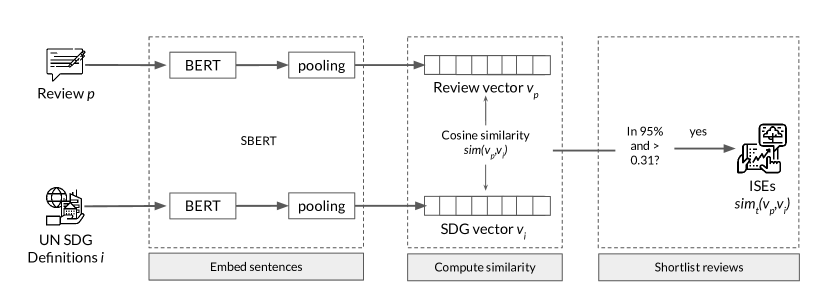
We obtained mentions of similarity in reviews by seeing how semantically related the review sentences were to the definitions of the remaining 13 SDG goals. To find the similarity between reviews and goal definitions, we employed a deep-learning method that is tailored to find the similarity between two sentences called sentence BERT or SBERT [20], which is summarized in Figure 9. The Bidirectional Encoder Representations from Transformers (BERT) [43], or its variants like RoBERTa and DistilBERT, is a family of state-of-the-art Natural Language Processing (NLP) methods that are trained on a vast corpora of data, enabling them to learn many different types of language phenomena. One such phenomenon is semantic similarity between different sentences. SBERT is trained especially for this task and has achieved state-of-the-art results in text similarity NLP tasks [20].
We embedded each of the 13 UN SDG definitions (Table 7) using SBERT to obtain 13 vectors of length 726 ( for the SDG). Each review consists of a title, pros, and cons. The pros and cons can be several sentences long, and, as we wanted to precisely capture the presence of ISEs, we split each review into individual sentences , ,… using a sentence tokenizer. We embedded each of these sentences as well with SBERT ( for the sentence in ). We then obtained the cosine similarity between and . Finally, since we required sustainability labels and scores at review level, we aggregated the sentence-level similarity scores by denoting the score of a review to be its highest scoring sentence:
| (3) |
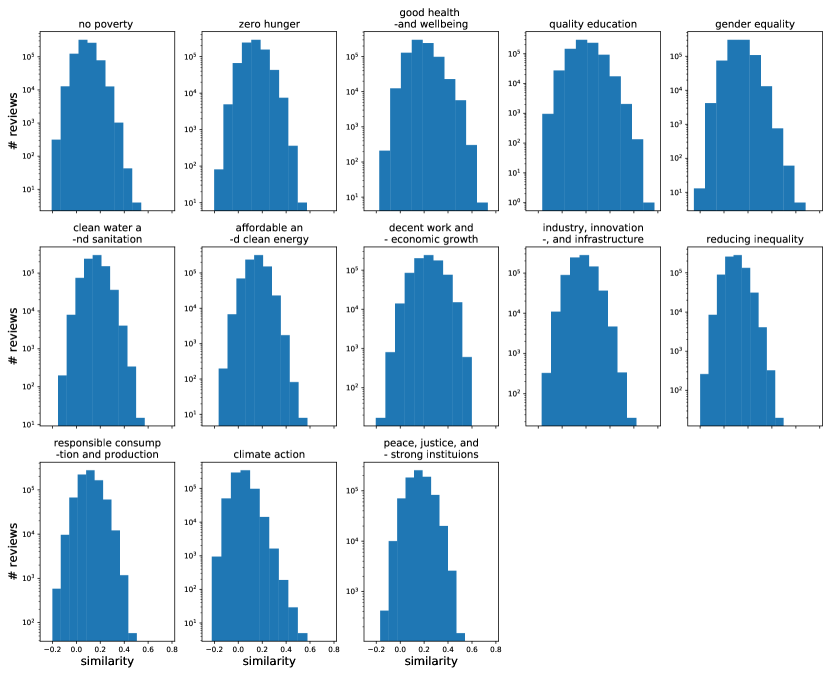
where is each post, is the definition of the UN sustainability goal, is the SBERT vector embedding of post , is the SBERT vector embedding of , and is the SBERT vector embedding of the sentence in post . We ended up with similarity scores ranging from -1 and 1 for all sentences for all 13 goals. The distribution of the scores is summarized in Figure 11. The similarity distributions are different for different goals; e.g., ‘decent work’ has higher average similarity compared to ‘gender equality’.
We considered whether to use pros, cons, or both to understand and operationalize the ISE construct. As sustainability is positively valenced, we hypothesized that company-led efforts on sustainability would be appreciated or brought up more frequently in pros rather than cons. Furthermore, our analysis revealed that the average similarity for pros was much higher than the average similarity for cons (Table 8), thus indicating that our NLP method is more effective when assessing sustainability concerns for pros compared to cons. This was also confirmed through a qualitative analysis involving 3 independent annotators who assessed the top most similar cons and found them to be not relevant to the ISE they were picked for (Fleiss = 0.91).
|
|
|||||||
| Goal | pros | cons | pros | cons | ||||
| Monetary | 0.234 | 0.153 | 0.180 | 0.202 | ||||
| Health | 0.185 | 0.110 | 0.177 | 0.084 | ||||
| Education | 0.194 | 0.114 | 0.175 | 0.112 | ||||
| Diversity | 0.130 | 0.080 | 0.130 | 0.026 | ||||
| Infrastructure | 0.163 | 0.113 | 0.174 | 0.084 | ||||
| Atmosphere | 0.157 | 0.102 | 0.175 | 0.058 | ||||
To then understand whether the above similarity metric correctly captured mentions of the pre-selected 13 SDGs in the corporate context, three independent annotators manually assessed the five highest ranked sentences for each goal based on their similarity score for that goal. By assessing the top five, we reached an understanding of the upper bound of our method. Agreement between annotators, measured using Fleiss Kappa, was high (0.83). For disagreements, we used the majority rating to obtain a final ground-truth label for relevance. We retained only those goals for which at least four of the top five highest ranked sentences were relevant to the goal (i.e, they mentioned concepts related to that goal, such as, mentions of gender diversity initiatives in the company). We found that the goals related to environmental sustainability, ‘clean water’ and ‘climate action’, faced word sense disambiguation issues with shortlisted sentences describing aspects of the work environment that are not pertinent to scope of this analysis (e.g., the cleanliness of office spaces). Thus, we discarded a further five UN goals in this step (clean energy, clean water, climate action, responsible consumption, and no poverty) and retained a total of eight goals.
To ensure high precision while accounting for the fact that the the similarity frequency distributions are different for different goals, we opted for a two-step selection procedure. To shortlist reviews, we followed an approach based on previous literature [17], and to filter out reviews that do not mention an ISE, we again used the similarity score. We formulated an SBERT similarity score, , that measures whether and the extent to which a post is about ISE with the following function:
| (4) |
where is the post, is the vector embedding the post, and is the vector embedding the UN’s definition of practices around . The post is about if two conditions are met: the post vector, ’s similarity to is above a fixed threshold 0.31, and greater than the 95% similarity value. The 0.31 threshold is the average of at the 95% threshold for the 8 goals selected at this stage. The last two columns of table 8 show the proportion of selected pros and cons based on . Note that the proportion of shortlisted reviews for cons were much lower than those shortlisted by pros (Table 8). Therefore, we further confirmed that pros are more appropriate for understanding ISEs conceptually and empirically. For the rest of the analysis, we utilize pros only.
Step 3 - Consolidation of goals
Sustainability goals are not mutually exclusive and a certain degree of overlap might be expected (e.g., work-life balance facilitates both health and gender equality, and is therefore a concept shared by both ISEs). However, there might be cases where two goals are so strongly related to one another that cannot be discerned from each other. To systematically tackle the issue of semantically overlapping goals, we plotted the content overlap for each pair of goals by computing the proportion of sentences that the two goals and have in common (Figure 10):
| (5) |
where , if , which is the set of ’s reviews relevant to goal ; and , if , which is the set of ’s reviews relevant to goal . The ordering of the goals in the overlap function impacts the denominator (the first goal goes to the denominator), and that is why is a non-symmetric metric.
We observe that the only overlap higher than occurs for the pair ‘food (no hunger)’ vs ‘health’. These have indeed strong conceptual relatedness in the corporate sector, and thus we proceeded by subsuming ‘no hunger’ under ‘health’.
We note that two other pairs of goals exhibited semantic relatedness close to 0.5: these were ‘supportive environment’ vs ‘supporting infrastructure’, and ‘diversity’ vs ‘gender equality’. To decide whether to combine or keep these pairs separate, the three annotators qualitatively assessed the top five reviews for each goal. Annotators found ‘supportive environment’ and ‘supporting infrastructure’ to cover related yet different concerns; however, they discovered that the ‘diversity’ goal (reducing inequality) was mostly expressed through mentions of ‘gender discrimination’, thus becoming almost indistinguishable from the concerns raised for the other goal ‘gender equality’. Consequently, we merged these two goals together to account for the identified conceptual overlaps.
In addition to Equation (1) in the main manuscript, we tested two other variants of the linear score , one exponentially increasing with similarity and the other logarithmically, to score (company or state) in terms of the ISE:
or
where is the number of reviews at study unit . We found that the two variations had results similar to the linear scaling in our linguistic validation. As such, in the main manuscript, we reported the results for the simplest, linear scoring.
Appendix D Method Validation
In the following section we provide further evidence of the process followed to validate our deep learning method for detecting ISEs.
ISEs and Online Ratings.
On the company review platform, employees have the option to rate the companies they are reviewing on five different facets — culture, balance, company, management, career, and an overall score. After aggregating the ISE scores at a company level, we found statistically significant positive correlation between our six ISE scores and the company’s ratings (Table 9). To see whether the correlations were merely an artifact of company popularity, we also computed the correlation coefficient between the total number of reviews of a company, our six ISEs scores, and the six company ratings (Table 9).
The number of company reviews were not correlated with the ratings, while being slightly (but usually not significantly) correlated with our scores. This indicates that our correlations are indeed capturing the relationship between our scores and the online ratings, rather than capturing overall company popularity. Our health ISE is most strongly correlated with balance . Since the health ISE captures mentions of work-life balance, this finding supported our conceptualization. The education, diversity, infrastructure, and atmosphere ISEs were strongly and significantly associated with the career rating. Education and training opportunities as well as infrastructure facilitate career growth [44]. Monetary was strongly correlated with the overall company rating , in line with previous research that found the importance of salary in company evaluations [32]. Finally, atmosphere is strongly associated with culture and management , thus indicating that this ISE captures relevant dimensions of corporate life.
| Rating | Monetary | Health | Education | Diversity | Infrastructure | Atmosphere |
|
||
| Culture | 0.29*** | 0.52*** | 0.57*** | 0.63*** | 0.66*** | 0.71*** | -0.09 | ||
| Balance | 0.48*** | 0.70*** | 0.32*** | 0.56*** | 0.58*** | 0.65*** | -0.15 | ||
| Management | 0.26** | 0.43*** | 0.57*** | 0.62*** | 0.64*** | 0.66*** | -0.06 | ||
| Career | 0.40*** | 0.49*** | 0.70*** | 0.66*** | 0.70*** | 0.72*** | -0.08 | ||
| Overall | 0.75*** | 0.66*** | 0.55*** | 0.61*** | 0.64*** | 0.72*** | -0.11 | ||
|
-0.15 | -0.29*** | -0.03 | -0.22* | -0.18 | -0.24* | 1.00*** |
| Gender report |
|
|
|
||||||||
| 0.285 | 0.285 | 0.236 | 0.246 | ||||||||
| random (baseline) | 0.186 | 0.183 | 0.185 | 0.185 |
| Fashion Report | |||||||
| Gender report | Gender Diversity | Financial Benefit |
|
Health | |||
| 0.22 | 0.073 | 0.100 | 0.227 | 0.136 | |||
| random (baseline) | 0.001 | -0.012 | 0.001 | -0.015 | 0.002 | ||
ISEs and external reports.
We used external sustainability reports to further assess the validity of our method. Reports on sustainability are few and fragmented [45], making it challenging to establish validity through external sources. However, we obtained two external reports on sustainability and compared the ranking of companies in them with our review-based ISE rankings. Overall, results of these comparisons found that our method substantially outperformed a random baseline. Specifically, we utilized two reports. The first report contained gender diversity indicators of S&P 500 companies [46], providing a ranking of 25 companies performing strongly in terms of gender equality ( is the score of company in the gender report). The second report contained the Fashion Transparency Index [47], which scores companies in the fashion sector on different sustainability metrics such as ‘Discrimination’ and ‘Diversity and Inclusion’ (called the fashion report from now on). Three annotators mapped those metrics into our six ISEs (Table 12). We then computed the score of company for the ISE in the fashion report () by averaging ’s scores for the metrics mapped to the ISE. With those two scores at hand, we then tested whether our six ISEs captured the constructs they were meant to capture. We ranked companies by their , ranked them by their , and computed the correlations between these two lists. To then go beyond gender, for each ISE, we ranked companies by their , ranked them by their , and computed the correlations between these two lists. Since the ranked lists might have included different companies, we utilized a measure called ‘rank biased overlap’ (RBO), which was designed for measuring the goodness of ranking between non-overlapping ranked lists [48] (Table 10). RBO scores lie between 0 and 1, with a higher score representing better concordance between lists. We also calculated the Spearman correlation between the ranking of the companies that are common in both lists (Table 11). Overall, ranking companies by outperformed the random baseline not only for the gender ISE but also for the remaining five ISEs.
Appendix E Distribution of Similarity Score
Appendix F Stock Analysis
The geometric mean of stock growth is calculated as , where is a company in a specific (ISE facet (staff welfare or financial benefits), percentile) bin, and is the number of the companies in such a bin.
| Monetary | Health | Education | Diversity | Infrastructure | Atmosphere | |||
| Animal Welfare | ||||||||
| Annual Leave & Public Holidays | x | x | ||||||
| Anti-bribery, Corruption, & Presentation of False Information | ||||||||
| Biodiversity & Conservation | ||||||||
| Community Engagement | x | |||||||
| Contracts & Terms of Employment | x | |||||||
| Discrimination | x | |||||||
| Diversity & Inclusion | x | |||||||
| Energy & Carbon Emissions | ||||||||
| Equal Pay | x | x | ||||||
| Freedom of Association, Right to Organise & Collective Bargaining | x | |||||||
| Harassment & Violence | x | |||||||
| Health & Safety | x | |||||||
| Maternity Rights & Parental Leave | x | |||||||
| Notice Period, Dismissal & Disciplinary Action | x | |||||||
| Restricted Substances List | ||||||||
|
x | |||||||
| Waste & Recycling (Packaging/Office/Retail) | ||||||||
| Waste & Recycling (Product/Textiles) | ||||||||
| Water Usage & Footprint | ||||||||
| Working Hours & Rest Breaks | x | x | x | x |