A Radio-selected Population of Dark, Long Gamma-ray Bursts: Comparison to the Long Gamma-ray Burst Population and Implications for Host Dust Distributions
Abstract
We present cm-band and mm-band afterglow observations of five long-duration -ray bursts (GRBs; GRB 130131A, 130420B, 130609A, 131229A, 140713A) with dust-obscured optical afterglow emission, known as “dark” GRBs. We detect the radio afterglow of two of the dark GRBs (GRB 130131A and 140713A), along with a tentative detection of a third (GRB 131229A) with the Karl G. Jansky Very Large Array (VLA). Supplemented by three additional VLA-detected dark GRBs from the literature, we present uniform modeling of their broadband afterglows. We derive high line-of-sight dust extinctions of . Additionally, we model the host galaxies of the six bursts in our sample, and derive host galaxy dust extinctions of . Across all tested -ray (fluence and duration) and afterglow properties (energy scales, geometries and circumburst densities), we find dark GRBs to be representative of more typical unobscured long GRBs, except in fluence, for which observational biases and inconsistent classification may influence the dark GRB distribution. Additionally, we find that is not related to a uniform distribution of dust throughout the host, nor to the extremely local environment of the burst, indicating that a larger scale patchy dust distribution is the cause of the high line-of-sight extinction. Since radio observations are invaluable to revealing heavily dust-obscured GRBs, we make predictions for the detection of radio emission from host star formation with the next generation VLA.
1 Introduction
Long duration -ray bursts (GRBs), the most luminous, energetic transients in the universe (e.g. Racusin et al. 2008), are associated with the death of massive stars (MacFadyen & Woosley, 1999) and Type Ic supernovae (e.g. Hjorth et al. 2003; Woosley & Bloom 2006). The relativistic shocks produced by these bursts interact with the surrounding medium, leading to the production of broad-band synchrotron emission from radio to X-rays, known as the “afterglow”.
A subset of long GRBs have suppressed optical emission, earning them the moniker of optically “dark” GRBs, with the first documented dark GRB being GRB 970828 (Groot et al., 1998). It is estimated that - of the long GRB population are among the dark GRB class (Jakobsson et al., 2004; Cenko et al., 2009; Fynbo et al., 2009; Greiner et al., 2011; Melandri et al., 2012; Perley et al., 2013). One of the prominent causes of the darkness is attributed to dust extinction along the line-of-sight to the GRB, though other causes, such as intrinsically faint and rapidly fading bursts (e.g. Berger et al. 2002), or absorption from a high redshift () origin (Haislip et al., 2006; Salvaterra et al., 2009; Tanvir et al., 2009; Cucchiara et al., 2011) can also produce optically faint or undectectable afterglows. For the dust-extinguished population of dark GRBs, the amount of extinction () along the line-of-sight is of interest as it can provide insight on the amount of dust and distribution within their host galaxies (Greiner et al., 2011; Zafar et al., 2011; Krühler et al., 2011; Zauderer et al., 2013c; Perley et al., 2013). Typically, is estimated using simple power law arguments extending from the X-rays to the optical bands (e.g. Perley et al. 2013). However, the addition of a detected radio afterglow can allow for proper afterglow modeling and provide a robust measurement of .
Since the first radio afterglow of a GRB was discovered in 1997 (GRB 970508, Frail et al. 1997), radio follow-up has been vital to our general understanding of GRB afterglow behavior, helping to constrain the energetics and environment of GRBs. A fairly comprehensive census of radio follow-up of 304 GRB afterglows found that only of GRB afterglows have radio detections (Chandra & Frail, 2012). However, it was postulated that the low fraction of radio detections is likely attributed to the limited sensitivity of prior generations of radio telescopes (Chandra & Frail, 2012; Osborne et al., 2021), and therefore more sensitive radio facilities could increase the fraction of detected radio afterglows of GRBs. The upgrade to the Karl G. Jansky Very Large Array (VLA), which concluded in 2012, increased the sensitivity of the radio array by a factor of (Perley et al., 2011), and has allowed for well-sampled, multi-band, follow-up of long GRB radio afterglows (including, but not limited to: Chandra & Frail 2012; Laskar et al. 2013c; Zauderer et al. 2013c; Laskar et al. 2014, 2015, 2016; Alexander et al. 2017; Laskar et al. 2018a, b, c). Radio observations of dust obscured dark GRBs are critical for properly modeling the afterglow of these bursts, especially when the optical afterglow is not detected (e.g. Jakobsson et al. 2005; Castro-Tirado et al. 2007; Rol et al. 2007; Zauderer et al. 2013c; van der Horst et al. 2015; Higgins et al. 2019; Kangas & Fruchter 2021), as the low-frequency afterglow can constrain burst energetics and environment density through determination of the synchrotron break frequencies (e.g. Sari et al. 1998; Granot & Sari 2002).
In addition to the properties of the afterglow of dark GRBs, there has been much interest in the host galaxies of dark GRBs and how they compare to the typical long GRB population (e.g. Krühler et al. 2011; Perley et al. 2013). The Swift X-ray Telescope (Swift/XRT) typically provides afterglow positions of (Evans et al., 2009), while the detection of a radio afterglow with the VLA can often provide unambiguous association to a host galaxy via sub-arcsecond precision, especially in the case of optically-faint or non-detected dark GRBs (e.g. Zauderer et al. 2013c). Previous studies based on small numbers have found that the hosts of dust-obscured bursts are overall more massive, more luminous, more star forming, and dustier than other long GRB hosts (i.e. Krühler et al. 2011; Perley et al. 2013). Long GRBs in general are already associated with star forming galaxies (i.e. Djorgovski et al. 1998; Christensen et al. 2004; Japelj et al. 2016; Palmerio et al. 2019), and the obscuration of dark GRBs may point to obscured star formation in their hosts (Blain & Natarajan, 2000; Ramirez-Ruiz et al., 2002).
Here, we present the multi-wavelength observations for five dark GRBs, including VLA observations for all five bursts. We present the discovery of the VLA radio afterglow for one burst (GRB 130131A), present a nominal VLA radio detection for another burst (GRB 131229A), present new radio and millimeter detections for an additional event (GRB 140713A), and new upper limits for two events. For our three VLA detected/nomiminally detected dark GRBs, we uniformly model the afterglows and host galaxies, and include uniform models of the afterglow and host galaxies of three VLA detected dark bursts from the literature. We proceed to compare the afterglow and host properties of dark GRBs to the larger population of typical long GRBs that have not been classified as dark. In Section 2 we describe our sample and our criteria for classifying GRBs as dark. In Section 3 we describe our methods for self-consistent modeling of all available broadband afterglow data and we apply our afterglow modeling to the relevant bursts in our sample to extract their local environment, burst energetics and microphysical parameters. In Section 4 we present host galaxy modeling for the bursts with robust host galaxy associations and spectroscopic or photometric data. In Section 5 we compare our dark GRB sample to the broader population of long GRBs in terms of their -ray, afterglow, and host properties, and consider the detectability of obscured star formation in long GRB host galaxies. We conclude in Section 6. We present the details of the multi-wavelenth observations and data reduction in Appendix A. In this paper, we employ the CDM cosmological parameters of , , .
2 Sample Selection and Classification Method
Our primary goal is to uniformly model the afterglows and host galaxies of dark GRBs. We focus on dark GRBs with VLA observations taken after the upgrade (Perley et al., 2011), specifically those taken with our Programs 13A-046, 13A-541, and 14A-344 (PI: Berger)111We exclude GRB 130606A as the darkness of this burst is likely attributed to its high redshift of (Castro-Tirado et al., 2013; Chornock et al., 2013a; Littlejohns et al., 2015). This sample includes five dark GRBs, two of which have unambiguous radio afterglow detections, and one of which has a tentative radio afterglow detection. We supplement this sample with three other dark GRBs with VLA detections, GRB 110709B (Zauderer et al., 2013c), 111215A (Zauderer et al., 2013c; van der Horst et al., 2015)222While the upgrade to the VLA completed at the end of 2012, the C-band (4-8 GHz) and K-band (18-26.5 GHz) receivers were upgraded by 2011 (Perley et al., 2011). As the majority of the VLA observations of GRB 110709B and GRB 111215A were taken with these upgraded receivers, we include these bursts in our sample., and GRB 160509A (Laskar et al. 2016, classifying this latter burst as dark for the first time in Section A.6.3). As 14 dark GRBs have been observed by the VLA since its upgrade (Zauderer & Berger 2012; Zauderer et al. 2013c; Laskar et al. 2013a; Veres et al. 2015; Horesh et al. 2015; Laskar et al. 2016, the VLA Data Archive, This Work), our sample of 8 comprises over half of the known dark GRBs with upgraded VLA observations. The eight 8 dark GRBs featured in this paper are listed in Table 1.
Standard measures of classifying long GRBs as “dark” in the standard synchrotron model (Granot & Sari 2002 and Section 3), involve the optical-to-X-ray spectral index and the X-ray spectral index . One such method of classification uses the expected spectral index between the optical and X-ray afterglow fluxes of , where is the power-law index of the electron energy distribution, , and the spectral index is dependent on the location of the cooling frequency () in relation the optical and X-ray bands. As is typically expected (e.g. Sari et al. 1998), the shallowest expected , where . Therefore, if , then the shallow spectral slope indicates the optical afterglow has been suppressed and the burst can be considered dark (Jakobsson et al., 2004). An alternate definition of afterglow darkness is , corresponding to an optical flux that is even lower than the shallowest possible extrapolation from the X-rays, , in the synchrotron framework (van der Horst et al., 2009). For the purposes of this paper, we will consider any burst “dark” if they meet the Jakobsson et al. (2004) criterion of , though we will note whether the bursts in our sample meet the van der Horst et al. (2009) classification criterion as well.
To determine , we interpolate the X-ray light curve to the times of the optical observations, using least squares fits to the X-ray light curves to calculate the X-ray temporal index (where ), and calculate , correcting the optical observations for Galactic extinction in the direction of the burst (Schlafly & Finkbeiner, 2011). To determine , we create time-sliced spectra from the Swift tool 333https://www.swift.ac.uk/user_objects/docs.php#specform, which calculates the photon index, (Evans et al., 2009), from which we derive . On a per-burst basis, we exclude any times over which the X-ray light curve exhibits flaring activity super-imposed on the power-law afterglow, as this emission is not likely to originate from the external shock (Burrows et al., 2007; Margutti et al., 2010).
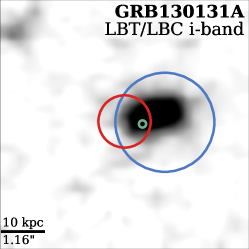
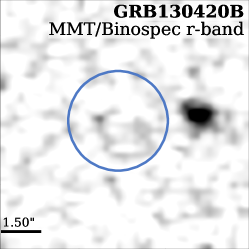
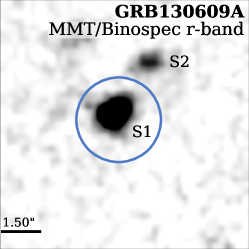
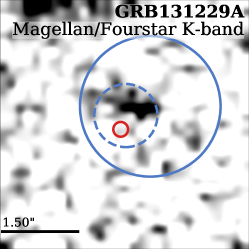
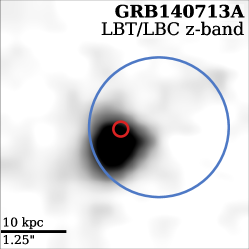
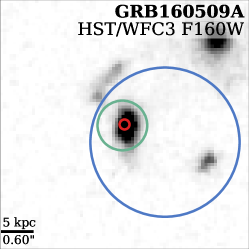
The full details of the X-ray, optical, near-infrared (NIR) and radio observations of the GRB afterglows and host galaxies, as well as their classifications as dark GRBs are presented in Appendix A. We show the fields and afterglow localizations of six dark GRBs in our sample in Figure 1, and their afterglow detectabilities, as well as whether we model their afterglows and host galaxies, are summarized in Table 1.
| GRB | Opt and/or NIR/Radioa | Modeledb | References |
|---|---|---|---|
| 110709B | N/Y | Y | 1, 2, 3 |
| 111215A | N/Y | Y | 1, 4, 5 |
| 130131A | Y/Y | Y | 5, 6 |
| 130420B | N/N | N | 6 |
| 130609A | N/N | N | 6 |
| 131229A | N/Yc | Yd | 5, 6 |
| 140713A | N/Y | Y | 6, 7 |
| 160509A | Y/Y | Ye | 6, 8, 9 |
Note. — a Whether or not the afterglow was detected in the optical/NIR or radio.
b Whether or not we model the afterglow and host galaxy of the burst in this paper
c We find a tentative 6.0 GHz detection for GRB 131229A (see Section A.4.2)
d Due to the limited radio data, we present a simple analytical afterglow model for GRB 131229A in Section 3.4, and analytically derive afterglow properties. We model the host galaxy of GRB 131229A in this work.
e The X-ray to radio afterglow of GRB 160509A was modeled within our modeling framework in Laskar et al. (2016). We model the host galaxy of GRB 160509A in this work.
References. (1) Zauderer et al. (2013c); (2) Perley et al. (2016a); (3) Selsing et al. (2019); (4) van der Horst et al. (2015); (5) Chrimes et al. (2019); (6) This Work; (7) Higgins et al. (2019); (8) Laskar et al. (2016); (9) Kangas et al. (2020)
3 Afterglow Modeling
We will consider the X-ray, optical, and radio afterglow light curves and spectral energy distributions (SEDs) of the GRBs in our sample in the context of synchrotron emission from the acceleration of electrons from a relativistic blast wave (i.e. Sari et al. 1998; Chevalier & Li 2000; Panaitescu & Kumar 2000; Granot & Sari 2002). These electrons are accelerated to a non-thermal power law distribution, . The afterglow SEDs can be described by power law segments which connect at three break frequencies (the self absorption frequency, , the characteristic frequency, , and the cooling frequency, ) and the characteristic flux, (Granot & Sari, 2002). The SED and light curve temporal evolution are dependent on the following parameters: , the isotropic-equivalent kinetic energy of the burst, , the density of the environment444In a constant density interstellar medium (ISM) environment, and . In a wind environment, , , normalized to a progenitor mass-loss rate of and wind velocity of ; (Chevalier & Li, 2000)., , and the fractional energy density imparted on the electrons, , and the magnetic field, .
In addition to the standard synchrotron frame work laid out in Granot & Sari (2002), we also consider the effects of beaming on the GRB afterglow light curves. Collimation is expected to manifest itself as a jet break, which occurs when the angular size of the relativistic beam of the GRB jet approaches the value of the true opening angle of the jet (). At the time that this jet break occurs, , the observed light curve is predicted to steepen achromatically (Rhoads, 1999; Sari et al., 1999). Determining from a GRB afterglow can therefore provide us with the opening angle of the jet, which allows for the correction of the energetics for beaming and in turn, we can derive the true kinetic (), -ray (), and total energies of the burst (). Additionally, the evolution of the afterglow light curves at (where is the time after the Swift/Burst Alert Telescope trigger) is when (Sari et al., 1999), where is the observing frequency. Thus, identifying a jet break in the afterglow and measuring the post-break light curve slope provides an additional constraint on the value of .
To properly model the X-ray afterglow, we include the effects of inverse Compton (IC) cooling in our model, which can lower the location of (in comparison to the value predicted by a spherical blast-wave without IC cooling, e.g., Granot & Sari 2002) by a factor of , where is the Compton -parameter (for the detailed explanation see: Sari & Esin 2001; Laskar et al. 2015).
Prior to performing a full fit to the broad-band data, we first examine the SEDs and light curves of our afterglow observations and fit them using either a single power law function or a smoothly broken power law, given by
| (1) |
| (2) |
where is the normalized flux of the break, and are the break frequency and time, respectively, is the break smoothness555Larger values of correspond to sharper breaks., and and are the temporal or spectral slopes of the fits, respectively. We use the convention throughout. Where data quality allows, we use Equation 1 for light curves and Equation 2 for SEDs. When necessary, we use temporal power law fits to interpolate the flux to common times for our SED fitting.
We use these basic broken power law considerations to place initial constraints on , , the nature of the burst environment (i.e. ISM vs. wind), and the location of the break frequencies with respect to our observing bands, when possible. We then model the GRB with the Markov Chain Monte Carlo (MCMC) modeling framework laid out in Laskar et al. (2014), including IC effects. We also take into consideration the scattering effects of scintillation, which may cause variability on short timescales at GHz frequencies (Rickett, 1990). In the situations for which the burst environment cannot be constrained with initial considerations alone, we model the GRB afterglow with both an ISM and wind environment and choose the model that provides a better statistical fit.
To account for any potential systematic uncertainties in flux calibration for data taken across different facilities, we include an uncertainty floor of 10% on individual measurements prior to modeling. The free parameters for our model are , , in an ISM environment or for a wind environment, , , and . We fit each GRB with available broad-band afterglow data with the MCMC model, using 128 walkers for 10,000 steps, and discard the first of steps as “burn in”, where the average likelihood across the chains have yet to reach a stable value.
| GRB | 110709B | 111215A | 130131A | 131229Aa | 140713A |
|---|---|---|---|---|---|
| Env. | ISM | Wind | Wind | ISM | Wind |
| – | |||||
| – | |||||
| – | |||||
| – | |||||
| – | |||||
| – | |||||
| – | |||||
| – | |||||
| – | |||||
| – | |||||
Note. — The top row for each parameter corresponds to the best fit forward shock value from our MCMC modeling. The bottom row for each parameter corresponds to the summary statistics from the marginalized posterior density functions (medians and 68% credible intervals), except in the case of GRB 131229A (see a)
a Values derived from analytical arguments (see Section 3.4)
b value from afterglow model using median values
3.1 GRB 110709B
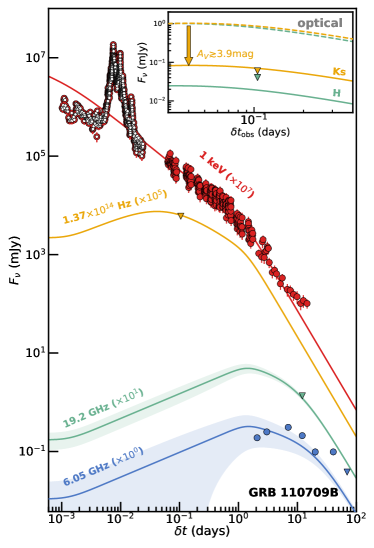
We compile all available radio data of GRB 110709B, along with optical upper limits and the Swift X-ray light curve (Section A.6.1), to model the afterglow. The data consists of a VLA 5.8 GHz light curve spanning , a VLA 21.8 GHz upper limit at , GROND optical/NIR () non-detections at , and the Swift X-ray afterglow light curve spanning .
The afterglow of GRB 110709B was previously modeled by Zauderer et al. (2013c), and then by Kangas & Fruchter (2021). Zauderer et al. (2013c) did not include IC effects in their modeling, while Kangas & Fruchter (2021) did include IC effects, though they did not fit for , which is a key parameter of interest for our study. Here, we model GRB 110709B to ensure consistency across our sample and to determine .
3.1.1 Basic Considerations
The X-ray afterglow light curve exhibits flaring activity until , and we only consider these data over for our modeling. We created a time-sliced spectra from the Swift online tool for the photon counting (PC) mode X-ray light curve, which found (, Evans et al. 2009), corresponding to . We fit the X-ray light curve with a broken power law (Section 3; Eq 1) characterized by () and (), with the break occurring at () for ().
We first investigate the nature of the steepning in the X-ray light curve of GRB 110709B. Such steepenings are often explained by either the passage of through the band, or a jet break. For the passage of at , the expected change in temporal index is , which is too shallow to explain the observed . Thus, we attribute the steepening instead to a jet break.
We now use the X-ray spectral index and pre-break light curve to determine where lies in relation to . If , the X-ray spectral index implies . However, we find that the measured value of yields in a wind environment or in an ISM environment, neither of which are consistent with the value derived from . On the other hand, for , we require to match the X-ray spectral index and (in both the wind and ISM environment) to match the light curve. The values of are in agreement to within , and we therefore conclude that and . In this regime, the X-ray observations cannot be used to discriminate between an ISM and wind environment.
The expected temporal decay after a jet break is , and our post-break X-ray light curve slope of is shallower than the expected . However, the break time and slope are degenerate with the smoothness of the break, and a later break time is consistent with a steeper post break decline. This suggests that the break in the X-ray light curve is due to a jet break, whose onset occurs at . Additionally, if , then the GHz light curve, which does not have any observations prior to , cannot be used to distinguish between the ISM and wind environment, as the behavior of the synchrotron model is the same regardless of environment after .
In conclusion, the X-ray afterglow of GRB 110709B is consistent with , , and . Additionally, the X-ray and radio light curves cannot be used to distinguish between the ISM and wind environment.
3.1.2 MCMC Modeling
As we can not distinguish between the wind and ISM environments using preliminary analytical arguments, we therefore fit the GRB 110709B afterglow data with both a wind and ISM environment, and choose the solution that provides a better statistical fit.
We find the ISM environment model is marginally preferred by the data, with and likelihood () of , compared to the wind environment best fit model with and a lower of (see Appendix B.1 for wind model, provided for completeness). We present the best-fit (highest likelihood) ISM model in Figure 2 and list the parameters as well as the summary statistics from the marginalized posterior density functions (medians and 68% credible intervals) in Table 2.
We find that and (consistent with the arguments laid out in Section 3.1.1), resulting in . The SED remains in the slow cooling phase with a break frequency ordering of for the entirety of the afterglow observations considered. Our fit also confirms that , as expected. For our best fit ISM model, the GROND optical/NIR limits imply mag.
We comment here on a few notable discrepancies between the data and model light curves. The model light curve under-predicts the last detection at by . This discrepancy is too large to be reconciled with scintillation effects alone. Moreover, the X-ray model light curve under-predicts the data at . This result is not unexpected, as we measure a shallower temporal index in the post-break X-ray light curve than would be expected for post jet-break behavior (see Section 3.1.1), and therefore we find an excess within our model. We first consider whether this excess flux in the X-ray afterglow is due to Klein Nishina (KN) effects. KN effects become important when (typically the is the X-ray frequency), where , and is the critical Lorentz factor (Nakar et al., 2009). Given our best fit parameters, we find that at , . Therefore, we conclude that KN effects are not causing the excess flux in the X-ray afterglow. We next consider whether IC emission is the cause of the observed X-ray excess. We calculate the flux of the IC spectra at and find that the IC flux at is , which is a factor times lower than the X-ray flux at that time. Therefore, we also conclude that IC effects are not contributing to the excess flux.
Instead, the discrepancy between the X-ray and 5.8 GHz model light curves and observations could be reconciled with a slightly later jet break at . However, this would violate the 22 GHz upper limit at . In summary, there is not a natural explanation for the late-time excess emission in these bands, although fixing the time of the jet break to be later does not significantly affect the parameters of interest (, , and ), and they remain consistent with the fit presented above within errors.
Both Zauderer et al. (2013c) and Kangas & Fruchter (2021) found the wind environment to best fit the afterglow of GRB 110709B, whereas we found the ISM environment to best fit the afterglow of GRB 110709B. The discussion of our wind environment model fit and comparison to the fits of Zauderer et al. (2013c) and Kangas & Fruchter (2021) can be found in Appendix B.1.
3.2 GRB 111215A
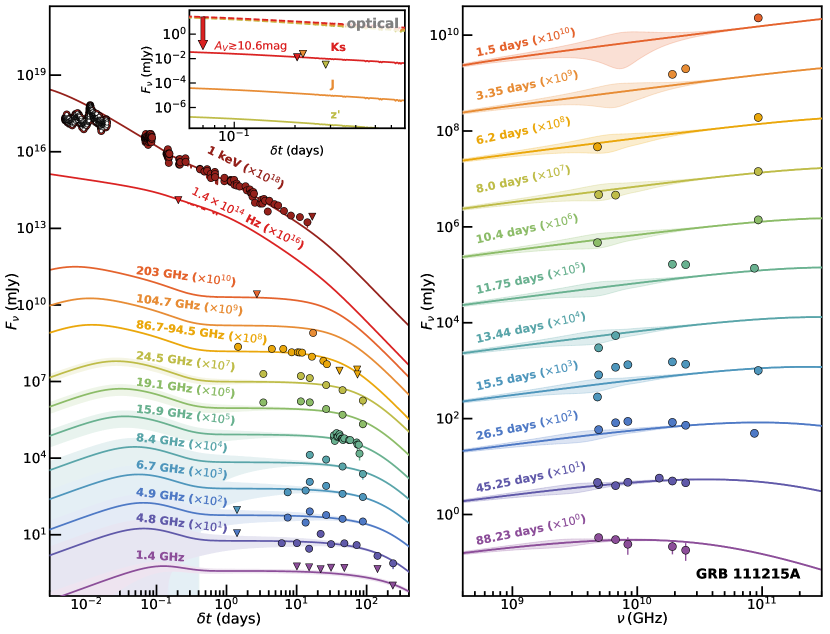
We compiled the radio and millimeter light curves of the afterglow of GRB 111215A, along with NIR/optical upper limits and the Swift X-ray light curve for our afterglow modeling (Section A.6.2). The radio afterglow of GRB 111215A is one of the best sampled of any dark GRB, with 1.4 GHz non-detections spanning , 4.8, 4.9, and 6.7 GHz observations spanning (all together C-band), 8.5 GHz observations spanning (X-band), 15 GHz observations spanning , 19.1 and 24.5 GHz observations spanning (all together K-band), 86.7, 93, 93.7, and 94.5 GHz observations spanning (all together 3mm), 104.7 GHz detection at , and a 230 GHz upper limit at . The deepest optical and NIR upperlimits of GRB 111215A span . The Swift X-ray afterglow of GRB 111215A spans .
GRB 111215A has previously been modeled by Zauderer et al. (2013c) and van der Horst et al. (2015), though neither of them included IC effects. Additionally, Kangas & Fruchter (2021) modeled GRB 111215A with the inclusion of IC effects, but they chose not to fit for . Like for GRB 110709B, we choose to model GRB 111215A in our modeling framework both for consistency across our sample, and to determine .
3.2.1 Basic Considerations
We first consider the radio and millimeter light curves of GRB 111215A to determine the location of the radio observations in relation to and . At and , the spectral index between the C-band and 3mm afterglow is , suggesting the spectral ordering of C-band (expected ). The 3mm light curve over is roughly constant, with , implying the burst occurred in a wind environment (expected ). We find the same conclusion from the C-band light curve, where from the afterglow flux matches . Thus the radio and millimeter afterglow of GRB 111215A is consistent with a wind environment, and indicates C-band at least from .
We now turn our attention to an interesting spectral phenomena in our radio and millimeter afterglow observations. As discussed, the spectrum between C-band and 3mm at and indicates that C-band in a wind environment. This conclusion appears to still hold true for the spectrum at (), as the passage of through the millimeter and radio would result in a negative spectral slope. However, between , an additional bump in the spectrum peaking between X-band and K-band is inconsistent with the expected (Figure 3). A possible explanation for this spectral feature is a reverse shock. However, the exploration of this possibility is outside the scope of this work.
We now consider the X-ray spectrum and light curve to determine the location of and . The X-ray afterglow of GRB 111215A exhibits flaring until (Figure 3). Thus, we only consider the X-ray afterglow for , where we generate a PC-mode time-sliced spectra from the Swift online tool, which found (, Evans et al. 2009). The X-ray afterglow of GRB 111215A is characterized by a spectral index and can be fit with a single temporal power law characterized by (Figure 3).
In a wind environment, the scenario of implies , which is inconsistent with the derived value of , and we therefore rule out this spectral frequency ordering. However, in the case of , we require to match the measured value of , which is consistent within to the derived value of . Therefore, we conclude that and . Moreover, the X-ray light curve does not exhibit any break to , placing a lower limit on the time of the jet break to (Figure 3).
In conclusion, the radio afterglow of GRB 111215A is consistent with a wind environment where C-band . Additionally, the X-ray afterglow is consistent with . We find a preliminary estimate of , and expect .
3.2.2 MCMC Modeling
We fit the afterglow data of GRB 111215A with a wind environment. We present the best fit parameters wind model in Figure 3 and list the parameters as well as the summary statistics from the marginalized posterior density functions (medians and 68% credible intervals) in Table 2.
For our best fit wind model, the optical/NIR limits imply mag. Our model parameters are and days, resulting in a . The value of is higher than our initial prediction of (see Section 3.2.1). We can reconcile the higher value of found in the full modeling compared to the simplistic calculations performed earlier by investigating the IC cooling effects for our best fit parameters. We find that the Compton -parameter decreases from at the time of the fast-to-slow cooling transition () to at the time of the last X-ray detection (). This decrease in results in a faster evolution of , and results in a shallower light curve at higher .
Consistent with the likely existence of an additional component (Section 3.2.1), our FS model under-predicts the light curves of the X- and K-band afterglow at , as well as the 3mm light curve at .
Similar to the work presented here, Kangas & Fruchter (2021) modeled GRB 111215A in a wind environment with IC effects included, finding similar parameter values to us, though our model most disagrees with Kangas & Fruchter (2021) on the placement of , where they found , driven mainly by the fit to the early data.
3.3 GRB 130131A
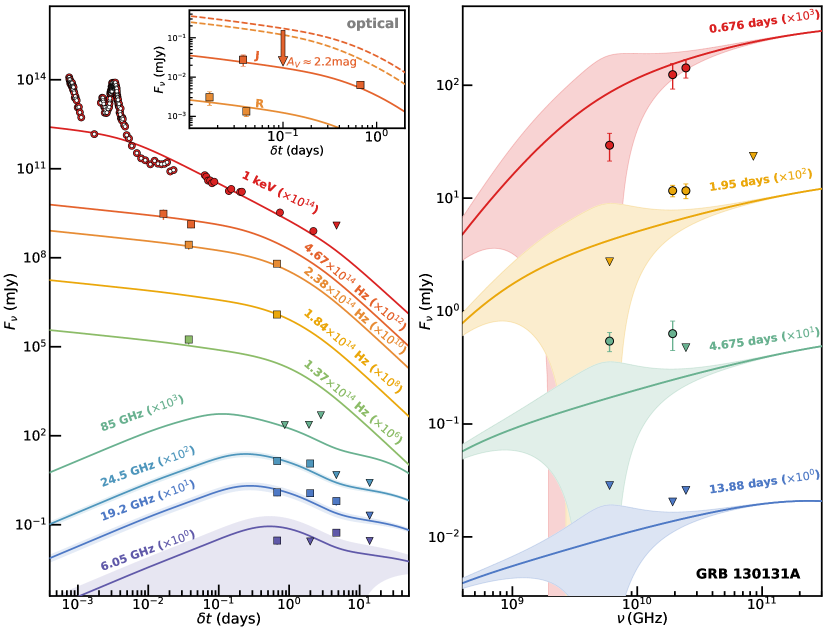
We compiled the radio light curves (6.0 GHz, 19.2 GHz, and 24.5 GHz, spanning ) and millimeter light curve (85.5 GHz, spanning ) of the afterglow of GRB 130131A (Section A.1.2), along with the optical/NIR detections (, spanning ) and the Swift X-ray light curve spanning (Section A.1.1) for our afterglow modeling.
3.3.1 Basic Considerations
To determine and the location of , we turn our attention to the X-ray afterglow. We ignore the X-ray flaring activity of GRB 130131A (, Figure 4), and only consider the X-ray light curve and spectra from days. We generate a PC-mode time-sliced spectra from the Swift online tool, which found (, Evans et al. 2009). The X-ray spectra for this time range can be characterized with and the X-ray light curve for this time range can be fit with a single power law with . We first consider the scenario in which . In this regime, would indicate . However, the temporal decline of the X-ray light curve would indicate in the wind environment and in an ISM environment. While the values of found for the ISM environment are consistent within , the nominal values of for the spectral and light curve analysis differ by . On the other hand, for the regime , implies , and implies . These values are more consistent (), with a nominal value difference of only . Therefore, the X-ray afterglow of GRB 130131A indicates and . Additionally, the X-ray light curve does not exhibit a break to , placing a lower limit on any jet break to . In this regime we cannot discriminate between the ISM and wind environments based on the X-ray afterglow alone.
We now consider whether the radio afterglow can provide additional constraints on the properties of GRB 130131A. The radio light curves of GRB 130131A are not well sampled, with only 4 epochs of observations (and 7 detections) between the 3 frequencies. Additionally, the 6.0 GHz light curve exhibits variability, with detections at and , interspersed with a non-detection at . Variability on short time scales at is likely attributable to scintillation (Rickett, 1990), and we therefore ignore the 6.0 GHz light curve in our analytical arguments (but include it, along with the anticipated scintillation effects, in our MCMC modeling). Turning our attention to the 19.2 GHz and 24.5 GHz observations, we note that the observations have a positive spectral slope of at , and both the 19.2 GHz and 24.5 GHz light curves fade significantly at , requiring to be consistent with the later non-detections. These spectral and temporal indices can be consistent with either a wind environment pre-jet break if (expected and ), or an ISM or wind environment if and (expected and ). Therefore, we are unable discriminate between the ISM and wind environment with the 19.2 GHz and 24.5 GHz afterglow observations.
3.3.2 MCMC Modeling
As we cannot distinguish between the wind and ISM environments from our afterglow observations of GRB 130131A, we fit the data with both an ISM and wind environment. While the host galaxy of GRB 130131A does not have a spectroscopically determined redshift (see Section A.1.3), we assume a photometric redshift of for both fits, based on host galaxy SED fitting (see Section 4). We find our wind environment model is marginally preferred by the data, providing a and , and we use this model for broader analysis in the rest of the paper. Comparatively, our ISM environment best fit model produced a and (we provide the ISM fit in Appendix B.2 for completeness). We present the best fit wind model in Figure 4 and list the parameters as well as the summary statistics from the marginalized posterior density functions (medians and 68% credible intervals) in Table 2.
In confirmation of the arguments laid out in Section 3.3.1, we find , and from our best fit wind model. The spectrum remains in the fast cooling phase until , and for the entirety of the X-ray afterglow that we consider. We find the optical/NIR afterglow detections are best fit with a line-of-sight extinction value of .
The model matches the first epoch of 19.2 GHz and 24.5 GHz observations, but under-predicts the light curves at by . This discrepancy can be reconciled somewhat by setting (past the time of all of our afterglow observations), but the model parameters of interest (, , and ) are not significantly affected by this change. As suggested in Section 3.3.1, we expect strong scintillation at 6.0 GHz based on our model, consistent with the large variability observed in the 6.0 GHz light curve.
3.4 GRB 131229A
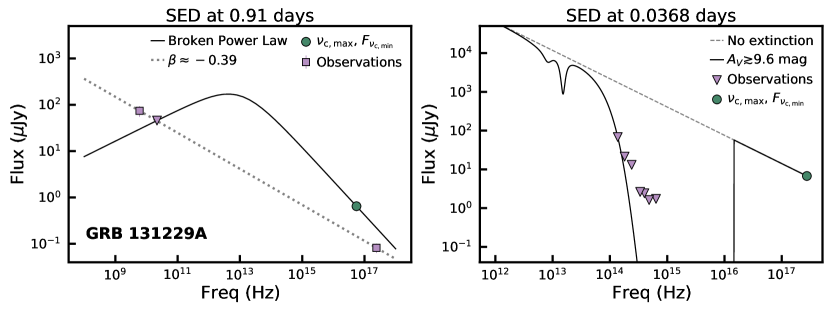
The radio and millimeter afterglow of GRB 131229A consists of single epoch observations at 6.0, 21.8, and 93 GHz, optical at (Section A.4.2). The optical afterglow of GRB 131229A was not detected, with the deepest upper limits at . The Swift X-ray afterglow spans (Section A.4.1).
We first investigate the X-ray light curve of GRB 131229A to determine , the location of , and place limits on . The combined windowed timing (WT) mode and PC-mode X-ray light curve can be characterized by a broken power law (Equation 1), with and . As the break in the light curve occurs between the WT-mode and PC-mode (), we investigate each mode separately. The WT-mode X-ray light curve of GRB 131229A is characterized by a single power law of , where as the PC-mode X-ray light curve of GRB 131229A is characterized by a single power law of . The change in temporal index of (see Section 3.1.1) is , indicating this temporal break may be the passage of through the X-ray band (expected ).
If the break in the X-ray light curve is indeed the passage of , the derived from the temporal and spectral indices should be consistent before and after the break. We create a WT-mode time-sliced spectra from the Swift online tool, and find the WT-mode () photon index to be (, Evans et al. 2009), corresponding to a WT-mode spectral index of . The hardness of this spectrum implies , and we derive , assuming . In a wind environment, the measured value of yields , which is inconsistent with our derived , and we therefore rule out a wind environment. On the other hand, in an ISM environment, the measured value of yields , which is consistent with the derived within . We find a mean weighted WT-mode of . Past the break (), we create a PC-mode time-sliced spectra from the Swift online tool, which finds the PC-mode photon index to be (, Evans et al. 2009), corresponding to a PC-mode spectral index of . Assuming , we find yields , consistent with . Furthermore, yields , once again consistent with , and we find a mean weighted PC-mode of . We therefore conclude that an ISM environment is preferred for GRB 131229A, and that passes through the X-ray band between , yielding an overall mean weighted of . Furthermore, the X-ray light curve does not exhibit any additional steepening, placing a limit of .
We next examine the radio to X-ray SED at the time of the radio observations () to place constraints on the location of . The shallow radio to X-ray spectral index at (, dotted line, Figure 5) is inconsistent with a single, optically thin power law spectrum with index extending from the radio to the X-rays, and instead requires a spectral peak in between.
In the regime of , we expect a positive spectral index of for the radio band. However, the observed limit of between the 6.0 GHz and 21.8 GHz observations is inconsistent with this expectation. The discrepancy between the tentative detection at 6.0 GHz and the upper limit at 21.8 GHz may be explained by a variety of factors, such as the 6.0 GHz counterpart being unrelated to the FS afterglow of GRB 131229A, or due to scintillation effects which can cause variability on short timescales at (Rickett, 1990). We instead utilize the 21.8 GHz non-detection to place constraints on the FS emission.
We use the 21.8 GHz non-detection and the X-ray light curve to place constraints on the location of and . Based on our analytical arguments, the latest time can reasonably pass through the X-ray band is at the start of the PC-mode X-ray light curve (), and therefore we assume at this time. Scaling to the time of the radio observations (), we find the maximum value of to be at (resulting in ). We fit a broken power law (Equation 2) with the 21.8 GHz non-detection and , fixing , , and . We find (solid line, Figure 5).
Our X-ray analysis provides measured values of the synchrotron flux above , and our radio analysis provides a constraint on the synchrotron flux between and (Table 1 in Granot & Sari 2002). Combined with our constraint on (Table 2 in Granot & Sari 2002), we place limits on the energy, density, and microphysics of the system. Assuming a redshift of (see Section 4), we find , , and . Using these constraints, along with our constraint on , we place constraints on and find (Sari et al., 1999).
We next place constraints on of GRB 131229A. Assuming , and using our assumption of at , we interpolate the SED between and at the time of the most constraining optical/NIR upper-limits (). We find that the extinction necessary to be consistent with the optical/NIR upper limits is (see Figure 5).
In conclusion, we find for GRB 131229A , , and . We also place constraints on the isotropic energy and circumburst density of GRB 131229A of and , leading to further constraints on . With limited radio observations, it is difficult to derive meaningful constraints on the afterglow properties of GRB 131229A within our MCMC modeling framework, and therefore we instead report our analytically derived values in Table 2.
3.5 GRB 140713A
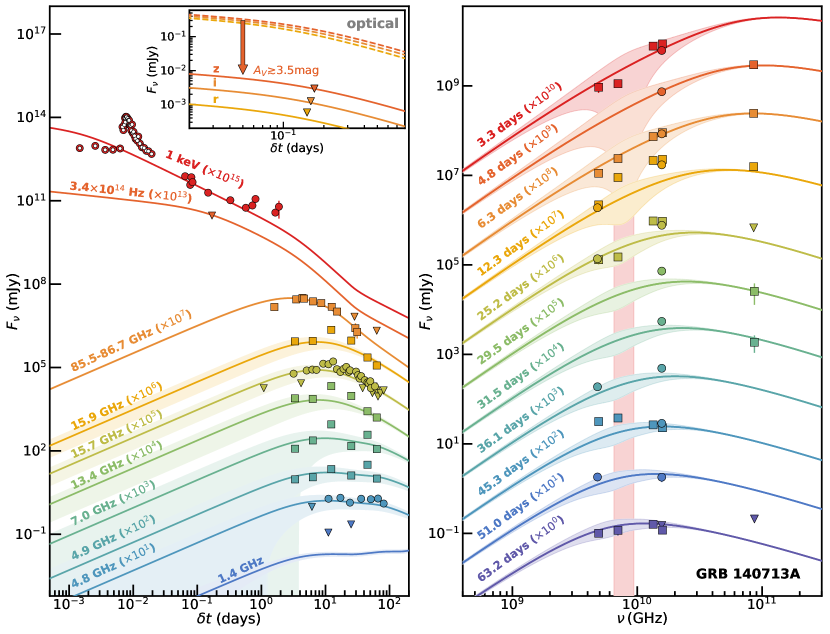
We compiled the radio and millimeter light curves of the afterglow of GRB 140713A (Sec A.5.2), with WSRT and GMRT upper limits at 1.4 GHz spanning , WSRT observations at 4.8 GHz spanning as well as VLA observations at 4.9 and 7.0 GHz (all together, C-band), VLA observations at 13.4 and 15.9 GHz, as well as AMI observations at 15.7 GHz spanning (all together, Ku-band), and CARMA observations at 85.5 GHz and PdBI observations at 86.7 GHz spanning (all together, 3mm). In combination with the radio and millimeter light curves, we include the NOT optical limits at and the Swift X-ray light curve spanning in our afterglow modelling (Sec A.5.1).
The afterglow of GRB 140713A has been previously modeled by Higgins et al. (2019), though they did not include IC effects. We choose to model GRB 140713A in our modeling framework both for consistency across the bursts in our sample, and because we are introducing new VLA and 3mm afterglow observations that have not previously been modeled.
3.5.1 Basic Considerations
We observe a steep decline in the 3mm light curve, with at . We cannot reconcile this steep decline with the standard synchrotron model of a spherical blast-wave, as the light curve slopes predicted by the standard model are too shallow. We therefore conclude that this decline is caused by a jet break, and that days. Furthermore, this decline indicates that , 3mm, and mJy at days (see Section 3).
Assuming 3mm at days, and evolving this break frequency and forward in time (, post jet break, Sari et al. 1999) from 12 days, we find that -band at days, with a characteristic flux of mJy. Indeed, we can fit the 15.7 GHz light curve with a steep power law of at days, and find the flux at 27 days to be mJy. Therefore, the Ku-band data corroborates that days, and we conclude that . With , the majority of our radio and millimeter afterglow observations are taken at , and we are unable to discriminate between an ISM and wind environment using these observations.
We now determine the location of the X-rays in relation to . We ignore the X-ray flare (, see Figure 6) of GRB 140713A, and as such we only consider the X-ray light curve and spectra from in the synchrotron framework to determine the location of the X-rays in relation to . We create a time-sliced PC-mode spectra from the Swift online tool, which finds the X-ray photon index to be (1, Evans et al. 2009). The X-ray spectra for this time range is characterized by and the X-ray light curve for this time range can be fit with a single power law with .
For , derived from the identification of a jet break in the radio afterglow, we would expect a spectral index of if and if . The measured value of is more consistent with the latter case, within , where as the former case is only consistent within . In the regime of , we would expect , consistent with our measured value of within . Therefore, we conclude , and note that in this regime we can not discriminate between the ISM and wind environment with the X-ray light curve.
In conclusion, the radio and X-ray afterglow of GRB 140713A is consistent with , , and . Neither the radio nor X-ray observations allow us to analytically distinguish between the ISM and wind environment.
3.5.2 MCMC Modeling
As we cannot distinguish between the wind and ISM environments from our afterglow observations of GRB 140713A, we fit the data with both an ISM and wind environment. We find that our wind environment model better fits the data, with the best fit model having a reduced and . Comparatively, our ISM environment best fit model produced a reduced and (for completeness, we present the best fit ISM model in in Appendix B.3). We present the best fit wind model in Figure 6 and list the parameters as well as the summary statistics from the marginalized posterior density functions (medians and 68% credible intervals) in Table 2.
In confirmation of the arguments laid out in Section 3.5.1, the parameters of our best-fit model are and days, resulting in a . Additionally, the SED remains in the fast cooling phase until days, and the ordering of the break frequencies at days is . For our best fit wind model, the NOT optical limits imply .
| GRB Name | [Gyr] | [mag] | ||||
|---|---|---|---|---|---|---|
| 110709B | ||||||
| 111215A | ||||||
| 130131A | ||||||
| 131229A | ||||||
| 140713A | ||||||
| 160509A | - | - | - | - | - |
Note. — Host galaxy properties derived by Prospector.
The X-ray model light curve under-predicts the data at days. This is not unexpected, as we found in Section 3.5.1 that the X-ray temporal slope was shallower than the expected slope for . We first consider whether this excess flux in the X-ray light curve is due to KN effects, which become important when . Given our best fit parameters, we find that at days, . Therefore, we conclude that KN effects are not causing the excess flux in the X-ray light curve. We next consider whether IC effects are the cause of the excess flux in the X-ray light curve. We calculate the flux of the IC spectra at at days, and find that the IC flux at is mJy, times smaller than the X-ray flux at that time. Therefore, IC effects cannot account for the excess X-ray flux, although we note that such excess emission has been seen in other events (Fong et al., 2014; Margutti et al., 2015; Laskar et al., 2018a, 2019).
Higgins et al. (2019) have previously modeled the afterglow of GRB 140713A. Their model allowed for , and they found a value of , smaller, but not far off from our value of . Their other parameters are also similar to ours, with the biggest difference in our model being that we identify a jet break in the 3mm light curve, and therefore find days, where as they predict days.
4 Host Galaxy Modeling
To model the stellar population properties of the host galaxies, we use the stellar population inference code Prospector (Leja et al., 2017). Prospector determines properties such as total mass formed, age of the galaxy at the time of observation (), optical depth of old and young stars, stellar metallicity (), the star formation history, and redshift using the available photometric and/or spectroscopic data for each host. We apply a nested sampling fitting routine with dynesty (Speagle, 2020) to the observational data of each host to produce posterior distributions in each property. Model SEDs are built using Python-fsps (Flexible Stellar population synthesis; Conroy et al. 2009; Conroy & Gunn 2010). Unless the redshift of a host is known, we allow redshift to be a sampled parameter. For hosts with spectra, we fit their spectral continuum with a 10 order Chebyshev polynomial and add a gas-phase metallicity and gas ionization parameter to accurately fit the nebular emission lines. We also assume a Chabrier initial mass function (IMF) (Chabrier, 2003), Milky-Way Dust Extinction Law (Cardelli et al., 1989), and a parametric delayed- SFH (), where the is a sampled parameter in the Prospector fitting. Furthermore, we apply the Gallazzi 2005 Mass-Metallicity relation (Gallazzi et al., 2005) and a 2:1 ratio in the dust attenuation between old and young stars respectively, as stellar populations are noticed to follow this trend (Calzetti et al., 2000; Price et al., 2014). The total dust attenuation in optical depth is converted to a -band magnitude, and hence forth referred to as . We follow the methods in Nugent et al. (2020) to determine the mass-weighted age , stellar mass (), and star formation rate (SFR).
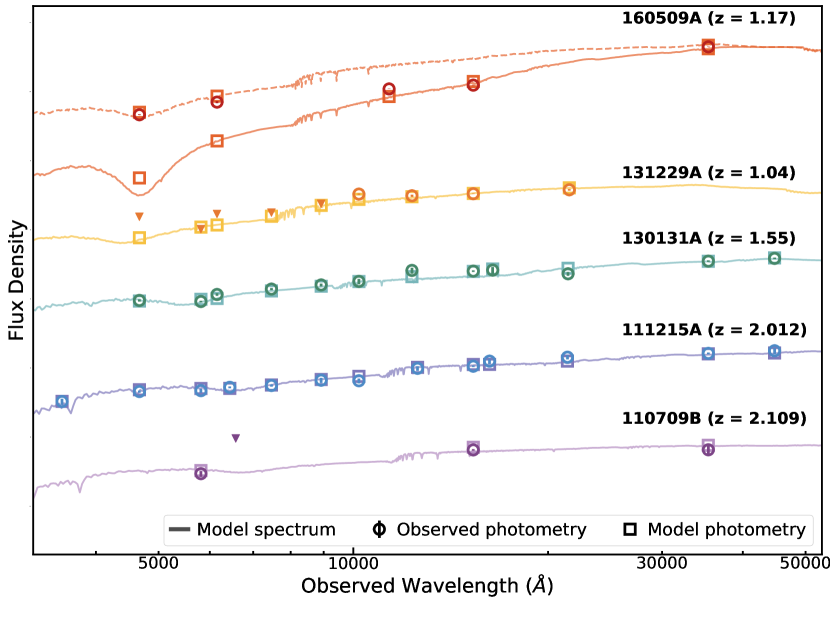
We model the host galaxy of GRB 110709B with photometry from Zauderer et al. (2013c) and Selsing et al. (2019) with a fixed (Perley et al., 2016a; Selsing et al., 2019). We find that the stellar population has dust extinction mag (Table 3). Though the Prospector SED model fits the photometric data well, the model is based on only three detections and one limit (Figure 7).
We fit the host galaxy of GRB 111215A with photometry from van der Horst et al. (2015), corrected for Galactic extinction in the direction of the burst at a fixed the redshift of (van der Horst et al., 2015; Chrimes et al., 2019). We find the host has dust attenuation mag. Our host galaxy properties are similar to those found by van der Horst et al. (2015).
For the host of GRB 130131A, the redshift is unknown, although the spectrum indicates (see Section A.1.3). Thus, we leave redshift as a free parameter with a flat prior of . We find a photometric redshift of , and mag.
For the host of GRB 131229A, the redshift is unknown, although the deep optical limits () indicates a redshift of (see Section A.4.3). Thus, we leave redshift as a free parameter with a flat prior of . We find a photometric redshift of , and mag.
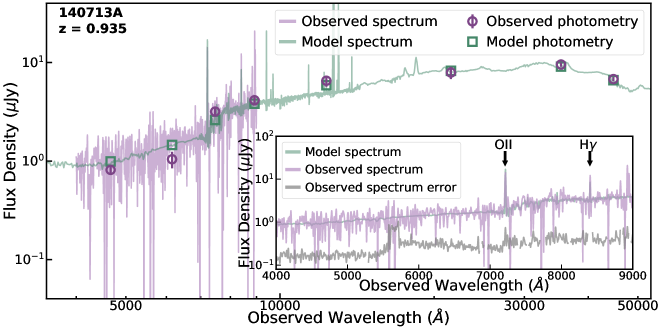
We jointly fit the photometric and spectroscopic data (Table 6) of the host of GRB 140713A. We find that the stellar population has a low mag. We also find that the photometry and spectrum of the host are overall well-fit by the Prospector SED model, especially the [OII] () and H spectral line strengths (Figure 8). Our host galaxy properties are similar to those found by Higgins et al. (2019).
Finally, we fit the host galaxy of GRB 160509A, with a redshift of (Laskar et al., 2016; Kangas et al., 2020). When we fit the full host galaxy SED of Keck/LRIS, HST/WFC3, and Spitzer photometry, our Prospector model over-predicts the Keck/LRIS photometry by an order of magnitude. This may indicate that the Keck/LRIS observations are dominated by afterglow contribution, in contradiction with Laskar et al. (2016). However, this Prospector model also finds a high of , much higher than what is expected for the normal dark GRB host population (i.e. Perley et al. 2013). This high value of is driven by the color between the HST/WFC3 and Spitzer bands, and thus we also fit the host of GRB 160509A with only the Keck/LRIS and Spitzer photometry. This method results in a more expected , but the model under-predicts the HST/WFC3 photometry by a factor of . Without further observations of the host galaxy of GRB 160509A, including re-observing at later times in - and -band, we cannot conclusively determine which fit is correct, and as such we quote the ranges for both fits in Table 3 and present both SEDs in Figure 7.
5 Discussion
We have presented multi-wavelength observations and modeling of the afterglows of five dark GRBs (GRBs 110709B, 111215A, 130131A, 131229A, 140713A), as well as SED modeling of the host galaxies of six dark GRBs with Prospector (GRBs 110709B, 111215A, 130131A, 131229A, 140713A, 160509A). We have classified two additional long GRBs as dark (GRBs 130420B, 130609A) and presented their radio and millimeter observations. However, for these two events, there is insufficient afterglow and host galaxy follow-up to allow for more in-depth modeling. For the purposes of this discussion, we group bursts that have been classified as dark (either explicitly, or satisfying , i.e. Cenko et al. 2009; Melandri et al. 2012; Krühler et al. 2012; Rossi et al. 2012; Littlejohns et al. 2015) and/or “dusty” (i.e. Krühler et al. 2015; Perley et al. 2016a) and refer to both groups as “dark”. Equipped with this larger sample, including the new bursts presented here with particularly high extinction site-lines, we now investigate whether dark GRBs differ from the broader long GRB population in terms of their -ray, afterglow, and host properties. In our comparisons we will refer to any long GRB not classified as dark as a “typical” GRB, for brevity.
5.1 The -ray and afterglow properties of Dark GRBs
To determine whether dark GRBs differ from the typical GRB population, we first examine their -ray properties: fluence (, 15-150 keV band) and duration (), as even the dark GRBs with sparse afterglow data often have uniformly derived -ray properties from Swift/BAT. The exception to this is GRB 160509A, which was instead discovered by the Fermi Large Area Telescope (LAT; Longo et al. 2016). We plot these properties from the catalog in Lien et al. (2016) in Figure 9 for 103 dark GRBs (as classified by Jakobsson et al. 2004; Castro-Tirado et al. 2007; Cenko et al. 2009; van der Horst et al. 2009; Krühler et al. 2011, 2012; Zauderer et al. 2013c; Perley et al. 2013; Hunt et al. 2014; Chrimes et al. 2019, and This Work) as red points, and all other typical GRBs as blue points. We find that there is a notable lack of dark GRBs in the parameter space corresponding to low fluence () and short duration (). For each parameter, we test the null hypothesis that the the dark GRB population is drawn from the same distribution as the typical GRB population using a two-sample Kolmogorov-Smirnov (KS) test from the scipy.stats package, where a value of rejects the null hypothesis. We obtain for the distribution and for the distribution, implying that dark GRBs are not drawn from the typical GRB population in terms of their fluence, but may be in terms of their duration.
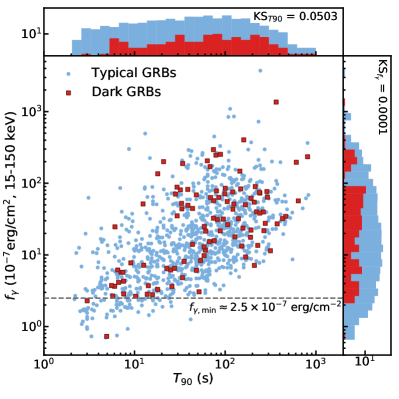
One possible explanation for the lack of dark GRBs in the low and short parameter space may be an observational bias in missing dark GRBs with low fluence666 and are correlated (; Balázs et al. 2004) (van der Horst et al., 2009). Therefore we focus our discussion on ., as these bursts have been shown to have systematically fainter X-ray afterglows, and in turn fainter optical afterglows than the rest of the population (Gehrels et al., 2008). Thus, such bursts may have afterglows which are fainter than the sensitivity threshold of optical afterglow searches, preventing accurate classification of these lower events as dark. To quantify this effect, we use the Jakobsson et al. (2004) darkness classification of , and assume prompt optical observations () of , which represents normal GRB follow-up capabilities. The minimum X-ray flux at 0.1 days needed to accurately classify a burst as dark is . We extrapolate to hr assuming (see Nousek et al. 2006; Zhang et al. 2006; Evans et al. 2009), and use the derived relation of Gehrels et al. (2008) to calculate the minimum fluence of necessary to produce an X-ray afterglow bright enough to accurately classify a GRB as dark. This limit lies just below the majority of dark GRBs with the lowest (Figure 9). Therefore, it is plausible that the lack of low dark bursts is due to an observational bias, as opposed to an intrinsic effect. Additionally, as and are correlated (Balázs et al., 2004), this also provides a natural explanation for the lack of observed dark bursts at . If we exclude bursts with then the dark GRB population does become more statistically similar to the long GRB population ( for the distribution, for the distribution). Finally, we note that there is not a complete catalogue of all dark GRBs, and we may be missing a significant fraction of the dark GRB population. This is made apparent when one considers that the estimated fraction of dark GRBs with respect to all long GRBs is 10-50% (Jakobsson et al., 2004; Cenko et al., 2009; Fynbo et al., 2009; Greiner et al., 2011; Melandri et al., 2012; Perley et al., 2013), whereas only of the long GRBs in Figure 9 have been classified as dark.
We next explore the dark GRB inferred burst explosion properties (e.g., kinetic energies and opening angles) to investigate whether dark GRBs differ from the typical population. As most dark GRBs do not have extensive broadband afterglow modeling, we focus on the six dark GRBs (GRBs 110709B, 111215A, 130131A, 131229A, 140713A, 160509A) in our sample which are uniformly modeled. We find that the dark GRB sample spans a wide range of beaming-corrected kinetic energies (). Compared to the values for other long GRBs with afterglow modeling (Panaitescu & Kumar, 2002; Price et al., 2002; Yost et al., 2003; Frail et al., 2005; Chandra et al., 2008; Cenko et al., 2010, 2011; Laskar et al., 2013c, 2014, 2015; Alexander et al., 2017; Tanvir et al., 2018; Laskar et al., 2018a, b, c, 2019), we find that the kinetic energies of the dark GRB sample are consistent with those of the typical GRB sample, . Additionally, our dark GRB sample spans a wide range of jet opening angles (), with a distribution again consistent with that of the typical GRB population (). There is no clear evidence that dark GRBs are distinct from the typical GRB population in afterglow properties. Our conclusions do not change if we broaden our sample to include the small sample of long GRBs with that have not been classified as dark (GRBs 980329 and 980703; Yost et al. 2003, and GRB 011121; Price et al. 2002).
5.2 The origin of the dust along the line-of-sight
We next consider whether our dark GRB sample has different environmental properties than typical GRBs. In practice, the higher line-of-sight extinctions derived for dark GRBs could be a result of local environment (probed by the afterglow), larger structures such as star-forming regions, global host galaxy dust distributions, or a combination of all three. An investigation into the global and local environmental properties of long GRBs will help determine the cause of the extinction of dark GRBs.
First, we investigate the global host properties of dark GRBs, to examine how their hosts differ from the typical GRB host population. We gather a sample of 150 GRB hosts that have inferred stellar mass measurements (, Savaglio et al. 2009; Leibler & Berger 2010; Perley et al. 2013; Hunt et al. 2014; Piranomonte et al. 2015; Perley et al. 2016b; Japelj et al. 2016; Palmerio et al. 2019, This Work), and plot the distribution of the typical and dark GRB host populations in Figure 10. We find that the host galaxies of dark GRBs tend to be more massive (median ) than typical GRB host galaxies (median ), in alignment with previous results based on smaller samples (Krühler et al., 2011; Perley et al., 2013). Moreover, we find that only (12/82, excluding upper limits) of the hosts of the typical GRB population are more massive than the median host mass of the dark GRB population. A natural explanation could be that high-mass galaxies have a larger number of obscured sight lines as they overall have larger dust contents (e.g. Santini et al. 2014; Calura et al. 2017) which would result in high-, dark GRBs in these types of hosts (Perley et al., 2013).
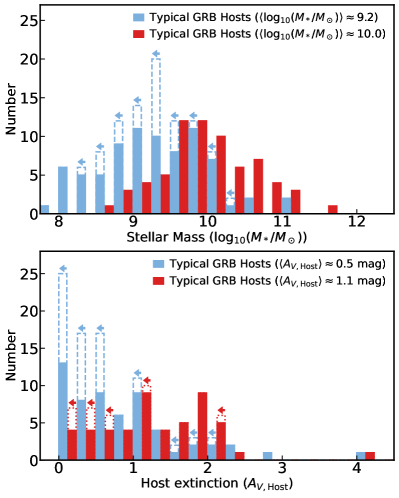
To further this point, we gather a sample of 152 GRBs that have inferred global host extinctions (, Savaglio et al. 2009; Perley et al. 2013; Hunt et al. 2014; Krühler et al. 2015; Piranomonte et al. 2015; Japelj et al. 2016, This Work), and plot the distribution of the typical GRB population and the dark GRB population in Figure 10. Indeed, we find that dark GRBs typically occur in dustier host galaxies (median ) compared to typical GRBs (median ) (see also Perley et al. 2013). This trend, combined with the tendency of dark GRBs to occur in more massive galaxies, implies that the mass of dark GRB host galaxies is linked to a dustier host galaxy overall. Indeed, there are known positive correlations between stellar mass and dust mass (e.g. Santini et al. 2014; Calura et al. 2017), that support this idea. The trend of dark GRBs originating in massive, dusty hosts indicates that the high line-of-sight extinction of dark GRBs is, at least in part, attributed to global host extinction.
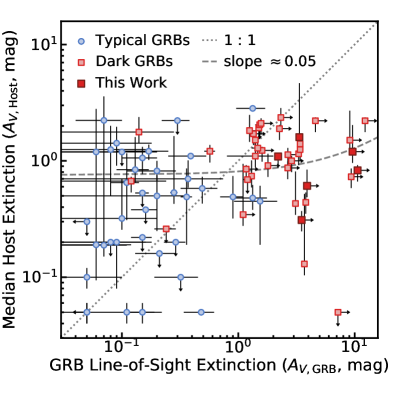
We next investigate whether the dust extinction of dark GRBs as inferred from their afterglows is linked to the dust content of the host galaxy by determining whether is directly linked to the . Perley et al. (2013) suggested that the majority of long GRBs have values within a factor of of their host , following a near relation between and . This correlation between and could occur, for instance, if host galaxies of GRBs have uniform dust distributions, resulting in a homogenous screen of dust in the hosts’ diffuse ISM (see Perley et al. 2013). To test this, we gather available measurements from the literature for typical (Kann et al., 2006, 2010; Liang & Li, 2010; Covino et al., 2013; Zafar et al., 2011; Greiner et al., 2011; Littlejohns et al., 2015) and dark GRBs (Kann et al. 2010; Liang & Li 2010; Krühler et al. 2011; Greiner et al. 2011; Zafar et al. 2011; Perley et al. 2013; Covino et al. 2013; Littlejohns et al. 2015; Laskar et al. 2016, This Work) and compare them to their corresponding (Cenko et al. 2009; Savaglio et al. 2009; Krühler et al. 2011; Perley et al. 2013, 2015; Krühler et al. 2015; Piranomonte et al. 2015; Vergani et al. 2015; Japelj et al. 2016, This Work). We plot the - pairs in Figure 11, and find that the entire long GRB population spans a wide range of () and ( to ).
To test whether there is a relation between and , we randomly sample - pairs from the long GRB sample for which there are published and values, taking into account error bars and upper/lower limits,777For cases in which there are quoted error bars for an value (either or ), we randomly sample using an asymmetric Gaussian, with the value as the mean, , and the upper and lower errors on as the standard deviation, , for either side of the Gaussian, respectively. For cases in which there is an upper limit quoted for an value, we randomly sample using a tophat function from 0 to the value. For GRB 160509A we assume a tophat function for from 1.60-4.66 mag (See Section 4) Finally, for cases in which there is a lower limit quoted for an value, we randomly sample from a half Gaussian distribution with the lower limit as , and a maximum of , such that . and fit a line to the randomly drawn sample using curve_fit from the scipy package. We repeat this process times and produce a distribution of line slopes that are fit by the - pairs. We find that our distribution of - slopes has a median value of , a nearly flat correlation instead of a relation. Moreover, within the dark GRB sample alone, we also find only weak correlation between - (median slope of ). The weak correlation between and could indicate that either that the high line-of-sight extinction is caused by dust extinction from the extremely local (parsec) environment of the dark GRB, or that the host galaxies of long GRBs have patchy, rather than a uniform, dust distributions. In this latter case, the dust extinction driving the high is a geometrical line-of-sight effect that is probabilistic in nature.
To investigate the contribution of the extremely local environment of the GRB (within the blast wave radius ) to the high line-of-sight extinctions, we compare the circumburst densities as inferred from the afterglow. The naive expectation is that if the dust that is providing obscuration of the afterglow originates on parsec scales, dark GRBs will trace environments with higher inferred densities. The sample of six dark GRBs we model in this paper spans a wide range of densities (; in the cases of wind environments we calculate at ). Compared to typical long GRBs (Panaitescu & Kumar, 2002; Price et al., 2002; Yost et al., 2003; Frail et al., 2005; Chandra et al., 2008; Cenko et al., 2010, 2011; Laskar et al., 2013c, 2014, 2015; Alexander et al., 2017; Tanvir et al., 2018; Laskar et al., 2018a, b, c, 2019), the densities of the dark GRBs in our sample fall well within the bounds of the typical GRB sample as a whole (). Additionally, we find that is not correlated with the circumburst density. Indeed, the long GRBs with the highest measured densities (GRBs 050904 and 120404A, ) have low inferred values (; Laskar et al. 2014, 2015). This implies that the higher inferred line-of-site extinction for dark GRBs is not a result of the extremely local environment ().
In summary, we find that dark GRBs tend to occur in more massive, dustier host galaxies than typical GRBs. Additionally, the observed dust obscuration of dark GRBs favors a patchy dust distribution over a uniform one in host galaxies, as is only weakly correlated to . Furthermore, the dust obscuration of dark GRBs is not purely a result of the extremely local (parsec) environment of the GRB, as is not correlated to the circumburst density. The combination of high dust content and a patchy dust distribution results in a higher probability of any given line-of-sight to intersect a patch of dust, leading to a high and dark GRB. The combination of high line-of-sight extinctions, patchy dust distributions, and association of long GRBs with star-foming galaxies, make dark GRBs exciting probes of obscured star formation.
5.3 SFR and Radio Limits
We next place limits on the amount of obscured star formation (SF) occurring in the host galaxies of the typical GRBs and dark GRBs. Long GRBs are inherently linked to SF due to their massive star progenitors and therefore their association with star-forming galaxies (Djorgovski et al., 1998; Christensen et al., 2004; Japelj et al., 2016; Palmerio et al., 2019). Additionally, massive, dusty, galaxies such as those that host dark GRBs often have higher SFRs (Santini et al., 2014; Calura et al., 2017), which has been corroborated by dark GRB host studies (e.g. Perley et al. 2013), and patchy dust distributions within dark GRB hosts may increase the probability of ongoing SF in the host to be obscured (Perley & Perley, 2013). This obscured SF may result in radio bright host galaxies, as the dust becomes transparent at radio wavelengths and reveals the true SFR (), whereas the SFR measured from UV/optical (e.g. emission line) diagnostics and from stellar population synthesis modeling of broad-band, galaxy-integrated photometry is only sensitive to the SFR unobscured by dust (Perley & Perley, 2013). The search for radio emission from typical GRB host galaxies and dark GRB hosts is of interest as the results help answer the question of whether long GRBs are biased or unbiased tracers of SF across the universe (i.e. Perley & Perley 2013; Perley et al. 2015; Gatkine et al. 2020).
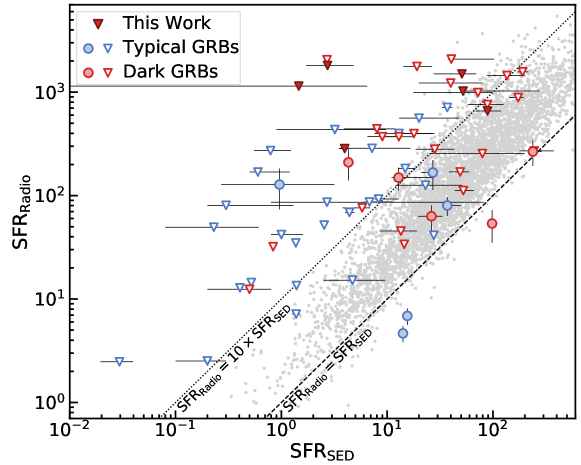
Several studies have been conducted to search for radio emission from long GRB host galaxies (Perley & Perley, 2013; Stanway et al., 2014; Perley et al., 2015; Greiner et al., 2016; Perley et al., 2017; Gatkine et al., 2020; Eftekhari et al., 2021), with a handful () of successful detections. These studies are not necessarily representative of the overall long GRB host population, as some focused exclusively on dark GRBs, some focused on typical GRBs at high redshift (), and few took an unbiased approach to all long GRB hosts. As there is no large, unbiased, survey of radio observations of long GRB host galaxies, we must rely on the these smaller studies, despite their potential biases in sample selection. We collect the radio fluxes from these studies to provide a broad view of the currently available observations, as well as to make comparisons to our sample of six dark GRBs. We calculate the of these observations using the relation in Greiner et al. (2016) (assuming a spectral index of ), and plot them against the SED-derived SFR (, Perley et al. 2013, 2015, supplementing with UV-derived SFR or SFR tracers such as , , and from Hunt et al. 2014; Krühler et al. 2015), in Figure 12. For comparison, we also plot a sample of star-forming field galaxies at comparable redshifts () from the VLA-COSMOS source catalog (Smolčić et al., 2017).
The VLA-COSMOS sources typically have SFR ratios, , on the order of . We define galaxies with “significant” obscured SF as galaxies that satisfy . Of the long GRB host galaxies that have been observed at radio wavelengths, only have unambiguous host detections (Perley & Perley, 2013; Stanway et al., 2014; Perley et al., 2015, 2017). Of the detected long GRB host galaxies, only 3 display significant amounts of obscured SF, and the majority of radio detected long GRB hosts have within the range we would expect compared to other star forming galaxies (, i.e. the VLA-COSMOS sources).
To assess the detectability of such obscured SF in the hosts of the six dark GRBs in our sample, we now place upper limits on the of the host galaxies. We consider the most constraining afterglow upper limits of our sample (Zauderer et al. 2013c; van der Horst et al. 2015; Chandra & Nayana 2014a; Laskar et al. 2016, This Work), and we place limits of (also plotted in Figure 12). With the afterglow radio limits, we are unable to rule out significant amounts of obscured SF for all bursts in our sample except GRB 130131A. We also searched the VLASS (Lacy et al., 2020) for radio emission at 3 GHz at the positions of the bursts, but found the non-detections to be less constraining than the radio afterglow upper limits; this holds true even for the projected total sensitivity of VLASS of the combined 3 epochs ().
With the next generation VLA (ngVLA), we would be sensitive to radio emission at the level of with one hour of observation at 2.4 GHz (Carilli et al., 2015)888https://ngvla.nrao.edu/page/performance. This radio flux would correspond to for . With the ngVLA, we would be able to detect at least 5 of the 6 dark GRB hosts in our sample (with the exception of GRB 110709B, whose is lower than that of the ngVLA limit at the host redshift), assuming (corresponding to unobscured SF). If we consider an unbiased sample of long GRBs, such as the Swift/BAT6 sample (Salvaterra et al., 2012), we can calculate the expected detection fraction of the long GRB host galaxies by the ngVLA. Of the 24 Swift/BAT6 host galaxies at with (or lower limits on ) presented in Japelj et al. (2016) and Palmerio et al. (2019), we calculate a detection rate with the ngVLA of , assuming . A detection rate much larger than these estimates would indicate that long GRB hosts have some amount of obscured star formation, and exact measurements of would determine the fraction of long GRB host galaxies that house significant obscured SF.
6 Conclusions
We have newly classified 2 long GRBs as dark (GRB 130420B and GRB 160509A) and presented VLA, CARMA, and PdBI afterglow observations of five dark GRBs (GRB 130131A, 130420B, 130609A, 131229A, and 140713A). We uniformly modeled the radio to X-ray afterglow of five dark GRBs with VLA detections (GRB 110709B, 111215A, 130131A, 131229A, and 140713A), using our afterglow modeling software that incorporates effects due to jet breaks, scintillation, and IC cooling, and include one dark GRB from the literature which was modeled using the same method and software. The radio detections allowed us to determine the environment and break frequencies of the synchrotron afterglow, in turn constraining the burst energetics, circumburst density, and geometries. Additionally, we fit the host galaxies of 6 dark GRBs (GRB 110709B, 111215A, 130131A, 131229A, 140713A and 160509A) using Prospector, and present photometric redshifts for 2 of the dark GRBs (GRB 130131A at and GRB 131229A at ). We come to the following conclusions:
-
•
Dark GRBs are not distinct from typical long GRBs in terms of duration, burst kinetic energy, jet opening angle, or circumburst density. However, they are statistically distinct from typical long GRBs in terms of fluence, though this distinction may be attributed to observational biases and inconsistent classification of dark GRBs.
-
•
Our sample of six uniformly modeled dark GRBs with VLA detections have line-of-sight extinction values of , demonstrating the importance of radio observations in revealing GRBs with heavily dust-obscured sightlines. These values are to times greater than their median host galaxy values .
-
•
While dark GRBs do occur in dustier and more massive galaxies than typical long GRBs, the line-of-sight extinction is not strongly correlated to the median host extinction, nor to the circumburst density. This indicates that the origin of the dust along the line-of-sight is due to a clumpy, rather than uniform, dust distribution within the host galaxy. This also disfavors a dust origin from the extremely local () environment of the burst.
-
•
Targeted radio searches with sensitivity (e.g. the ngVLA) should be capable of detecting of long GRB host galaxies at , where a higher detection rate and exact flux measurements will determine the amount of obscured SF within long GRB hosts.
Our work demonstrates the unique power of rapid-response radio observations with the VLA in uncovering the most obscured GRBs via their afterglows. This is especially important given that these events by definition have extinguished optical emission. Additionally, observations of dark GRB environments, from parsec to kiloparsec scales, lends insight on the distribution of dust and star formation in the galaxies which give rise to these relatively rare transients. Looking forward, next generation radio facilities, in conjunction with UV-optical observations, can be leveraged to determine the degree of obscured star formation for a large population of GRB environments across redshift.
7 Acknowledgements
G.S. acknowledges for this work was provided by the NSF through Student Observing Support award SOSP20B-001 from the NRAO. The Fong Group at Northwestern acknowledges support by the National Science Foundation under grant Nos. AST-1814782, AST-1909358 and CAREER grant No. AST-2047919. W.F. gratefully acknowledges support by the David and Lucile Packard Foundation. AJCT acknowledges support from the Spanish Ministry Project PID2020-118491GB-I00, Junta de Andalucía Project P20_01068 and the ”Center of Excellence Severo Ochoa” award for the Instituto de Astrofísica de Andalucía (SEV-2017-0709)
The National Radio Astronomy Observatory is a facility of the National Science Foundation operated under cooperative agreement by Associated Universities, Inc. This work made use of data supplied by the UK Swift Science Data Centre at the University of Leicester. The National Radio Astronomy Observatory is a facility of the National Science Foundation operated under cooperative agreement by Associated Universities, Inc. This work is based on observations carried out under project number S14DD004 with the IRAM NOEMA Interferometer. IRAM is supported by INSU/CNRS (France), MPG (Germany) and IGN (Spain). This research was supported in part through the computational resources and staff contributions provided for the Quest high performance computing facility at Northwestern University which is jointly supported by the Office of the Provost, the Office for Research, and Northwestern University Information Technology. W. M. Keck Observatory and MMT Observatory access was supported by Northwestern University and the Center for Interdisciplinary Exploration and Research in Astrophysics (CIERA). Some of the data presented herein were obtained at the W. M. Keck Observatory, which is operated as a scientific partnership among the California Institute of Technology, the University of California and the National Aeronautics and Space Administration. The Observatory was made possible by the generous financial support of the W. M. Keck Foundation. The authors wish to recognize and acknowledge the very significant cultural role and reverence that the summit of Maunakea has always had within the indigenous Hawaiian community. We are most fortunate to have the opportunity to conduct observations from this mountain. Some observations reported here were obtained at the MMT Observatory, a joint facility of the University of Arizona and the Smithsonian Institution. The United Kingdom Infrared Telescope (UKIRT) was supported by NASA and operated under an agreement among the University of Hawaii, the University of Arizona, and Lockheed Martin Advanced Technology Center; operations are enabled through the cooperation of the East Asian Observatory. We thank the Cambridge Astronomical Survey Unit (CASU) for processing the WFCAM data and the WFCAM Science Archive (WSA) for making the data available. This paper includes data gathered with the 6.5 meter Magellan Telescopes located at Las Campanas Observatory, Chile. The LBT is an international collaboration among institutions in the United States, Italy and Germany. The LBT Corporation partners are: The University of Arizona on behalf of the Arizona university system; Istituto Nazionale di Astrofisica, Italy; LBT Beteiligungsgesellschaft, Germany, representing the Max Planck Society, the Astrophysical Institute Potsdam, and Heidelberg University; The Ohio State University; The Research Corporation, on behalf of The University of Notre Dame, University of Minnesota and University of Virginia. IRAF is distributed by the National Optical Astronomy Observatory, which is operated by the Association of Universities for Research in Astronomy (AURA) under a cooperative agreement with the National Science Foundation. This publication makes use of data products from the Two Micron All Sky Survey, which is a joint project of the University of Massachusetts and the Infrared Processing and Analysis Center/California Institute of Technology, funded by the National Aeronautics and Space Administration and the National Science Foundation.
| GRB | R.A. | Dec. | 90% Error | (15-350 keV) | (15-150 keV) | |
|---|---|---|---|---|---|---|
| (J2000) | (J2000) | () | (s) | () | ||
| 130131A | 11h 24m 30.31s | 1.4 | 51.52 | |||
| 130420B | 12h 12m 30.79s | 2.0 | 12.64 | |||
| 130609A | 10h 10m 40.44s | 1.7 | 7.06 | |||
| 131229A | 05h 40m 55.62s | 1.4 | 48.0 | |||
| 140713A | 18h 44m 25.41s | 1.4 | 6.02 |
Appendix A Observations
Here we present the X-ray to radio afterglow observations of the 8 dark GRBs in our sample, as well as their host galaxy observations. For the five dark GRBs with no previously published VLA observations, we summarize the Neil Gehrels Swift Observatory (Swift) X-ray Telescope (XRT) properties in Table 4. Unless otherwise stated, all VLA data were manually reduced using standard procedures with the Common Astronomy Software Applications (CASA, McMullin et al. 2007), and all Combined Array for Research in Millimeter Astronomy (CARMA) data were manually reduced using standard procedures with the Miriad software package (Sault et al., 1995). For VLA and CARMA observations, we measure the flux density and position of the afterglow using the imtool program under the pwkit package, which fits the afterglow to a point source (Williams et al., 2017b). The radio observations, including the configuration, gain, bandpass, and flux, calibrators, are summarized in Table 5.
A.1 GRB 130131A
A.1.1 Swift and Optical Observations
GRB 130131A was discovered by the Burst Alert Telescope (BAT) on-board Swift on 2013 January 31.58 (Grupe et al., 2013). The XRT started observations of GRB 130131A at s (where is the time after BAT trigger), finding an uncatalogued X-ray source within the BAT position (Grupe et al., 2013; Evans et al., 2013).
An uncatalogued, fading, optical/near-infrared (NIR) source was found within the XRT error circle at days in -, -, and -band, and was determined to be the optical/NIR afterglow after the source faded by mag in band by days (Volnova et al., 2013; Tanvir et al., 2013a, b). We initiated MMT SAO Widefield InfraRed Camera (SWIRC) observations at days in - and -band and detected a source coincident with the optical/NIR afterglow (Volnova et al., 2013; Tanvir et al., 2013a, b) in both bands. For photometric calibration, we use sources in the field in common with the 2MASS catalog, and perform aperture photometry using IRAF. We find afterglow magnitudes of mag in -band and mag in -band at a position of R.A.=11h 24m 30.35s and Dec= with a positional uncertainty of .
Interpolating the XRT light curve to the times of the -band observations, we find at 0.016 days and 0.041 days, meeting the Jakobsson et al. (2004) criterion and confirming the darkness classification first asserted by Volnova et al. (2013). We find , and therefore, for the -band detections, indicating that GRB 130131A also meets the van der Horst et al. (2009) darkness criterion.
A.1.2 Radio Afterglow Discovery
| GRB | Facility | Config. | Mid-time | Gain/Band-pass/Flux | |||
|---|---|---|---|---|---|---|---|
| (UT) | (d) | (Calibrators) | (GHz) | (Jy) | |||
| 130131A | VLA | D | 2013 Feb 1.27 | 0.68 | J1146+3958/3C286/3C286 | 6.0 | 29.4 8.1 |
| J1153+4931/3C286/3C286 | 19.2 | 124.0 31.6 | |||||
| 24.5 | 142.3 26.5 | ||||||
| 2013 Feb 2.59 | 1.99 | J1146+3958/3C286/3C286 | 6.0 | ||||
| J1153+4931/3C286/3C286 | 19.2 | 116.3 13.7 | |||||
| 24.5 | 116.2 17.3 | ||||||
| 2013 Feb 5.28 | 4.68 | J1146+3958/3C286/3C286 | 6.0 | 54.2 10.5 | |||
| J1153+4931/3C286/3C286 | 19.2 | 63.1 18.4 | |||||
| 24.5 | 47.4 | ||||||
| 2013 Feb 14.47 | 13.88 | J1146+3958/3C286/3C286 | 6.0 | 28.5 | |||
| J1153+4931/3C286/3C286 | 19.2 | 20.4 | |||||
| 24.5 | |||||||
| CARMA | B | 2013 Feb 1.45 | 0.67 | 1153+495/0927+390/Jupiter | 85.5 | 230 | |
| 2013 Feb 2.49 | 1.91 | 1153+495/3C273/3C273 | 85.5 | 235 | |||
| 2013 Feb 3.40 | 2.82 | 85.5 | 491 | ||||
| 130420B | VLA | D | 2013 Apr 23.32 | 2.78 | J1219+4829/3C286/3C286 | 6.0 | |
| 2013 Apr 23.32 | 2.78 | 21.8 | |||||
| CARMA | C | 2013 Apr 23.14 | 2.60 | 1153+495/0927+39/3C84 | 85.5 | ||
| 130609A | VLA | C | 2013 Jun 9.9 | 0.78 | J0956+2515/3C147/3C147 | 6.0 | |
| 2013 Jun 9.9 | 0.78 | 21.8 | |||||
| CARMA | D | 2013 Jun 10.15 | 1.02 | 0956+252/0927+390/0854+201 | 85.5 | ||
| 131229A | VLA | B | 2013 Dec 30.18 | 0.91 | J0541-0541/J0541-0541/J0541-0541 | 6.0 | |
| 2013 Dec 30.18 | 0.91 | 21.8 | |||||
| 140713A | VLA | D | 2014 Jul 17.12 | 3.34 | J1927+6117/3C286/3C286 | 13.4 | 779.4 35.2 |
| 15.9 | 872.6 37.3 | ||||||
| 2014 Jul 17.14 | 3.36 | 4.9 | 94.3 24.3 | ||||
| 7.0 | 119.5 18.4 | ||||||
| 2014 Jul 20.11 | 6.33 | 13.4 | 739.1 47.0 | ||||
| 15.9 | 901.9 73.3 | ||||||
| 2014 Jul 20.13 | 6.35 | 4.9 | 111.8 20.3 | ||||
| 7.0 | 237.5 15.1 | ||||||
| 2014 Jul 26.08 | 12.30 | 13.4 | 2149.6 38.6 | ||||
| 15.9 | 2274.0 35.0 | ||||||
| 2014 Jul 26.1 | 12.32 | 4.9 | 219.5 18.8 | ||||
| 7.0 | 897.8 21.9 | ||||||
| 2014 Aug 8.05 | 25.27 | 13.4 | 950.3 22.0 | ||||
| 15.9 | 931.5 21.9 | ||||||
| 2014 Aug 8.07 | 25.29 | 4.9 | 130.2 27.9 | ||||
| 7.0 | 150.0 15.2 | ||||||
| 2014 Aug 28.04 | 45.26 | 13.4 | 267.0 16.0 | ||||
| 15.9 | 229.6 14.7 | ||||||
| 2014 Aug 28.06 | 45.28 | 4.9 | 315.6 14.2 | ||||
| 7.0 | 379.1 39.7 | ||||||
| 2014 Sep 14.97 | 63.19 | 13.4 | 159.1 14.3 | ||||
| 15.9 | 118.2 19.7 | ||||||
| 2014 Sep 14.99 | 63.21 | 4.9 | 100.5 13.1 | ||||
| 7.0 | 116.5 26.8 | ||||||
| PdBI | D | 2014 Jul 18.16 | 4.38 | –/–/MWC349 | 86.7 | 3180.0 90.0 | |
| 2014 Jul 28.97 | 15.19 | 86.7 | 1030.0 110.0 | ||||
| 2014 Aug 12.08 | 29.3 | 86.7 | 260.0 130.0 | ||||
| 2014 Aug 14.04 | 31.26 | 86.7 | 190.0 80.0 | ||||
| 2014 Sep 14.85 | 63.07 | 86.7 | |||||
| CARMA | E | 2014 Jul 15.37 | 1.59 | 1849+670/1927+739/MWC349 | 85.5 | 1506.8 255.0 | |
| 2014 Jul 17.28 | 3.50 | 85.5 | 3863.9 297.2 | ||||
| 2014 Jul 18.41 | 4.63 | 85.5 | 3008.0 302.3 | ||||
| 2014 Jul 20.18 | 6.40 | 1849+670/1512-090/MWC349 | 85.5 | 2396.6 332.3 | |||
| 2014 Jul 22.37 | 8.59 | 1849+670/1927+739/MWC349 | 85.5 | 2072.9 215.0 | |||
| 2014 Jul 26.32 | 12.54 | 85.5 | 1529.3 198.6 | ||||
| 2014 Aug 11.14 | 28.36 | 1849+670/3C279/MWC349 | 85.5 | 670.2 |
We initiated a series of four observations of GRB 130131A starting on 2013 February 1.28 UT with the VLA under Program 13A-046 (PI: E. Berger) at 6.0 GHz and 21.8 GHz (side-band frequencies of 19.2 GHz and 24.5 GHz). We detect a clear source within the XRT error circle with significance of at 6.0 GHz (the information presented here supersedes the information from a preliminary reduction reported in Laskar et al. 2013b). We took further VLA 6.0 GHz and 21.8 GHz observations until 2013 February 14.47 UT. The first 3 epochs of observations were taken with 8-bit sampling, while we used 3-bit sampling for the final 21.8 GHz observations to improve sensitivity. Due to the increased complexity of the 3-bit observations, we used the CASA VLA pipeline (version 2020.1.0.36) for the reduction (McMullin et al., 2007). The details of the VLA observations are listed in Table 5. Using the observation with the highest signal to noise (the second 21.8 GHz epoch), we derive a position for the radio afterglow of R.A.=11h 24m 30.401s () and Dec= ().
We initiated a series of three observations of GRB 130131A starting on 2013 February 1.45 UT using CARMA under program number c0999 (PI: A. Zauderer). We observed the field at a mean frequency of 85.5 GHz and do not detect a source to a limit of (the information presented here supercedes the marginal detection reported in Zauderer et al. 2013a). We took further observations until 2013 February 3.40 UT, with no significant detection. The details of the CARMA observations are listed in Table 5.
A.1.3 Host Galaxy Observations
The faint host galaxy of GRB 130131A was first reported in Chrimes et al. (2019), within the XRT position (Evans et al., 2009). We initiated band observations of the host galaxy on 2015 December 3 UT with the Large Binocular Camera (LBC) on the Large Binocular Telescope (LBT/LBC) atop Mount Graham, Arizona. We reduced these images using standard routines in the IRAF/ccdproc package (Tody, 1986, 1993). We applied bias and flat-field corrections and co-added the dithered images in each filter. We performed absolute astrometry with IRAF/ccmap and ccsetwcs using sources in common with the SDSS DR12 catalog (Alam et al., 2015). Using SExtractor (Bertin & Arnouts, 1996), we measure a position of the host: R.A.=11h 24m 30.317s and Dec =. The radio and NIR afterglows are at projected offsets of 0.857 and 0.401 from the host, respectively (Figure 1).
| GRB | Date | Telescope/Instrument | Filter | Exposure Time | Magnitude | Reference | ||
|---|---|---|---|---|---|---|---|---|
| (UT) | (s) | (AB) | (AB) | |||||
| 130131A | 2015-12-03 | LBT/LBC | This work | |||||
| 2014-10-09 | HST/WFC3 | F606W | 1101 | 0.039 | Chrimes et al. (2019) | |||
| 2015-12-03 | LBT/LBC | This Work | ||||||
| 2015-12-03 | LBT/LBC | |||||||
| 2015-12-03 | LBT/LBC | |||||||
| 2020-12-26 | MMT/MMIRS | 0.017 | ||||||
| 2016-03-18 | UKIRT/WFCAM | |||||||
| 2016-03-18 | UKIRT/WFCAM | |||||||
| 2021-01-08 | MMT/MMIRS | 0.005 | ||||||
| 2014-10-09 | HST/WFC3 | F160W | 1059 | 0.008 | Chrimes et al. (2019) | |||
| 2016-07-17 | Spitzer/IRAC | 3.6m | 36 100 | 0.002 | This work | |||
| 2016-07-17 | Spitzer/IRAC | 4.5m | 36 100 | - | ||||
| 130420B | 2020-11-23 | MMT/Binospec | This work | |||||
| 130609A | 2020-11-20 | MMT/Binospec | † | This work | ||||
| 2020-12-01 | MMT/MMIRS | † | ||||||
| 131229A | 2014-10-22 | LBT/LBC | This work | |||||
| 2014-08-14 | HST/WFC3 | Chrimes et al. (2019) | ||||||
| 2014-10-22 | LBT/LBC | This Work | ||||||
| 2014-10-22 | LBT/LBC | |||||||
| 2014-10-22 | LBT/LBC | |||||||
| 2013-12-29 | Magellan/LDSS3 | Chornock et al. (2013b)a | ||||||
| 2020-01-08 | MMT/MMIRS | This Work | ||||||
| 2015-03-29 | Magellan/Fourstar | |||||||
| 2014-08-14 | HST/WFC3 | Chrimes et al. (2019) | ||||||
| 2015-03-30 | Magellan/Fourstar | This work | ||||||
| 140713A | 2014-10-23 | LBT/LBC | 300 3 | 24.12 0.09 | 0.16 | This work | ||
| 2014-10-23 | LBT/LBC | 300 4 | 23.85 0.19 | 0.11 | ||||
| 2014-10-23 | LBT/LBC | 150 8 | 22.65 0.09 | 0.08 | ||||
| 2014-10-23 | LBT/LBC | 150 6 | 22.36 0.12 | 0.06 | ||||
| 2018-10-18 | Keck/MOSFIRE | 60 27 | 21.93 0.16 | 0.04 | ||||
| 2018-10-18 | Keck/MOSFIRE | Ks | 60 29 | 21.69 0.18 | 0.02 | |||
| 2016-11-08 | Spitzer/IRAC | 3.6m | 36 100 | 0.01 | Higgins et al. (2019) | |||
| 2016-11-08 | Spitzer/IRAC | 4.5m | 36 100 | - | ||||
| 160509A | 2016-06-07 | Keck/LRIS | 3 330 | 24.434 0.12 | 0.956 | Laskar et al. (2016) | ||
| 2016-06-07 | Keck/LRIS | 3 300 | 23.519 0.35 | 0.661 | ||||
| 2017-07-05 | HST/WFC3 | 2697 | 22.565 0.03 | 0.255 | This Work | |||
| 2017-07-05 | HST/WFC3 | 2797 | 22.292 0.03 | 0.148 | ||||
| 2017-11-05 | Spitzer/IRAC | 3.6m | 32 93.6 | 0.047 |
We initiated NIR -band observations of the host galaxy in 2016 March, 2020 December, and 2021 January using the Wide-field Camera (WFCAM; Casali et al. 2007) mounted on the 3.8-m United Kingdom Infrared Telescope (UKIRT) and the MMT and Magellan Infrared Spectrograph (MMIRS) on the MMT telescope. For UKIRT data, we obtained pre-processed images from the WFCAM Science Archive (Hamly et al., 2008), which are corrected for bias, flat-field, and dark current by the Cambridge Astronomical Survey Unit999http://casu.ast.cam.ac.uk/. For each filter, we co-added the images and performed astrometry relative to 2MASS using a combination of tasks in Starlink101010http://starlink.eao.hawaii.edu/starlink and IRAF. For MMIRS data, we used a custom pipeline, POTPyRI111111https://github.com/CIERA-Transients/POTPyRI, to perform bias, flat-fielding, dark corrections, sky subtraction, and co-addition.
The host galaxy is detected in all bands. We performed aperture photometry of the host using IRAF/phot with a source radius of and a background annulus immediately surrounding the host. For photometric calibration, we use sources in the field in common with the SDSS DR12 and 2MASS catalogs and employ the standard Vega to AB conversions as necessary. The host galaxy is faint, with mag, but with red colors ( mag). Our full photometric results are listed in Table 6. Using the projected offset from the radio and optical afterglows and the -band magnitude, we calculate a probability of chance coincidence (Bloom et al., 2002), , establishing a robust association with GRB 130131A.
We obtained s of spectroscopy with the Multi-Object Double Spectrograph (MODS) mounted on the LBT on 2015 December 4 UT with the 200l grating, to cover a wavelength range of Å. The spectral continuum is weakly detected with an average . The spectrum does not exhibit any obvious features to Å, yielding a tentative lower limit on the redshift of (due to the absence of [OII]). This is consistent with the redshift upper limit of from the detection of the host in the HST F160W and F606W bands (Chrimes et al., 2019).
The host galaxy is well detected in Spitzer/IRAC m and m observations taken on 2016 July 17 (PI: Perley). We downloaded the pipeline processed post-basic calibrated data (pbcd) mosaics and performed photometry using a 3″ aperture and 3″–7″ background annulus, masking nearby bright sources from the background region. We applied standard aperture corrections121212https://irsa.ipac.caltech.edu/data/SPITZER/docs/irac/calibrationfiles/ap_corr_warm/, and obtain host magnitudes of and at and , respectively.
A.2 GRB 130420B
A.2.1 Swift and Optical Observations
GRB 130420B was discovered by BAT on 2013 April 20.54 (Oates et al., 2013). The XRT started observations of GRB 130420B at , finding an uncatalogued X-ray source within the BAT position (Oates et al., 2013). Ground-based follow-up at optical wavelengths to search for the optical afterglow of GRB 130420B reached limiting magnitudes of at a mean time of using the 2.4m Gao-Mei-Gu (GMG) telescope (Zhao et al., 2013). We interpolate the X-ray light curve to the time of the most constraining optical limit, and we calculate , meeting the criterion of a dark burst as determined by Jakobsson et al. (2004). We find , leading to , which does not meet the darkness criteria of van der Horst et al. (2009), due to GRB 130420B’s shallow .
A.2.2 Radio and Millimeter Observations
We initiated observations of GRB 130420B on 2013 April 23.14 () with CARMA under program number c0999 (PI: A. Zauderer) at a mean frequency of 85.5 GHz. We do not detect any source within the XRT error circle to a limit of (the information presented here supercedes the information from a preliminary reduction reported in Zauderer & Berger 2013).
We initiated observations of GRB 130420B on 2013 April 23.32 () with the VLA under program 13A-046 (PI: E. Berger) at 6.0 GHz and 21.8 GHz. We do not detect a source within the XRT error circle to a limit of at 6.0 GHz and at 21.8 GHz (the information presented here supercedes the information from a preliminary reduction reported in Zauderer & Berger 2013).
A.2.3 Host Galaxy Search
We obtained MMT/Binospec -band observations of the field of GRB 130420B in Nov 2020. While there is a point source directly to the west of the XRT position (Evans et al., 2009), we do not detect any source within the XRT position (90% confidence) to a limit of mag. The Binospec image is shown in Figure 1.
A.3 GRB 130609A
A.3.1 Swift and Optical Observations
GRB 130609A was discovered by BAT (Cummings et al., 2013). XRT started observations at , finding an uncatalogued X-ray source within the BAT position (Cummings et al., 2013). Deep optical and NIR observations to search for the afterglow of GRB 130609A were taken at a mean time of , using the Reionization and Transients Infrared Camera (RATIR) in the -bands, reaching limits of to in and band, respectively (Butler et al., 2013). We interpolate the X-ray light curve to the time of the most constraining optical limit ( at ), and we calculate , meeting the criterion of a dark burst as determined by Jakobsson et al. (2004), and confirming the classification suggested by Perley & Cenko (2013). We find , leading to , confirming GRB 130609A is also dark according to the criterion of van der Horst et al. (2009).
A.3.2 Radio and Millimeter Observations
We initiated observations of GRB 130609A on 2013 June 9.9 UT () with the VLA under program 13A-046 (PI: E. Berger) at 6.0 GHz and 21.8 GHz. We do not detect a source within the XRT error circle to a limit of at 6.0 GHz and at 21.8 GHz (Zauderer et al., 2013b).
We initiated observations of GRB 130609A on 2013 June 10.15 () with CARMA under program number c0999 (PI: A. Zauderer) at a mean frequency of 85.5 GHz. We do not detect any source within the XRT error circle to a limit of (the information presented here supercedes the information from a preliminary reduction reported in Zauderer et al. 2013b).
A.3.3 Host Galaxy Search
We obtained deep MMT/Binospec -band and MMIRS -band observations of the field of GRB 130609A in Nov and Dec 2020 to search for a host galaxy. The -band imaging reveals a source within the XRT position (Evans et al., 2009) with mag; this source is also weakly detected in -band (labeled “S1” in Figure 1). However, this source has a PSF consistent with being point-like, indicating that it is a foreground star. We identify a second, fainter source to the northwest of the XRT position (labeled “S2” in Figure 1) with mag that is more clearly extended and is a potential host of GRB 130609A. Thus, it is difficult to draw any strong conclusions regarding the origin or redshift of GRB 130609A.
A.4 GRB 131229A
A.4.1 X-ray and Optical Observations
GRB 131229A was discovered by BAT on 2013 December 29.28 (Page et al., 2013). The XRT started observations of GRB 131229A at , finding an uncatalogued X-ray source within the BAT position (Page et al., 2013). We initiated deep optical ground-based observations to search for the optical afterglow of GRB 131229A with the 6.5 m Magellan Clay telescope in -bands at a mean time of , reaching (Chornock et al., 2013b). We interpolate the X-ray light curve to the time of the most constraining optical limit, and we calculate , meeting the criterion of a dark burst as determined by Jakobsson et al. (2004), and confirming the classification of Chrimes et al. (2019). We find , leading to , confirming GRB 131229A is also dark according to the criterion of van der Horst et al. (2009).
Chandra observations of GRB 131229A (PI: Levan, ObsID 15195) were initiated at a midtime of 2014 Jan 06.12 () with a total effective exposure time of 15.05 ks. The X-ray afterglow was detected with a count rate of s-1 (Chrimes et al., 2019).
A.4.2 Radio and Millimeter Observations
We initiated observations of GRB 131229A on 2013 December 30.18 () with the VLA under program 13A-541 (PI: E. Berger) at 6.0 GHz and 21.8 GHz. We do not detect a source within the XRT error circle at 21.8 GHz to a limit of . We detect a clear source within the XRT error circle of significance of at 6.0 GHz at a position of R.A.=05h 40m 55.649s () and Dec= (). We did not re-observe the field, and thus the variability of the source could not be determined, therefore we cannot definitively claim this source as the radio afterglow of GRB 131229A. To place limits on the presence of a background radio source, we searched the VLA Sky Survey (VLASS, Lacy et al. 2020), and found no source within the XRT localization to a limit of at 3.0 GHz (with observations taken ).
GRB 131229A was observed with CARMA at 93.0 GHz at a mean time of after the burst. No millimeter afterglow emission was found within the XRT error circle to a limit of (Perley, 2013).
A.4.3 Host Galaxy Observations
The faint host galaxy of GRB 131229A was first reported in Chrimes et al. (2019) from HST/F160W imaging, and it is the only detected object within the 90% XRT position (Figure 1, Evans et al. 2009). We obtained observations of the field with LBT/LBC (-bands), MMT/MMIRS (-band), and Magellan/Fourstar (-bands). We reduced and co-added the data in a similar manner as described before. The host galaxy is not detected in any of our optical imaging to deep limits of mag, and is weakly detected in our , and -band imaging with mag. Overall, the host is red, with mag, is at a offset from the VLA position and has a . Our full photometric results are listed in Table 6. From the -band image, we measure a position for the host of R.A.=5h 40m 55.632s and Dec=. The deep non-detection of the host in the -band, coupled with a brightness at -band that is mag brighter, suggest a 4000Å break in this wavelength regime, with a redshift of .
To place the Chandra afterglow on the host galaxy image, we perform relative astrometry using three common sources between Chandra and Magellan -band. We obtained the Chandra observation from the archive (PI: Levan; ObsID 15195). We find a tie uncertainty of . The corrected position is R.A. = 05h 40m 55.64s and Dec. = with a positional uncertainty of (including the uncertainty in the astrometric tie, the positional uncertainty, and the absolute astrometric uncertainty of ). Our Chandra afterglow position is consistent with the VLA C-band afterglow position and intersects the host galaxy of GRB 131229A (Figure 1).
A.5 GRB 140713A
A.5.1 Swift and Optical Observations
GRB 140713A was discovered by BAT on 2014 July 13.78 (Mangano et al., 2014).The XRT began observations starting at s, detecting an uncatalogued X-ray source within the BAT position (Mangano et al., 2014; Beardmore et al., 2014). Deep optical observations to search for the optical afterglow using the ALFOSC instrument on the 2.5-m Nordic Optical Telescope (NOT) were taken at , resulting in upper limits on the afterglow flux of , , and (Cano et al., 2014; Higgins et al., 2019). We interpolate the X-ray light curve to the time of the deepest optical limit ( mag at ), and we calculate , meeting the criterion of a dark burst as determined by Jakobsson et al. (2004), and confirming the classification of Higgins et al. (2019). We find , leading to , indicating GRB 140713A also meets the darkness criterion of van der Horst et al. (2009).
A.5.2 Radio and Millimeter Observations
We initiated a series of seven observations of GRB 140713A starting on 2014 July 15.37 UT () until 2014 August 11.14 UT () with CARMA under program number c0999 (PI: A. Zauderer) at a mean frequency of 85.5 GHz. In the first observation, we detect a clear source within the XRT error circle of significance of ; the information presented here supercedes the information from a preliminary reduction reported in Zauderer et al. (2014). We report the CARMA afterglow flux densities in Table 5. We obtain a position for the millimeter afterglow of GRB 140713A of R.A.=18h 44m 25.403s () and Dec= ().
We initiated a series of six observations of GRB 140713A from 2014 July 17.08 UT () to 2014 September 15.00 UT (t 63.21 days), with the VLA (Program number 14A-344, PI: Berger) at 6.0 GHz (side-band frequencies of 4.9 GHz and 7.0 GHz) and 14.7 GHz (side-band frequencies of 13.4 GHz and 15.9 GHz) for all observations. In the first observation, we detected a source within the XRT error circle, and consistent with the CARMA position, with at 6.0 GHz and at 14.7 GHz. Using the observation with the highest signal to noise (the third 14.7 GHz epoch), we derive a position for the radio afterglow of R.A.=18h 44m 25.481s () and Dec= (), an improvement on our CARMA position.
In addition, we initiated observations of GRB 1407134A with the Plateau deBure Interferometer (PdBI) at 86.7 GHz as part of a long-term ToO program (Program number S14DD004, PI: A. Castro-Tirado). The PdBI observed the source at six separate epochs across 2014 Jul 18-Sep 14 UT ( days). We reduced the data with the standard CLIC and MAPPING software distributed by the Grenoble GILDAS group 131313https://www.iram.fr/IRAMFR/GILDAS, and use the carbon star MWC349 as the flux calibrator. We detect a source in all epochs except the final epoch, at a position consistent with the millimeter and radio afterglows. The flux measurements of these observations are listed in Table 5.
To supplement our CARMA, VLA, and PdBI data, we include literature data in our subsequent analysis from the Arcminute Microkelvin Imager (AMI) Large Array (mean frequency of 15.7 GHz) (Anderson et al., 2014, 2018), 1.4 GHz and 4.8 GHz observations from the Westerbork Synthesis Radio Telescope (WSRT) (Higgins et al., 2019), and 1.4 GHz upper limits from the Giant Metrewave Radio Telescope (GMRT) (Chandra & Nayana, 2014b). The AMI and WSRT afterglow observations, along with the NOT optical upper limits, were previously modeled alongside the Swift X-ray light curve in Higgins et al. (2019), but the VLA, CARMA, and PdBI observations are presented and modeled for the first time in this work.
A.5.3 Host Galaxy Observations
Observations by the m Gran Telescopio CANARIAS (GTC) telescope at days revealed a faint, mag source as the candidate host galaxy (Castro-Tirado et al., 2014). Identification and further analysis of this source was also provided in Higgins et al. (2019). We initiated -band observations of the host galaxy with the Large Binocular Camera (LBC) on the Large Binocular Telescope (LBT/LBC) on 2014 Oct 23 UT. We reduced and co-added the data in a similar manner as described before. We calibrated the absolute astrometry using sources in common with the Pan-STARRS1 catalog (Chambers et al., 2016) using IRAF/ccmap and ccsetwcs. We performed aperture photometry on these images using IRAF/phot using a source radius of and a background annulus at the host position. For photometric calibration, we use standard stars from PAN-STARRS1 in the field (Chambers et al., 2016), and then convert to the SDSS system using standard transformations Tonry et al. (2012). We find a host magnitude of mag, and the host galaxy photometry in all bands is listed in Table 6.
In addition, we initiated and Ks-band NIR observations of the host galaxy in Oct 2018 using the Multi-Object Spectrometer for Infra-Red Exploration (MOSFIRE) instrument mounted on the Keck I telescope (PI: Fong), We used POTPyRI141414https://github.com/CIERA-Transients/POTPyRI to perform bias, flat-fielding, dark corrections, sky subtraction, and co-addition. We calibrated the absolute astrometry to 2MASS using IRAF/ccmap and ccsetwcs. The host galaxy is well detected in each of the NIR bands. We calibrated to 2MASS, and converted to the AB system (Blanton & Roweis, 2007); The magnitude values are listed in Table 6.
We obtained s of host galaxy spectroscopy using the Low Resolution Imaging Spectrometer (LRIS) mounted on the 10m Keck I telescope on 2018 October 6 UT. We used the 400/3400 grism and 400/8500 grating in combination with the D560 dichroic for an effective wavelength range of 3200-10100Å. The raw frames were corrected for bias from the overscan region, flattened, and stitched together using custom methods implemented in pyraf151515https://github.com/msiebert1/UCSC_spectral_pipeline. We then extracted one-dimensional spectra of the host galaxy and applied a dispersion correction derived from arc-lamp spectra. Finally, we applied an atmospheric absorption correction and flux calibration derived from a spectrum of the spectrophotometric standard GD71 obtained on the same night. We detect a faint continuum (S/N10) with several clear emission features. We identify [OII], H, and [OIII] at a common redshift of . The spectrum is shown in Figure 8.
A.6 Literature Bursts
A.6.1 GRB 110709B
We gather radio and optical afterglow observations of GRB 110709B from Zauderer et al. (2013c) and X-ray afterglow observations from Swift. GRB 110709B has been previously been determined to be a dark burst through the criterion (Jakobsson et al., 2004) in Zauderer et al. (2013c). We gather host galaxy observations of GRB 110709B from Zauderer et al. (2013c), Perley et al. (2016a), and Selsing et al. (2019).
A.6.2 GRB 111215A
We gather radio and optical afterglow observations of GRB 111215A from Zauderer et al. (2013c) and van der Horst et al. (2015), and X-ray afterglow observations from Swift. GRB 111215A has previously been determined to be a dark burst through the criterion (Jakobsson et al., 2004) in Zauderer et al. (2013c). We gather host galaxy observations of GRB 111215A from van der Horst et al. (2015), and assume a redshift of (van der Horst et al., 2015; Chrimes et al., 2019).
A.6.3 GRB 160509A
The radio, optical, and X-ray afterglow of GRB 160509A has previously been modeled with our modeling framework in Laskar et al. (2016), and we utilize the afterglow parameters within for our discussion (Section 5). The optical afterglow of GRB 160509A was heavily obscured, with a line-of-sight extinction of , indicating it is likely a dark burst. Using the optical afterglow detections in -band at (Laskar et al., 2016), we calculate , meeting the darkness criterion of Jakobsson et al. (2004), and classifying GRB 160509A as a dark burst. Additionally, we find , leading to . Thus, GRB 160509A is also classified as a dark burst according to the van der Horst et al. (2009) criterion.
The host galaxy of GRB 160509A was previously observed with HST/WFC3 in the F110W and F160W filters on 2017 July 5 (PI: Kangas) (Kangas et al., 2020). We retrieved, aligned, and drizzled the individual exposures for each band using the HST reduction pipeline hst123 (Kilpatrick et al., 2022; Kilpatrick, 2021). We also included a sky subtraction step as part of astrodrizzle (Hack et al., 2021) to remove large-scale background emission near the host galaxy. Using an elliptical aperture and the tabulated HST zeropoints, we calculated the F110W and F160W brightness of the host galaxy (Table 6 and Figure 1).
The host galaxy is also clearly detected in Spitzer/IRAC observations taken on 2017 Nov 05 (PI: Perley). We downloaded and reduced the individual basic calibrated data frames (i.e., cbcd) using photpipe (Rest et al., 2005; Kilpatrick et al., 2018), including alignment, flux calibration, and optimal stacking to a pixel scale of 0.3″/pix. We performed final PSF photometry in the stacked frames using a custom version of DoPhot (Schechter et al., 1993). The host galaxy appears point-like in the stacked IRAC frames and is clearly separated from a nearby galaxy of similar brightness seen in the HST frames (Figure 1). Therefore, we use the DoPhot photometry calibrated using the appropriate warm Spitzer sensitivity function for IRAC and obtain a magnitude of at (Table 6).
We supplement these host galaxy observations with the Keck/LRIS - and -band measurements taken at , where afterglow modeling found the host galaxy to dominate the flux (Laskar et al. 2016; Table 6).
| GRB | 110709B | 130131A | 140713A |
|---|---|---|---|
| Env. | Wind | ISM | ISM |
Note. — The top row for each parameter corresponds to the best fit forward shock value from our MCMC modeling. The bottom row for each parameter corresponds to the summary statistics from the marginalized posterior density functions (medians and 68% credible intervals)
a value from afterglow model using median values
Appendix B Alternative MCMC Afterglow Models
Here we present the alternative MCMC afterglow models for the bursts whose afterglow observations did not distinguish between a wind or ISM environment through preliminary analytical arguments (GRB 110709B, 130131A, and 140713A).
B.1 GRB 110709B
We present the best fit (highest likelihood) wind environment model for GRB 110709B in Figure 13 and list the model parameters as well as the summary statistics from the marginalized posterior density functions (medians and 68% credible intervals) in Table 2 in Table 7.
Our best fit wind model for GRB 110709B finds a later compared to our ISM model (Section 3.1.2). While the wind model better fits the X-ray light curve at , the marginal statistical preference for the ISM model is a result of the ISM model better matching the X-ray light curve at , where the majority of the X-ray data exist. The best fit parameters for our wind model are the same as Kangas & Fruchter (2021) within , though our and are orders of magnitude different than those found by Zauderer et al. (2013c), likely due to the inclusion of IC effects in our model. Our best fit wind model requires to match the GROND optical/NIR afterglow upper limits.
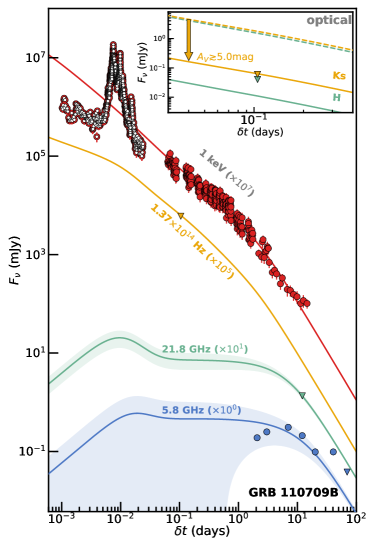
B.2 GRB 130131A
We present the best fit wind environment for GRB 130131A model in Figure 14 and list the model parameters as well as the summary statistics from the marginalized posterior density functions (medians and 68% credible intervals) in Table 7.
Our ISM model of GRB 130131A finds an earlier jet break time of compared to our wind model. As a consequence, while the radio afterglow of GRB 130131A is better fit by the ISM model, the X-ray light curve is under-predicted by the ISM model at , resulting in the statistical preference for the wind model of GRB 130131A. Our ISM model finds that the extinction required to match the optical and NIR observations is .
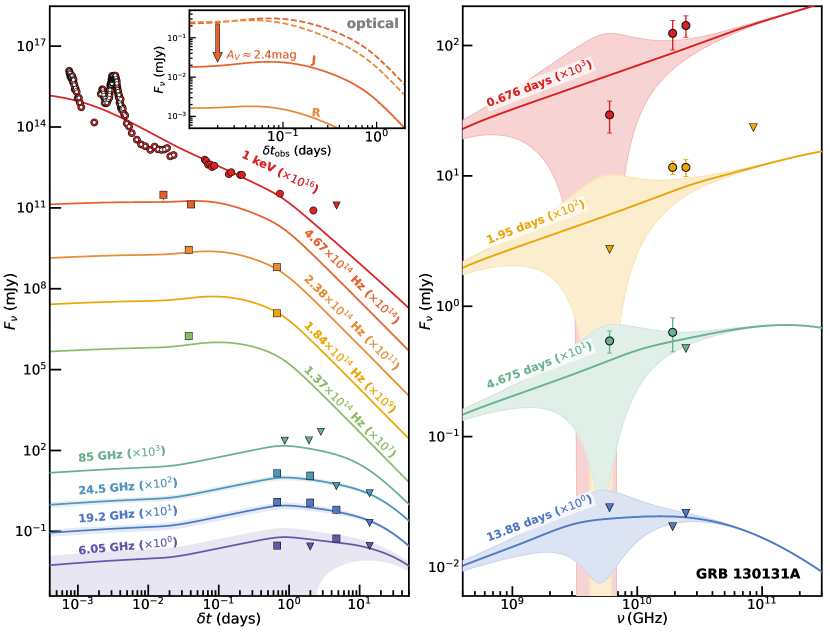
B.3 GRB 140713A
We present the best fit ISM environment model for GRB 140713A in Figure 15 and list the model parameters as well as the summary statistics from the marginalized posterior density functions (medians and 68% credible intervals) in Table 2 in Table 7.
Similar to the wind environment model (Section 3.5.2), the X-ray light curve for the ISM model of GRB 140713A is under-predicted at . While the Ku-band observations are better fit by the ISM model, the significant statistical preference for the wind model is attributed to the better fit C-band and 3mm observations light curves. Our ISM model for GRB 140713A requires necessary to match the optical limits. This limit is the same as that derived by Higgins et al. (2019) for an SMC-like galactic extinction model.
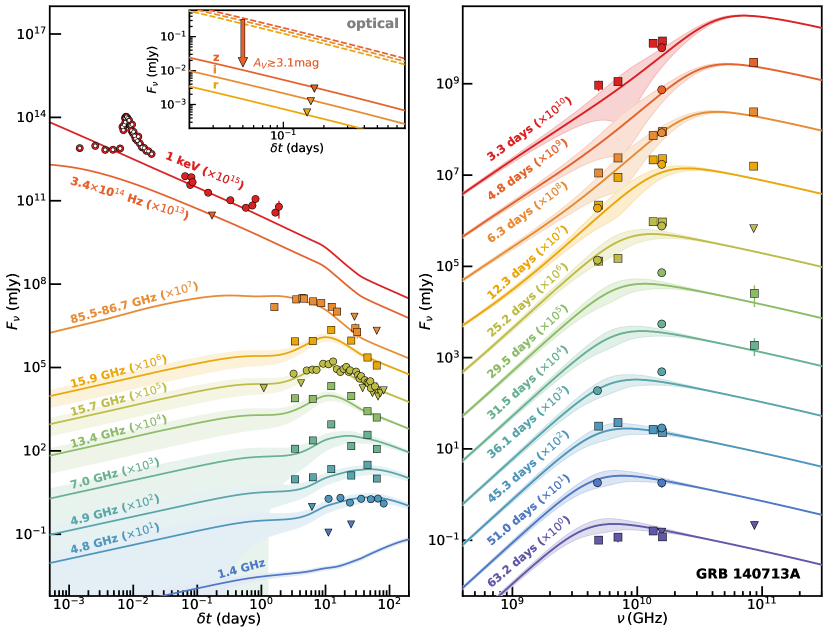
References
- Alam et al. (2015) Alam, S., Albareti, F. D., Allende Prieto, C., et al. 2015, ApJS, 219, 12
- Alexander et al. (2017) Alexander, K. D., Laskar, T., Berger, E., et al. 2017, ApJ, 848, 69
- Anderson et al. (2014) Anderson, G. E., Fender, R. P., Staley, T. D., & van der Horst, A. J. 2014, GRB Coordinates Network, 16603, 1
- Anderson et al. (2018) Anderson, G. E., Staley, T. D., van der Horst, A. J., et al. 2018, MNRAS, 473, 1512
- Balázs et al. (2004) Balázs, L. G., Bagoly, Z., Horváth, I., Mészáros, A., & Mészáros, P. 2004, Baltic Astronomy, 13, 207
- Beardmore et al. (2014) Beardmore, A. P., Evans, P. A., Goad, M. R., & Osborne, J. P. 2014, GRB Coordinates Network, 16585, 1
- Berger et al. (2002) Berger, E., Kulkarni, S. R., Bloom, J. S., et al. 2002, ApJ, 581, 981
- Bertin & Arnouts (1996) Bertin, E., & Arnouts, S. 1996, A&AS, 117, 393
- Blain & Natarajan (2000) Blain, A. W., & Natarajan, P. 2000, MNRAS, 312, L35
- Blanton & Roweis (2007) Blanton, M. R., & Roweis, S. 2007, AJ, 133, 734
- Bloom et al. (2002) Bloom, J. S., Kulkarni, S. R., & Djorgovski, S. G. 2002, AJ, 123, 1111
- Burrows et al. (2007) Burrows, D. N., Falcone, A., Chincarini, G., et al. 2007, Philosophical Transactions of the Royal Society of London Series A, 365, 1213
- Butler et al. (2013) Butler, N., Watson, A. M., Kutyrev, A., et al. 2013, GRB Coordinates Network, 14831, 1
- Calura et al. (2017) Calura, F., Pozzi, F., Cresci, G., et al. 2017, MNRAS, 465, 54
- Calzetti et al. (2000) Calzetti, D., Armus, L., Bohlin, R. C., et al. 2000, ApJ, 533, 682
- Cano et al. (2014) Cano, Z., Malesani, D., Nielsen, M., & Planck, M. 2014, GRB Coordinates Network, 16587, 1
- Cardelli et al. (1989) Cardelli, J. A., Clayton, G. C., & Mathis, J. S. 1989, ApJ, 345, 245
- Carilli et al. (2015) Carilli, C. L., McKinnon, M., Ott, J., et al. 2015, arXiv e-prints, arXiv:1510.06438
- Casali et al. (2007) Casali, M., Adamson, A., Alves de Oliveira, C., et al. 2007, A&A, 467, 777
- Castro-Tirado et al. (2014) Castro-Tirado, A. J., Jeong, S., Gorosabel, J., & Reverte, D. 2014, GRB Coordinates Network, 16602, 1
- Castro-Tirado et al. (2007) Castro-Tirado, A. J., Bremer, M., McBreen, S., et al. 2007, A&A, 475, 101
- Castro-Tirado et al. (2013) Castro-Tirado, A. J., Sanchez-Ramirez, R., Gorosabel, J., et al. 2013, GRB Coordinates Network, 14796, 1
- Cenko et al. (2009) Cenko, S. B., Kelemen, J., Harrison, F. A., et al. 2009, ApJ, 693, 1484
- Cenko et al. (2010) Cenko, S. B., Frail, D. A., Harrison, F. A., et al. 2010, ApJ, 711, 641
- Cenko et al. (2011) —. 2011, ApJ, 732, 29
- Chabrier (2003) Chabrier, G. 2003, PASP, 115, 763
- Chambers et al. (2016) Chambers, K. C., Magnier, E. A., Metcalfe, N., et al. 2016, ArXiv e-prints, arXiv:1612.05560
- Chandra & Frail (2012) Chandra, P., & Frail, D. A. 2012, ApJ, 746, 156
- Chandra & Nayana (2014a) Chandra, P., & Nayana, A. J. 2014a, GRB Coordinates Network, 16641, 1
- Chandra & Nayana (2014b) —. 2014b, GRB Coordinates Network, 16641, 1
- Chandra et al. (2008) Chandra, P., Cenko, S. B., Frail, D. A., et al. 2008, ApJ, 683, 924
- Chevalier & Li (2000) Chevalier, R. A., & Li, Z.-Y. 2000, ApJ, 536, 195
- Chornock et al. (2013a) Chornock, R., Berger, E., Fox, D. B., et al. 2013a, ApJ, 774, 26
- Chornock et al. (2013b) Chornock, R., Fong, W., & Berger, E. 2013b, GRB Coordinates Network, 15637, 1
- Chrimes et al. (2019) Chrimes, A. A., Levan, A. J., Stanway, E. R., et al. 2019, MNRAS, 486, 3105
- Christensen et al. (2004) Christensen, L., Hjorth, J., & Gorosabel, J. 2004, A&A, 425, 913
- Conroy & Gunn (2010) Conroy, C., & Gunn, J. E. 2010, ApJ, 712, 833
- Conroy et al. (2009) Conroy, C., Gunn, J. E., & White, M. 2009, ApJ, 699, 486
- Covino et al. (2013) Covino, S., Melandri, A., Salvaterra, R., et al. 2013, MNRAS, 432, 1231
- Cucchiara et al. (2011) Cucchiara, A., Levan, A. J., Fox, D. B., et al. 2011, ApJ, 736, 7
- Cummings et al. (2013) Cummings, J. R., Baumgartner, W. H., Gehrels, N., et al. 2013, GRB Coordinates Network, 14828, 1
- Djorgovski et al. (1998) Djorgovski, S. G., Kulkarni, S. R., Bloom, J. S., et al. 1998, ApJ, 508, L17
- Eftekhari et al. (2021) Eftekhari, T., Margalit, B., Omand, C. M. B., et al. 2021, ApJ, 912, 21
- Evans et al. (2013) Evans, P. A., Goad, M. R., Osborne, J. P., & Beardmore, A. P. 2013, GRB Coordinates Network, 14160, 1
- Evans et al. (2009) Evans, P. A., Beardmore, A. P., Page, K. L., et al. 2009, MNRAS, 397, 1177
- Fong et al. (2014) Fong, W., Berger, E., Metzger, B. D., et al. 2014, ApJ, 780, 118
- Frail et al. (1997) Frail, D. A., Kulkarni, S. R., Nicastro, L., Feroci, M., & Taylor, G. B. 1997, Nature, 389, 261
- Frail et al. (2005) Frail, D. A., Soderberg, A. M., Kulkarni, S. R., et al. 2005, ApJ, 619, 994
- Fynbo et al. (2009) Fynbo, J. P. U., Jakobsson, P., Prochaska, J. X., et al. 2009, ApJS, 185, 526
- Gallazzi et al. (2005) Gallazzi, A., Charlot, S., Brinchmann, J., White, S. D. M., & Tremonti, C. A. 2005, MNRAS, 362, 41
- Gatkine et al. (2020) Gatkine, P., Vogel, S., & Veilleux, S. 2020, ApJ, 897, 9
- Gehrels et al. (2008) Gehrels, N., Barthelmy, S. D., Burrows, D. N., et al. 2008, ApJ, 689, 1161
- Granot & Sari (2002) Granot, J., & Sari, R. 2002, ApJ, 568, 820
- Greiner et al. (2011) Greiner, J., Krühler, T., Klose, S., et al. 2011, A&A, 526, A30
- Greiner et al. (2016) Greiner, J., Michałowski, M. J., Klose, S., et al. 2016, A&A, 593, A17
- Groot et al. (1998) Groot, P. J., Galama, T. J., van Paradijs, J., et al. 1998, ApJ, 493, L27
- Grupe et al. (2013) Grupe, D., Barlow, B. N., Barthelmy, S. D., et al. 2013, GRB Coordinates Network, 14156, 1
- Hack et al. (2021) Hack, W. J., Cara, M., Sosey, M., et al. 2021, spacetelescope/drizzlepac: Drizzlepac v3.3.0, v.3.3.0, Zenodo, doi:10.5281/zenodo.5534751
- Haislip et al. (2006) Haislip, J. B., Nysewander, M. C., Reichart, D. E., et al. 2006, Nature, 440, 181
- Hamly et al. (2008) Hamly, N. C., Collins, R. S., Cross, N. J. G., et al. 2008, MNRAS, 384, 637
- Higgins et al. (2019) Higgins, A. B., van der Horst, A. J., Starling, R. L. C., et al. 2019, MNRAS, 484, 5245
- Hjorth et al. (2003) Hjorth, J., Sollerman, J., Møller, P., et al. 2003, Nature, 423, 847
- Horesh et al. (2015) Horesh, A., Cenko, S. B., Perley, D. A., et al. 2015, ApJ, 812, 86
- Hunt et al. (2014) Hunt, L. K., Palazzi, E., Michałowski, M. J., et al. 2014, A&A, 565, A112
- Hunter (2007) Hunter, J. D. 2007, Computing in Science Engineering, 9, 90
- Jakobsson et al. (2004) Jakobsson, P., Hjorth, J., Fynbo, J. P. U., et al. 2004, ApJ, 617, L21
- Jakobsson et al. (2005) Jakobsson, P., Frail, D. A., Fox, D. B., et al. 2005, ApJ, 629, 45
- Japelj et al. (2016) Japelj, J., Vergani, S. D., Salvaterra, R., et al. 2016, A&A, 590, A129
- Jeong et al. (2014) Jeong, S., Castro-Tirado, A. J., Bremer, M., et al. 2014, A&A, 569, A93
- Kangas & Fruchter (2021) Kangas, T., & Fruchter, A. S. 2021, ApJ, 911, 14
- Kangas et al. (2020) Kangas, T., Fruchter, A. S., Cenko, S. B., et al. 2020, ApJ, 894, 43
- Kann et al. (2006) Kann, D. A., Klose, S., & Zeh, A. 2006, ApJ, 641, 993
- Kann et al. (2010) Kann, D. A., Klose, S., Zhang, B., et al. 2010, ApJ, 720, 1513
- Kilpatrick (2021) Kilpatrick, C. D. 2021, charliekilpatrick/hst123: hst123, v.v1.0.0, Zenodo, doi:10.5281/zenodo.5573941
- Kilpatrick et al. (2018) Kilpatrick, C. D., Foley, R. J., Drout, M. R., et al. 2018, MNRAS, 473, 4805
- Kilpatrick et al. (2022) Kilpatrick, C. D., Fong, W.-f., Blanchard, P. K., et al. 2022, ApJ, 926, 49
- Krühler et al. (2011) Krühler, T., Greiner, J., Schady, P., et al. 2011, A&A, 534, A108
- Krühler et al. (2012) Krühler, T., Malesani, D., Milvang-Jensen, B., et al. 2012, ApJ, 758, 46
- Krühler et al. (2015) Krühler, T., Malesani, D., Fynbo, J. P. U., et al. 2015, A&A, 581, A125
- Lacy et al. (2020) Lacy, M., Baum, S. A., Chandler, C. J., et al. 2020, PASP, 132, 035001
- Laskar et al. (2018a) Laskar, T., Berger, E., Chornock, R., et al. 2018a, ApJ, 858, 65
- Laskar et al. (2015) Laskar, T., Berger, E., Margutti, R., et al. 2015, ApJ, 814, 1
- Laskar et al. (2013a) Laskar, T., Zauderer, A., & Berger, E. 2013a, GRB Coordinates Network, 14817, 1
- Laskar et al. (2013b) Laskar, T., Zauderer, B. A., & Berger, E. 2013b, GRB Coordinates Network, 14171, 1
- Laskar et al. (2013c) Laskar, T., Berger, E., Zauderer, B. A., et al. 2013c, ApJ, 776, 119
- Laskar et al. (2014) Laskar, T., Berger, E., Tanvir, N., et al. 2014, ApJ, 781, 1
- Laskar et al. (2016) Laskar, T., Alexander, K. D., Berger, E., et al. 2016, ApJ, 833, 88
- Laskar et al. (2018b) Laskar, T., Berger, E., Margutti, R., et al. 2018b, ApJ, 859, 134
- Laskar et al. (2018c) Laskar, T., Alexander, K. D., Berger, E., et al. 2018c, ApJ, 862, 94
- Laskar et al. (2019) Laskar, T., van Eerten, H., Schady, P., et al. 2019, ApJ, 884, 121
- Leibler & Berger (2010) Leibler, C. N., & Berger, E. 2010, ApJ, 725, 1202
- Leja et al. (2017) Leja, J., Johnson, B. D., Conroy, C., Dokkum, P. G. v., & Byler, N. 2017, The Astrophysical Journal, 837, 170
- Liang & Li (2010) Liang, S. L., & Li, A. 2010, ApJ, 710, 648
- Lien et al. (2016) Lien, A., Sakamoto, T., Barthelmy, S. D., et al. 2016, ApJ, 829, 7
- Littlejohns et al. (2015) Littlejohns, O. M., Butler, N. R., Cucchiara, A., et al. 2015, MNRAS, 449, 2919
- Longo et al. (2016) Longo, F., Bissaldi, E., Bregeon, J., et al. 2016, GRB Coordinates Network, 19403, 1
- MacFadyen & Woosley (1999) MacFadyen, A. I., & Woosley, S. E. 1999, ApJ, 524, 262
- Mangano et al. (2014) Mangano, V., Barthelmy, S. D., Chester, M. M., et al. 2014, GRB Coordinates Network, 16581, 1
- Margutti et al. (2010) Margutti, R., Guidorzi, C., Chincarini, G., et al. 2010, MNRAS, 406, 2149
- Margutti et al. (2015) Margutti, R., Guidorzi, C., Lazzati, D., et al. 2015, ApJ, 805, 159
- Mckinney (2010) Mckinney, W. 2010, Proceedings of the 9th Python in Science Conference
- McMullin et al. (2007) McMullin, J. P., Waters, B., Schiebel, D., Young, W., & Golap, K. 2007, in Astronomical Society of the Pacific Conference Series, Vol. 376, Astronomical Data Analysis Software and Systems XVI, ed. R. A. Shaw, F. Hill, & D. J. Bell, 127
- Melandri et al. (2012) Melandri, A., Sbarufatti, B., D’Avanzo, P., et al. 2012, MNRAS, 421, 1265
- Nakar et al. (2009) Nakar, E., Ando, S., & Sari, R. 2009, ApJ, 703, 675
- Nousek et al. (2006) Nousek, J. A., Kouveliotou, C., Grupe, D., et al. 2006, ApJ, 642, 389
- Nugent et al. (2020) Nugent, A. E., Fong, W.-f., Dong, Y., et al. 2020, arXiv e-prints, arXiv:2007.10372
- Oates et al. (2013) Oates, S. R., Baumgartner, W. H., Burrows, D. N., et al. 2013, GRB Coordinates Network, 14411, 1
- Osborne et al. (2021) Osborne, J. A., Bagheri, F., & Shahmoradi, A. 2021, MNRAS, 502, 5622
- Page et al. (2013) Page, M. J., Barthelmy, S. D., Gehrels, N., et al. 2013, GRB Coordinates Network, 15627, 1
- Palmerio et al. (2019) Palmerio, J. T., Vergani, S. D., Salvaterra, R., et al. 2019, A&A, 623, A26
- Panaitescu & Kumar (2000) Panaitescu, A., & Kumar, P. 2000, ApJ, 543, 66
- Panaitescu & Kumar (2002) —. 2002, ApJ, 571, 779
- Perley (2013) Perley, D. A. 2013, GRB Coordinates Network, 15638, 1
- Perley & Cenko (2013) Perley, D. A., & Cenko, S. B. 2013, GRB Coordinates Network, 14830, 1
- Perley et al. (2017) Perley, D. A., Hjorth, J., Tanvir, N. R., & Perley, R. A. 2017, MNRAS, 465, 970
- Perley & Perley (2013) Perley, D. A., & Perley, R. A. 2013, ApJ, 778, 172
- Perley et al. (2013) Perley, D. A., Levan, A. J., Tanvir, N. R., et al. 2013, ApJ, 778, 128
- Perley et al. (2015) Perley, D. A., Perley, R. A., Hjorth, J., et al. 2015, ApJ, 801, 102
- Perley et al. (2016a) Perley, D. A., Krühler, T., Schulze, S., et al. 2016a, ApJ, 817, 7
- Perley et al. (2016b) Perley, D. A., Tanvir, N. R., Hjorth, J., et al. 2016b, ApJ, 817, 8
- Perley et al. (2011) Perley, R. A., Chandler, C. J., Butler, B. J., & Wrobel, J. M. 2011, ApJ, 739, L1
- Piranomonte et al. (2015) Piranomonte, S., Japelj, J., Vergani, S. D., et al. 2015, MNRAS, 452, 3293
- Price et al. (2002) Price, P. A., Berger, E., Reichart, D. E., et al. 2002, ApJ, 572, L51
- Price et al. (2014) Price, S. H., Kriek, M., Brammer, G. B., et al. 2014, ApJ, 788, 86
- Racusin et al. (2008) Racusin, J. L., Karpov, S. V., Sokolowski, M., et al. 2008, Nature, 455, 183
- Ramirez-Ruiz et al. (2002) Ramirez-Ruiz, E., Trentham, N., & Blain, A. W. 2002, MNRAS, 329, 465
- Rest et al. (2005) Rest, A., Stubbs, C., Becker, A. C., et al. 2005, ApJ, 634, 1103
- Rhoads (1999) Rhoads, J. E. 1999, ApJ, 525, 737
- Rickett (1990) Rickett, B. J. 1990, ARA&A, 28, 561
- Rol et al. (2007) Rol, E., van der Horst, A., Wiersema, K., et al. 2007, ApJ, 669, 1098
- Rossi et al. (2012) Rossi, A., Klose, S., Ferrero, P., et al. 2012, A&A, 545, A77
- Salvaterra et al. (2009) Salvaterra, R., Della Valle, M., Campana, S., et al. 2009, Nature, 461, 1258
- Salvaterra et al. (2012) Salvaterra, R., Campana, S., Vergani, S. D., et al. 2012, ApJ, 749, 68
- Santini et al. (2014) Santini, P., Maiolino, R., Magnelli, B., et al. 2014, A&A, 562, A30
- Sari & Esin (2001) Sari, R., & Esin, A. A. 2001, ApJ, 548, 787
- Sari et al. (1999) Sari, R., Piran, T., & Halpern, J. P. 1999, ApJ, 519, L17
- Sari et al. (1998) Sari, R., Piran, T., & Narayan, R. 1998, ApJ, 497, L17
- Sault et al. (1995) Sault, R. J., Teuben, P. J., & Wright, M. C. H. 1995, in Astronomical Society of the Pacific Conference Series, Vol. 77, Astronomical Data Analysis Software and Systems IV, ed. R. A. Shaw, H. E. Payne, & J. J. E. Hayes, 433
- Savaglio et al. (2009) Savaglio, S., Glazebrook, K., & Le Borgne, D. 2009, ApJ, 691, 182
- Schady et al. (2014) Schady, P., Savaglio, S., Müller, T., et al. 2014, A&A, 570, A52
- Schechter et al. (1993) Schechter, P. L., Mateo, M., & Saha, A. 1993, PASP, 105, 1342
- Schlafly & Finkbeiner (2011) Schlafly, E. F., & Finkbeiner, D. P. 2011, ApJ, 737, 103
- Schultz & Wiemer (1975) Schultz, G. V., & Wiemer, W. 1975, A&A, 43, 133
- Selsing et al. (2019) Selsing, J., Malesani, D., Goldoni, P., et al. 2019, A&A, 623, A92
- Smolčić et al. (2017) Smolčić, V., Delvecchio, I., Zamorani, G., et al. 2017, A&A, 602, A2
- Speagle (2020) Speagle, J. S. 2020, MNRAS, 493, 3132
- Stanway et al. (2014) Stanway, E. R., Levan, A. J., & Davies, L. J. M. 2014, MNRAS, 444, 2133
- Tanvir et al. (2013a) Tanvir, N. R., Levan, A. J., & Wold, T. 2013a, GRB Coordinates Network, 14157, 1
- Tanvir et al. (2013b) —. 2013b, GRB Coordinates Network, 14175, 1
- Tanvir et al. (2009) Tanvir, N. R., Fox, D. B., Levan, A. J., et al. 2009, Nature, 461, 1254
- Tanvir et al. (2018) Tanvir, N. R., Laskar, T., Levan, A. J., et al. 2018, ApJ, 865, 107
- Tody (1986) Tody, D. 1986, in Proc. SPIE, Vol. 627, Instrumentation in astronomy VI, ed. D. L. Crawford, 733
- Tody (1993) Tody, D. 1993, in Astronomical Society of the Pacific Conference Series, Vol. 52, Astronomical Data Analysis Software and Systems II, ed. R. J. Hanisch, R. J. V. Brissenden, & J. Barnes, 173
- Tonry et al. (2012) Tonry, J. L., Stubbs, C. W., Lykke, K. R., et al. 2012, ApJ, 750, 99
- van der Horst et al. (2009) van der Horst, A. J., Kouveliotou, C., Gehrels, N., et al. 2009, ApJ, 699, 1087
- van der Horst et al. (2015) van der Horst, A. J., Levan, A. J., Pooley, G. G., et al. 2015, MNRAS, 446, 4116
- van der Walt et al. (2011) van der Walt, S., Colbert, S. C., & Varoquaux, G. 2011, Computing in Science Engineering, 13, 22
- Veres et al. (2015) Veres, P., Corsi, A., Frail, D. A., Cenko, S. B., & Perley, D. A. 2015, ApJ, 810, 31
- Vergani et al. (2015) Vergani, S. D., Salvaterra, R., Japelj, J., et al. 2015, A&A, 581, A102
- Virtanen et al. (2020) Virtanen, P., Gommers, R., Oliphant, T. E., et al. 2020, Nature Methods, 17, 261
- Volnova et al. (2013) Volnova, A., Korobtsev, I., Klunko, E., & Pozanenko, A. 2013, GRB Coordinates Network, 14182, 1
- Williams et al. (2017a) Williams, P. K. G., Clavel, M., Newton, E., & Ryzhkov, D. 2017a, pwkit: Astronomical utilities in Python, Astrophysics Source Code Library, , , ascl:1704.001
- Williams et al. (2017b) Williams, P. K. G., Clavel, M., Newton, E., & Ryzhkov, D. 2017b, pwkit: Astronomical utilities in Python, Astrophysics Source Code Library, record ascl:1704.001, , , ascl:1704.001
- Woosley & Bloom (2006) Woosley, S. E., & Bloom, J. S. 2006, ARA&A, 44, 507
- Yost et al. (2003) Yost, S. A., Harrison, F. A., Sari, R., & Frail, D. A. 2003, ApJ, 597, 459
- Zafar et al. (2011) Zafar, T., Watson, D., Fynbo, J. P. U., et al. 2011, A&A, 532, A143
- Zauderer & Berger (2012) Zauderer, A., & Berger, E. 2012, GRB Coordinates Network, 12895, 1
- Zauderer & Berger (2013) Zauderer, B. A., & Berger, E. 2013, GRB Coordinates Network, 14444, 1
- Zauderer et al. (2013a) Zauderer, B. A., Berger, E., & Laskar, T. 2013a, GRB Coordinates Network, 14172, 1
- Zauderer et al. (2014) Zauderer, B. A., Fong, W., & Berger, E. 2014, GRB Coordinates Network, 16593, 1
- Zauderer et al. (2013b) Zauderer, B. A., Fong, W., Berger, E., & Laskar, T. 2013b, GRB Coordinates Network, 14863, 1
- Zauderer et al. (2013c) Zauderer, B. A., Berger, E., Margutti, R., et al. 2013c, ApJ, 767, 161
- Zhang et al. (2006) Zhang, B., Fan, Y. Z., Dyks, J., et al. 2006, ApJ, 642, 354
- Zhao et al. (2013) Zhao, X.-H., Mao, J., & Bai, J.-M. 2013, GRB Coordinates Network, 14423, 1