Dissecting flux balances to measure energetic costs in cell biology: techniques and challenges
Abstract
Life is a nonequilibrium phenomenon: metabolism provides a continuous supply of energy that drives nearly all cellular processes. However, very little is known about how much energy different cellular processes use, i.e. their energetic costs. The most direct experimental measurements of these costs involve modulating the activity of cellular processes and determining the resulting changes in energetic fluxes. In this review, we present a flux balance framework to aid in the design and interpretation of such experiments, and discuss the challenges associated with measuring the relevant metabolic fluxes. We then describe selected techniques that enable measurement of these fluxes. Finally, we review prior experimental and theoretical work that has employed techniques from biochemistry and nonequilibrium physics to determine the energetic costs of cellular processes.
1 Introduction
Cells consume energy derived from the environment to power diverse processes including biosynthesis, ion pumping, cytoskeletal remodeling, signal transduction, error correction and information processing. While the metabolic enzymes and pathways that transduce energy have been extensively studied, very little is known about how much energy is used by different cellular processes. Developing a quantitative understanding of energy usage in cell biology - i.e. cell biological energetic costs - would have broad implications beyond energy metabolism. Since the rate of energy usage is a measure of the combined rates of all energy-consuming reactions, establishing the energetic costs of cellular processes will provide a powerful means to characterize their systems-level behavior in situ. Not only will this be useful for testing mechanistic models of these processes, it will also help answer fundamental questions concerning their efficiency and the potential impact of constraints from nonequilibrium thermodynamics [1]. Knowing the energetic costs of cellular processes may also provide insight into the changes in metabolism that take place over development or as result of diseases [1], and may have implications for the evolution of these processes [2].
Adenosine triphosphate (ATP) is the primary “energy currency” in cells: transduction of free energy from the breakdown of nutrients enables the synthesis of ATP from adenosine diphosphate (ADP) and phosphate (P), and the hydrolysis of ATP to ADP releases free energy that is used to power many cellular processes. The rate at which ATP molecules are hydrolyzed to supply free energy for a process is often referred to as the energetic cost of that process.
Unfortunately, it is not currently possible to directly measure the rate at which individual cellular processes consume ATP in situ. Thus, all of our knowledge of the energetic costs of cell biological processes comes from estimates and indirect measurements. Estimates of energetic costs of particular processes typically combine knowledge of the individual chemical steps in those processes, the ATP stoichiometry of those chemical reactions, and inferences of the total rate of those processes (based on cellular composition, growth rate, and other physiological measurements) [3, 4, 2]. While such estimates have been very informative, they are based on numerous assumptions whose validity is difficulty to verify. There have only been limited efforts to experimentally test such estimates of energetic costs, and when apparent disagreements are found [5, 6], it can be challenging to determine if this reflects limitations of the estimates, the measurements, or both.
Experimental measurements of energetic costs are often based on modulating the activity of target processes and quantifying concomitant changes in total cellular energy usage [7, 8]. Typically, in such studies a process of interest is inhibited, the change in total cellular metabolic flux is measured, and the inferred change in ATP consumption rates is interpreted as the energetic cost of the inhibited process. One major concern highlighted by these and other studies is the fact that the activity of different cellular processes is inextricably linked, making their respective costs challenging to dissect experimentally [6]. Furthermore, the scope of these studies has been limited; most cellular processes in systems of interest have not yet been studied systematically through such experiments.
Despite their drawbacks, activity modulation experiments remain the most direct method to probe the energetic costs of cellular processes. In this review, we show how theory based on coupled flux balances can be used to interpret such experiments and infer the energetic costs of cellular processes. The balance equations can inform the design of activity modulation experiments by enumerating the individual fluxes that must be quantified for this analysis, and provide a framework to infer energetic costs from changes in the coupled fluxes. Additionally, we use this framework to highlight the challenges associated with interpreting changes in fluxes. We then discuss the strengths and limitations of the different technologies used to measure bioenergetic fluxes and characterize their coupling, and review studies that have employed these approaches to measure energetic costs.
2 Coupled flux balances are a unifying framework for interpreting bioenergetic measurements
The ATP consumption rates of individual cellular processes of interest cannot be directly measured. While challenging to determine, the total combined ATP consumption rate of all processes in a cell, is, in principle, experimentally accessible. This suggests an indirect approach to measuring the ATP consumption rate of a process of interest: change the activity of the processes, determine the resulting change in the total ATP consumption rate, and use these changes to calculate the energetic cost of the process. While this is a promising and powerful approach, there are numerous subtleties associated with using changes in metabolic fluxes to infer energetic costs. In what follows, we will use a systematic categorization of the relationships between the rates of different ATP-producing and ATP-consuming reactions to help interpret such changes in metabolic fluxes.
An ATP mole balance on the system of interest relates changes in ATP levels to fluxes through ATP-producing and ATP-consuming reactions. While the fluxes through many of these ATP-dependent reactions are not directly accessible, they are linked to other reactions in the cell whose rates may be straightforwardly measured. Therefore, careful consideration of the ATP mole balance, as well as of the coupled mole balances on other chemical species and the energy balance, provides a means to calculate and interpret changes in ATP fluxes. These balance equations inform experimental design by indicating which experimentally accessible reaction rates must be measured in order to infer the ATP consumption rate of a given process from an activity modulation experiment.
We therefore begin by considering the general mole balance for a chemical species in the cell. , the number of moles of this species in the cell, can change due to the species being imported (with flux ) or exported (with flux ), or due to the species being produced or consumed by reaction (with flux ). Summing over all reactions involving this species gives:
| (1) |
Note that is negative for reactions that are net consumers of species . We next consider the mole balance for ATP. Import and export of ATP can be safely neglected, so enumerating all reactions that produce or consume ATP gives:
| (2) |
Here, we have divided the reactions into ATP-producing reactions (with positive fluxes) and ATP-consuming reactions (with negative fluxes). Such a division is general because, while the flux of some reactions may change signs under different conditions, at any given time the flux of all reactions is either positive or negative (or zero). In many systems of interest, glycolysis and respiration are the dominant ATP producing pathways, in which case .
At steady state, , and the ATP production and consumption fluxes are balanced. The ATP consuming reactions in this balance can be conceptualized as containing contributions from numerous cell biological processes, each with their own coarse-grained ATP-consuming flux, such as = protein production, = cytoskeletal assembly, and = ion pumping (Fig. 1). These processes can be further decomposed into more elementary processes, which in turn can be further decomposed, all the way down to individual chemical reactions that hydrolyze ATP.
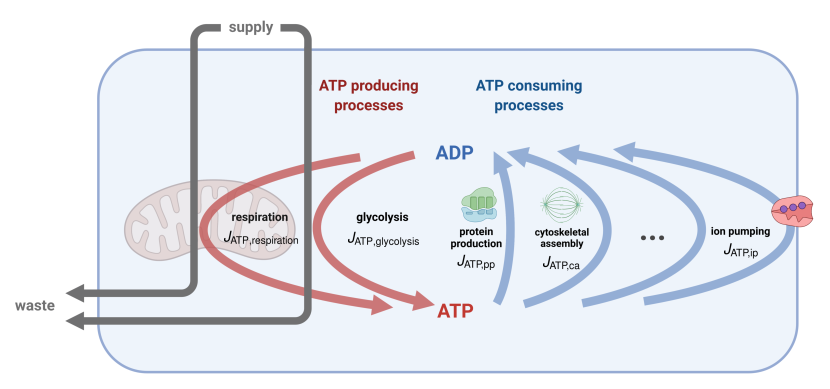
The energetic cost of a cell biological process is its corresponding ATP consumption flux, . It is not generally possible to directly measure such fluxes. However, at steady state the total ATP consumption flux equals the total ATP production flux, so measuring the total rate of ATP synthesis enables inference of the total rate of ATP hydrolysis. A complicating factor is that direct measurement of ATP synthesis rate is not always possible either. While total cellular ATP synthesis rates have been directly measured by spectroscopic methods [10], these techniques are not widely used in modern bioenergetics studies and may be difficult to apply to many systems. Thus, the methods most commonly used to resolve ATP synthesis fluxes rely on coupling between ATP-producing reactions and other reactions in the same pathway, or other processes whose rates can be more easily measured. For example, ATP synthesis fluxes are directly linked to carbon fluxes (as illustrated in Fig. 1) and oxygen consumption rate (a measure of oxidative phosphorylation) which are both experimentally accessible. Because the structure of these biochemical pathways is known, measurements of these coupled fluxes enable calculation of and , as discussed in Sec. 3.1.
The simplest case of these balances is when a cell is at steady state, not changing and not growing (e.g. cell cycle-arrested oocytes). In this case, the time derivatives are eliminated, and ATP production and consumption are balanced. A slightly more complex case entails cells that grow at a constant rate without changing their overall composition (e.g. microbes in balanced growth). It is straightforward to show that in such case normalization by the mass (i.e. considering ATP per unit biomass) again yields a steady-state system with zero time derivatives. The most complicated, general case entails explicit time dependence, e.g. in the case of developing embryos which both grow and change their composition. In such systems, dynamic changes in molar composition, production, and consumption may be non-negligible and must be measured in order to infer ATP synthesis/hydrolysis fluxes. For the moment, we shall focus on steady-state systems, where the total ATP production flux is equal to the total ATP consumption flux.
In steady-state systems, overall changes in ATP consumption rate are compensated by corresponding changes in production rate. Thus, manipulating the rate of a single ATP-consuming process of interest and measuring the concomitant change in ATP production is an intuitively appealing experiment to infer the energetic cost of that process. Let us consider a hypothetical experiment where the rate of a given ATP-consuming process of interest was decreased by 50% while leaving the rates of all other ATP-consuming processes unchanged, and it was observed that the global ATP production rate of the system decreased by some amount mol ATP/s. Assuming the energetic cost of a process is linear in its rate, the naive interpretation would be that the energetic cost of process was mol ATP/s.
In reality, the potential coupling between different cellular processes can complicate the interpretation of such experiments. Processes can be directly coupled, e.g. through signaling pathways that regulate their activity, and indirectly coupled, e.g. through shared pools of substrates or cofactors. Altering the activity of certain processes can cause changes in physiology which affect the rates of a multitude of other cellular activities, and therefore their respective rates of ATP production or consumption. For example, manipulating the activity of a process may alter cells’ growth rates, changing the rates of many biosynthetic reactions.
Additionally, straightforward interpretation of a change in ATP production rates as the energetic cost of the targeted process requires that the total ATP consumption of the cell vary linearly with the ATP demand of that process. It is not yet clear whether this is generally the case, and systematic studies are needed to answer this question in each system of interest. There is reason to believe that this could complicate our understanding of flux changes: the enzyme adenylate kinase, which catalyzes the reversible reaction \ceATPAMP ¡-¿ 2 ADP, operates close to equilibrium and is known to buffer the energy charge of the cell (([ATP]+1/2[ADP])/([ATP]+[ADP]+[AMP])) [11]. Other ATPases can have a Michaelis-Menten constant close to intracellular ATP/ADP levels, and their reaction rates and directions could be similarly sensitive to changes in ATP/ADP induced by perturbations [8, 12]. Their contribution to overall ATP production and consumption fluxes could be different in systems before and after process activity changes. This would introduce nonlinearities into the relationship between the ATP demand of a process of interest and the global ATP consumption of the system, hampering interpretation of activity modulation experiments. The extent of this effect is unknown.
Thus, it is important to characterize the dependence of different processes’ ATP consumption rates on ATP levels (and possibly levels of ADP, AMP, phosphate, and other species which affect their rates) to properly infer the cost of a single process of interest. One way to conceptualize the impact of this complication is to divide ATP consuming processes into those whose fluxes are sensitive to levels of these species, and those whose fluxes are insensitive to levels of these species. Reactions which respond to ATP levels (or the levels of ADP, AMP, phosphate, etc.) will tend to buffer ATP levels (“buffer” processes) by two possible mechanisms: 1) some ATPases will increase their rate of consumption as ATP levels rise and decrease as they fall, and 2) others can switch their flux from consumption to production depending on the levels of ATP, ADP, AMP and other species. In contrast, many other processes are relatively insensitive to ATP levels and continue to consume ATP at nearly constant rates (“demand” processes). This can be formalized by separating the ATP-consuming fluxes in Eq. 2 on the basis of their sensitivity to ATP levels over the range explored in a given modulation experiment:
| (3) |
Here, is the ATP consumption flux associated with ATP level-insensitive process and is the ATP production flux associated with the buffering process ; these fluxes are defined to be positive when proceeding in the direction of ATP synthesis. The partitioning of the reactions in the cell into the two sums depends on the for ATP of the machinery in each process and the range of ATP concentrations explored in a given experiment, which together determine which reaction rate changes can be safely neglected.
In summary, the ATP consumption rates of individual processes cannot be directly measured. However, Eq. 3 shows how total ATP production and consumption by all processes is balanced in steady-state systems. This structure motivates the use of activity modulation experiments to probe the energetic costs of individual processes. Despite the complications associated with the interpretation of ATP flux changes, these experiments are the most direct method to determine energetic costs. Therefore, in the following section we discuss how the relationship between Eq. 3 and other mole balances enables determination of ATP production rates, and therefore the energetic costs of different processes, from activity modulation experiments. We then consider the caveats of these measurements, and subtleties of activity modulation experiments, including coupling between different fluxes.
3 Chemical and calorimetric methods to calculate ATP production fluxes
Inferring the energetic cost of a specific cellular process requires measuring changes in ATP production fluxes caused by modulating the activity of that process. The major ATP-producing pathways in many systems are glycolysis and respiration, whose rates can be measured by several different experimental methods. In this section, we will discuss the logic underlying chemical and calorimetric methods to measure these fluxes, and the respective challenges of these methods.
3.1 Inferring ATP production rates by chemical measurements of glycolytic and respiratory fluxes
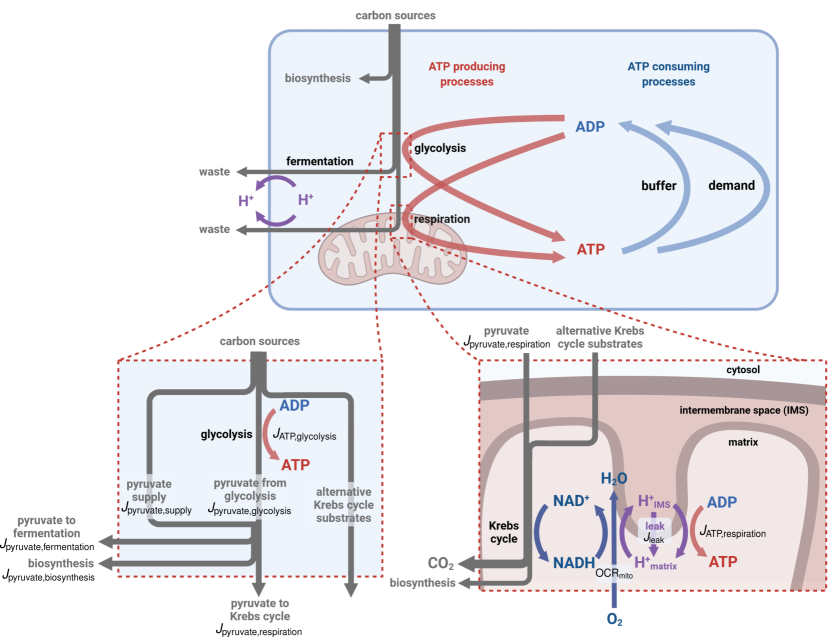
In many systems, ATP is produced primarily through glycolysis and respiration, which are catabolic pathways that transduce free energy from the breakdown of carbon sources to phosphorylate ADP. The fluxes through these pathways are coupled primarily through pools of carbon-containing metabolites and the electron carrier \ceNAD(H). Glycolysis and respiration each directly produce ATP. Additionally, glycolysis reduces the electron carrier \ceNAD+ to produce \ceNADH, as well as the carbon-containing compound pyruvate. These pyruvate molecules then serve as input to respiration, or another pathway, fermentation. Fermentation converts pyruvate to waste products without producing ATP, and serves to regenerate the cofactor \ceNAD+. In contrast, respiration involves oxidation of pyruvate to \ceCO2 through the Krebs cycle, which is coupled to the electron transport chain (ETC) to produce ATP. Fig. 2 illustrates the high-level couplings between ATP synthesis and hydrolysis to carbon and other fluxes. The relationships between these fluxes suggest which experimentally accessible reaction rates can be measured to infer ATP production rates.
3.1.1 Glycolytic ATP production
Glycolysis is a highly conserved ten-reaction pathway that converts glucose to pyruvate, which is then processed by fermentation or respiration. In the first portion of glycolysis, ATP is consumed to split glucose into two carbon skeletons that are prepared for the second, energy-yielding phase. In this phase each of the two skeletons is converted to a pyruvate molecule, producing one molecule of the electron carrier NADH and two molecules of ATP each. Thus, there is a net gain of 2 molecules of ATP and 2 molecules of NADH per input glucose that passes through the entirety of glycolysis [13].
Other carbon sources, such as fructose and sucrose, can also enter glycolysis at intermediate stages. Additionally, a number of glycolytic intermediates are siphoned off for various biosynthetic reactions, including production of nucleotides, amino acids, and lipids. The relative magnitudes of biosynthetic and glycolytic fluxes can vary widely from system to system, resulting in different fractions of glycolytic substrates ultimately participating in the ATP-producing steps of glycolysis and being transformed into pyruvate [14, 15]. These complications can be coarse-grained into an effective factor which describes the average molar ratio of ATP directly produced by glycolysis to pyruvate produced by glycolysis, which can be measured in a given system using metabolic flux analysis (MFA) or other methods:
| (4) | ||||
We can then back out by considering how glycolytic, respiratory, fermentative, and biosynthetic fluxes are coupled through pyruvate. Pyruvate can be fermented (with flux ) to species like lactate, acetate, or ethanol depending on the specific system and nutrient conditions, oxidizing NADH back to \ceNAD+ in the process; the fermentation products are then eliminated by the cell. Pyruvate can also be fed into the Krebs cycle and thus contribute to respiration (with flux ), and can also be diverted to biosynthesis (with flux ) [16]. Pyruvate may also be directly supplied in some systems (with flux ). At steady state, the flux balance on pyruvate is:
| (5) | ||||
as illustrated in Fig. 2 (lower left detail). Under certain nutrient conditions, fermentation operates in reverse (e.g. conversion of lactate or ethanol to pyruvate), in which case is negative. and are typically determined by measuring cellular imports and exports, while can be determined by measurements of cellular composition and growth rate. Measuring , as well as characterizing the indirect contribution of glycolytic NADH production to respiratory ATP production, requires measurement of mitochondrial respiratory activity.
3.1.2 Mitochondrial respiratory ATP production
Mitochondrial respiration consists of a series of free energy transduction cycles that link catabolic reactions to ATP production [17] (Fig. 2, lower right detail). Free energy from breakdown of carbon sources, including pyruvate, carbohydrates, fatty acids, and amino acids is transduced to electron carriers NADH/\ceNAD+ or \ceFADH2/\ceFAD+. The reducing equivalents supplied by these carriers are used by the electron transport chain (ETC) to reduce molecular oxygen and establish a proton gradient across the mitochondrial inner membrane. Finally, the free energy associated with this proton gradient is used to power ATP synthesis; this is achieved by proton flow through ATP synthase, a cross-membrane rotary motor. However, some fraction of protons leak directly through the lipid bilayer without passing through ATP synthase, dissipating free energy into heat.
At steady state, the net fluxes through the \ceNADH/\ceNAD+ redox cycle, the \ceH+ translocation cycle, and the ATP/ADP cycle are balanced with each other. Because the ETC consumes oxygen to oxidize NADH, mitochondrial oxygen consumption rate () is proportional to the NADH oxidation flux (assuming \ceFADH2 flux is negligible or proportional to NADH flux), and is proportional to the rate of proton extrusion from the mitochondrial matrix into the intermembrane space. The rate of proton extrusion, less the rate of proton leak through the mitochondrial inner membrane (), is the rate at which protons return to the matrix through ATP synthase. The rate of ATP synthesis by this process is thus given by:
| (6) |
where fluxes of different species are related to each other by the \ceH+/O ratio, (the number of protons translocated per oxygen atom reduced) and the P/O ratio, (the number of ATP molecules synthesized per oxygen atom reduced in the absence of proton leak). is 10 for NADH oxidation and 6 for \ceFADH2 oxidation. The exact value of is variable, but a typical value for mammalian cells is 2.5 for mitochondria using NADH and 1.5 when using \ceFADH2 [18, 19, 20]. These ratios are determined by the reaction and subunit stoichiometry of the enzymes catalyzing the reactions in mitochondria: is determined by complex I, III and IV of the electron transport chain; is determined by , properties of ATP synthase, and transport of ATP from mitochondria to the cytoplasm by the enzyme adenine nucleotide translocase. Estimating is challenging, as we discuss in Section 4.
3.1.3 Measuring combined ATP production by glycolysis and respiration
The NADH reducing equivalents produced by glycolysis can effectively be transported into mitochondria by shuttling mechanisms (e.g. the malate-aspartate shuttle, glycerol-3-phosphate shuttle) [21]. This indirect contribution of glycolysis to total cellular ATP production is captured in the measurement of respiratory ATP production (Eq. 6).
Pyruvate produced by glycolysis is not necessarily the only input to the Krebs cycle, and therefore it is not the only source of reducing equivalents for the electron transport chain in many systems [22, 23]. Instead, the flux of pyruvate from glycolysis to respiration is given by:
| (7) | ||||
where is an empirical proportionality constant that is the ratio of mitochondrial OCR to the rate at which pyruvate is supplied to respiration by glycolysis. captures two variable factors: (1) the fraction of pyruvate produced by glycolysis, as opposed to pyruvate supplied by other means, which is fed into the Krebs cycle, and (2) the variable contribution of pyruvate to the production of reducing equivalents (e.g. NADH). Krebs cycle intermediates can be siphoned off to participate in biosynthetic reactions, and some species can enter the cycle at a point other than Acetyl-CoA; -ketoglutarate is an example. Additionally, some organisms employ variants of the Krebs cycle (e.g. the glyoxylate shunt) which involve different reactions [16]; these differences are similarly reflected in .
Combining Eqs. 4-7 we see that the total rate of ATP production by glycolysis and respiration is:
| (8) | ||||
Eq. 8 provides a strategy to determine the flux of ATP production from glycolysis and respiration (which, at steady-state is equal to the flux of ATP consumption) by measuring mitochondrial OCR, fluxes associated with nutrient uptake, nutrient secretion, and biomass synthesis, and the flux associated with proton leak. Such an approach has been used to infer ATP production rates in mammalian cells by simultaneous measurement of both fermentation and respiration rates [21, 24]. Alternative methods to measure that do not rely on characterizing the pyruvate balance (e.g. measurements of glycolytic substrate uptake and biosynthesis rates) may be more suitable in other systems.
3.2 Measuring glycolytic and respiratory fluxes using calorimetry
We shall now show that calorimetry provides an alternative means to determine the flux through respiration and glycolysis. In a constant-pressure calorimeter, the heat output measured by the calorimeter, , equals the rate of of change of the enthalpy of the entire calorimetry sample, ; that is, , where a negative value of indicates the sample is producing heat. The enthalpy of the entire calorimetry sample, , is the sum of the enthalpy of the biological sample, , and the enthalpy of the media that surrounds it, . In cell biological systems, changes in enthalpy primarily result from chemical reactions converting one molecular species into another, in which case:
| (9) |
where and are the number of moles of species within the biological sample and the surrounding media, respectively, and is the molar enthalpy of that species. In the special case that cells are at steady state, i.e. they are not growing and their composition is not changing in time, . Then, the change in the concentrations of species in the surrounding media is equal to the difference in cellular import flux, , and export flux, , of that species. Thus, Eq. 9 becomes:
| (10) |
where is the flux of an index species (denoted by ) through the net reaction , which proceeds from cellular imports to cellular exports, and is the enthalpy of reaction per mole of the index species. Eq. 10 reveals that in steady state the heat production measured by calorimetry reflects the difference in enthalpy between the cellular imports and waste, i.e. the net reaction of the cell. This relationship forms the basis for calorimetric measurements of net metabolic fluxes.
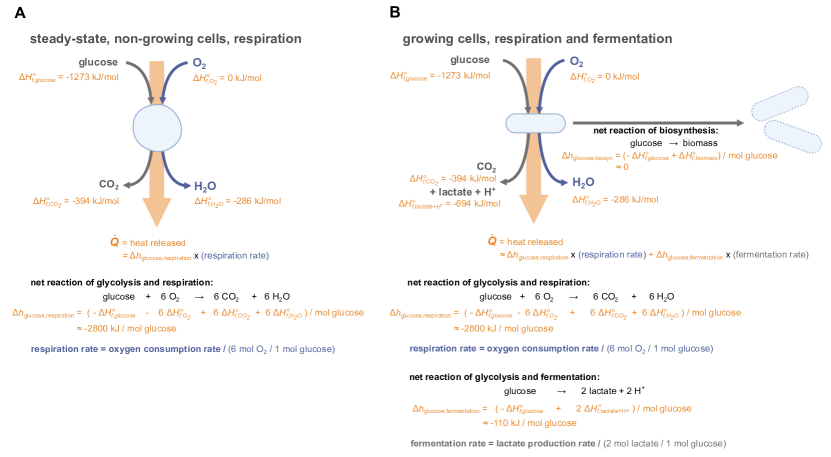
For steady-state cells that respire all of the carbon that they import, e.g. cell-cycle arrested oocytes, there is a direct relationship between respiratory flux and heat production (Fig. 3A). Consider a steady-state cell that imports glucose and oxidizes it completely to carbon dioxide and water. The net reaction of such a cell is \ceC6H12O6 + 6O2 -¿ 6 CO2 + 6H2O. Because glucose, carbon dioxide, and water have enthalpies of formation of -1273, -394, and -286 kJ/mol, respectively, the total enthalpy of reaction is -2800 kJ/(mol glucose consumed). The heat output for such a system is where is the rate of glucose consumption. Thus, approximately 467 kJ are liberated for every mole of \ceO2 consumed, and the heat output measured is straightforwardly related to the OCR measurements discussed in Sec. 3.1.2. While this calculation is for the specific case of purely respiratory metabolism using glucose as the substrate, there is a long-standing empirical observation known as Thornton’s rule [25] that the heat evolved from consuming a given amount of oxygen, called the oxycaloric coefficient, is approximately constant (-455 kJ/mol \ceO2) across different substrates. Thornton’s rule enables inference of OCR from calorimetry measurements without information about the identity of the respiratory substrate. This suggests an approach to infer ATP production flux from calorimetry: heat flux may be converted to an equivalent OCR using Thornton’s rule, and OCR can then be converted to the corresponding ATP production flux using Eq. 6 and measured values of the proton leak flux and stoichiometric ratios.
To extend this analysis beyond purely respiratory metabolism, let us next consider steady-state cells that obtain all their energy from anaerobic glycolysis. A common scenario involves import of glucose and fermentation to lactate, in which case calorimetry measures the enthalpy flux associated with the reaction \ceC6H12O6 -¿ 2 C3H5O3- + 2H+. The enthalpy of this reaction is -110 kJ/(mol glucose consumed); this is far smaller than -2800 kJ/(mol glucose consumed) because fermentation results in the incomplete oxidation of glucose. Using the enthalpy of reaction, one can convert the heat flux to a glycolytic flux, which can in turn be converted to ATP production flux using Eq. 4 if the effective stoichiometry is known.
For non-growing, steady state cells which perform respiration, glycolysis and fermentation, the heat output measured by calorimetry will reflect the fluxes through all of these reactions. Consider a cell which consumes glucose, some of which is completely respired, with the rest fermented to lactate. The heat output for such a system is , where is the rate of lactate secretion (i.e. the rate of fermentation). Thus, if heat flux and OCR are measured, the rate of fermentation can be inferred (or if heat flux and fermentation are measured, OCR can be inferred). More generally, the heat associated with respiration can be calculated from Thornton’s rule, while the heat associated with fermentation will depend on the particular fermentation products. The ratio between the predicted respiration-associated heat output and that measured by calorimetry has been used to probe how the mode of metabolism changes over time in various systems [26, 27, 28].
We have thus far only considered cells at steady state, but many systems of interest are not in steady state, in which case the internal energy of the cells is constantly changing. For growing cells, biomass increases over time, and thus ; Eq. 9 can then be written as:
| (11) |
where indexes net biosynthetic reactions, from imported compounds to biomass components, e.g. glucose to lipids or glucose to protein; represents the flux of an index species (denoted by ) through reaction ; and is the enthalpy of that reaction per mole of the index species. Similarly, indexes net non-biosynthetic reactions (including ATP-producing pathways); represents the flux of an index species (denoted by ) through reaction ; and is the enthalpy of that reaction per mole of the index species. The two dominant net non-biosynthetic reactions that we consider are 1) respiration of imported carbon sources, and 2) conversion of imported carbon sources to fermentation products. In cells consuming glucose and performing glycolysis, respiration, and fermentation, these correspond to glycolysis followed by respiration and glycolysis followed by fermentation, respectively.
However, the enthalpy of formation of biomass is very close to that of typical carbon sources for cells. Experimental measurements in E. coli indicate that the enthalpy of net anabolic reactions is very near zero [29], which simplifies equation 11 to:
| (12) | ||||
where is the enthalpy associated with the net reaction of respiration from import of carbon source to export of \ceCO2, per mole of oxygen consumed (which is -455 kJ/mol \ceO2 by Thornton’s rule); is the enthalpy associated with the net reaction of import of carbon source to export of fermentation products, per mole of fermentation product exported; and is the rate at which said fermentation product is exported from the cell.
In summary, changes in biomass often contribute negligibly to the heat flux measured by calorimetry, which can therefore be related to flux through glycolysis, fermentation, and respiration even in growing cells (Fig. 3B). Thus, calorimetry reflects metabolic fluxes even in non-steady-state biological systems, such as developing Drosophila and zebrafish embryos [30, 31].
4 Measuring energetic costs by process activity modulation
Equation 3 illustrates how ATP production and consumption are linked; in a system approximately at steady state, these two fluxes are balanced. Therefore, as described above, an intuitively appealing strategy for inferring the energetic cost of a process is to change the activity level of the process and measure concomitant changes in energy production rate.
Several authors have inhibited processes such as translation and measured changes in oxygen consumption rate [6, 7], though inferring the energetic cost of a process from a single activity modulation experiment presupposes that the perturbation leaves the rates of other processes unchanged. Practically, such separability of different processes is unlikely; the activity of different processes can be linked. For example, inhibiting transcription has downstream effects on translation; inhibiting translation prevents production of enzymes whose operation involves ATP hydrolysis; and the reduced activity of these ATPases can change the cellular environment, such as through pH changes which affect a range of proteins. Each level of these indirect effects affects additional cellular machinery, and therefore has implications for ATP consumption. Thus, the observed changes in metabolic fluxes are a superposition of the direct effects of the applied perturbation, as well as indirect first order effects, second order effects, and so on. The downstream effects of perturbations can manifest on multiple timescales. For example, changes in metabolite concentrations and signaling may occur rapidly, while changes in protein expression take place more slowly [32, 33, 34]. Thus, extracting information about energetic costs from activity modulation experiments requires a systematic accounting of the effects of a perturbation on other cellular machinery.
In the case of a steady-state system, ATP production is balanced by ATP consumption. In this case, if the activity of a cellular process is altered, changing the ATP demand of that process by some amount , and the system reaches a new steady state, the difference between the ATP balance before and after inhibition indicates the cost associated with the difference in the activity of that process. Combining Eq. 3 (at steady-state) and Eq. 8, we obtain the change in the ATP consumption flux of process :
| (13) | ||||
If the process is completely inhibited, is the total energetic cost of the process. Eq. 13 provides a quantitative framework to measure energetic costs from activity modulation experiments. This equation connects measurements of experimentally accessible fluxes to the energetic costs of interest.
In the simplest possible case, when inhibition of the target process does not impact any other ATP-consuming process or mitochondrial leak, then , , and are zero, and measuring the change in ATP production by glycolysis and respiration will yield the energetic cost of the inhibited process. However, in general , , , and other coupled cellular processes could change as a result of modulating the activity level of a process of interest. Therefore, to determine the energetic cost of process using an activity modulation experiment, one must either (1) directly measure the change in individual fluxes on the right hand side of Eq. 13 in each experiment, which is generally difficult, or (2) develop mechanistic models of flux regulation that capture the generic response of each flux term to changes in experimentally accessible metabolite concentrations or chemical potentials (e.g. ATP concentration, ATP/ADP ratio, proton motive force, NADH/\ceNAD+ ratio) that can be more easily measured in individual activity modulation experiments.
Below we highlight key challenges associated with measuring each of the flux terms on the right hand side of Eq. 13 to determine energetic costs from activity modulation experiments:
-
•
Measuring requires characterization of flux partitioning. There is not necessarily a constant ratio between the glucose routed through glycolysis and anabolic pathways under different conditions [14, 15]. Because glycolytic intermediates are siphoned off for biosynthesis, the flux through a single step of the pathway does not directly indicate ATP payoff from glycolysis. Similarly, inferring glycolytic pyruvate input to the Krebs cycle is challenging because of the many branch points within the Krebs cycle which can introduce or siphon off intermediates. These complications are captured in the effective stoichiometric coefficients and . Measuring these quantities may require high-resolution mapping of metabolic fluxes, as discussed in Sec. 5.
-
•
and are substrate-dependent. For substrates whose metabolism involves NADH (e.g. pyruvate) is 10 and is typically 2.5 in mammalian cells, but for those whose metabolism involves \ceFADH2 (e.g. succinate) is 6 and is typically 1.5 [18, 19, 20]. The relative fluxes of the various substrates which enter the Krebs cycle at different stages must be determined in order to estimate the net and .
-
•
depends on proton motive force. Proton leak represents the fraction of mitochondrial OCR that does not contribute to ATP synthesis due to the permeability of the mitochondrial inner membrane to protons and the possible presence of uncouplers. This flux can be measured by OCR following inhibition of ATP synthase activity. Proton leak may not necessarily remain constant after perturbations: process activity modulation may change ATP synthesis rate, which could in turn alter the proton gradient across the mitochondrial inner membrane and thus the proton leak flux. Combining measurements of proton motive force (a combination of the proton gradient and the membrane potential) with a model of how leak flux depends on the proton motive force enables estimation of [35].
-
•
Off-target effects and coupling between processes may lead to non-vanishing . Activities of cellular processes of interest are often altered through pharmaceutical perturbations which may have off-target effects; for example, cycloheximide, an inhibitor of protein synthesis, is thought to directly affect metabolism at high concentrations [6, 36]. Moreover, different ATP-demanding processes in the cell can be coupled, and their values could each change upon perturbation, either as a direct result of the perturbation or due to indirect effects. For example, the product of one ATP (equivalent)-consuming process could be required for a different ATP-consuming process, as in the case of transcription and translation. Gross changes in cellular physiology caused by a perturbation (e.g. pH, osmolarity) could also affect many different demand and buffering processes.
-
•
Measuring requires characterization of ATP flux-buffering mechanisms. ATP-dependent processes can interact through the shared ATP/ADP pool: changes to this pool caused by perturbing one ATP-dependent process could alter ATP/ADP concentrations, affecting other machinery sensitive to ATP levels in turn. Because could compensate for flux changes induced by process activity modulation, it must be estimated by identifying individual buffering enzymes and characterizing their sensitivity to changes in ATP/ADP concentrations [8, 37].
In addition to the challenges discussed above, we note that the applicability of Eq. 13 is limited to organisms producing ATP exclusively from glycolysis and oxygen-dependent respiration, which is the case for many systems of interest. However, some organisms may utilize different modes of energy metabolism, and Eq. 13 can be generalized accordingly by including the corresponding fluxes. For example, oxygen is not the only electron acceptor in respiration. Many bacteria perform respiration with terminal electron acceptors such as fumarate and nitrate instead of oxygen [38]. Recent work has shown that under conditions of hypoxia or inhibition of Complex IV of the mitochondrial electron transport chain, mammalian cells can similarly use fumarate as the terminal electron acceptor [39]. Under these conditions OCR does not quantify respiratory activity, and alternative methods such as the measurement of NADH/\ceNAD+ flux [40] may be necessary. Additionally, alternative ATP production pathways, such as photosynthesis or formation of ATP from AMP and pyrophosphate represent major sources of ATP in some systems [41, 42]. Moreover, Eq. 13 only considers ATP production and consumption, but other metabolites also provide free energy to power cellular activities. For example, NADPH plays a central role in oxidative stress response activities and in biosynthetic reactions, and its turnover rate constitutes a significant portion of the cost of biosynthesis [17, 43]. Measurements of fluxes of NADPH and other metabolites will be necessary to provide a complete picture of the energetic cost of cellular processes.
In summary, the most direct means to determine the energetic cost of a cellular process is to measure how altering the activity of that process impacts ATP fluxes. Eq. 13 provides a systematic means to interpret such experiments. This equation enumerates the relevant, individual fluxes that will be present in many biological systems of interest. Each of these fluxes is challenging to charaterize, and some must be estimated by combining multiple types of measurements.
5 Methods and technologies for measuring fluxes and concentrations
Here we review a selection of the methods available to measure the metabolic fluxes referred to in Eq. 13 and the associated metabolite concentrations. Technologies for flux and concentration measurements have matured considerably over the last two decades; modern metabolomics- and spectroscopy-based methods have enabled measurements with previously inaccessible spatial and temporal resolution [44]. These new technologies have produced a wealth of flux and metabolite concentration data in living cells, but it remains a challenge to integrate these data to infer the energetic cost of specific cellular processes. No single technique can accurately measure all the fluxes presented in Eq. 13.
5.1 Measurements of respiration rate
Oxygen is a common terminal electron acceptor in the mitochondrial electron transport chain (ETC), which drives respiratory ATP generation. Thus, oxygen consumption rate (OCR) is frequently used as a metric for global metabolic activity of aerobic organisms. In many types of eukaryotic cells, mitochondrial respiration accounts for the majority of OCR [45]; hence, cellular OCR is a reliable proxy for mitochondrial ETC flux. For cells where non-mitochondrial OCR is substantial, mitochondrial inhibitors can be applied to separate the mitochondrial and non-mitochondrial OCR. In this section, we review techniques that measure cellular and mitochondrial OCR, which are summarized in Table 1.
Sealed-chamber respirometry is used to measure cellular OCR by determining the rate of decrease of oxygen level in an airtight chamber containing cells [46, 24, 47]. It is usually applied to a population of cells and can resolve OCR dynamics with minute-level time resolution. Open-chamber respirometry measures OCR in a half-open chamber by characterizing the steady-state spatial gradient in oxygen concentration across the chamber, which is established by the balance of oxygen diffusion from the open end and oxygen consumption of cells located at the other end [48]. Establishing the concentration gradient may take a few hours, placing a lower bound on the time required to make the first measurement. The advantage of this technique is that the chamber can be engineered to resolve the OCR of a small number of cells, which is particularly useful when studying oocytes and embryos [48].
Respirometry is a bulk technique that gives the net oxygen consumption of the entire sample. In contrast, fluorescence lifetime imaging microscopy (FLIM) has recently been established as a robust method to measure mitochondrial ETC flux with optical resolution, enabling the characterization of subcellular spatial variations [40]. This is achieved through model-based inference using FLIM of mitochondrial NADH. This method requires mitochondrial respiration to be at steady or quasi-steady state, which holds as long as dynamics of interest are slower than the kinetic rates of mitochondrial enzymes, which are on the order of seconds. This technique can potentially resolve OCR dynamics on the order of seconds.
| Method | Timescale of measurement | Spatial resolution | Time series possible? | Examples |
| Sealed-chamber respirometry | minutes | none | yes | mouse embryos [46]; tissue culture cells [24]; isolated mitochondria [47] |
| Open-chamber respirometry | hours | none | yes | bovine oocytes [48] |
| Fluorescence lifetime imaging microscopy (FLIM) | seconds | yes | yes | mouse oocytes and tissue culture cells [40] |
5.2 Measurements of nutrient import and waste export
Extracellular measurements of nutrients and waste products are often used to infer the rates of glycolysis and fermentation. Each of these measurements requires that cells consume nutrients (e.g. glucose) and produce waste products (e.g. ethanol, acetate, lactate/\ceH+) at a quasi-steady rate. By analyzing the composition of the media, one can infer the rate of the pathway associated with the production or consumption of the analyte. Methods for measuring nutrient import and waste export vary widely in their principles of operation and their limitations. The primary characteristics of several common methods are listed in Table 2.
Colorimetric and electrochemical assays employ enzyme-linked reactions with absorbance, fluorescence, or electrical signal-based readouts. These methods can be high throughput; they are often designed for parallel measurements in multi-well plates. However, the slow degradation of fluorescent compounds and enzymes can hamper accurate quantification. Liquid chromatography (LC) involves separation of metabolites using chromatography, followed by quantification on the basis of absorbance by optical detectors, or mass-to-charge ratio (using mass spectrometry (MS)). LC-MS measurements are subject to complex caveats beyond the scope of this work, which have been described elsewhere [49]. Nuclear magnetic resonance (NMR) spectroscopy relies on the distinct frequency spectra of nuclei in different molecules to simultaneously quantify several nutrients/waste products in media. The number of species whose concentrations can be accurately resolved by NMR is frequently limited by spectral overlap of different compounds [50]. Measurements of extracellular acidication rate (ECAR) are often performed in tandem with oxygen consumption rate measurements in commercial instruments like the Seahorse Extracellular Flux Analyzer (Agilent). Some cells perform lactic acid fermentation, producing lactate anions which are then exported by a lactate/\ceH+ symport mechanism, acidifying media. Acidification is treated as a proxy for fermentation rate. However, respiratory \ceCO2 production also contributes to acidification, and corrections must be applied to accurately infer fermentation rate [21]. Additionally, this method assumes that all lactate produced is eliminated, which may not be the case in all systems [51, 52].
The timescale of extracellular composition measurements is typically limited by how long it takes cells to significantly change the concentrations of nutrients or waste products in the medium. The length of a time course will vary greatly depending on the concentrations of nutrients or metabolites under consideration, and the fluxes involved in the turnover of their respective pools; rates can be calculated from serial samples of the same population.
| Method | Timescale of measurement | Spatial resolution | Time series possible? | Examples |
| Colorimetric or electrochemical assays | minutes to hours | none | no | yeast [53]; mouse [54] |
| Liquid chromatography (LC) with optical detection or mass spectrometry (MS) – media analysis | minutes to hours | none | no | bacteria and yeast [55]; stem cells [56] |
| Nuclear magnetic resonance (NMR) spectroscopy | minutes to hours | none | no | bacteria [57]; human bodily fluids [58]; rat brain [59] |
| Extracellular Acidification Rate (ECAR) | minutes | none | yes | tissue culture cells [21] |
5.3 Intracellular flux measurements
Here, we consider intracellular fluxes to include those pathways whose rates are not solely determined by measurements of nutrient uptake, waste secretion, or oxygen consumption rate. Resolving these rates enables inference of flux partitioning at key branch points in metabolism, such as splits between bioenergetically relevant fluxes (e.g. glycolysis and Krebs cycle fluxes), and biosynthetic fluxes. Another example is the direct measurement of ATP synthesis flux, which is not constrained solely by respiration rate, but depends on proton leak as well.
Here we consider five examples of intracellular flux measurement methods: nuclear magnetic resonance (NMR) spectroscopy, \ce^31P saturation transfer magnetic resonance spectroscopy (MRS), metabolic flux analysis (MFA), kinetic flux profiling (KFP), and stimulated Raman spectroscopy (SRS), which each report different quantities: NMR can be used to probe the absolute values of net fluxes, MRS is used to estimate total cellular ATP production flux, MFA is used to measure ratios of net fluxes at branch points in metabolic pathways, KFP is used to measure the absolute values of gross fluxes, and SRS is used to measure the concentrations of specific chemical bonds. Their primary characteristics are summarized in Table 3.
^31P MRS involves selective saturation of the -phosphate resonance of ATP in steady-state, followed by monitoring of changes in free phosphate signal over time to infer total cellular ATP synthesis rate [10]. This method is nondestructive, but measurement times can be long in some cases. The accuracy of this method can in theory be affected by production of free cytosolic phosphate by de-phosphorylation of abundant intermediates (e.g. fructose-1,6-bisphosphate), which may lead to underestimation of ATP-to-free phosphate flux [60]. \ce^31P MRS is not widely used in modern bioenergetics studies.
For metabolic flux analysis (MFA), cells are supplied with labeled nutrients, and different branches in a metabolic pathway produce distinct steady-state labeling patterns in downstream metabolites. The ratiometric nature of MFA enhances the accuracy of flux partitioning estimates. However, MFA results must be constrained by extracellular flux measurements to infer absolute fluxes. The time required to achieve steady-state labeling depends on the system and pathway of interest, but can be short in some cases [61, 62]. Recent work has focused on extending MFA to non-steady-state systems [63, 64].
In kinetic flux profiling (KFP), a time course of isotope labeling patterns is measured by LC-MS following a rapid switch from an unlabeled to labeled nutrient. Assuming that metabolic reactions can be accurately modeled by first-order kinetics, rates of different reactions can be calculated. Labeling can be quite fast (e.g. min for central metabolites in E. coli), and thus KFP may be extended to non-steady-state systems [65].
Stimulated Raman spectroscopy (SRS) enables quantification of specific chemical bonds on the basis of their vibrational signature. By supplying labeled nutrients to cells and monitoring the concentration of specific bonds, one can observe their incorporation over time. However, in theory, both nutrient uptake and incorporation of bonds into biomass may contribute to the observed signal when using certain substrates; there may also be slight spectral shifts depending on the biomolecules into which the labeled bonds are incorporated [66].
| Method | Timescale of measurement | Spatial resolution | Time series possible? | Examples |
| Nuclear magnetic resonance (NMR) spectroscopy | minutes to hours | none | yes | human brain [67] |
| \ce ^31P saturation transfer magnetic resonance spectroscopy (MRS) | minutes to hours | none | yes | yeast [68]; rat kidney [69]; rat heart [70] |
| Metabolic Flux Analysis (MFA) | hours | none | no | B. subtilis [71]; E. coli [72]; yeast [73] |
| Kinetic Flux Profiling (KFP) | minutes | none | yes | E. coli [65] |
| Stimulated Raman Spectroscopy (SRS) | minutes to hours | yes | yes | tissue culture cells [74, 66], bacteria [75] |
5.4 Intracellular metabolite concentration measurements
Direct measurements of the fluxes on the right hand side of Eq. 13 can be challenging. An alternative method to obtain these fluxes is to develop mechanistic or empirical models that relate fluxes such as OCR, proton leak and ATP buffering, to experimentally accessible quantities such as intracellular metabolite concentrations. Biophysical models of mitochondrial metabolic pathways are proving to be useful in revealing the relationships between fluxes and concentrations [76, 77, 40, 78, 79].
Fluorescent biosensors have recently enabled measurements of key metabolite concentrations in living cells with subcellular resolution. Examples include ATP concentration [80], ATP/ADP ratio [81], mitochondrial membrane potential [82], NADH/\ceNAD+ ratio [83], pyruvate concentration [84], lactate concentration [85] and glucose concentration [86]. Sensors must be chosen so that their dynamical range is well-matched with the concentration of the analyte in the system of interest. It is also important to correct for the impact of other factors, such as pH, on the sensor signal. NADH and NADPH are autofluorescent, and their concentrations can be measured using fluorescence lifetime imaging microscopy (FLIM) [40, 87]. One challenge is to separate NADH signal from NADPH signal, which share the same fluorescence spectrum.
Chemical assays can be used to measure concentrations of biomolecules such as polysaccharides and protein which are critical to cellular composition estimates. Liquid chromatography - mass spectrometry can be used to measure concentrations of a large number of metabolites [12]. However, these methods require destructive sampling and often provide limited spatiotemporal resolution. Nuclear magnetic resonance has been used to measure concentrations of specific metabolites as well [88]. Lastly, stimulated Raman spectroscopy is capable of measuring intracellular metabolite concentrations in living cells with subcellular resolution [89], but it remains a challenge to definitively associate spectral features to specific metabolites.
5.5 Measuring metabolic fluxes with calorimetry
As discussed in Sec. 3.2, the heat generated by biological systems is intimately related to their metabolic fluxes. This can be probed by isothermal calorimetry, which measures the heat output of a sample relative to a reference cell at a constant temperature. Isothermal calorimetry is a bulk measurement technique, and does not provide spatially resolved information. Common variants of this technique are listed in Table 4.
The temporal resolution of isothermal calorimeters is highly dependent on sample volume. High-sensitivity and low-volume (1 L) calorimeters have time resolution on the order of seconds [90, 91, 92], but the time resolution for larger-volume microcalorimeters is on the order of hours. Recent devices have achieved sensitivities on the order of 200 pW [90, 91, 92], which is sufficient to measure the output from single C. elegans or Drosophila embryos, though single-cell measurements for microbes remain out of reach.
The technical challenges associated with isothermal calorimetry depend strongly on the sample type and amount. In open-chip calorimetry, evaporation can be a significant source of error. For the lowest-volume and most sensitive chip-based calorimeters, with sample volumes less than 1 L, the temperature gradient across the thermopile used to read out a signal is on the order of 1 mK [90]. Thus, even small external temperature gradients, heat sources, or heat losses can significantly impact the measurement.
| Method | Timescale of measurement | Spatial resolution | Time series possible? | Examples |
| Isothermal microcalorimetry | varies | none | yes | E. coli [93], microbial biofilms [94], Cutibacterium acnes [95] |
| Open-chip calorimetry | varies | none | yes | molecular motors [90], enzymes [96], mouse adipocytes [97] |
| Closed-chip calorimetry | varies | none | yes | bacteria [98], C. elegans [92], Tetrahymena [91] |
6 Prior theoretical and experimental approaches to measuring bioenergetic costs
The flux balance framework and the experimental techniques presented in previous sections are tools that enable measurements of energetic costs of cellular processes. That approach centers on measuring the changes in the ATP fluxes in Eq. 13 after modulating the activity of a process of interest. In this section, we review previous work that has sought to determine these costs in various systems using a range of other approaches. We discuss these studies’ respective challenges and their relation to the flux balance formalism.
6.1 Estimates and inhibition experiments
While cellular energy budgets have generally not been probed systematically through experiments, the energetic costs of several key cellular processes have been estimated in different systems.
A number of attempts have been made to estimate the energetic costs of biosynthesis in growing microbes and developing embryos by leveraging knowledge of the underlying cellular biochemistry. In these calculations, the energetic costs of individual chemical reactions involved in protein, lipid and nucleic acid synthesis, multiplied by the abundances of these different macromolecules in the cell, were summed to arrive at an estimate of the total biosynthesis cost. In the case of protein synthesis, for example, the ATP equivalents required for amino acid activation (1/amino acid) and peptide bond formation (2/amino acid) were accounted for. Such calculations have led some researchers to conclude that protein synthesis is the major energy consumer in growing microbes, accounting for 55-65% of their total energy budget [3, 4, 2]. In contrast, biosynthetic processes have been estimated to account for less than 10% of the total ATP expenditure in developing Drosophila embryos [30].
Attempts to measure the energetic costs of cellular processes using inhibition experiments have typically focused on characterizing changes in respiratory and/or glycolytic fluxes, without explicitly considering the other ATP fluxes in Eq. 13. The results of such experiments suggest that protein synthesis and actin dynamics are the major energy consumers in myoblasts, each accounting for 20% of the total ATP production rate [21]. Similarly, in rabbit brain slices, inhibiting sodium-potassium pumps resulted in a 50% decrease of oxygen consumption rate, arguing that cation transport is a major energy drain [99].
In general, work directly comparing estimates to independent experimental measurements of energetic costs has been limited. However, cases in which these comparisons have been made demonstrate the synergy between these methods. Recent calorimetric measurements revealed oscillations in heat output during zebrafish embryo development, which ceased when the cell cycle was blocked. The authors of that study compared the amplitude and period of the heat oscillation with theoretical estimates of ATP consumption, and argued that they were due to phosphorylation and dephosphorylation reactions which accounted for 1-2% of the total energy expenditure of the embryo [100]. In other systems, significant differences have been observed between theoretical estimates and experimental measurements: in neurons, ATP accounting predicted that actin turnover accounts for less than 1% of energy expenditure [101], while inhibition experiments suggested that this process constitutes 50% of energy expenditure [102]. Discrepancies between estimates and measurements highlight the importance of careful examination of assumptions in theoretical calculations and of careful interpretation of process activity modulation experiments.
Estimates can also provide complementary insights. Chen et al. [103] compared the measured energy cost per beat of a flagellum to two independent theoretical estimates, and found both to be of the same order of magnitude, helping to rationalize the original measurement. In another case, measurements of information processing in the blowfly retina were compared to the minimum energy cost defined by information-theoretic limits. It was found that the measured cost was 5 to 8 orders of magnitude greater than this theoretical minimum [104]. This study demonstrated how estimates paired with measurements can provide insight into the origins of energetic costs and the relevance (or lack thereof) of fundamental physical limits.
Inferring the energetic cost of a specific process from changes in global fluxes after modulating the activity of a process requires knowing the degree and specificity of the change in its activity as well as the potential coupling of different cellular processes. One way to evaluate the accuracy of such a measurement is to compare the inferred cost to measurements of the change of the rate of the process. For example, by measuring incorporation of labeled amino acids, it was shown that the protein synthesis inhibitor cycloheximide completely blocked translation in fish hepatocytes and human hepatoma cells at a concentration of 25 M, causing a modest decrease in oxygen consumption. However, oxygen consumption continued decreasing as the concentration of cycloheximide was increased, indicating that there were off-target effects at higher concentrations [6]. Experimental measurements may also be cross-validated against estimates based on detailed models of the underlying processes and metabolic pathways [104, 105, 106, 4].
Apart from off-target effects, the intrinsic coupling between different cellular processes could also pose challenges for interpretation of changes in global fluxes. Wieser et al. [6] demonstrated that hierarchies of ATP-consuming processes exist in cells: inhibiting mitochondrial respiration and measuring protein synthesis rate and \ceNa+/\ceK+-ATPase activity in fish hepatocytes and human hepatoma cells revealed that these two processes display different sensitivities to energy limitation in each species. Similar experiments in thymocytes revealed a hierarchy of different processes’ sensitivities to inhibition of mitochondrial respiration: protein synthesis was most sensitive, followed by RNA/DNA synthesis and substrate oxidation, \ceNa+ cycling and \ceCa^2+ cycling, and finally other ATP consumers and mitochondrial proton leak [8]. Application of metabolic control analysis to this data suggested that each ATP consumer exerted negligible influence over the rates of other ATP consumers. However, direct measurements of how modulating the activity of a specific consumer affects the rates of other ATP-consuming process will be required to test these predictions. Given the species and cell type-dependence of the hierarchies of ATP-consuming processes, different systems of interest may need to be individually characterized.
One of the challenges in linking global fluxes with specific fluxes is the potential coupling of the fluxes through different cellular processes. For example, a striking phenomenon of flux homeostasis has been discovered in mouse oocytes, where inhibiting a wide range of energy consuming processes has no effect on the global oxygen consumption rate, despite significantly impacting the metabolic state of the cell [40]. This flux homeostasis implies the coupling of process-specific fluxes inside the cell and an unknown mechanism of flux partitioning that keeps the total flux constant.
6.2 Using nonequilibrium physics to estimate energetic costs
An alternative to process activity modulation experiments is to use tools from nonequilibrium physics to estimate energetic costs, or derive limits on costs, using experimentally observable quantities. All irreversible processes consume energy, and nonequilibrium thermodynamics and information theory have been used to place bounds on the associated dissipation [107, 108, 109]. Such approaches have also led to proposals for energy-speed-accuracy tradeoffs in diverse biological systems, from single molecular motors to chemotactic bacteria to developing embryos [30, 110, 111, 112]. While a comprehensive treatment of the active field of nonequilibrium thermodynamics is beyond the scope of this review and has been provided elsewhere [113], we highlight the Harada-Sasa equality, which connects violation of the fluctuation-response relation to the extent of energy dissipation [114]. Notably, the calculations required for determining energy dissipation depend solely on experimentally accessible quantities, such as particle trajectories observed through microscopy and cellular rheology measurements. Since only a limited number of degrees of freedom can be experimentally measured, application of the Harada-Sasa equality provides a lower bound on the energetic cost of the underlying process. The predictions of the Harada-Sasa relation have been validated in the case of a particle in an optical trap [115]. This equality has also been applied to a number of biologically relevant systems, including molecular motors [116] and mechanical dissipation inside living cells [117, 118]. For example, this approach was used to determine that the swimming of Chlamydomonas reinhardtii had a dissipation rate of 0.1 fW [119]. Interestingly, this is significantly less than the 60 fW measured by Chen et al. [103] through monitoring ATP consumption of C. reinhardtii flagella in vitro. Generalizations of the Harada-Sasa equality have been applied to study free energy dissipation and entropy production in a wider variety of systems, including active matter and nonequilibrium biochemical networks [120, 121, 122, 123, 124, 125].
The application of general nonequilibrium relationships, such as the Harada-Sasa equality, is a powerful and elegant approach for studying energy dissipation, but does not leverage prior knowledge about the system of interest. An alternative approach is to develop and test mechanistic, physics-based models for specific systems. For example, a circuit model of the retinal neuron enabled conversion of membrane potential and conductance measurements into energy consumption rates [104]. In another study, Stokes’ law was used to estimate the energetic cost of swimming in single-celled organisms, which when compared to the operating cost of flagella revealed that the efficiency of conversion of chemical energy to swimming power was 0.7% [126].
7 Open questions
Despite detailed knowledge of the structure of metabolic networks and the biochemistry of enzymes, relatively little is known about cellular energy expenditures. What are the energetic costs of different cellular processes? How are energy expenditures regulated? Are energy fluxes buffered, and if so, how? How and why do perturbations of energy metabolism lead to different cell biological defects under different circumstances? How do energetic constraints impact cell physiology and the evolution of cellular features? Answering these questions will inform our understanding of bioenergetics, cell biology, and the nonequilibrium physics of living systems.
Coarse-grained modeling [40, 127, 128, 111, 129] may help provide a quantitative description of the mechanisms coupling flux through energy-producing and -consuming pathways. Ultimately, it would be desirable to link such coarse-grained descriptions to the underlying behaviors of the constituent molecular machines, such as respiratory complexes and ATP synthase [130, 131] to bridge structure, function and physiology across scales.
The flux balance framework presented in this review, culminating in Eq. 13, provides a quantitative method to measure energetic costs of cellular processes by studying changes in ATP fluxes upon modulation of process activity. The dynamics of global energetic fluxes such as oxygen consumption rate and heat flux have been measured in many biological contexts, including microbial adaptation, organ function, and embryo development [132, 133, 134, 135, 136, 137, 138, 139, 140, 141, 142, 100, 31, 30, 143]. However, the contributions of specific energy-consuming processes such as biosynthesis, ion pumping, and cytoskeletal remodeling to changes in global fluxes remain unclear. Systematic study of bioenergetic fluxes and their coupling will be required to measure the costs of cell biological processes.
DISCLOSURE STATEMENT
The authors are not aware of any affiliations, memberships, funding, or financial holdings that might be perceived as affecting the objectivity of this review.
ACKNOWLEDGMENTS
We thank Yong Hyun Song, Peter Foster, and Piyush Nanda for discussions and comments. This work was supported by National Science Foundation awards PHY-2013874 and MCB-2052305 to D.J.N.
References
- [1] Xingbo Yang et al. “Physical bioenergetics: Energy fluxes, budgets, and constraints in cells” In Proceedings of the National Academy of Sciences 118.26 National Acad Sciences, 2021
- [2] Michael Lynch and Georgi K Marinov “The bioenergetic costs of a gene” In Proceedings of the National Academy of Sciences 112.51 National Acad Sciences, 2015, pp. 15690–15695
- [3] WW Forrest and DJ Walker “The generation and utilization of energy during growth” In Advances in microbial physiology 5 Elsevier, 1971, pp. 213–274
- [4] AH Stouthamer “A theoretical study on the amount of ATP required for synthesis of microbial cell material” In Antonie van Leeuwenhoek 39.1 Springer, 1973, pp. 545–565
- [5] JC Waterlow and DJ Millward “Energy cost of turnover of protein and other cellular constituents” In Energy transformations in cells and organisms Georg Thieme Verlag Stuttgart, 1989, pp. 277–282
- [6] Wolfgang Wieser and Gerhard Krumschnabel “Hierarchies of ATP-consuming processes: direct compared with indirect measurements, and comparative aspects” In Biochemical Journal 355.2 Portland Press Ltd., 2001, pp. 389–395
- [7] RW Smith and DF Houlihan “Protein synthesis and oxygen consumption in fish cells” In Journal of Comparative Physiology B 165.2 Springer, 1995, pp. 93–101
- [8] Frank Buttgereit and Martin D Brand “A hierarchy of ATP-consuming processes in mammalian cells” In Biochemical Journal 312.1 Portland Press Ltd., 1995, pp. 163–167
- [9] BioRender “Created with BioRender.com.” In Created with BioRender.com, 2022 URL: https://biorender.com/
- [10] TR Brown, K Ugurbil and RG Shulman “31P nuclear magnetic resonance measurements of ATPase kinetics in aerobic Escherichia coli cells” In Proceedings of the National Academy of Sciences 74.12 National Acad Sciences, 1977, pp. 5551–5553
- [11] I M Fuente et al. “On the Dynamics of the Adenylate Energy System: Homeorhesis vs Homeostasis” In PLoS ONE 9.10, 2014, pp. e108676
- [12] Junyoung O Park et al. “Metabolite concentrations, fluxes and free energies imply efficient enzyme usage” In Nature chemical biology 12.7 Nature Publishing Group, 2016, pp. 482–489
- [13] Bruce Alberts “Molecular biology of the cell” Garland Science, 2008
- [14] Oliver Frick and Christoph Wittmann “Characterization of the metabolic shift between oxidative and fermentative growth in Saccharomyces cerevisiae by comparative 13 C flux analysis” In Microbial cell factories 4.1 BioMed Central, 2005, pp. 1–16
- [15] Yoichiro Mitsuishi et al. “Nrf2 redirects glucose and glutamine into anabolic pathways in metabolic reprogramming” In Cancer cell 22.1 Elsevier, 2012, pp. 66–79
- [16] Dan G Fraenkel “Yeast intermediary metabolism” Cold Spring Harbor Laboratory Press, 2011
- [17] Jack G Salway “Metabolism at a Glance” John Wiley & Sons, 2016
- [18] Peter C Hinkle “P/O ratios of mitochondrial oxidative phosphorylation” In Biochimica et Biophysica Acta (BBA)-Bioenergetics 1706.1-2 Elsevier, 2005, pp. 1–11
- [19] Peter C. Hinkle, M. Kumar, Andrea Resetar and David L. Harris “Mechanistic stoichiometry of mitochondrial oxidative phosphorylation” In Biochemistry 30.14, 1991, pp. 3576–3582
- [20] M.. Brand “The stoichiometry of proton pumping and ATP synthesis in mitochondria” In Biochemist 16, 1995, pp. 20–24
- [21] Shona A Mookerjee, Akos A Gerencser, David G Nicholls and Martin D Brand “Quantifying intracellular rates of glycolytic and oxidative ATP production and consumption using extracellular flux measurements” In Journal of Biological Chemistry 292.17 ASBMB, 2017, pp. 7189–7207
- [22] Inmaculada Martinez-Reyes and Navdeep S Chandel “Mitochondrial TCA cycle metabolites control physiology and disease” In Nature communications 11.1 Nature Publishing Group, 2020, pp. 1–11
- [23] Fabian V Filipp et al. “Glutamine-fueled mitochondrial metabolism is decoupled from glycolysis in melanoma” In Pigment cell & melanoma research 25.6 Wiley Online Library, 2012, pp. 732–739
- [24] David A Ferrick, Andy Neilson and Craig Beeson “Advances in measuring cellular bioenergetics using extracellular flux” In Drug discovery today 13.5-6 Elsevier, 2008, pp. 268–274
- [25] W.M. Thornton “XV. The relation of oxygen to the heat of combustion of organic compounds” In The London, Edinburgh, and Dublin Philosophical Magazine and Journal of Science 33.194, 1917, pp. 196–203 DOI: 10.1080/14786440208635627
- [26] Lee D. Hansen et al. “Use of calorespirometric ratios, heat per CO2 and heat per O2, to quantify metabolic paths and energetics of growing cells” In Thermochimica Acta 422.1, Energetics of Adaptation and Development: from molecular mechanisms to clinical practice, 2004, pp. 55–61 DOI: 10.1016/j.tca.2004.05.033
- [27] R.. Kemp “Calorimetric studies of heat flux in animal cells” In Thermochimica Acta 193, 1991, pp. 253–267 DOI: 10.1016/0040-6031(91)80187-N
- [28] Johannes Lerchner et al. “Direct determination of anaerobe contributions to the energy metabolism of Trypanosoma cruzi by chip calorimetry” In Analytical and Bioanalytical Chemistry 411.17, 2019, pp. 3763–3768 DOI: 10.1007/s00216-019-01882-3
- [29] Edwin H. Battley “On the enthalpy of formation of Escherichia coli K-12 cells” In Biotechnology and Bioengineering 39.1, 1992, pp. 5–12 DOI: 10.1002/bit.260390103
- [30] Yonghyun Song et al. “Energy budget of Drosophila embryogenesis” In Current Biology 29.12, 2019, pp. R566–R567 DOI: 10.1016/j.cub.2019.05.025
- [31] Jonathan Rodenfels et al. “Contribution of increasing plasma membrane to the energetic cost of early zebrafish embryogenesis” In Molecular Biology of the Cell, 2020 DOI: 10.1091/mbc.E19-09-0529
- [32] Sebastian Buchenberg, Florian Sittel and Gerhard Stock “Time-resolved observation of protein allosteric communication” In Proceedings of the National Academy of Sciences 114.33, 2017 DOI: 10.1073/pnas.1707694114
- [33] Tobias Maier et al. “Quantification of mRNA and protein and integration with protein turnover in a bacterium” In Molecular Systems Biology 7.1, 2011, pp. 511 DOI: 10.1038/msb.2011.38
- [34] Daran Kresnowati “When transcriptome meets metabolome: fast cellular responses of yeast to sudden relief of glucose limitation” In Molecular Systems Biology 2.1, 2006, pp. 49 DOI: 10.1038/msb4100083
- [35] Ajit S Divakaruni and Martin D Brand “The regulation and physiology of mitochondrial proton leak” In Physiology 26.3 American Physiological Society Bethesda, MD, 2011, pp. 192–205
- [36] RJ Ellis and IR MacDonald “Specificity of cycloheximide in higher plant systems” In Plant Physiology 46.2 American Society of Plant Biologists, 1970, pp. 227–232
- [37] Guy C Brown “Control of respiration and ATP synthesis in mammalian mitochondria and cells” In Biochemical Journal 284.1 Portland Press Ltd., 1992, pp. 1–13
- [38] NJ Jacobs and JM Jacobs “Nitrate, fumarate, and oxygen as electron acceptors for a late step in microbial heme synthesis” In Biochimica et Biophysica Acta (BBA)-Bioenergetics 449.1 Elsevier, 1976, pp. 1–9
- [39] Jessica B Spinelli et al. “Fumarate is a terminal electron acceptor in the mammalian electron transport chain” In Science 374.6572 American Association for the Advancement of Science, 2021, pp. 1227–1237
- [40] Xingbo Yang, Gloria Ha and Dan Needleman “A coarse-grained NADH redox model enables inference of subcellular metabolic fluxes from fluorescence lifetime imaging” In Elife 10 eLife Sciences Publications Limited, 2021, pp. e73808
- [41] John F Allen “Photosynthesis of ATP—electrons, proton pumps, rotors, and poise” In Cell 110.3 Elsevier, 2002, pp. 273–276
- [42] Kimberly L James et al. “Pyrophosphate-dependent ATP formation from acetyl coenzyme A in Syntrophus aciditrophicus, a new twist on ATP formation” In MBio 7.4 Am Soc Microbiol, 2016, pp. e01208–16
- [43] Kai Connie Wu, Julia Yue Cui and Curtis D Klaassen “Beneficial role of Nrf2 in regulating NADPH generation and consumption” In Toxicological Sciences 123.2 Oxford University Press, 2011, pp. 590–600
- [44] Richard C Law et al. “Integrative metabolic flux analysis reveals an indispensable dimension of phenotypes” In Current Opinion in Biotechnology 75 Elsevier, 2022, pp. 102701
- [45] Martin D Brand and David G Nicholls “Assessing mitochondrial dysfunction in cells” In Biochemical Journal 435.2 Portland Press Ltd., 2011, pp. 297–312
- [46] Franchesca D Houghton, Jeremy G Thompson, Christopher J Kennedy and Henry J Leese “Oxygen consumption and energy metabolism of the early mouse embryo” In Molecular Reproduction and Development: Incorporating Gamete Research 44.4 Wiley Online Library, 1996, pp. 476–485
- [47] Erich Gnaiger, Gabriela Méndez and Steven C Hand “High phosphorylation efficiency and depression of uncoupled respiration in mitochondria under hypoxia” In Proceedings of the National Academy of Sciences 97.20 National Acad Sciences, 2000, pp. 11080–11085
- [48] AS Lopes et al. “Respiration rates of individual bovine in vitro-produced embryos measured with a novel, non-invasive and highly sensitive microsensor system” In Reproduction 130.5 Society for ReproductionFertility, 2005, pp. 669–679
- [49] Wenyun Lu et al. “Metabolite measurement: pitfalls to avoid and practices to follow” In Annual review of biochemistry 86 Annual Reviews, 2017, pp. 277–304
- [50] Peter S Allen, Richard B Thompson and Alan H Wilman “Metabolite-specific NMR spectroscopy in vivo” In NMR in Biomedicine: An International Journal Devoted to the Development and Application of Magnetic Resonance In Vivo 10.8 Wiley Online Library, 1997, pp. 435–444
- [51] Sheng Hui et al. “Glucose feeds the TCA cycle via circulating lactate” In Nature 551.7678 Nature Publishing Group, 2017, pp. 115–118
- [52] Cameron A Schmidt, Kelsey H Fisher-Wellman and P Darrell Neufer “From OCR and ECAR to energy: Perspectives on the design and interpretation of bioenergetics studies” In Journal of Biological Chemistry 297.4 ASBMB, 2021
- [53] Laura E Bagamery, Quincey A Justman, Ethan C Garner and Andrew W Murray “A putative bet-hedging strategy buffers budding yeast against environmental instability” In Current Biology 30.23 Elsevier, 2020, pp. 4563–4578
- [54] Louis-Philippe Bernier et al. “Microglial metabolic flexibility supports immune surveillance of the brain parenchyma” In Nature communications 11.1 Nature Publishing Group, 2020, pp. 1–17
- [55] Nicole Paczia et al. “Extensive exometabolome analysis reveals extended overflow metabolism in various microorganisms” In Microbial cell factories 11.1 Springer, 2012, pp. 1–14
- [56] Carlos Ferreiro-Vera et al. “Automated targeting analysis of eicosanoid inflammation biomarkers in human serum and in the exometabolome of stem cells by SPE–LC–MS/MS” In Analytical and bioanalytical chemistry 399.3 Springer, 2011, pp. 1093–1103
- [57] Timo Birkenstock et al. “Exometabolome analysis identifies pyruvate dehydrogenase as a target for the antibiotic triphenylbismuthdichloride in multiresistant bacterial pathogens” In Journal of Biological Chemistry 287.4 ASBMB, 2012, pp. 2887–2895
- [58] Iola F Duarte, Silvia O Diaz and Ana M Gil “NMR metabolomics of human blood and urine in disease research” In Journal of Pharmaceutical and Biomedical Analysis 93 Elsevier, 2014, pp. 17–26
- [59] K Koga and I Miura “A measurement of cerebral glucose uptake rate by 31P MRS” In Biochemical and biophysical research communications 157.3 Elsevier, 1988, pp. 1258–1263
- [60] Kevin M Brindle “Phosphorous-31 NMR magnetization-transfer measurements of flux between inorganic phosphate and adenosine 5’-triphosphate in yeast cells genetically modified to overproduce phosphoglycerate kinase” In Biochemistry 27.16 ACS Publications, 1988, pp. 6187–6196
- [61] Nicola Zamboni “13C metabolic flux analysis in complex systems” In Current opinion in biotechnology 22.1 Elsevier, 2011, pp. 103–108
- [62] Maciek R Antoniewicz “Methods and advances in metabolic flux analysis: a mini-review” In Journal of Industrial Microbiology and Biotechnology 42.3 Oxford University Press, 2015, pp. 317–325
- [63] Robert W Leighty and Maciek R Antoniewicz “Dynamic metabolic flux analysis (DMFA): a framework for determining fluxes at metabolic non-steady state” In Metabolic engineering 13.6 Elsevier, 2011, pp. 745–755
- [64] Yi Ern Cheah and Jamey D Young “Isotopically nonstationary metabolic flux analysis (INST-MFA): putting theory into practice” In Current Opinion in Biotechnology 54 Elsevier, 2018, pp. 80–87
- [65] Jie Yuan, Bryson D Bennett and Joshua D Rabinowitz “Kinetic flux profiling for quantitation of cellular metabolic fluxes” In Nature protocols 3.8 Nature Publishing Group, 2008, pp. 1328–1340
- [66] Luyuan Zhang et al. “Spectral tracing of deuterium for imaging glucose metabolism” In Nature biomedical engineering 3.5 Nature Publishing Group, 2019, pp. 402–413
- [67] Jun Shen et al. “Determination of the rate of the glutamate/glutamine cycle in the human brain by in vivo 13C NMR” In Proceedings of the National Academy of Sciences 96.14 National Acad Sciences, 1999, pp. 8235–8240
- [68] JR Alger, JA Den Hollander and RG Shulman “In vivo phosphorus-31 NMR saturation transfer studies of ATPase kinetics in Saccharomyces cerevisiae” In Biochemistry 21.12 ACS Publications, 1982, pp. 2957–2963
- [69] Dominique Freeman, Sylvia Bartlett, George Radda and Brian Ross “Energetics of sodium transport in the kidney: saturation transfer 31P-NMR” In Biochimica et Biophysica Acta (BBA)-Molecular Cell Research 762.2 Elsevier, 1983, pp. 325–336
- [70] PM Matthews, JL Bland, DG Gadian and GK Radda “The steady-state rate of ATP synthesis in the perfused rat heart measured by 31P NMR saturation transfer” In Biochemical and biophysical research communications 103.3 Elsevier, 1981, pp. 1052–1059
- [71] Eliane Fischer and Uwe Sauer “Large-scale in vivo flux analysis shows rigidity and suboptimal performance of Bacillus subtilis metabolism” In Nature genetics 37.6 Nature Publishing Group, 2005, pp. 636–640
- [72] Eliane Fischer and Uwe Sauer “Metabolic flux profiling of Escherichia coli mutants in central carbon metabolism using GC-MS” In European Journal of Biochemistry 270.5 Wiley Online Library, 2003, pp. 880–891
- [73] Wouter A Van Winden et al. “Metabolic-flux analysis of Saccharomyces cerevisiae CEN. PK113-7D based on mass isotopomer measurements of 13C-labeled primary metabolites” In FEMS yeast research 5.6-7 Blackwell Publishing Ltd Oxford, UK, 2005, pp. 559–568
- [74] Fanghao Hu et al. “Vibrational imaging of glucose uptake activity in live cells and tissues by stimulated Raman scattering” In Angewandte Chemie International Edition 54.34 Wiley Online Library, 2015, pp. 9821–9825
- [75] Weili Hong et al. “Antibiotic susceptibility determination within one cell cycle at single-bacterium level by stimulated Raman metabolic imaging” In Analytical chemistry 90.6 ACS Publications, 2018, pp. 3737–3743
- [76] Daniel A Beard “A biophysical model of the mitochondrial respiratory system and oxidative phosphorylation” In PLoS computational biology 1.4 Public Library of Science San Francisco, USA, 2005, pp. e36
- [77] Bernard Korzeniewski and Jerzy A Zoladz “A model of oxidative phosphorylation in mammalian skeletal muscle” In Biophysical chemistry 92.1-2 Elsevier, 2001, pp. 17–34
- [78] Qusheng Jin and Craig M Bethke “Kinetics of electron transfer through the respiratory chain” In Biophysical Journal 83.4 Elsevier, 2002, pp. 1797–1808
- [79] Ivan Chang et al. “Modeling of mitochondria bioenergetics using a composable chemiosmotic energy transduction rate law: theory and experimental validation” In PLoS One 6.9 Public Library of Science San Francisco, USA, 2011, pp. e14820
- [80] Hiromi Imamura et al. “Visualization of ATP levels inside single living cells with fluorescence resonance energy transfer-based genetically encoded indicators” In Proceedings of the National Academy of Sciences 106.37 National Acad Sciences, 2009, pp. 15651–15656
- [81] Jim Berg, Yin Pun Hung and Gary Yellen “A genetically encoded fluorescent reporter of ATP: ADP ratio” In Nature methods 6.2 Nature Publishing Group, 2009, pp. 161–166
- [82] Seth W Perry et al. “Mitochondrial membrane potential probes and the proton gradient: a practical usage guide” In Biotechniques 50.2 Future Science, 2011, pp. 98–115
- [83] Yin Pun Hung, John G Albeck, Mathew Tantama and Gary Yellen “Imaging cytosolic NADH-NAD+ redox state with a genetically encoded fluorescent biosensor” In Cell metabolism 14.4 Elsevier, 2011, pp. 545–554
- [84] Alejandro San Martin et al. “Imaging mitochondrial flux in single cells with a FRET sensor for pyruvate” In PloS one 9.1 Public Library of Science San Francisco, USA, 2014, pp. e85780
- [85] Alejandro San Martin et al. “A genetically encoded FRET lactate sensor and its use to detect the Warburg effect in single cancer cells” In PloS one 8.2 Public Library of Science San Francisco, USA, 2013, pp. e57712
- [86] Carlos Manlio Diaz-Garcia et al. “Quantitative in vivo imaging of neuronal glucose concentrations with a genetically encoded fluorescence lifetime sensor” In Journal of neuroscience research 97.8 Wiley Online Library, 2019, pp. 946–960
- [87] Thomas S Blacker et al. “Separating NADH and NADPH fluorescence in live cells and tissues using FLIM” In Nature communications 5.1 Nature Publishing Group, 2014, pp. 1–9
- [88] Graeme F Mason, Kevin L Behar, Douglas L Rothman and Robert G Shulman “NMR determination of intracerebral glucose concentration and transport kinetics in rat brain” In Journal of Cerebral Blood Flow & Metabolism 12.3 SAGE Publications Sage UK: London, England, 1992, pp. 448–455
- [89] Seungeun Oh et al. “In situ measurement of absolute concentrations by Normalized Raman Imaging” In BioRxiv Cold Spring Harbor Laboratory, 2019, pp. 629543
- [90] Jinhye Bae et al. “A Micromachined Picocalorimeter Sensor for Liquid Samples with Application to Chemical Reactions and Biochemistry” In Advanced Science 8.5, 2021, pp. 2003415 DOI: 10.1002/advs.202003415
- [91] Sahngki Hong et al. “Sub-nanowatt microfluidic single-cell calorimetry” In Nature Communications 11.1, 2020, pp. 2982 DOI: 10.1038/s41467-020-16697-5
- [92] Sunghoon Hur et al. “Sub-nanowatt resolution direct calorimetry for probing real-time metabolic activity of individual C. elegans worms” In Nature Communications 11.1, 2020, pp. 2983 DOI: 10.1038/s41467-020-16690-y
- [93] Olivier Braissant, Dieter Wirz, Beat Göpfert and Alma U. Daniels “Use of isothermal microcalorimetry to monitor microbial activities” In FEMS Microbiology Letters 303.1, 2010, pp. 1–8 DOI: 10.1111/j.1574-6968.2009.01819.x
- [94] Monika Astasov-Frauenhoffer et al. “Isothermal microcalorimetry provides new insights into biofilm variability and dynamics” In FEMS Microbiology Letters 337.1, 2012, pp. 31–37 DOI: 10.1111/1574-6968.12007
- [95] Stéphane Corvec et al. “Characterization of medical relevant anaerobic microorganisms by isothermal microcalorimetry” In Anaerobe 66, 2020, pp. 102282 DOI: 10.1016/j.anaerobe.2020.102282
- [96] Michael I. Recht et al. “Enthalpy array analysis of enzymatic and binding reactions” In Analytical Biochemistry 377.1, 2008, pp. 33–39 DOI: 10.1016/j.ab.2008.03.007
- [97] Erik A. Johannessen et al. “Micromachined Nanocalorimetric Sensor for Ultra-Low-Volume Cell-Based Assays” In Analytical Chemistry 74.9, 2002, pp. 2190–2197 DOI: 10.1021/ac011028b
- [98] Frida Mariana Morais, Friederike Buchholz and Thomas Maskow “Chip Calorimetry for Evaluation of Biofilm Treatment with Biocides, Antibiotics, and Biological Agents” In Microbial Biofilms: Methods and Protocols, Methods in Molecular Biology New York, NY: Springer, 2014, pp. 267–275 DOI: 10.1007/978-1-4939-0467-9˙19
- [99] R Whittam “The dependence of the respiration of brain cortex on active cation transport” In Biochemical Journal 82.1 Portland Press Ltd, 1962, pp. 205
- [100] Jonathan Rodenfels, Karla M. Neugebauer and Jonathon Howard “Heat Oscillations Driven by the Embryonic Cell Cycle Reveal the Energetic Costs of Signaling” In Developmental Cell 48.5, 2019, pp. 646–658.e6 DOI: 10.1016/j.devcel.2018.12.024
- [101] Elisabeth Engl and David Attwell “Non-signalling energy use in the brain” In The Journal of physiology 593.16 Wiley Online Library, 2015, pp. 3417–3429
- [102] Barbara W Bernstein and James R Bamburg “Actin-ATP hydrolysis is a major energy drain for neurons” In Journal of Neuroscience 23.1 Soc Neuroscience, 2003, pp. 1–6
- [103] Daniel T.N. Chen et al. “ATP Consumption of Eukaryotic Flagella Measured at a Single-Cell Level” In Biophysical Journal 109.12, 2015, pp. 2562–2573 DOI: 10.1016/j.bpj.2015.11.003
- [104] Simon B. Laughlin, Rob R. Ruyter van Steveninck and John C. Anderson “The metabolic cost of neural information” In Nature Neuroscience 1.1, 1998, pp. 36–41 DOI: 10.1038/236
- [105] Gita Mahmoudabadi, Ron Milo and Rob Phillips “Energetic cost of building a virus” In Proceedings of the National Academy of Sciences 114.22, 2017 DOI: 10.1073/pnas.1701670114
- [106] Michael Lynch and Georgi K. Marinov “The bioenergetic costs of a gene” In Proceedings of the National Academy of Sciences 112.51, 2015, pp. 15690–15695 DOI: 10.1073/pnas.1514974112
- [107] Junang Li, Jordan M Horowitz, Todd R Gingrich and Nikta Fakhri “Quantifying dissipation using fluctuating currents” In Nature communications 10.1 Nature Publishing Group, 2019, pp. 1–9
- [108] Christopher Battle et al. “Broken detailed balance at mesoscopic scales in active biological systems” In Science 352.6285 American Association for the Advancement of Science, 2016, pp. 604–607
- [109] Tzer Han Tan et al. “Scale-dependent irreversibility in living matter” In arXiv preprint arXiv:2107.05701, 2021
- [110] Yonghyun Song and Changbong Hyeon “Cost-precision trade-off relation determines the optimal morphogen gradient for accurate biological pattern formation” In eLife 10, 2021, pp. e70034
- [111] G. Lan, P. Sartori and S. al. Neumann “The energy–speed–accuracy trade-off in sensory adaptation” In Nature Phys 8, 2021, pp. 422–428
- [112] J.M. Horowitz and T.R. Gingrich “Thermodynamic uncertainty relations constrain non-equilibrium fluctuations” In Nat. Phys 16, 2020, pp. 15–20
- [113] Xiaona Fang, Karsten Kruse, Ting Lu and Jin Wang “Nonequilibrium physics in biology” In Reviews of Modern Physics 91.4, 2019, pp. 045004 DOI: 10.1103/RevModPhys.91.045004
- [114] Takahiro Harada and Shin-ichi Sasa “Equality Connecting Energy Dissipation with a Violation of the Fluctuation-Response Relation” In Physical Review Letters 95.13, 2005, pp. 130602 DOI: 10.1103/PhysRevLett.95.130602
- [115] Shoichi Toyabe et al. “Experimental test of a new equality: Measuring heat dissipation in an optically driven colloidal system” In Physical Review E 75.1, 2007, pp. 011122 DOI: 10.1103/PhysRevE.75.011122
- [116] Takahiro Harada and Shin-ichi Sasa “Fluctuations, responses and energetics of molecular motors” In Mathematical Biosciences 207.2, 2007, pp. 365–386 DOI: 10.1016/j.mbs.2006.11.003
- [117] E Fodor et al. “Nonequilibrium dissipation in living oocytes” In EPL (Europhysics Letters) 116.3, 2016, pp. 30008 DOI: 10.1209/0295-5075/116/30008
- [118] P. Bohec et al. “Distribution of active forces in the cell cortex” In Soft Matter 15.35, 2019, pp. 6952–6966 DOI: 10.1039/C9SM00441F
- [119] Corbyn Jones et al. “Stochastic force dynamics of the model microswimmer C h l a m y d o m o n a s r e i n h a r d t i i : Active forces and energetics” In Physical Review E 103.3, 2021, pp. 032403 DOI: 10.1103/PhysRevE.103.032403
- [120] Cesare Nardini et al. “Entropy Production in Field Theories without Time-Reversal Symmetry: Quantifying the Non-Equilibrium Character of Active Matter” In Physical Review X 7.2, 2017, pp. 021007 DOI: 10.1103/PhysRevX.7.021007
- [121] S. Muy, A. Kundu and D. Lacoste “Non-invasive estimation of dissipation from non-equilibrium fluctuations in chemical reactions” In The Journal of Chemical Physics 139.12, 2013, pp. 124109 DOI: 10.1063/1.4821760
- [122] Andreas Dechant and Shin-ichi Sasa “Improving Thermodynamic Bounds Using Correlations” In Physical Review X 11.4, 2021, pp. 041061 DOI: 10.1103/PhysRevX.11.041061
- [123] Todd R. Gingrich, Grant M. Rotskoff and Jordan M. Horowitz “Inferring dissipation from current fluctuations” In Journal of Physics A: Mathematical and Theoretical 50.18, 2017, pp. 184004 DOI: 10.1088/1751-8121/aa672f
- [124] Andre C. Barato and Udo Seifert “Thermodynamic Uncertainty Relation for Biomolecular Processes” In Physical Review Letters 114.15, 2015, pp. 158101 DOI: 10.1103/PhysRevLett.114.158101
- [125] Jin Wang “Landscape and flux theory of non-equilibrium dynamical systems with application to biology” In Advances in Physics 64.1, 2015, pp. 1–137 DOI: 10.1080/00018732.2015.1037068
- [126] Paul E Schavemaker and Michael Lynch “Flagellar energy costs across the Tree of Life” In bioRxiv Cold Spring Harbor Laboratory, 2022
- [127] Markus Basan et al. “Overflow metabolism in Escherichia coli results from efficient proteome allocation” In Nature 528.7580 Nature Publishing Group, 2015, pp. 99–104
- [128] Bogi Trickovic and Michael Lynch “Resource allocation to cell envelopes and the scaling of bacterial growth rate” In bioRxiv, 2022 DOI: 2022.01.07.475415
- [129] Bastian Niebel, Simeon Leupold and Matthias Heinemann “An upper limit on Gibbs energy dissipation governs cellular metabolism” In Nature Metabolism 1.1 Nature Publishing Group, 2019, pp. 125–132
- [130] Abhishek Singharoy et al. “Atoms to phenotypes: molecular design principles of cellular energy metabolism” In Cell 179.5 Elsevier, 2019, pp. 1098–1111
- [131] James L Martin et al. “Elastic coupling power stroke mechanism of the F1-ATPase molecular motor” In Proceedings of the National Academy of Sciences 115.22 National Acad Sciences, 2018, pp. 5750–5755
- [132] R. Brettel, I. Lamprecht and B. Schaarschmidt “Microcalorimetric investigations of the growth of yeast. Energy balance of batch and continuous cultures.” In Thermochimica Acta 49.1, 1981, pp. 53–61 DOI: 10.1016/0040-6031(81)85143-X
- [133] Keshav Kooragayala et al. “Quantification of Oxygen Consumption in Retina Ex Vivo Demonstrates Limited Reserve Capacity of Photoreceptor Mitochondria” In Investigative Ophthalmology & Visual Science 56.13, 2015, pp. 8428–8436 DOI: 10.1167/iovs.15-17901
- [134] Kathryn E. Neville et al. “A novel ex vivo method for measuring whole brain metabolism in model systems” In Journal of Neuroscience Methods 296, 2018, pp. 32–43 DOI: 10.1016/j.jneumeth.2017.12.020
- [135] Mandy Koopman et al. “A screening-based platform for the assessment of cellular respiration in Caenorhabditis elegans” In Nature Protocols 11.10, 2016, pp. 1798–1816 DOI: 10.1038/nprot.2016.106
- [136] J Astrup, P M Sorensen and H R Sorensen “Oxygen and glucose consumption related to Na+-K+ transport in canine brain.” In Stroke 12.6, 1981, pp. 726–730 DOI: 10.1161/01.STR.12.6.726
- [137] Elisabeth Engl, Renaud Jolivet, Catherine N Hall and David Attwell “Non-signalling energy use in the developing rat brain” In Journal of Cerebral Blood Flow & Metabolism 37.3, 2017, pp. 951–966 DOI: 10.1177/0271678X16648710
- [138] Alberto Robador, Jan P. Amend and Steven E. Finkel “Nanocalorimetry Reveals the Growth Dynamics of Escherichia coli Cells Undergoing Adaptive Evolution during Long-Term Stationary Phase” In Applied and Environmental Microbiology 85.15, 2019, pp. e00968–19\bibrangessep/aem/85/15/AEM.00968–19.atom DOI: 10.1128/AEM.00968-19
- [139] Mirko Peitzsch, Bärbel Kiesel, Hauke Harms and Thomas Maskow “Real time analysis of Escherichia coli biofilms using calorimetry” In Chemical Engineering and Processing: Process Intensification 47.6, 2008, pp. 1000–1006 DOI: 10.1016/j.cep.2007.02.029
- [140] Maximiliano Tourmente, Pilar Villar-Moya, Eduardo Rial and Eduardo R.. Roldan “Differences in ATP Generation Via Glycolysis and Oxidative Phosphorylation and Relationships with Sperm Motility in Mouse Species *” In Journal of Biological Chemistry 290.33, 2015, pp. 20613–20626 DOI: 10.1074/jbc.M115.664813
- [141] Maurine W. Dietz, Meep Kampen, Marcel J.. Griensven and Sijmen Mourik “Daily Energy Budgets of Avian Embryos: The Paradox of the Plateau Phase in Egg Metabolic Rate” In Physiological Zoology 71.2, 1998, pp. 147–156 DOI: 10.1086/515897
- [142] Yatsuhisa Nagano and Koji L Ode “Temperature-independent energy expenditure in early development of the African clawed frog Xenopus laevis” In Physical Biology 11.4, 2014, pp. 046008 DOI: 10.1088/1478-3975/11/4/046008
- [143] Suhrid Ghosh et al. “Developmental energetics: Energy expenditure, budgets and metabolism during animal embryogenesis” In Seminars in Cell & Developmental Biology, 2022 Elsevier