Thermal excitations within and among mesospins in artificial spin ice
Abstract
We provide experimental and numerical evidence for thermal excitations within and among magnetic mesospins, forming artificial spin ice structures. At low temperatures, a decrease in magnetization and increase in susceptibility is observed with increasing temperature, interpreted as an onset of thermal fluctuations of the magnetic texture within the mesospins. At elevated temperatures a pronounced susceptibility peak is observed, related to thermally induced flipping of the mesospins and a collapse of the remanent state. The fluctuations, while occurring at distinct length- and energy-scales, are shown to be tunable by the interaction strength of the mesospins.
Mesoscopic spin systems, consisting of arrays of magnetostatically interacting ferromagnetic islands Wang et al. (2006), are well suited to study phase transitions Kapaklis et al. (2012); Anghinolfi et al. (2015); Sendetskyi et al. (2019); Levis et al. (2013), frustration Nisoli et al. (2013, 2017); Gilbert et al. (2014); Drisko et al. (2017); Morrison et al. (2013); Skjærvø et al. (2020), collective behavior Rougemaille and Canals (2019); Ewerlin et al. (2013); Jungfleisch et al. (2017) as well as avalanches Bingham et al. (2021). The mesospin building blocks are often regarded as artificial “atoms” without inner structure, where all the interactions, excitations and dynamics take place among and not within the mesospins. The use of mesospins allows for both magnetic imaging of individual elements Wang et al. (2006); Arnalds et al. (2012), as well as adjusting many of the relevant parameters at will, such as interaction strength and temperature onset of fluctuations Andersson et al. (2016); Pohlit et al. (2020). For example, previous investigations include exploration of ordering and dynamics of mesospins, forming 1D and 2D lattices Östman et al. (2018a); Arnalds et al. (2016, 2014); Skovdal et al. (2021).
Recent studies have begun to transcend this approach when including the effect of internal degrees of freedom (of the mesospin) on the order and ground state degeneracy of the arrangements Skovdal et al. (2021); Gliga et al. (2015); Slöetjes et al. (2021). For instance, internal vortex states in circular islands Shinjo (2000); Kläui et al. (2003) can impact the interaction between islands and the global magnetic order, auguring first order magnetic phase transitions and tricritical behavior Skovdal et al. (2022). This exotic behavior is a consequence of the interplay between effects that take place on vastly different length scales, yet on comparable energy levels. Elongated Ising-like islands that make up artificial spin ice (ASI) also exhibit dynamic and quasi-static internal degrees of freedom in the form of curved magnetization at the edges Slöetjes et al. (2021); Phatak et al. (2011). At low temperatures, these S- and C-shaped texture states may appear as static textures that break the vertex symmetry in ASI, but at higher temperatures, dynamic edge modes have been predicted Slöetjes et al. (2021), reducing the time averaged transverse magnetic moment within the islands to zero and restoring the vertex symmetry Gliga et al. (2015). Here we report on the interplay between the internal (within the mesospins) and external (among mesospins) excitations in ASI, and quantify their relative energy levels. We do this in both quasi-equilibrium and in out-of-equilibrium settings, using ac susceptibility and magnetization measurements respectively, comparing to results from stochastic micromagnetic simulations Leliaert et al. (2017).
To this end, two samples were studied, having different mesospin interaction energies, tuned utilizing interaction modifiers (to be refered to as mASI) in the form of circular islands placed in the center of the ASI vertices Östman et al. (2018b), while keeping the size and the distance between the Ising elements the same. Both samples were fabricated by post-patterning performed on a -doped Pd(Fe) thin film, using electron beam lithography. The film, grown by dc magnetron sputtering, consisted of 40 nm palladium and 1.7 monolayers of iron with a 2 nm Palladium capping layer and a 1.5 nm vanadium seed layer on top of a magnesium oxide (MgO (001)) substrate as described in Pärnaste et al. (2007). The Ising-like islands had a length of 450 nm and a width of 150 nm with a pitch of 660 nm in both samples. The circular interaction modifiers at the ASI vertex sites, have a diameter of 130 nm.
Magnetization and ac susceptibility data were collected using magneto-optical Kerr effect (MOKE) in a longitudinal configuration, using -polarized laser light with a wavelength of 660 nm. For the ac susceptibility measurements the field amplitude was chosen to be 0.02 mT and the frequency was varied between 1.1 and 3333 Hz. For the magnetization measurements the amplitude of the applied oscillatory field was 30 mT and the sweep frequency was 0.3 Hz. The samples were measured along both principal axes ([10] and [11], see insets of Fig. 2) in the temperature range of K. In addition to the experimental characterization, we explored the dynamic behavior with micromagnetic simulations, using MuMax3 Vansteenkiste et al. (2014). In these simulations, the temperature is emulated by a stochastic magnetic field as described by Leliaert et al. (2017). The micromagnetic constants used to describe the -doped Pd(Fe) material are a saturation magnetization of A/m and an exchange stiffness of J/m, while the damping constant is taken to be . The simulations are run for 16 different temperatures between 0 and 400 K, for time intervals of 50 ns per temperature.
The main observables from the magnetization measurements, are the remanent magnetization obtained from the hysteresis loops, , and the saturation magnetization, , evaluated at mT. The temperature dependence of the magnetisation of the ASI array is illustrated in Fig. 1. The remanent magnetization, , is affected by thermal excitations on both the intra- and inter-mesospin length-scales. Separation of these contributions can be achieved by realizing that the to a good approximation only depends on the intrinsic material properties, as a small applied field will easily quench all internal and external mesospin excitations, yet with a negligible impact on the temperature dependent material magnetization. The quantity is therefore taken as a measure of the contribution from the mesospins, which are thereby separated from the fluctuations at the atomic scale. Furthermore, the temperature at which approaches zero is an approximate measure of the ordering temperature, , of the material.
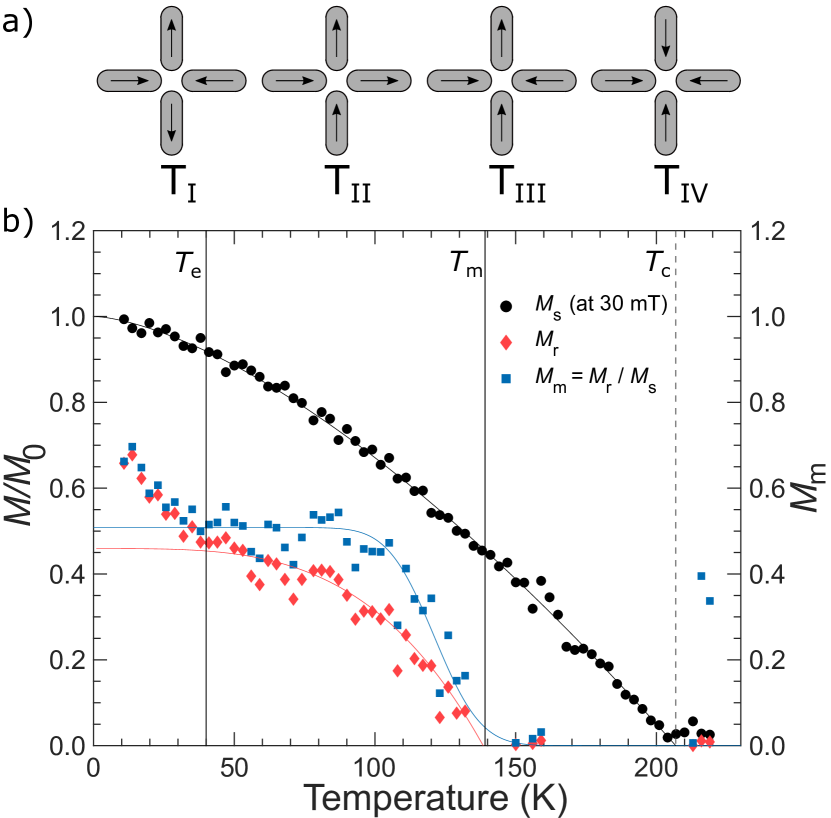
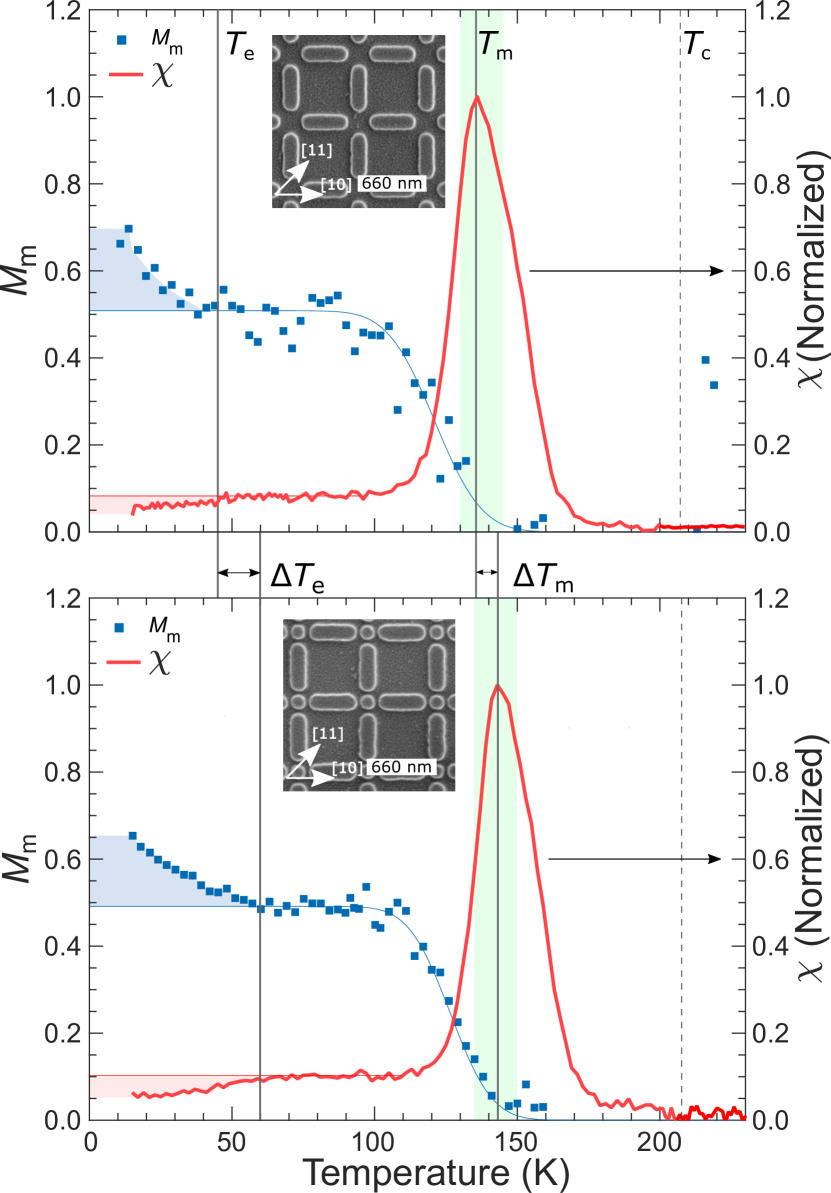
We proceed by comparing the results from the magnetization of the mesospins () and the magnetic susceptibility obtained for the ASI and mASI samples, as shown in Fig. 2. Starting form high temperatures, we notice no peak or other feature in the susceptibility data at of the material (marked by the dashed line). Instead, a peak appears at the temperature where approaches zero, which we label . Since the mesospins should carry a moment below , the fact that between and suggests that the magnetization vanishes as a consequence of fluctuations of the mesospins, with a characteristic time-scale shorter than that of the measurement Pohlit et al. (2020). The susceptibility peak is therefore related to mesospin fluctuations rather than to fluctuations at the atomic scale. Here, the value of is taken to be the temperature at which the average relaxation time is equal to the time window of the measurements.
Lowering the temperature further, we find a plateau between 45 and 100 K, in both the susceptibility and the magnetization curves. The height of this plateau is at for measurements along the [10]-direction and for the [11]-direction, as has been previously reported by Kapaklis et al. (2012). These values of agree with the expected value of an ASI lattice comprised of frozen Ising-like mesospins, with a zero net transverse magnetization in the islands. Turning to the susceptibility, the plateau means that some part of the system does respond to the applied ac field. Knowing that the mesospins are frozen at these temperatures with respect to magnetization flipping, the observed susceptibility must originate from internal magnetic excitations of the elements. We attribute this finite susceptibility to be related to dynamics of the magnetization texture at the mesospin edges, since the continuous -doped Pd(Fe) thin film exhibits zero susceptibility in this temperature regime (not shown here). Thus, the edges fluctuate at these temperatures, resulting in a zero time averaged transverse moment in the islands.
Turning our attention to the lowest temperatures measured, we find that begins to increase below K while the susceptibility decreases in the same temperature range ( K). An increase in beyond 0.5 requires the presence of an internal transverse magnetic component of the islands. Therefore, this temperature labeled , marks the onset of textures stabilizing that exhibit a non-zero time average magnetization in the direction of the applied field. This effect can therefore be understood as a consequence of a slow low-temperature relaxation of the edges, i.e. the edges remain static within the time-scale of the measurement. This interpretation is supported by the observed decrease in susceptibility with decreasing temperature.
It is important to mention that the susceptibility measurements probe equilibrium dynamics, while the magnetization measurements probe field-“dressed” metastable states. This gives rise to subtle differences in the results depending on which measurement protocol is used. Firstly, when measuring along [11], the initial state (after removing the field) is a uniform state of exclusively vertices, while measuring along [10] leads to a mixture of and vertices. As the vertex is a higher energy excitation than , we expect somewhat different relaxation depending on the orientation of the measurement, and there is no reason to choose the [10] magnetization data over the [11] for comparison. Secondly, the position of the susceptibility peak is frequency dependent as seen in Fig. 3 and reported by Pohlit et al. (2020), which implies that the position of as obtained from the magnetization measurements also depends on the sweep frequency. To verify that the observed equivalence of in the susceptibility and magnetization data (similar for ) is not purely coincidental, one would have to unify the time-scales of the different measurement techniques. This proves to be challenging as the amplitudes of the field sweeps also differ, and we therefore propose an alternative route to comparing the outcomes of the measurement schemes.
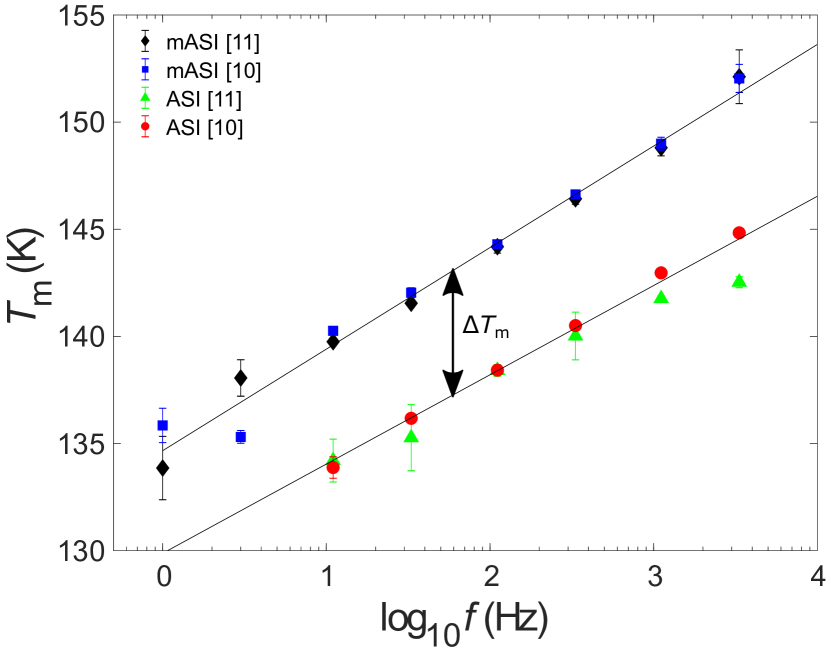
Using the interaction modifier in the mASI array, it is possible to perform a relative comparison between both techniques. In Fig. 3, we have plotted as a function of sweep frequency for both ASI and mASI along both [10] and [11]. From this graph, we notice that although varies with sweep frequency, it only changes by about 15 K when changing the time-scale by four orders of magnitude. Thus, the overlap in should be maintained even for large time-scale discrepancies between magnetization and susceptibility measurements. Moreover, we notice that there is no orientation dependence in the susceptibility measurements, which is expected as these measurements probe the response of the ground state, while the magnetisation results represent dressed states. Lastly, we find that the difference between the samples with and without an interaction modifier, indicated by , is seemingly independent on the sweep frequency, and has a value of K. We can use this fact and compare from the susceptibility measurements with from the magnetization measurements for both [10] and [11]-directions.
While from the susceptibility measurements is robust and precise, accurately quantifying the individual values of from the magnetization measurements is challenging as they are highly sensitive to the fitting procedure, in particular to the number of points included in the fits. Therefore, we chose to use the centroid of the error function fit to as a measure of . This parameter is less sensitive to the fitting procedure, and yields a value that is suitable for comparison between the two samples. It will, however, include an offset with respect to the true which we assume is constant for all measurements. Since the magnetization results differ depending on measurement orientation, we will compare [10] and [11]-direction separately. The difference in centroid temperature between ASI and mASI is K for [10] and K for [11], which agrees well with the K obtained from the susceptibility results. All of these findings hint towards the overlap in between and not being accidental. The same argument can be used when analyzing the low temperature behavior. Here, as obtained from the susceptibility data is and K for ASI and mASI, respectively and the corresponding figures obtained from the magnetization data are and K (see Fig. 2). The low temperature increase in , and decrease in suggests a decrease in dynamics on these time-scales. We therefore interpret as the “melting” temperature of the edge textures, predicted by Gliga et al. (2015) and Slöetjes et al. (2021).
Consequently, we performed micromagnetic simulations to explore the feasibility of the hypothesis concerning the dynamics of the inner magnetic texture.
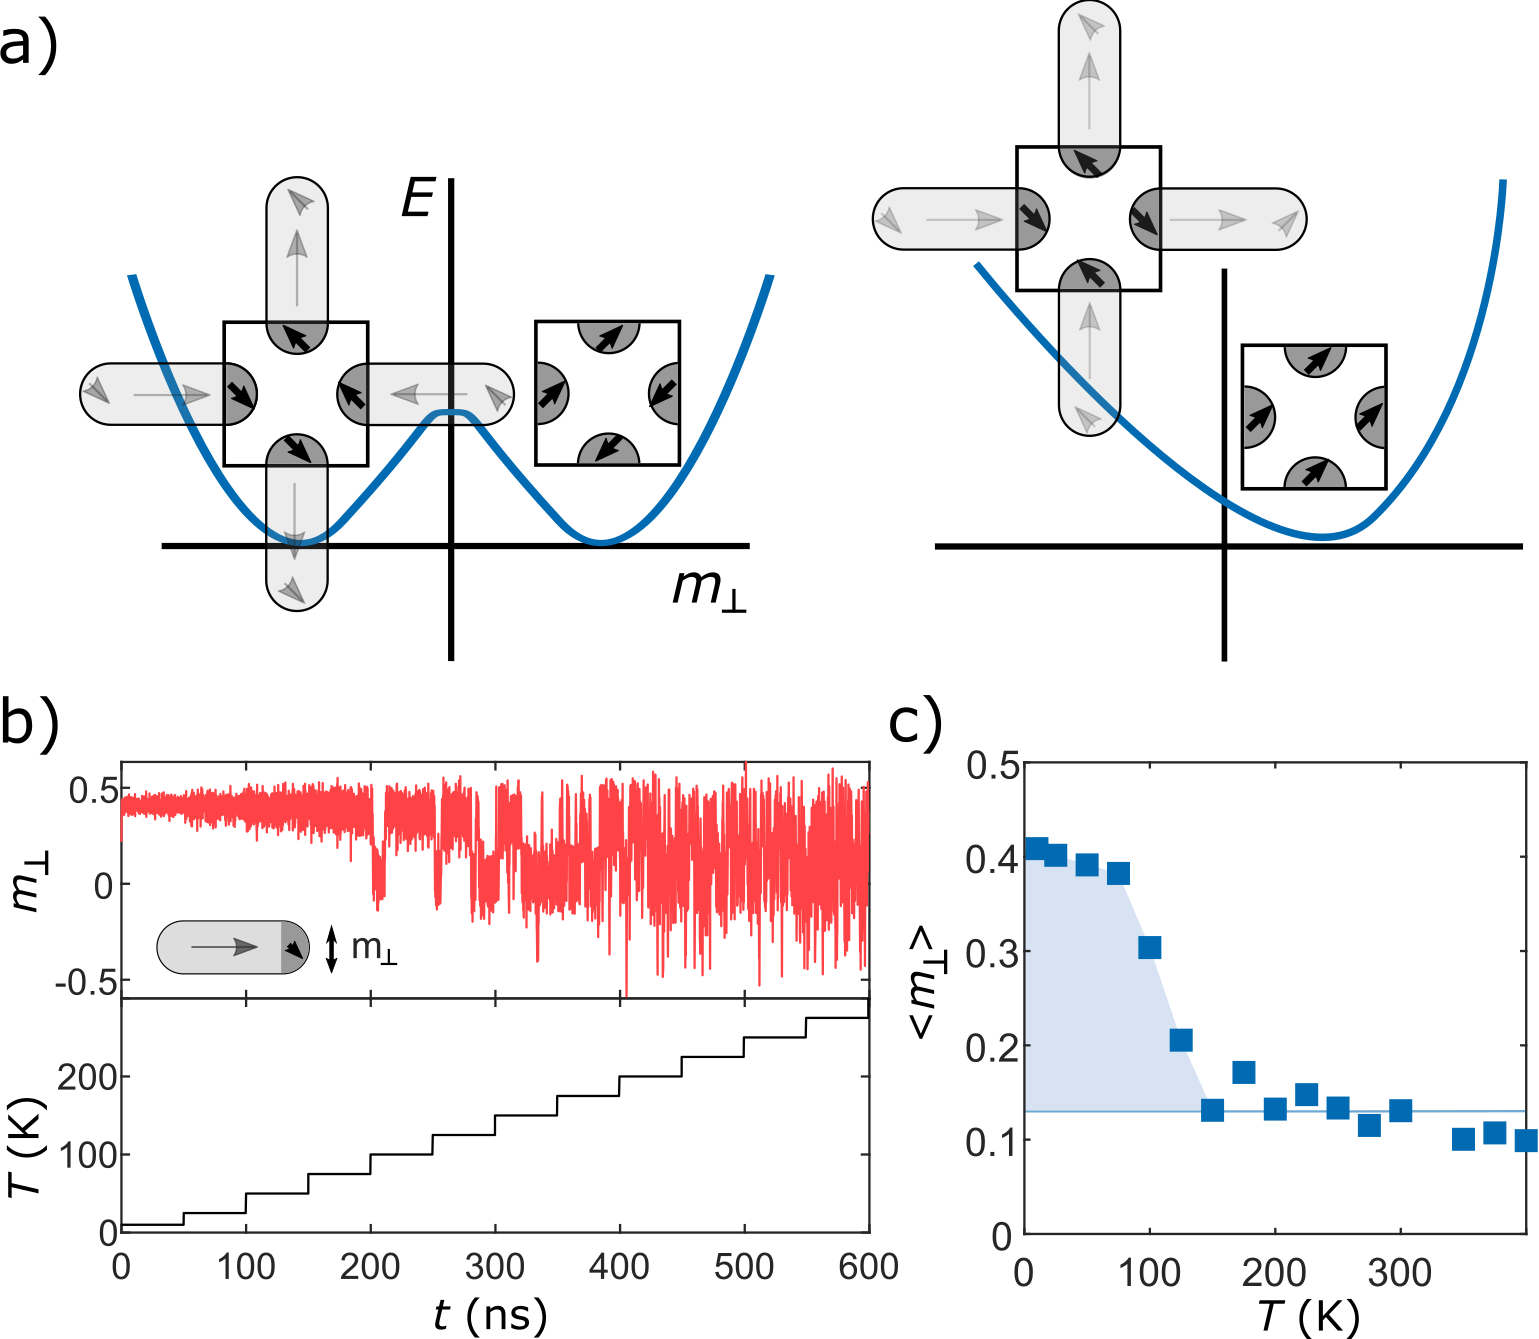
Thermal edge fluctuations in and vertices are different in nature due to differences in the energy landscape morphology (see Fig. 4a). A vertex features a double-well potential, whereas has an asymmetric single-well potential. The signal measured in the experiments is a result of a weighted sum of contributions from the different vertex types, therefore we simulated this system with equal weight from and vertices. The resulting timetraces of the fluctuations are shown in the upper panel of Fig. 4b, and the corresponding temperatures can be seen in the lower panel. Here, the perpendicular magnetization is defined as the total perpendicular magnetization in one edge (defined by a half circle), normalized by the saturation magnetization, i.e. . A signature of the double well potential is the telegraph noise in the magnetization, which can be observed in the signal, whereas the fluctuations associated with the vertex provide a bias to positive values of . The time-average magnetization, , shown in Fig. 4c, converges to a value of at high temperatures. As the temperature is lowered, the fluctuations start to freeze out at T = 150 K, reaching a value of below T = 50 K. This finite value of is mostly due to the freezing out of the fluctuations in the asymmetric potential associated with the vertices. The upturn of the magnetization at low temperatures is in qualitative agreement with experiments, and the quantitative discrepancy in can be ascribed to the vastly different time-scales between simulations and experiments. The lack of fluctuations at low temperatures also explains the decrease in the ac susceptibility signal seen in the experiments.
We provide experimental evidence of edge melting as well as a mesospin melting in artificial spin ice structures. A change in the interactions has a measurable impact on the onset of these fluctuations. The temperature at which the mesospins start fluctuating is approximately a factor 3–3.5 times higher than the temperature at which the edge fluctuations are obtained. While the edge fluctuations have been shown to impact resonant spectra features of ASI lattices Gliga et al. (2015), their effect on the ordering has not been demonstrated before. For the case presented here, the energy levels of the fluctuations are well separated, but a question may be raised as to how a degeneracy of the levels would affect the dynamics of the mesospins.
Acknowledgments
B.H. and V.K. acknowledge financial support from the National Research Council (VR) (Project No. 2019-03581 and 2019-05379). We acknowledge Myfab Uppsala for providing facilities and experimental support. Myfab is funded by the Swedish Research Council (2019-00207) as a national research infrastructure. This research used resources of the Center for Functional Nanomaterials (CFN), which is a U.S. Department of Energy Office of Science User Facility, at Brookhaven National Laboratory under Contract No. DE-SC0012704.
Author Declarations
Data availability
The data that support the findings are available from the corresponding authors upon reasonable request.
Conflict of Interest
The authors have no conflicts to disclose.
References
- Wang et al. (2006) R. F. Wang, C. Nisoli, R. S. Freitas, J. Li, W. McConville, B. J. Cooley, M. S. Lund, N. Samarth, C. Leighton, V. H. Crespi, and P. Schiffer, Nature 439, 303 (2006).
- Kapaklis et al. (2012) V. Kapaklis, U. B. Arnalds, A. Harman-Clarke, E. T. Papaioannou, M. Karimipour, P. Korelis, A. Taroni, P. C. W. Holdsworth, S. T. Bramwell, and B. Hjörvarsson, New Journal of Physics 14, 035009 (2012).
- Anghinolfi et al. (2015) L. Anghinolfi, H. Luetkens, J. Perron, M. G. Flokstra, O. Sendetskyi, A. Suter, T. Prokscha, P. M. Derlet, S. L. Lee, and L. J. Heyderman, Nature Communications 6, 8278 (2015).
- Sendetskyi et al. (2019) O. Sendetskyi, V. Scagnoli, N. Leo, L. Anghinolfi, A. Alberca, J. Lüning, U. Staub, P. M. Derlet, and L. J. Heyderman, Physical Review B 99, 214430 (2019).
- Levis et al. (2013) D. Levis, L. F. Cugliandolo, L. Foini, and M. Tarzia, Physical review letters 110, 207206 (2013).
- Nisoli et al. (2013) C. Nisoli, R. Moessner, and P. Schiffer, Rev. Mod. Phys. 85, 1473 (2013).
- Nisoli et al. (2017) C. Nisoli, V. Kapaklis, and P. Schiffer, Nature Physics 13, 200 (2017).
- Gilbert et al. (2014) I. Gilbert, G.-W. Chern, S. Zhang, L. O’Brien, B. Fore, C. Nisoli, and P. Schiffer, Nature Physics 10, 670 (2014).
- Drisko et al. (2017) J. Drisko, T. Marsh, and J. Cumings, Nature communications 8, 1 (2017).
- Morrison et al. (2013) M. J. Morrison, T. R. Nelson, and C. Nisoli, New Journal of Physics 15, 045009 (2013).
- Skjærvø et al. (2020) S. H. Skjærvø, C. H. Marrows, R. L. Stamps, and L. J. Heyderman, Nature Reviews Physics 2, 13 (2020).
- Rougemaille and Canals (2019) N. Rougemaille and B. Canals, Eur. Phys. J. B 92, 62 (2019).
- Ewerlin et al. (2013) M. Ewerlin, D. Demirbas, F. Brüssing, O. Petracic, A. A. Ünal, S. Valencia, F. Kronast, and H. Zabel, Physical Review Letters 110, 177209 (2013).
- Jungfleisch et al. (2017) M. B. Jungfleisch, J. Sklenar, J. Ding, J. Park, J. E. Pearson, V. Novosad, P. Schiffer, and A. Hoffmann, Physical Review Applied 8, 064026 (2017).
- Bingham et al. (2021) N. S. Bingham, S. Rooke, J. Park, A. Simon, W. Zhu, X. Zhang, J. Batley, J. D. Watts, C. Leighton, K. A. Dahmen, and P. Schiffer, Physical Review Letters 127, 207203 (2021).
- Arnalds et al. (2012) U. B. Arnalds, A. Farhan, R. V. Chopdekar, V. Kapaklis, A. Balan, E. T. Papaioannou, M. Ahlberg, F. Nolting, L. J. Heyderman, and B. Hjörvarsson, Applied Physics Letters 101, 112404 (2012).
- Andersson et al. (2016) M. S. Andersson, S. D. Pappas, H. Stopfel, E. Östman, A. Stein, P. Nordblad, R. Mathieu, B. Hjörvarsson, and V. Kapaklis, Scientific Reports 6, 37097 (2016).
- Pohlit et al. (2020) M. Pohlit, G. Muscas, I.-A. Chioar, H. Stopfel, A. Ciuciulkaite, E. Östman, S. D. Pappas, A. Stein, B. Hjörvarsson, P. E. Jönsson, and V. Kapaklis, Physical Review B 101, 134404 (2020).
- Östman et al. (2018a) E. Östman, U. B. Arnalds, V. Kapaklis, A. Taroni, and B. Hjörvarsson, Journal of Physics: Condensed Matter 30, 365301 (2018a).
- Arnalds et al. (2016) U. B. Arnalds, J. Chico, H. Stopfel, V. Kapaklis, O. Bärenbold, M. A. Verschuuren, U. Wolff, V. Neu, A. Bergman, and B. Hjörvarsson, New Journal of Physics 18, 023008 (2016).
- Arnalds et al. (2014) U. B. Arnalds, M. Ahlberg, M. S. Brewer, V. Kapaklis, E. T. Papaioannou, M. Karimipour, P. Korelis, A. Stein, S. Ólafsson, T. P. A. Hase, and B. Hjörvarsson, Applied Physics Letters 105, 042409 (2014).
- Skovdal et al. (2021) B. E. Skovdal, N. Strandqvist, H. Stopfel, M. Pohlit, T. Warnatz, S. D. Slöetjes, V. Kapaklis, and B. Hjörvarsson, Physical Review B 104, 014434 (2021).
- Gliga et al. (2015) S. Gliga, A. Kákay, L. J. Heyderman, R. Hertel, and O. G. Heinonen, Physical Review B 92, 060413 (2015).
- Slöetjes et al. (2021) S. D. Slöetjes, B. Hjörvarsson, and V. Kapaklis, Applied Physics Letters 118, 142407 (2021).
- Shinjo (2000) T. Shinjo, Science 289, 930 (2000).
- Kläui et al. (2003) M. Kläui, C. A. F. Vaz, L. Lopez-Diaz, and J. A. C. Bland, Journal of Physics: Condensed Matter 15, R985 (2003).
- Skovdal et al. (2022) B. E. Skovdal, G. K. Pálsson, P. C. W. Holdsworth, and B. Hjörvarsson, arXiv e-prints , arXiv:2204.10065 (2022), arXiv:2204.10065 [cond-mat.mes-hall] .
- Phatak et al. (2011) C. Phatak, A. Petford-Long, O. Heinonen, M. Tanase, and M. De Graef, Physical Review B 83, 174431 (2011).
- Leliaert et al. (2017) J. Leliaert, J. Mulkers, J. De Clercq, A. Coene, M. Dvornik, and B. Van Waeyenberge, AIP Advances 7, 125010 (2017).
- Östman et al. (2018b) E. Östman, H. Stopfel, I.-A. Chioar, U. B. Arnalds, A. Stein, V. Kapaklis, and B. Hjörvarsson, Nature Physics 14, 375 (2018b).
- Pärnaste et al. (2007) M. Pärnaste, M. Marcellini, E. Holmström, N. Bock, J. Fransson, O. Eriksson, and B. Hjörvarsson, Journal of physics: Condensed matter 19, 246213 (2007).
- Vansteenkiste et al. (2014) A. Vansteenkiste, J. Leliaert, M. Dvornik, M. Helsen, F. Garcia-Sanchez, and B. Van Waeyenberge, AIP Advances 4, 107133 (2014).