Anisotropic suppression of hyperuniformity of elastic systems in media with planar disorder
Abstract
Abstract
Disordered hyperuniform materials with vanishing long-wavelength density fluctuations are attracting attention due to their unique physical properties. In these systems, the large-scale density fluctuations are strongly suppressed as in a perfect crystal, even though the system can be disordered like a liquid. Yet, hyperuniformity can be affected by the different types of quenched disorder unavoidably present in the host medium where constituents are nucleated. Here, we use vortex matter in superconductors as a model elastic system to study how planar correlated disorder impacts the otherwise hyperuniform structure nucleated in samples with weak point disorder. Planes of defects suppress hyperuniformity in an anisotropic fashion: While in the transverse direction to defects the long-wavelength density fluctuations are non-vanishing, in the longitudinal direction they are smaller and the system can eventually recover hyperuniformity for sufficiently thick samples. Our findings stress the need of considering the nature of disorder and thickness-dependent dimensional crossovers in the search for novel hyperuniform materials.
∗ Corresponding author: Yanina.Fasano@cab.cnea.gov.ar
Introduction
A great number of disordered physical and biological systems are endowed with a universal hidden order characterized by a macroscopically uniform density of constituents. Torquato and Stillinger (2003); Torquato (2018) This hidden order is the structural property of hyperuniformity, characterized by an anomalous suppression of large-scale density fluctuations in the system. This property is naturally expected in a crystal, but it is also observed in a wide variety of disordered systems such as two-dimensional material structures, Man et al. (2013); Chen and Torquato (2018); Zheng et al. (2020a); Salvalaglio et al. (2020); Chen et al. (2021a, b) jammed particles, Zachary et al. (2011); Dreyfus et al. (2015) bubbles in foam, Chieco and Durian (2021) vortex matter in type-II superconductors, Rumi et al. (2019); Llorens et al. (2020a) patterns of photoreceptors in avian retinas, Jiao et al. (2014) biological tissues, Zheng et al. (2020b) and even the distribution of the density fluctuations in the early Universe. Gabrielli et al. (2003) Hyperuniform systems present a vanishing structure factor in the infinite-wavelength or small wavenumber limit, namely as . Torquato and Stillinger (2003); Torquato (2018) This magnitude can be directly measured via different diffraction techniques and provides information on the fluctuations of the density of constituents of the system at different wavenumbers. Since hyperuniformity is a property defined in an asymptotic limit, strict hyperuniformity is difficult to ascertain in experimental as well as computer-simulated systems. Then, most works show that the systems are effectively hyperuniform. Klatt et al. (2019)
This exceptional but ubiquitous state of matter presents a phenomenology that goes against the conventional wisdom on the effect of disorder in the physical properties of systems of interacting objects. Man et al. (2013); Chen and Torquato (2018); Torquato (2018) For instance, disorder typically lowers the electrical conductivity of metallic materials. However, a recent work reports that disordered hyperuniform systems present a closing of bandgaps resulting in an enhanced conductivity. Zheng et al. (2020a) Also, periodic or quasiperiodic order was assumed as a prerequisite for a material to present photonic bandgap properties. Strikingly, disordered hyperuniform-engineered materials possess complete photonic bandgaps blocking all directions and polarizations for short wavelengths. Florescu et al. (2009); Man et al. (2013); Froufe-Pérez et al. (2016) In addition, hyperuniform patterns can be very useful in practical technological applications. For example, hyperuniform patterns of defects can pin with high efficiency the vortex structure nucleated in superconductors, avoiding the undesirable dissipation that can occur in superconducting devices. Le Thien et al. (2017); Sadovskyy et al. (2019)
Theoretically, due to the fluctuation-compressibility theorem, hyperuniformity may naturally emerge at thermal equilibrium in incompressible systems with long-range repulsive interactions between the constituents. Torquato (2018) Nevertheless, a hyperuniform point pattern within a higher dimensional system presenting only short-range interactions or gradient terms at equilibrium may also exist. Indeed, a three dimensional vortex lattice model with short-range repulsions and local elasticity may present hyperuniform two-dimensional point patterns at every plane perpendicular to the vortex lines. Rumi et al. (2019) In general terms, this road to hyperuniformity results from bulk-mediated effective long-range interactions between the points in the hyperuniform pattern.
Vortex matter in superconductors is a model system to study the occurrence of hyperuniformity in media with different types of disorder. Vortices are elastic objects that nucleate in type-II superconductors when applying a magnetic field. They are string-like zones of the material that concentrate a quantized amount of magnetic flux and interact repulsively between each other. The competition between this repulsion and the pressure exerted by the field results in vortices forming a structure with lattice spacing . The vortex structure stabilizes in solid, glassy and liquid phases, depending on temperature, applied field, the particular material and the nature of disorder in the samples. Cubitt et al. (1993); Blatter et al. (1994); Pardo et al. (1998); Klein et al. (2001); Menghini et al. (2002); Pautrat et al. (2007); Petrović et al. (2009); Suderow et al. (2014); Marziali Bermúdez et al. (2015); Zehetmayer (2015); Chandra Ganguli et al. (2015); Toft-Petersen et al. (2018); Aragón Sánchez et al. (2019) The nucleation of quasi-ordered and disordered hyperuniform vortex structures has first been reported experimentally in samples of the high- Bi2Sr2CaCu2O8+δ with respectively weak point and strong columnar disorder. Rumi et al. (2019) Later, disordered hyperuniform vortex structures have been observed at high fields in several superconductors presenting weak and strong point disorder. Llorens et al. (2020a) Hyperuniform vortex structures are theoretically expected for media with weak point disorder since in this case the effective interaction between vortex tips at the sample surface is long ranged. Theoretically, a suppression of hyperuniformity is expected for media with columnar correlated disorder. Rumi et al. (2019) However, in the latter case an algebraic decay of in the limit is detected experimentally. This apparent discrepancy between theory and experiment is quite likely due to the viscous freezing of the system when field-cooling from the hyperuniform vortex liquid phase towards the low-temperature glassy vortex phase. Rumi et al. (2019) In contrast, in the case of a type-II superconductor with planar correlated defects, strong fluctuations of the vortex density have been proposed as the fingerprint of a disordered gel of vortices. Llorens et al. (2020b) Thus, the nature of disorder in the host medium plays a determinant role on the magnitude of density fluctuations, and thus their effect on the nucleation of hyperuniform materials deserves further investigation.
Here we address the question of whether planar correlated quenched disorder, even if present in a reduced region of the sample, can ultimately affect the hyperuniform hidden order. We use vortex matter in two different high- superconductors as model systems. In order to be reliable, these studies on long-range vortex density fluctuations require high-resolution direct imaging of individual vortices in extended fields-of-view with thousands of vortices or more. Our experimental data with such a resolution and extension are contrasted with numerical simulations of a system of interacting elastic strings nucleated in media with planar disorder. We show that planes of crystal defects running all the way through the sample thickness produce a suppression of hyperuniformity in an anisotropic fashion. Furthermore, we discuss how finite size effects are relevant for these observations and how its removal in a sufficiently-thick sample can produce a recovery of the hyperuniform hidden order in the direction longitudinal to planar defects.
Results
Density fluctuations on large length scales in media with planar defects
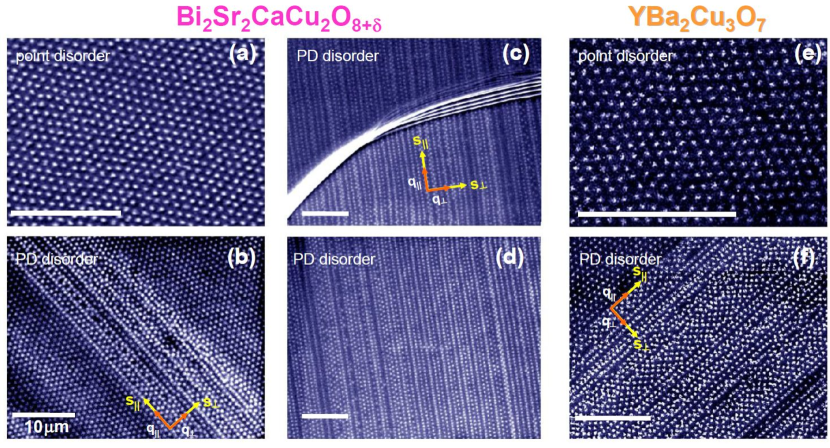
A practical way to image vortex density fluctuations on large length scales is to apply the magnetic decoration technique to take snapshots of thousands of vortices at the sample surface. Magnetic decoration consists in producing nanometer-size Fe clusters that are attracted towards the local field gradient entailed by vortices on the surface of the sample. Fasano and Menghini (2008) We decorate vortex positions at 4.2 K after field-cooling; then the sample is warmed up to room temperature and the Fe clusters are imaged by means of scanning electron microscopy. We investigate Bi2Sr2CaCu2O8+δ and YBa2Cu3O7 high- superconducting samples as model media with planar correlated quenched disorder, namely domains with enhanced pinning. In the first case we study samples with few and many planar defects separating zones of the sample with slightly different orientations of their c-axis; Koblischka et al. (1995); Herbsommer et al. (2001) in the second case we consider samples with twin-boundaries that act as planar defects. For comparison, we study samples of both materials with point disorder only, namely with no planar defects as revealed by means of magnetic decoration. See Methods for further details on the experimental techniques and sample characterization.
Figure 1 shows images of the vortex structures nucleated in some of the studied samples. In the case of point disorder the structure is hexagonal whereas the planar defects induce the formation of vortex rows oriented along the direction of defects , or correspondingly in reciprocal space. These vortex rows have generally a larger density than the average, in agreement with evidence from different imaging and dynamic techniques Koblischka et al. (1995); Herbsommer et al. (2001); Maggio-Aprile et al. (1997); Fasano et al. (1999) that indicate that planar defects in both materials act as strong pinning centers for vortices. In Bi2Sr2CaCu2O8+δ samples with few planar defects, vortex rows are observed in a micron-sized region, and the hexagonal structure is recovered elsewhere, see Fig. 1 (b). The sample with many planar defects was specially chosen since most vortices are aligned in vortex rows in the whole crystal, see Figs. 1 (c) and (d). In this sample, as also reported in samples with few planar defects, Herbsommer et al. (2001); Fasano et al. (1999) the alignment of the rows is not altered by surface steps resulting from cleaving, indicating the defects extend towards the bulk of the crystals. In the case of YBa2Cu3O7, the structure is hexagonal in the untwinned sample and vortex rows are also observed in a heavily twinned sample, see Figs. 1 (e) and (f).
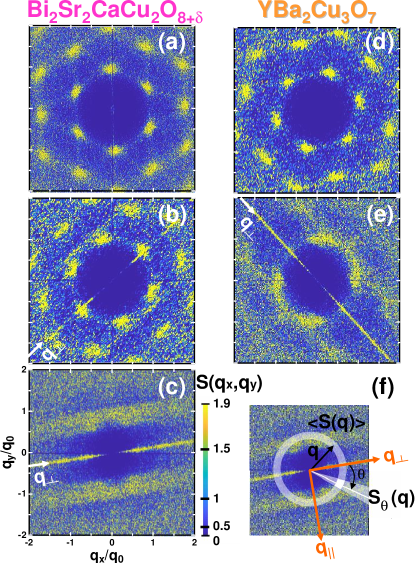
In order to characterize the vortex density fluctuations on extended fields-of-view, we analyze the structure factor from snapshots of the vortex arrangements taken at the surface of these samples. Figure 2 shows , with the Fourier transform of the local vortex density modulation at the surface of the studied samples with typical thickness m. Fasano et al. (2003) A strong anisotropy is evident for samples with planar defects: Figs. 2 (b), (c) and (e) show lines of local maxima in extended along the direction (angle ) corresponding to vortex density fluctuations transversal to planar defects. At first sight, the intensity seems to faint on going towards . In the case of media with point disorder, decays algebraically when , as reported previously, Rumi et al. (2019); Llorens et al. (2020b) and also shown in Figs. 3 (a) and (b). We wonder whether in samples with planar defects this fainting is produced by an algebraic decay in the limit as expected for disordered hyperuniform systems.
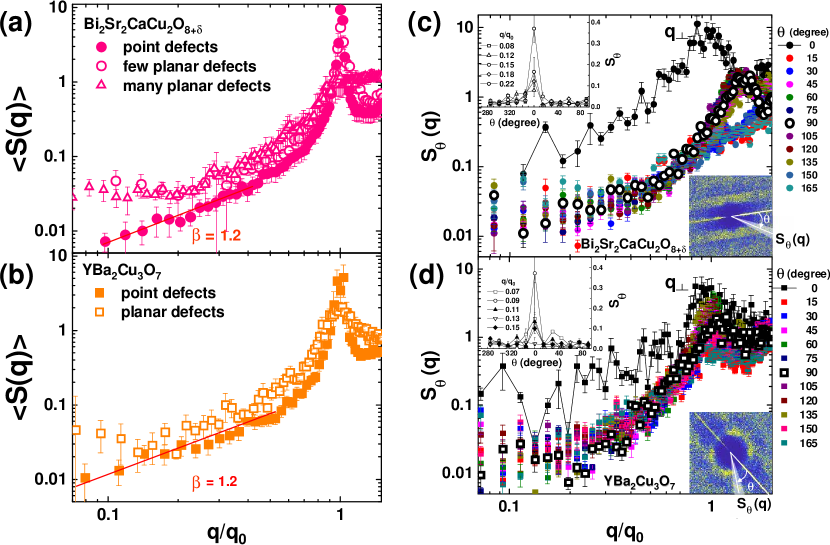
Figure 3 shows one of the main findings of this paper: The suppression of effective hyperuniformity induced by the addition of correlated planar disorder to the host medium. In samples with planar defects, the angularly-averaged structure factor for is larger than that for samples with point defects (for definition of this magnitude, see Fig. 2 (f) and Methods). More significantly, tends to saturate in the low- limit. This phenomenology is observed for the two studied compounds and for crystals presenting few or many planar defects. In contrast, in samples of the same compounds but with point disorder, with when , a signature of effective disordered hyperuniformity.
Anisotropy in the density fluctuations on large length scales in samples with planar defects
Here we show that in samples with planar defects the suppression of hyperuniformity is anisotropic, with vortex density fluctuations of greater magnitude in the than the direction. First, we show that the saturation of the structure factor in the limit is anisotropic for vortices nucleated in samples with planar defects. Figures 3 (c) and (d) show data of the angular structure factor , for different reciprocal space directions. Curves with black (white with black edge) points correspond to data in the transverse direction (parallel direction ), whereas color points are data for intermediate angles. Irrespective of the direction, at low all curves tend to saturate, but while the color and white points form a pack of data around , the black curves corresponding to the transverse modes stand out and saturate at a value between 2 and 10 times larger. This is better depicted in the inserts to Fig. 3 (c) and (d). In addition, the peaks in are detected at smaller for than for degree, indicating that the average vortex spacing is smaller in the longitudinal than in the transverse direction to planar defects.
Second, in order to better characterize this anisotropy, we consider the one-dimensional structure factor of individual vortex rows that is sensitive to vortex density fluctuations along the direction of planar defects. In order to compute this magnitude, the experimental positions of vortices in individual rows are mapped in a straight line such that adjacent vortices are spaced a distance and the coordinate of vortex is , see the schematic representation of Fig. 4 (a). The one-dimensional structure factor of a given row is then computed as , with the Fourier transform of the vortex density modulation along the line. Then, for each vortex row we calculate the average lattice spacing in a row, , and the wavenumber is normalized by . Finally, we average the one-dimensional structure factor over many rows to obtain the data shown in Fig. 4 (b). In the limit the tendency to saturation is evident: A fit of yields within the error for the two studied compounds.
Third, we analyze the distance-evolution of the one-dimensional displacement correlator computed along and perpendicular to the direction of defects, and . These magnitudes quantify the average over disorder of the displacement of vortices in the or directions with respect to the sites of perfect chains oriented in the same directions. The lattice spacing of the perfect chains, either or , are obtained by averaging the separation of vortices along the considered direction in a given row/lane of vortices, see the schematics in the inserts to Figs. 4 (c) and (d). In practice, we compute , where is the average when considering every vortex as the origin. is the displacement of the -th vortex located at () from the -th site of a perfect chain of vortices with lattice spacing () averaged in a given row(lane).
For disordered elastic systems, the displacement correlator typically grows with distance with a roughness exponent given by the universality-class of the system along the considered direction. Barabasi et al. (1995) Figure 4 (c) shows the dependence of with averaged over tens of vortex rows and panel (d) shows the evolution with averaged along tens of vortex lanes. For the two studied compounds, the data are reasonably well fitted with an algebraic growth with exponent in both directions, at odds with expectations for a hyperuniform system. The fits yield a multiplicative factor roughly three and a half times larger for the than for the direction. This is another proof that from experimental evidence vortex density fluctuations are anisotropic in media with planar defects.
Simulations of a structure of interacting elastic vortex lines in media with planar defects
Here we gain insight on the origin of the anisotropic vortex density fluctuations in media with planar defects by means of Langevin dynamics simulations of vortex lines in three dimensions with an applied field in the -direction. We consider a media with randomly-spaced parallel planar defects oriented with their normal pointing along the -axis in an orthogonal coordinate system . We model vortices as elastic lines discretized in the -direction, such that describe the two-dimensional coordinate of vortex at the layer with the total number of layers. Periodic boundary conditions are taken in all directions in a system of size . The total energy per unit length of the structure of elastic lines is . Each line has an elastic tension energy given by Hook couplings of strength
| (1) |
with a local harmonic approximation for the single vortex elastic tension, the interaction energy-scale per unit length, and the in-plane penetration length. The repulsive interaction energy between three-dimensional vortex-lines derived from the London model Blatter et al. (1994) is
| (2) |
with the nth-order modified Bessel function of the second kind. The pinning energy due to defects is modeled as Gaussian-well channels
| (3) |
where is the in-plane coherence length, the pinning strength of the planar defects, and the random positions of the planar defects uniformly sampled along . Finite-temperature Langevin dynamics simulations of the system are performed to obtain equilibrated low temperature configurations (see Methods). A snapshot of a configuration is shown in Fig.5 (a).
Figures 5 (a) and (b) show the main results of the simulations that are in accordance with experimental observations: i) The is anisotropic and displays similar density fluctuations for all directions; ii) fluctuations in the () transverse direction are orders of magnitude larger, particularly at low . The peak in the transverse direction is detected at a smaller wavenumber than in other directions, and is also found in the simulations. Thus, this model of a structure of interacting elastic vortex lines nucleated in planar defects that are in controlled positions allow us to ascertain that the pinning generated by defects is strong enough as to increase the vortex density inside defects above the average. Furthermore, this model reveals that the anisotropic suppression of hyperuniformity has origin in the interactions allowing important vortex density fluctuations at large wavelengths for vortices caged in defects but also allowing for a rarefied distribution of vortices in between defects. As discussed in detail in the next section, by performing simulations and analytical calculations of a simplified version of the model of Eqs.(1),(2) and (3) we can go further in the comparison between experiments and theory, and show that the number of layers (proportional to the sample thickness), plays a very relevant role in assessing hyperuniformity.
Discussion
The suppression of disordered hyperuniformity in media with planar defects can be discussed in a broader context than that of its implications for the synthesis of hyperuniform materials. This issue is connected to the related problem of the structural phases stabilized in media with different types of disorder. In the case of planar defects oriented in the direction of the magnetic flux as we study here, the stabilization of a robust planar-glass phase is expected. Emig and Nattermann (2006); Petković et al. (2009) In this phase, the positional correlation function is expected to decay exponentially, Emig and Nattermann (2006); Petković et al. (2009) implying both, a displacement correlator function , and a structure factor behaving as . These theoretical implications are consistent with our experimental and theoretical findings on the suppression of hyperuniformity in the direction transverse to planar defects. Nevertheless, these theoretical works do not study the vortex density fluctuations in the direction longitudinal to planar defects nor the experimentally relevant size-effects. The saturation at a finite value in the longitudinal direction , appreciably smaller than , is a subtle issue. Indeed, we argue below that at low densities, the vortex structure confined in a planar defect can be disordered hyperuniform provided the sample is thick enough and the confinement is strong.
In order to sustain these claims, we start by highlighting some relevant findings. First, both in experiments and simulations, the vortex structure in samples with planar defects presents well defined vortex rows. Simulations also show that at low temperatures most of vortex rows are parallel to planar defects. Second, the average vortex spacing along a row is appreciably smaller than in between rows, for instance in the experiments. This indicates that intra-row vortex-vortex interactions are stronger than inter-row ones, motivating a single-row-based mean-field-like phenomenological approach.
Then, to further sustain our claims based in an analytical insight of the problem, we now consider a simplified model that captures the essential physical ingredients of the problem: We neglect the interaction between vortex rows as well as transverse vortex fluctuations, and model the system as a non-interacting collection of single vortex rows with strongly localized vortices inside a planar defect. We also neglect for the moment the effect of quenched point disorder since it is expected to be weaker than the planar defect pinning. The thermally-equilibrated configuration of the elastic system can then be obtained analytically in the elastic approximation by using the displacement field . This field describes the mismatch of the planar vortex row with respect to a perfectly periodic chain of straight vortices aligned in the -direction, see Fig. 5(c). Within this simple model, as detailed in Methods, the large-wavelength density fluctuations at a single layer give a structure factor
| (4) |
where is the Fourier transform of the displacement field, and are the compression and tilt elastic modulii of the planar vortex system, is the sample thickness, and is a relevant crossover length. Assuming translation symmetry along , Eq.(4) implies that in real space the displacement correlator in the longitudinal direction to planar defects scales as
| (5) |
see Methods for further details. The result of a roughness is not a surprise since the system is essentially a thermally-fluctuating two-dimensional elastic lattice. The novelty here is that to explain the experimental observations it is necessary to consider the finite-thickness induced crossover distance
| (6) |
This crossover behaviour in and is also confirmed in numerical simulations of a single vortex row confined in a planar defect for different thicknesses, see Fig.5 (d). Furthermore, the top-left insert of this figure shows that all vs. curves collapse into a master-curve, confirming quantitatively that , Eq.(6). According to Eq. (4), in the thermodynamic limit , and the vortex row at a constant- cross section is class II hyperuniform since with . Torquato (2018) This hyperuniformity class contrasts with more ordered class I hyperuniform systems where . Torquato (2018) However, in systems with finite thickness, Eq.(4) predicts a crossover towards a non-hyperuniform behaviour for . This corresponds to a dimensional crossover from a two-dimensional to an effective one-dimensional elastic system equivalent to an elastic chain composed by rigid vortices. Interestingly, this phenomenology is closely related to the crossover predicted for Luttinger liquids at a characteristic thermal length. Giamarchi (2004)
A caveat in our model might be that we ignore that real samples have weak point disorder. However, as shown in Methods, if this disorder is considered, the main results of Eqs.(4), (5) and (6) remain qualitatively valid. Namely, for and while for , the structure is disordered hyperuniform but class III () instead of class II (). Torquato (2018)
Finally, we argue that a finite size effect is a plausible explanation for the suppression of hyperuniformity observed in experiments and simulations. Considering the vortex-vortex interaction potential per unit length , with the single vortex elastic tension, the elastic constants of the planar vortex system can be estimated as and . Nattermann and Scheidl (2000) Thus, using these approximations in Eq.6, the crossover length can be estimated by considering only the sample thickness since we get . Provided in the experiments, shortens with either decreasing or . In the studied samples with m, Fasano et al. (2003) , and then this dimensional crossover is quite likely at the origin of the observation of a non-vanishing structure factor for large wavelengths. For thick enough samples and/or smaller such that , the crossover to disordered hyperuniform vortex density fluctuations might be observed experimentally. This would be a state with directional hyperuniformity.Torquato (2016) In other words, vortex matter nucleated in thin samples with a dense distribution of planar defects effectively behave as a collection of one-dimensional elastic manifolds. The suppression of hyperuniformity in elastic structures nucleated in media with planar disorder as identified in this work may be also observed in a broad spectrum of systems with a control parameter tuning the dimensional crossover. In addition, a direct mapping between the thickness of a classical system and the temperature in quantum systems can be made, signposting the conditions for disordered hyperuniformity to persist in planarly-confined quantum systems such as optical traps. These results are rather important on the search for novel disordered hyperuniform classic and quantum materials presenting exotic physical properties.
I Methods
Sample preparation and characterization
We studied Bi2Sr2CaCu2O8+δ and YBa2Cu3O7 samples grown and characterized by means of X-ray diffraction, transport and magnetometry techniques. The Bi2Sr2CaCu2O8+δ samples with point disorder and few planar defects were grown by means of the flux method and have a K; further details on the crystallographic and superconducting properties of these samples can be found in Ref. Correa et al., 2001. The Bi2Sr2CaCu2O8+δ samples with many planar defects were grown following the travelling-solvent-floating-zone method using an image furnace with two ellipsoidal mirrors and has a critical temperature of K. The YBa2Cu3O7 single crystals were obtained following a growth from the melt technique and are fully oxygenated with K, see Ref. de la Cruz et al., 1994 for further details on the growing method.
Vortex imaging by means of magnetic decoration experiments
We image individual vortex positions at the sample surface in large fields-of-view ranging from 1,000 to 35,000 vortices by means of magnetic decoration experiments. Fasano et al. (2005) For all the data presented here, the magnetic field is applied above and the sample is cooled down to 4.2 K. At this temperature Fe particles are evaporated in a pressure-controlled helium chamber and clusters of these particles land on the sample surface decorating the positions of vortices. Even though the snapshots of the structure are taken at 4.2 K, during the field-cooling process the vortex structure gets frozen, at length-scales of the lattice parameter , at a temperature , the irreversibility temperature at which pinning (sample disorder) sets in. Bolecek et al. (2016) On further cooling down to 4.2 K, vortices can move but in length scales of the order of coherence length, 200 times smaller than the typical size of a vortex as detected by magnetic decoration. Therefore the structure imaged by magnetic decoration at 4.2 K corresponds to the equilibrium one at .
Structure factors
In order to calculate the structure factors we start considering the vortex density modulation
| (7) |
where is the average density and the number of vortices. In magnetic decoration experiments we have access to the vortex structure at the surface, namely . The structure factor is obtained from the two-dimensional Fourier transform of the density, , as
| (8) |
In the same token, the one-dimensional structure factor in a vortex row, is obtained from the vortex density modulation along a line . The angular structure factor is the polar-coordinate representation of , see Fig. 2 (f) for schematics.
The angularly-averaged has to be calculated carefully when studying the low- density modes. Due to finite size effects, the borders and shape of the experimental field-of-view hinder the study of in the low- range due to the annoying windowing effect. In rectangular fields-of-view as we study here, this artifact produces an excess in in a cross-shaped region centered at . When analyzing our experimental data, in order to get rid of this effect we neglect the contribution from this cross. In simulations, this effect is avoided considering in-plane periodic boundary conditions.
Computer simulation details
The numerical simulations performed here consider an overdamped Langevin dynamics at a temperature
| (9) | |||||
| (10) |
where is the time and is the Bardeen-Stephen friction. In order to emulate the experimental conditions we have simulated systems with densities such that . The values of the pinning strength of planar defects, , and the number of planar defects, , were tuned such that the vortex system displays at the surface of the simulated sample a structure qualitatively similar to the one observed in magnetic decoration experiments. We have used , and , , , , , . In order to mimic the experiments we start the simulation at , reduce slowly, and equilibrate the system at . When the averaged structure factor appears to be stationary, we analyze different properties of the final configuration and average them over several realizations of the same protocol.
Planar elastic vortex array model: Analytical details
The simple model of a planar elastic vortex array considered in the discussion is described in the continuum by the scalar longitudinal displacement field with hamiltonian
| (11) |
where is the Fourier transform of and and are the dispersive compression and tilt elastic modulii. At thermal equilibrium
| (12) |
The modulation of the coarse-grained vortex density at long-wavelengths is
| (13) |
where is the average number of vortices per unit length along the vortex row of the planar vortex array. Then, for small ,
| (14) |
By assuming translational invariance along and evaluating the elastic constants at , the correlation function
| (15) | |||||
with
| (16) |
the correlation length along the -direction. Neglecting surface effects, Marchetti and Nelson (1993) the structure factor at the sample surface is . Then, for we get Eq. (4). Finite-size effects appear when , obtaining the crossover length of Eq.(6).
When weak point disorder is added, the dimensional crossover still exists and the effective rigid-vortex chain regime for is equivalent to an elastic interface in a random-periodic type of disorder. In this case, at equilibrium Bustingorry et al. (2010)
| (17) |
with . Since , the second regime of Eqs. (4) and (5) is obtained for or . The correlations in the infinite-thickness limit can be tackled analytically by mapping to the Cardy-Ostlund model. Nattermann and Scheidl (2000) In this case displays subtle additive corrections to the growth, Nattermann and Scheidl (2000) implying
| (18) |
Then, in this limit the system is class III hyperuniform in contrast with the class II hyperuniformity found in the clean case.
Once the corresponding formulas for are known, the displacement correlator of Eq. (5) of the main text can be obtained considering that
| (19) | |||||
Data availability
All relevant data are available from the authors upon request.
Code availability
All relevant code for simulations are available from the authors upon request.
References
References
- Torquato and Stillinger (2003) S. Torquato and F. H. Stillinger, Phys. Rev. E 68, 041113 (2003), URL https://link.aps.org/doi/10.1103/PhysRevE.68.041113.
- Torquato (2018) S. Torquato, Phys. Rep. 745, 1 (2018), ISSN 0370-1573, URL https://www.sciencedirect.com/science/article/pii/S037015731830036X.
- Man et al. (2013) W. Man, M. Florescu, E. P. Williamson, Y. He, S. R. Hashemizad, B. Y. C. Leung, D. R. Liner, S. Torquato, P. M. Chaikin, and P. J. Steinhardt, Proc. Natl. Acad. Sci. USA 110, 15886 (2013), ISSN 0027-8424, URL https://www.pnas.org/content/110/40/15886.
- Chen and Torquato (2018) D. Chen and S. Torquato, Acta Materialia 142, 152 (2018), ISSN 1359-6454, URL https://www.sciencedirect.com/science/article/pii/S1359645417308194.
- Zheng et al. (2020a) Y. Zheng, L. Liu, H. Nan, Z.-X. Shen, G. Zhang, D. Chen, L. He, W. Xu, M. Chen, Y. Jiao, et al., Sci. Adv. 6, eaba0826 (2020a).
- Salvalaglio et al. (2020) M. Salvalaglio, M. Bouabdellaoui, M. Bollani, A. Benali, L. Favre, J.-B. Claude, J. Wenger, P. de Anna, F. Intonti, A. Voigt, et al., Phys. Rev. Lett. 125, 126101 (2020), URL https://link.aps.org/doi/10.1103/PhysRevLett.125.126101.
- Chen et al. (2021a) D. Chen, Y. Zheng, C.-H. Lee, S. Kang, W. Zhu, H. Zhuang, P. Y. Huang, and Y. Jiao, Phys. Rev. B 103, 224102 (2021a), URL https://link.aps.org/doi/10.1103/PhysRevB.103.224102.
- Chen et al. (2021b) D. Chen, Y. Zheng, L. Liu, G. Zhang, M. Chen, Y. Jiao, and H. Zhuang, Proc. Natl. Acad. Sci. USA 118, e2016862118 (2021b), ISSN 0027-8424, URL https://www.pnas.org/content/118/3/e2016862118.
- Zachary et al. (2011) C. E. Zachary, Y. Jiao, and S. Torquato, Phys. Rev. Lett. 106, 178001 (2011), URL https://link.aps.org/doi/10.1103/PhysRevLett.106.178001.
- Dreyfus et al. (2015) R. Dreyfus, Y. Xu, T. Still, L. A. Hough, A. G. Yodh, and S. Torquato, Phys. Rev. E 91, 012302 (2015), URL https://link.aps.org/doi/10.1103/PhysRevE.91.012302.
- Chieco and Durian (2021) A. T. Chieco and D. J. Durian, Phys. Rev. E 103, 062609 (2021), URL https://link.aps.org/doi/10.1103/PhysRevE.103.062609.
- Rumi et al. (2019) G. Rumi, J. Aragón Sánchez, F. Elías, R. Cortés Maldonado, J. Puig, N. R. Cejas Bolecek, G. Nieva, M. Konczykowski, Y. Fasano, and A. B. Kolton, Phys. Rev. Res. 1, 033057 (2019), URL https://link.aps.org/doi/10.1103/PhysRevResearch.1.033057.
- Llorens et al. (2020a) J. B. Llorens, I. Guillamón, I. G. Serrano, R. Córdoba, J. Sesé, J. M. De Teresa, M. R. Ibarra, S. Vieira, M. Ortuño, and H. Suderow, Phys. Rev. Res. 2, 033133 (2020a), URL https://link.aps.org/doi/10.1103/PhysRevResearch.2.033133.
- Jiao et al. (2014) Y. Jiao, T. Lau, H. Hatzikirou, M. Meyer-Hermann, J. C. Corbo, and S. Torquato, Phys. Rev. E 89, 022721 (2014), URL https://link.aps.org/doi/10.1103/PhysRevE.89.022721.
- Zheng et al. (2020b) Y. Zheng, Y.-W. Li, and M. P. Ciamarra, Soft Matter 16, 5942 (2020b), URL http://dx.doi.org/10.1039/D0SM00776E.
- Gabrielli et al. (2003) A. Gabrielli, B. Jancovici, M. Joyce, J. L. Lebowitz, L. Pietronero, and F. Sylos Labini, Phys. Rev. D 67, 043506 (2003), URL https://link.aps.org/doi/10.1103/PhysRevD.67.043506.
- Klatt et al. (2019) M. A. Klatt, J. Lovrić, D. Chen, S. C. Kapfer, F. M. Schaller, P. W. A. Schönhöfer, B. S. Gardiner, A.-S. Smith, G. E. Schröder-Turk, and S. Torquato, Nature Comm. 10, 811 (2019), ISSN 2041-1723, URL https://doi.org/10.1038/s41467-019-08360-5.
- Florescu et al. (2009) M. Florescu, S. Torquato, and P. J. Steinhardt, Proc. Nat. Acad. Sci. USA 106, 20658 (2009).
- Froufe-Pérez et al. (2016) L. S. Froufe-Pérez, M. Engel, P. F. Damasceno, N. Muller, J. Haberko, S. C. Glotzer, and F. Scheffold, Phys. Rev. Lett. 117, 053902 (2016), URL https://link.aps.org/doi/10.1103/PhysRevLett.117.053902.
- Le Thien et al. (2017) Q. Le Thien, D. McDermott, C. J. O. Reichhardt, and C. Reichhardt, Phys. Rev. B 96, 094516 (2017), URL https://link.aps.org/doi/10.1103/PhysRevB.96.094516.
- Sadovskyy et al. (2019) I. A. Sadovskyy, A. E. Koshelev, W.-K. Kwok, U. Welp, and A. Glatz, Proc. Nat. Acad. Sci. USA 116, 10291 (2019), ISSN 0027-8424, URL https://www.pnas.org/content/116/21/10291.
- Cubitt et al. (1993) R. Cubitt, E. M. Forgan, G. Yang, S. L. Lee, D. M. Paul, H. A. Mook, M. Yethiraj, P. H. Kes, T. W. Li, A. A. Menovsky, et al., Nature 365, 407 (1993), ISSN 1476-4687, URL https://doi.org/10.1038/365407a0.
- Blatter et al. (1994) G. Blatter, M. V. Feigel’man, V. B. Geshkenbein, A. I. Larkin, and V. M. Vinokur, Rev. Mod. Phys. 66, 1125 (1994), URL https://link.aps.org/doi/10.1103/RevModPhys.66.1125.
- Pardo et al. (1998) F. Pardo, F. de la Cruz, P. L. Gammel, E. Bucher, and D. J. Bishop, Nature 396, 348 (1998), ISSN 1476-4687, URL https://doi.org/10.1038/24581.
- Klein et al. (2001) T. Klein, I. Joumard, S. Blanchard, J. Marcus, R. Cubitt, T. Giamarchi, and P. Le Doussal, Nature 413, 404 (2001), ISSN 1476-4687, URL https://doi.org/10.1038/35096534.
- Menghini et al. (2002) M. Menghini, Y. Fasano, and F. de la Cruz, Phys. Rev. B 65, 064510 (2002), URL https://link.aps.org/doi/10.1103/PhysRevB.65.064510.
- Pautrat et al. (2007) A. Pautrat, C. Simon, C. Goupil, P. Mathieu, A. Brûlet, C. D. Dewhurst, and A. I. Rykov, Phys. Rev. B 75, 224512 (2007), URL https://link.aps.org/doi/10.1103/PhysRevB.75.224512.
- Petrović et al. (2009) A. P. Petrović, Y. Fasano, R. Lortz, C. Senatore, A. Demuer, A. B. Antunes, A. Paré, D. Salloum, P. Gougeon, M. Potel, et al., Phys. Rev. Lett. 103, 257001 (2009), URL https://link.aps.org/doi/10.1103/PhysRevLett.103.257001.
- Suderow et al. (2014) H. Suderow, I. Guillamón, J. G. Rodrigo, and S. Vieira, Supercond. Sci. Technol. 27, 063001 (2014).
- Marziali Bermúdez et al. (2015) M. Marziali Bermúdez, M. R. Eskildsen, M. Bartkowiak, G. Nagy, V. Bekeris, and G. Pasquini, Phys. Rev. Lett. 115, 067001 (2015), URL https://link.aps.org/doi/10.1103/PhysRevLett.115.067001.
- Zehetmayer (2015) M. Zehetmayer, Scientific Reports 5, 9244 (2015), ISSN 2045-2322, URL https://doi.org/10.1038/srep09244.
- Chandra Ganguli et al. (2015) S. Chandra Ganguli, H. Singh, G. Saraswat, R. Ganguly, V. Bagwe, P. Shirage, A. Thamizhavel, and P. Raychaudhuri, Scientific Reports 5, 10613 (2015), ISSN 2045-2322, URL https://doi.org/10.1038/srep10613.
- Toft-Petersen et al. (2018) R. Toft-Petersen, A. B. Abrahamsen, S. Balog, L. Porcar, and M. Laver, Nature Communications 9, 901 (2018), ISSN 2041-1723, URL https://doi.org/10.1038/s41467-018-03267-z.
- Aragón Sánchez et al. (2019) J. Aragón Sánchez, R. Cortés Maldonado, N. R. Cejas Bolecek, G. Rumi, P. Pedrazzini, M. I. Dolz, G. Nieva, C. J. van der Beek, M. Konczykowski, C. D. Dewhurst, et al., Comm. Phys. Nat. 2, 143 (2019).
- Llorens et al. (2020b) J. B. Llorens, L. Embon, A. Correa, J. D. González, E. Herrera, I. Guillamón, R. F. Luccas, J. Azpeitia, F. J. Mompeán, M. García-Hernández, et al., Phys. Rev. Res. 2, 013329 (2020b), URL https://link.aps.org/doi/10.1103/PhysRevResearch.2.013329.
- Fasano and Menghini (2008) Y. Fasano and M. Menghini, Supercond. Sci. Tech. 21 (2008).
- Koblischka et al. (1995) M. R. Koblischka, R. J. Wijngaarden, D. G. de Groot, R. Griessen, A. A. Menovsky, and T. W. Li, Phys. C 249, 339 (1995).
- Herbsommer et al. (2001) J. Herbsommer, V. Correa, G. Nieva, H. Pastoriza, and J. Luzuriaga, Solid State Comm. 120, 59 (2001), ISSN 0038-1098, URL https://www.sciencedirect.com/science/article/pii/S0038109801003490.
- Maggio-Aprile et al. (1997) I. Maggio-Aprile, C. Renner, A. Erb, E. Walker, and Ø. Fischer, Nature 390, 487 (1997).
- Fasano et al. (1999) Y. Fasano, J. Herbsommer, and F. de la Cruz, Phys. Stat. Sol. (b) 215, 563 (1999).
- Fasano et al. (2003) Y. Fasano, M. De Seta, M. Menghini, H. Pastoriza, and F. De la Cruz, Solid State Communications 128, 51 (2003), URL https://doi.org/10.1016/S0038-1098(03)00645-8.
- Barabasi et al. (1995) A. L. Barabasi, H. E. Stanley, and L. M. Sander, Phys. Today 48, 68 (1995), ISSN 1945-0699, URL http://dx.doi.org/10.1063/1.2808215.
- Emig and Nattermann (2006) T. Emig and T. Nattermann, Phys. Rev. Lett. 97, 177002 (2006), URL https://link.aps.org/doi/10.1103/PhysRevLett.97.177002.
- Petković et al. (2009) A. Petković, T. Emig, and T. Nattermann, Phys. Rev. B 79, 224512 (2009), URL https://link.aps.org/doi/10.1103/PhysRevB.79.224512.
- Giamarchi (2004) T. Giamarchi, Quantum physics in one dimension, International series of monographs on Physics (Clarendon Press, Oxford, 2004), URL https://cds.cern.ch/record/743140.
- Nattermann and Scheidl (2000) T. Nattermann and S. Scheidl, Adv. in Phys. 49, 607 (2000).
- Torquato (2016) S. Torquato, Phys. Rev. E 94, 022122 (2016), URL https://link.aps.org/doi/10.1103/PhysRevE.94.022122.
- Correa et al. (2001) V. F. Correa, E. E. Kaul, and G. Nieva, Phys. Rev. B 63, 172505 (2001), URL https://link.aps.org/doi/10.1103/PhysRevB.63.172505.
- de la Cruz et al. (1994) F. de la Cruz, D. López, and G. Nieva, Philos. Mag. B 70, 773 (1994).
- Fasano et al. (2005) Y. Fasano, M. De Seta, M. Menghini, H. Pastoriza, and F. de la Cruz, Proc. Nat. Acad. Sci. USA 102, 3898 (2005), ISSN 0027-8424, URL https://www.pnas.org/content/102/11/3898.
- Bolecek et al. (2016) N. R. C. Bolecek, A. B. Kolton, M. Konczykowski, H. Pastoriza, D. Domínguez, and Y. Fasano, Phys. Rev. B 93, 054505 (2016), URL https://link.aps.org/doi/10.1103/PhysRevB.93.054505.
- Marchetti and Nelson (1993) M. C. Marchetti and D. R. Nelson, Phys. Rev. B 47, 12214 (1993), URL https://link.aps.org/doi/10.1103/PhysRevB.47.12214.
- Bustingorry et al. (2010) S. Bustingorry, A. B. Kolton, and T. Giamarchi, Phys. Rev. B 82, 094202 (2010), URL https://link.aps.org/doi/10.1103/PhysRevB.82.094202.
Acknowledgements
We thank Thierry Giamarchi for stimulating discussions.
This work was supported by the Argentinean National Science Foundation (ANPCyT) under Grants PICT 2017-2182 and PICT 2018-1533; by the Universidad Nacional de Cuyo research grants 06/C566 and 06/C575; and by Graduate Research fellowships from CONICET for J. R. P., F. E., J. A. S., R. C. M., G. R. and N. R. C. B.
Author contributions
Y.F. and A.B.K. designed research and discussed the general method to analyze the data, Y. F. and R.C.M. performed measurements, G.N. and P. P. grew samples, F. E. and A. B. K. performed simulations and theoretical calculations, J. R. P., F. E., J.A.S., G. R., A. B. K. and Y.F. analyzed data; all authors discussed the data analysis and interpretation; Y.F. and A.B.K. wrote the paper.
Competing interests
The authors declare no competing interests.
Additional information
Correspondence and requests for materials should be addressed to Y.F.