Modeling Political Activism around Gun Debate via Social Media
Abstract.
The United States have some of the highest rates of gun violence among developed countries. Yet, there is a disagreement about the extent to which firearms should be regulated. In this study, we employ social media signals to examine the predictors of offline political activism, at both population and individual level. We show that it is possible to classify the stance of users on the gun issue, especially accurately when network information is available. Alongside socioeconomic variables, network information such as the relative size of the two sides of the debate is also predictive of state-level gun policy. On individual level, we build a statistical model using network, content, and psycho-linguistic features that predicts real-life political action, and explore the most predictive linguistic features. Thus, we argue that, alongside demographics and socioeconomic indicators, social media provides useful signals in the holistic modeling of political engagement around the gun debate.
1. Introduction
The issue of gun control vs. gun rights is a long-standing controversy in the United States.111http://www.nytimes.com/interactive/2017/10/05/upshot/gun-ownership-partisan-divide.html On the one hand, the U.S. has one of the highest rates of gun-related deaths among developed OECD countries (Grinshteyn and Hemenway, 2016). On the other hand, the right to own guns is constitutionally protected by the United States Bill of Rights (the first ten amendments of the U.S. constitution). The picture is, however, heterogeneous across the different states; states with more permissive gun laws and greater gun ownership have higher rates of mass shootings (Reeping et al., 2019). There have been numerous attempts at understanding the reason behind this deep ideological divide in the population (Kalesan et al., 2016; Chemerinsky, 2004). Gun control advocates typically blame gun violence on the pervasive presence and availability of guns. Conversely, gun rights supporters usually blame gun violence on other cultural issues such as the portrayal of violence in media, lack of family values, or mental health issues (Stone, 2015). Clearly, the issue of gun control vs. gun rights is a political and ideological one. This complex issue has been studied in various contexts, such as political (Chemerinsky, 2004), cultural (Kalesan et al., 2016), and news media (Stone and Socia, 2017). The intense debate has moved onto online–gun control has been considered as one of the most controversial issues presented social media and both views have been reinforced and propagated via social networks (Garimella et al., 2018b). Since Twitter has emerged as a model organism for studying controversial issues and political discourse (Conover et al., 2011; Garimella et al., 2018a; Grinberg et al., 2019; Barberá and Rivero, 2015; Romero et al., 2011; Mejova et al., 2015), and forecasting offline activism (Ertugrul et al., 2019), it provides a great opportunity to study and better understand the gun control political activities.
In this study, we explore the factors related to this ideological divide through the lens of digital debate and offline political action. We combine existing political science theories, the latest computational tools, and a large dataset of digital traces, to systematically study online social responses to mass shootings. Our aim is to examine simultaneously multiple aspects of political mobilization online, including the importance of network structure, content diversity, and emotion, alongside the standard demographic variables. Thus, we add online information to a holistic picture of the factors associated with political engagement in the gun debate.
To this end, we create a large Twitter dataset which encompasses the discussion in the aftermath of the deadliest mass shooting by an individual in U.S. history thus far—the 2017 Las Vegas shooting222https://en.wikipedia.org/wiki/2017_Las_Vegas_shooting where 59 people were killed and 412 wounded. As a result of this mass shooting, the U.S. justice department imposed new regulations that banned bump stocks, which allow to fire a semi-automatic weapon in rapid succession, thus mimicking an automatic one. A few months later, another mass shooting in Parkland, Florida333https://en.wikipedia.org/wiki/Stoneman_Douglas_High_School_shooting spurred the organization of the so-called “March for our lives”,444https://en.wikipedia.org/wiki/March_for_Our_Lives a nation-wide protest to ask for stricter gun control laws. This data captures the political mobilization these events have precipitated, thus making an examination its precedents possible.
Guided by previous work on sociology and psychology of political engagement, we design content, behavioral, and network features that can be extracted from Twitter. For instance, guided by Granovetter’s “embeddedness” argument (Granovetter, 1985), we compute various network features measuring clustering, assortativity, and connectivity, among others, for both groups and individuals. Additionally, following the recent work around ideological “echo chambers” (Conover et al., 2011; Garimella et al., 2018a), we capture the diversity of the discourse via network features and entropy of content elements such as hashtags, retweets, and unique words. Finally, we enrich this data by using geo-location coupled with socioeconomic census data and state-level voting statistics.
Using these features, we model outcomes at both collective (state) and individual level. First, we show that features extracted from Twitter are significant when modeling the gun policy of a state, even when controlling for other sociodemographic variables. Second, we illustrate that it is possible to predict individual attendance at the March for Our Lives based on public self-declaration, largely by using the content of their tweets before the event.
By introspecting both models, we are able to confirm the value of the signals coming from Twitter. For instance, in the state model, some of the most predictive variables are based on the Twitter network—remarkably, with a larger effect than the voting preferences of the state. Meanwhile, at the individual level tweet content features related to politics, emotion, and self-reference outperform demographic ones. Thus, we illustrate the usefulness of Twitter signals in modeling the online — and especially offline — political engagement, and thus contribute to the ongoing development of theory-driven big data methods for computational social science.
Crucially, beyond sociopolitical insights, this work brings critical ethical implications by revealing a risk for grassroots movements. All data collected in this study is publicly available, and no individual-level demographic information was used. Yet, on a filtered class-balanced dataset, we are able to predict whether an individual attends the March for Our Lives and makes their attendance known at F1 = % with off-the-shelf tools. While these users are a subset of those who attended the protest, the risk that predictive tools create is underestimated by many (Hinds et al., 2020). It is particularly significant in countries where democratic rights are not well-protected, and deserves to be better studied and understood. Thus, it is imperative to raise awareness of this vulnerability, which may drive the design of both digital platforms, and the political campaigns that use them.
2. Related Work
Social media has been acknowledged as an important part of mobilization and communication during political movements (Anderson et al., 2018). Below we outline some major directions in computational social science research of political organization on social media and provide related theories of the social and psychological mechanisms involved.
2.1. Social Media and Political Movements
Internet use has been linked to political involvement through several channels. First, social media may support civic education via strengthening existing ties and conveying political information through trusted networks (Tang and Lee, 2013; Xenos et al., 2014). Second, it may increase the chance of encountering information about a political organization (Lotan et al., 2011). Third, participation in political discussion may develop an interest in further involvement in political discourse (Halpern and Gibbs, 2013), as long as the experience of political deliberation on social media is positive and does not trigger conflict avoidance (Vraga et al., 2015). However, engagement on social media does not always translate into political activities requiring a greater commitment of resources and may be confined to low-resource engagement such as viewing debates and posting comments (so-called “slacktivism”) (Vitak et al., 2011).
From the early days of social media, blogging has created an outlet outside of mainstream media to bring new issues into the public debate and set alternative framings to ongoing debates. Despite their small readership, because media elites (editors, journalists, publishers) eventually began consuming political blog content in the early 2000s, online discourse started to have a broader impact on politics (Drezner and Farrell, 2004). The ensuing increased popularity of social media, as well as shortening of the posts —exemplified by Twitter’s 140 character limit—has allowed for increased democratization of political expression. Although early attempts at predicting political events such as elections have been met with skepticism in the research community (Metaxas et al., 2011; Gayo-Avello, 2012; Jungherr et al., 2012), a series of anti-government protests known as the Arab Spring, spurred new interest in the use of social media for political organization; some even coined the disputed shorthand “Twitter Revolution” for the early demonstrations in Tunisia, Libya, Egypt, and Syria (Lever, 2013).
A survey of media use by Egyptian protesters in early 2011 shows that more than a quarter of respondents first heard of the protests on Facebook, and a quarter used Facebook to disseminate pictures and videos they produced (Tufekci and Wilson, 2012). Conversely, those who used blogs and Twitter for both general information and for communicating about the protests were more likely to attend on the first day of the protests, though nearly half of the respondents first heard about the protests from someone face-to-face (Tufekci and Wilson, 2012). However, a content analysis found that, out of Twitter users participating in the discussions in Tunisia and Egypt, more than a quarter were institutional accounts, and among individuals, journalists and activists were the most common sources of information (Lotan et al., 2011), thus putting in question how many ordinary citizens took an active role. The repercussions of these movements continue to echo in the politics of the region and its expression on social media, with the accompanying research on the rise of ISIS (Magdy et al., 2016) and government messaging (Darwish et al., 2017).
Protest movements elsewhere in the world have also been captured on social media, including Spanish protests in May 2011 (González-Bailón et al., 2011), Occupy Wall Street in the fall of 2011-2012 (Conover et al., 2013b, a), and Black Lives Matter in 2014-2015 (Freelon et al., 2018). The latter work examines the power dynamic of ordinary citizens and the political elites and shows a stronger Granger causality with the activity by elite accounts following that by ordinary posters (Freelon et al., 2018). Despite the potential of global involvement, such movements tend to be highly localized, such as the Occupy Wall Street, during which users in New York, California, and Washington D.C. produced more than half of all retweeted content, and with content at local scale focusing on locations and timings of the events, while cross-state communication focusing on the core framing of the issue (Conover et al., 2013a). Beyond political movements, experimental studies show that social media messaging is effective in spurring political action, such as in a large Facebook study that shows informational messaging increases voter turnout for users who saw the message and for their friends (Bond et al., 2012). Survey-based studies often find supporting evidence of the relationship between social media use and political activism. A study of Chilean protests found that the effect of social media on the likelihood of political engagement is comparable to the influence of education and participation in civic groups (Valenzuela, 2013). A meta-analysis of such surveys in 2015 has found more than of coefficients to be positive (Boulianne, 2015), but these coefficients are slightly more likely to be statistically significant in well-established democracies, and in samples of youths. Thus, precisely which political actions, where, and by whom are more likely to be influenced by social media is an ongoing topic of debate.
2.2. Determinants of Political Engagement
Social media is, by far, not the only force behind political engagement. Indeed, strong demographic, socioeconomic, and ideological forces drive political activity, some of which we briefly outline below (for a more extensive discussion we refer the reader to political science literature (Opp, 2009)).
2.2.1. Demographics
In the previous years, the demographics of U.S. electorate has been changing markedly. The U.S. election in 2018 saw a marked increase in the rates of voters of racial minority groups, who were more likely to cast their ballots early by mail (Krogstad et al., 2019). Yet, there are still findings that strict identification laws suppress the turnout of black, hispanic, asian, and multi-racial groups (Hajnal et al., 2017) (although the quality of survey data has been criticized in this domain (Grimmer et al., 2018)). In the same year, for the first time Generation Z, Millennials, and Generation X voters outnumbered Baby Boomer and previous generations (Cilluffo and Fry, 2019). Ongoing changes in the socioeconomic status is also seen as a complex contributor to the participation in both in radical left and right parties (Rooduijn and Burgoon, 2018), and in populist movements (Van Hauwaert et al., 2019). The polarization among demographic lines is expanding, with race, gender, and education being increasingly associated with diverging political leanings (Tyson, 2018). In this work, we attempt to capture as many demographic and socioeconomic attributes of the social media users as possible in order to provide a strong baseline for modeling gun debate engagement.
2.2.2. Social Network
In “Social Structure and Citizenship” Scheufele et al. (2004) outline a framework of political engagement analysis that connects macroscopic sociological variables and individual-level behaviors, and illustrate via a national survey that a “social setting in which citizens discuss politics is an important antecedent of political participation.” Such research juxtaposes the traditional individual-level focus on “individual’s party identification, issue positions, ideology, and images of candidates” (Campbell et al., 1980), with the new works inspired by Granoveter’s “embeddedness” argument, which stresses “the role of concrete personal relations and structures (or networks) of such relations in generating trust and discouraging malfeasance” (Granovetter, 1985). An even earlier study of discussion networks (Leighley, 1990) shows increasing levels of discussion diversity (network heterogeneity) is linked to an increase in traditional forms of political participation. In particular, discussant conflict, to which degree the person is exposed to the conflicting opinions, is positively and strongly associated with voting and campaign activities. However, the size of a person’s network of political discussants is negatively related to voting, but positively to campaign activities.
Social media has provided an alternative avenue for analyzing social ties. For instance, Valenzuela et al. (2018) hypothesize that different social media platforms influence political participation differently. Their cross-sectional, face-to-face survey of a representative sample of Chilean youths shows that different platforms represent different types of social ties that may result in political activity, with Facebook friendships better capturing “strong” ties and Twitter followership “weak” ties (Granovetter, 1983). Moreover, social network use is associated with civic and political engagement, but also with the increased perception of social capital, even after taking into account demographics and news media use (Gil de Zúñiga et al., 2012). In yet another survey, respondents with larger Facebook networks also participated in politics more frequently, though the impact of network size was completely mediated by network structural heterogeneity and connection with public political actors (Tang and Lee, 2013). Online response to major events are also an opportunity to model political opinion formation. An et al. (2016) examine the response to the 2015 Charlie Hebdo newspaper shooting in the light of three theories: Clash of Civilizations that predicts social fault lines between major “civilizations” (Huntington et al., 1993), Density Theory that puts importance on the individual’s social context (Huckfeldt, 2009), and Interdependence Theory that further emphasizes the importance inter-personal relationships (Thibaut and Kelley, 1959). Combining information on user location, followership, and mention, they show a stronger support for the latter two theories.
Our models also include network features, such as size and heterogeneity, as well as user-specific features of centrality.
2.2.3. Ideology
Ideally, social media may be envisioned as a forum for “deliberation” (Habermas et al., 1991) wherein there is a “interchange of rational-critical arguments among a group of individuals, triggered by a common or public problem, whose main focus or topic of discussion is to find a solution acceptable to all who have a stake in the issue” (Halpern and Gibbs, 2013). However, even before social media, political campaigns have been seen as domains of “low information rationality” where “individuals rely on ideological heuristics or similar shortcuts instead of carefully collecting and selecting all available information” (Scheufele et al., 2004). Cognitive biases often prevent people from accurately perceiving information that contradicts their existing opinion. For instance, (MacCoun and Paletz, 2009) found that citizens, “especially those holding conservative beliefs, tended to attribute studies with liberal findings to the liberalism of the researcher, but citizens were less likely to attribute conservative findings to the conservatism of the researcher”. The resulting “echo chambers” are often seen in the structure of the communication networks on social media (Conover et al., 2011; Garimella et al., 2018a; Bakshy et al., 2015; Barberá et al., 2015). Inside these closed communities, the information spread is homogeneous and often biased, thus fostering homophilic attitudes (Cota et al., 2019; Garimella et al., 2017). Indeed, it has been shown that people prefer media that conforms with their attitudes in their daily media diet (Johnson et al., 2009), although not necessarily to the exclusion of opposing sources (Stroud, 2008). On social media, various factors contribute to the users’ content preferences, including endorsements from their social network (Winter et al., 2016) and personal relevance (Mummolo, 2016). To what degree the selective content consumption on social media is attributable to psychological or social tendencies, and what role recommender and search algorithms play in the potential reinforcement of these tendencies is difficult to measure, as the control over, and knowledge of, these algorithms are proprietary (Guess et al., 2018). We must note, however, that the communities displaying content and communication polarization which have been documented on Twitter represent a particularly partisan portion of the overall media consumption, since most of the news consumption takes place from the large mainstream sources (Nelson and Webster, 2017). Still, a 2021 Pew Research Center survey found that “[a] little under half (48%) of U.S. adults say they get news from social media ‘often’ or ‘sometimes”’ with Twitter being the second most popular website after Facebook (Walker and Eva Matsa, 2021). Monitoring whether the growing use of social media contributes to polarization on important societal issues is imperative to the understanding the deliberation process related to eventual policy decisions.
Ideological polarization is especially pronounced in the U.S. gun control debate —a 2016 Pew Research Center poll revealed that just 22 percent of self-identified Democrats chose protecting gun ownership rights, compared with the 76 percent of Republicans who did —a gap which has widened since 2007 mainly by Republicans adopting a stronger stand on the issue (Enten, 2017). In fact, although the question of gun legislation has not been a salient political issue until the 1960s (Crocker, 1982), in the 2000s it has become one of the most divisive issues between the U.S. Democrat and Republican parties (Kleck, 2017). Beyond the political partisanship, personal inclinations towards individualism as opposed to collectivism are associated with peoples’ attitudes toward gun ownership and gun control (Celinska, 2007). To which extent this hyper-polarization is revealed in social media debates, and how it is expressed via local gun regulation is an exciting research question. In this work, we attempt to include both political and gun-specific attitudes, as well as more general diversity in language, that may be related to political opinion and action.
2.3. Privacy concerns of tracking political movements
In early days, research on political movements on Twitter can alleviate the information asymmetries between protesters and authorities, such as protest locations, police locations, and police actions, which had been seen as ‘monopolized’ by the authorities (Earl et al., 2013). The danger of social media surveillance by authorities is also noted by Owen (2017) with several attempts to monitor protesters’ social media activity around Occupy protest. Since the Cambridge Analytica scandal (Hinds et al., 2020), the awareness of social media-based surveillance has also been permeating the public. According to the report by Pew Research in 2014 (Madden et al., 2014), most of the U.S. adults have heard about “the government collecting information about telephone calls, emails, and other online communications as part of efforts to monitor terrorist activity.” The awareness of government monitoring changes many internet users’ behaviors and practices by themselves (Barnard-Wills, 2012). Yet, many people share their offline political activities (e.g., attending a protest) on social media. The present study attempts to predict whether an individual attends the March for Our Lives (and makes their attendance known) by using public Twitter data only. Our results thus warn of the potential risk that those users can be identified with high accuracy, even when they do not explicitly declare their intentions ahead of time.
3. Methods
Below we describe the steps taken for collecting the data from Twitter, user filtering, and stance classification using network and content information. We then describe the multifaceted modeling of the two sides of the debate, as well as the individuals within, using demographics extracted from the U.S. Census, Twitter attributes, network features, and linguistic features including sentiment and hate speech. In particular, we consider two tasks: (1) at the state level, modeling strictness of the state’s gun laws, and (2) at the user level, predicting public disclosure of participation to the “March for our Lives”,555https://marchforourlives.com a student-led demonstration in support of gun control laws.
3.1. Data
We collect tweet data using Twitter’s Streaming API from Oct 1, 2017 to May 1, 2018 using the keywords gun, guns, and nra (National Rifle Association). The collection resulted in capturing tweets written by users. This time span includes the social responses after the Las Vegas mass shooting which happened on October 1, 2017 and the subsequent March for our Lives held on March 24, 2018.
3.2. User Selection
As Twitter is notorious for having automated accounts (bots) (Davis et al., 2016), we apply a number of filters to ensure that the accounts to be examined are not automated, and have enough activity to be modeled. Additional filters were applied to make sure the geo-location of the users was reliable, by ensuring the user has tweeted at least twice from the same state. The filters below result in users, who posted tweets.
-
•
Exclude users with one tweet in our dataset.
-
•
Exclude top 0.1% of users by number of tweets in our dataset.
-
•
Exclude users with fewer than 5 followers and 5 friends.
-
•
Exclude users whose friends to followers ratio is more than 10 (inspired by (Wang, 2010)).
-
•
Exclude users whose account is less than 1 year old.
-
•
Exclude those not having at least 1 English tweet in our dataset.
-
•
Exclude users whose location cannot be mapped to one of U.S. states (or DC).
-
•
Exclude users who do not have more than one tweet from the same state.
Geo-location is performed firstly by using the GPS coordinates embedded in a tweet (a small minority of tweets have such metadata), and secondly, by using Yahoo! Placemaker API666https://www.programmableweb.com/api/yahoo-placemaker applied to the location field of the user profile. The returned geo-mappings by the geo-location service were manually checked for the most popular locations in the dataset to ensure the correct outcome for most of the users.
3.3. Stance Classification
In order to classify the stance of the captured users on the gun issue (as either pro gun rights or pro gun control), we employ two sources of information: (1) the retweet action, as it usually indicates agreement with another user, and (2) the content of the user’s tweets, as it conveys the actual stance of the user.
Following previous work on controversy on social media (Garimella et al., 2016), we build an endorsement graph in which users are mapped into nodes and retweets are mapped into (directed) edges, weighted by the number of times one user has retweeted another. We apply a threshold of 2 on the edges to reduce noise, or in other words, we eliminate one-time retweet relationship from the graph. We then use the graph partitioning algorithm METIS (Karypis and Kumar, 1998) to partition the network into two groups. We partition the graph repeatedly =100 times with different random seeds to get an ensemble of partition assignments for each node, and use the average partition assignment for each node (i.e. user) across the repetitions as a polarity score (Cossard et al., 2020).777We optimize the parameter indicating the relative size of the two sides by maximizing the number of users within 95% confidence interval of either extreme, finding the optimal proportion to be 1.5 to 1, with gun control being the larger side. The partitioning obtained by METIS with 2 partitions has a modularity of . As a comparison, partitioning the same graph with the Louvain algorithm (Blondel et al., 2008) achieves a modularity of with a number of partitions larger than 100k. The small difference between the two modularity scores confirms that this approach captures the main structure within the graph. As the algorithm does not indicate the actual stances of the users (in fact, it uses no tweet content information whatsoever), each partition is assigned its leaning manually, by examining 10 sampled users on each side. In other words, the leaning of the sampled users is then “propagated” to all users within their partition.
As the graph partitioning algorithm partitions the giant connected component (GCC) only, for those users who are not in the GCC of the retweet network, we train a content-based classifier on users who have been classified. After under-sampling the majority class (pro gun control) to balance the dataset, the vocabulary is constructed by removing stop words and punctuation. We test three classifiers, including Support Vector Machines, Naive Bayes, Logistic Regression, and Random Forest, by using 5-fold cross-validation. Naive Bayes using frequency-based vectorizer performs the best, and achieves 99.4% accuracy during cross-validation on users classified by using the retweet network. We then apply this classifier to the unlabeled users —those not in GCC of the retweet network— with the class membership determined by using 1% error threshold (users with a probability greater than 0.99 or smaller than 0.01 are assigned with the label).
3.4. Model 1: State Gun Laws
Our first model addresses the question—how does the Twitter gun debate relate to the gun control political activity, as measured via gun laws passed in each state? We define the target variable as the strictness of gun laws in a state, encoded as a rating from (most strict) to (most friendly) extracted from Guns To Carry,888https://www.gunstocarry.com/gun-laws-state a resource that summarizes the laws around the country, which we have also verified with additional information on each state’s laws.999https://statelaws.findlaw.com/criminal-laws/gun-control.html For example, in 2019 California was one of the most restrictive states, requiring permits both for handguns and long guns, and allowing open carry only in some counties (it has a rating of ). Kansas, on the other hand, requires no permits or registration, and allows open carry, and has a rating of .
The independent variables are meant to capture the peculiarities of the gun debate on Twitter for a particular state. In order to tease out the relationship between Twitter and state laws, we employ several controls, including demographic composition of the state, socio-economic and wellbeing indicators, gun culture (as measured by gun sales), and political inclination of the population. The features, computed for each state, are listed in Table 1. All the features have been standardized and transformed to make them approximately normal, so that the coefficients of the model can be compared. Demographic and socio-economic information come from 2018 County Health Rankings,101010https://www.countyhealthrankings.org a resource which combines official census and health statistics from U.S. governmental agencies. The gun sales variable is obtained as a proxy from the FBI National Instant Criminal Background Check (NICS) database.111111https://www.fbi.gov/services/cjis/nics Political inclination is measured as the percentage of the state’s population that has voted for a Republican candidate in the 2016 U.S. Presidential Election.121212https://ballotpedia.org/Voter_turnout_in_United_States_elections The Twitter Network variables are computed both for all users within the state, and for the communities on the two sides of the debate. The number of nodes, edges, clustering coefficient, and density are also computed on the out-edge induced subgraph in order to capture interactions with entities outside the given state. Finally, Twitter Content and Account features are computed as averages over the users in the state, as well as for the two communities separately. The hate dictionary comes from Hate Base project131313https://hatebase.org and sentiment lexicon from Dodds et al. (2011). We also compute the average number of retweets, hashtags, and unique words used (vocabulary), as well as the entropy of the distribution of usage (which measures, intuitively, the diversity in behavior of the users). Twitter Account variables include average user follower and friend (“followee”) counts, as well as daily tweet rate when considering all tweets, those about guns, and those in English.
As there are only 51 data points (50 states and Washington DC) in the dataset, we apply several steps to decrease the number of variables. We begin by computing univariate correlations between the features and the target variable, and select only variables having Pearson correlation with a magnitude of at least . We then perform a Variance Inflation Factor (VIF) multicollinearity check, and remove variables with the highest VIF until all variables have a VIF of under . The resulting 18 variables are then used to build a Structural Equation Model (SEM) (Hoyle, 1995; Hox and Bechger, 1998) that relates each of these variable groups to the outcome variable of state gun law rating, described above. We choose SEM instead of a simple linear regression because the variable groupings alleviate some of the multicollinearity of the data. We use the Latent Variable Analysis (lavaan) R library141414http://lavaan.ugent.be to fit the parameters of the model.
| Demographics | Twitter Network |
| perc under 18 | nodes (+EIG), edges (+EIG) |
| perc 65 and over | clustering coefficient (+EIG) |
| perc African American | density (+EIG) |
| perc Asian | max edge weight |
| perc Hispanic | degree assortativity |
| perc non Hispanic white | Gini coefficient of in-degree |
| perc rural | node proportion deviation |
| Socio-Economic | Twitter Content |
| high school graduation rate | retweet count |
| perc some college | retweet entropy |
| perc unemployment | hashtag count |
| income inequality ratio | hashtag entropy |
| perc uninsured | vocabulary count |
| perc single parent households | vocabulary entropy |
| perc association rate | hate word rate |
| violent crime rate | avg sentiment polarity |
| perc severe housing problems | |
| median household income | Twitter Behavior |
| residential segregation black white | user followers count |
| homicide rate | user friends count |
| follower/friend ratio | |
| Health | account age |
| mentally unhealthy days | gun tweet rate |
| perc adult smoking | allt weet rate |
| perc adult obesity | gun tweet count |
| perc excessive drinking | English tweet count |
| Politics & Gun Culture | Target |
| gun sales | gun law rating |
| firearm fatalities rate | |
| perc vote republican |
3.5. Model 2: Individual March Attendance
Our second model considers the individual – is it possible to predict individuals who will publicly engage in offline political protests by using their prior online activity? We operationalize political engagement in offline protests by considering individuals who have left tweets to indicate that they have attended one of the “March for Our Lives” events held across the United States on March 24, 2018.151515https://en.wikipedia.org/wiki/List_of_March_for_Our_Lives_locations As mentioned in Section 1, this experiment also aims to call attention to potential risks that protesters, even those who do not publicly declare their attendance, can be identified by prior online activities, a risk still underestimated by many (Hinds et al., 2020).
Specifically, we select tweets (original, not retweets) which have geo-location or match the regular expressions “I am going to” or “I am at”, posted on the day of the march. To make sure the tweets are of people attending the march, we employ the CrowdFlower crowdsourcing platform (now called Appen) to label whether the user has indeed attended the march, or just tweeted in support or opposition. The task is fairly easy, with annotator agreement (measured via label overlap) high at 92%; 310 labelers participated in the task, with final label determined via majority rule over 3 labels from different annotators, for each tweet. The resulting unique users are identified as having declared attending a march, although only pass the user filtering steps described in Section 3.2. Out of these, vast majority were identified as pro gun control (99%) and only 7 as pro gun rights. To provide an even comparison of these users to those who were not detected to have attended the march, we perform a random sampling of the rest of the users, stratified by state in proportion to the original distribution of the dataset, which results in a control set of 610 users.
The features, computed on the tweets posted prior to the march, largely overlap with those listed in Table 1. The demographic features are taken in accordance to the county in which the user has been detected to have tweeted the most. The Twitter network features, however, change as they concern an individual node—these are listed in Table 2. Additionally, we include the lexical categories of Linguistic Inquiry and Word Count (LIWC),161616http://liwc.wpengine.com a listing of keywords with associated psychologically meaningful categories, 73 in total, including those concerning general grammar use (pronouns, articles, prepositions), emotion (positive, negative), and topics including body, feeling, work, and leisure. While there are several efforts to improve LIWC by using modern NLP techniques (Fast et al., 2016), we use LIWC because its broad applicability has been proven across a wide range of domains (Tumasjan et al., 2010; Abbar et al., 2015; An et al., 2019). We remove features that do not have any value for more than half of the users, and then removed rows with any missing values, resulting in a dataset of users ( of which attended the March For Our Lives). The full list of features can be found in the Appendix A. We use three widely-used models for prediction: Support Vector Machine (SVM) with linear kernel, Logistic Regression (LR), and Random Forest (RF). For SVM, we set the parameter values as =1.0, kernel=‘linear’, gamma=‘scale’, class_weight=‘balanced.’ For LR, we set the parameter values as =1.0, penalty=‘l2’, class_weight=‘balanced.’ For RF, we set the parameter values as n_estimators=10, criterion=‘gini,’ min_samples_split=2, class_weight=‘balanced.’ Since the two classes are slightly imbalanced, we re-weight the classes inversely proportional to their frequency: , where is the weight to class , is the number of observations, is the number of observations in class , and is the total number of classes, which is 2 in our case. The precision, recall, and F1 measures are then computed via 5-fold cross-validation.
| indicator whether in GCC | personalized PageRank |
| in-degree | clustering coefficient |
| out-degree | avg in-neigh in-degree |
| max in-edge weight | avg out-neigh in-degree |
| max out-edge weight |
3.6. Data Availability
Due to Twitter Terms of Service we cannot publish the entire dataset (as tweets which may have been removed by their poster may still be in the data). Instead, the terms allow to share a list of the numeric IDs of tweets which can be re-collected. We will make it available to the research community upon request. In addition, we will make public all labeled data used for validation of the classifiers.
4. Results
4.1. User Classification
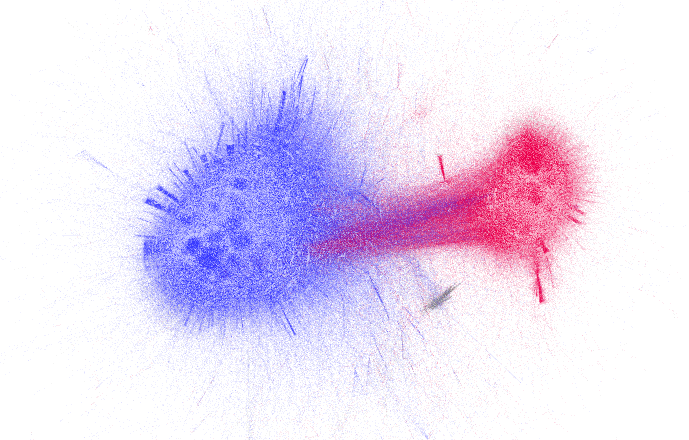
The endorsement (retweet) network and its partitioning by METIS (Karypis and Kumar, 1998) are shown in Figure 1, wherein a force-directed layout is used to position the nodes. Out of the users in the giant connected component (GCC) of the retweet network, (65.1%) are classified as pro gun control and (34.9%) as pro gun rights. As visible in the figure, the two sides occupy distinct closed communities, with few links between the partitions. In order to evaluate the performance of this network-driven classification approach, four authors manually labeled 200 random users (100 from each side). The classifier accuracy is 96% on this manually-labeled test set. Annotator agreement, measured by label overlap, is extremely high at 98%, thus indicating that users in the center of the retweet activity are fairly easy to classify.
The users labeled by using the network method are then used to train a content-based classifier, as described in Section 3. We apply the classifier to the users who were not included in the GCC of the retweet network, and find a total of () pro gun control and () pro gun rights users. The remaining who do not pass the threshold are labeled as “unknown” and excluded from the further analysis. To evaluate the performance of this content-based classifier, the authors manually label 200 random users into three groups: pro gun control, pro gun rights, and unknown inter-annotator agreement for this task is high, with a Cohen’s kappa of ). Our content-based classifier achieves an overall accuracy of . Compared to a random baseline, which would achieve accuracy, this result makes the content-based classifier closer to a perfect classifier (i.e., its kappa statistic is (Bifet et al., 2015)). If we consider our content-based classifier as a quantification tool to understand the proportion of different classes in the dataset, this proportion is very close to the “true” proportion (taken from the manual labels). Performing test, we cannot reject the null hypothesis that the distributions are the same (), which implies that they are very close.
As an exploratory analysis, we characterize pro gun control and pro gun rights groups by investigating unigrams that are over-represented in each group. To compute the over-representation, we use log-odds ratios with informative Dirichlet priors (Monroe et al., 2008) computed by using background word frequency on the entire dataset. The 50 most over-represented words (whose frequency is larger than 100k) for pro gun control and pro gun rights users are presented in Table 3. On the gun control side, the most prominent is a person: Shannon Watts (shannonrwatts) is a founder of MomsDemand (MomsDemand), a grassroots movement of Americans “demanding reasonable solutions to address our nation’s culture of gun violence” (quoted from account description). Others are popular hashtags referring to the gun control movement (MarchForOurLives and NeverAgain), politics (GOP, congress, reform, Trump), and the shooting (violence, teacher, Sandy, Hook). On the gun rights side, the most prominent is Broward, a county in Florida at the center of a local law debate on limiting the sale of large-capacity magazines,171717https://www.nytimes.com/2018/03/08/us/florida-gun-bill.html mentions of other political entities (Hillary, Israel, POTUS), media channels (NRATV, CNN), and mentions of the second amendment. Note that both sides mention political entities from the other side: GOP (Republican party) by gun control side, and (Hillary) Clinton from gun rights side, which indicates a pointed attention across party lines we do not see in retweet behavior.
| Gun control | Gun rights |
| shannonrwatts, violence, gop, marchforourlives, prayers, krassenstein, students, white, thoughts, funder, congress, neveragain, reform, teacher, emma4change, trump, money, republicans, sandy, teachers, health, hook, today, douglas, edkrassen, children, momsdemand, survivors, cameron_kasky, fucking, change, fuck, joyannreid, lobby, mikel_jollett, stoneman, kylegriffin1, mental, enough, russian, sayshummingbird, igorvolsky, days, nowthisnews, sarahchad_, speakerryan, longlivekcx, proudresister, action, stephenking | broward, defend, hillary, member, facts, nratv, hate, israel, cnn, owners, amendment, members, tomilahren, security, push, firearm, smoking, county, truth, knew, murder, government, potus, evil, advocates, constitution, blaming, murders, used, cruz, shooters, 2nd, didn, second, drugs, problem, themselves, firearms, away, attack, ever, protect, gt, california, shooter, freedom, carry, rate, or, membership |
4.2. Model 1: State Gun Laws
Next, we turn to modeling the state’s gun laws by using characteristics of Twitter conversation about gun control, as well as demographic and socio-economic controls. The features spanning demographics, socio-economic, health, and culture, as well as Twitter-derived ones (listed in Table 1) are aggregated per state, and several feature selection steps have been applied to limit the number of variables. We build a Structural Equation Model (SEM), with the variables used as indicators for six intermediate latent variables, as shown in Figure 2. Given the small number of items in the dataset (51 states), the fit statistics show the variables only partially explain the data, with Root Mean Square Error of Approximation (RMSEA) at (whereas commonly desirable values are below (Hu and Bentler, 1999)). We thus exclude the significance values in the figure and examine the coefficients only. Intuitively, the effect strength of one variable on the outcome is a combination of all of the coefficients along all of the paths to the dependent variable. Based on related literature (Opp, 2009; Tyson, 2018; Leighley, 1990; Kleck, 2017), we also introduce effects between the latent variables, mainly linking demographics, economics, and health on one side, and gun culture, political culture, and Twitter network on the other. Finally, despite the structure of the model, the resulting relationships should be thought of as correlational, and not causal.
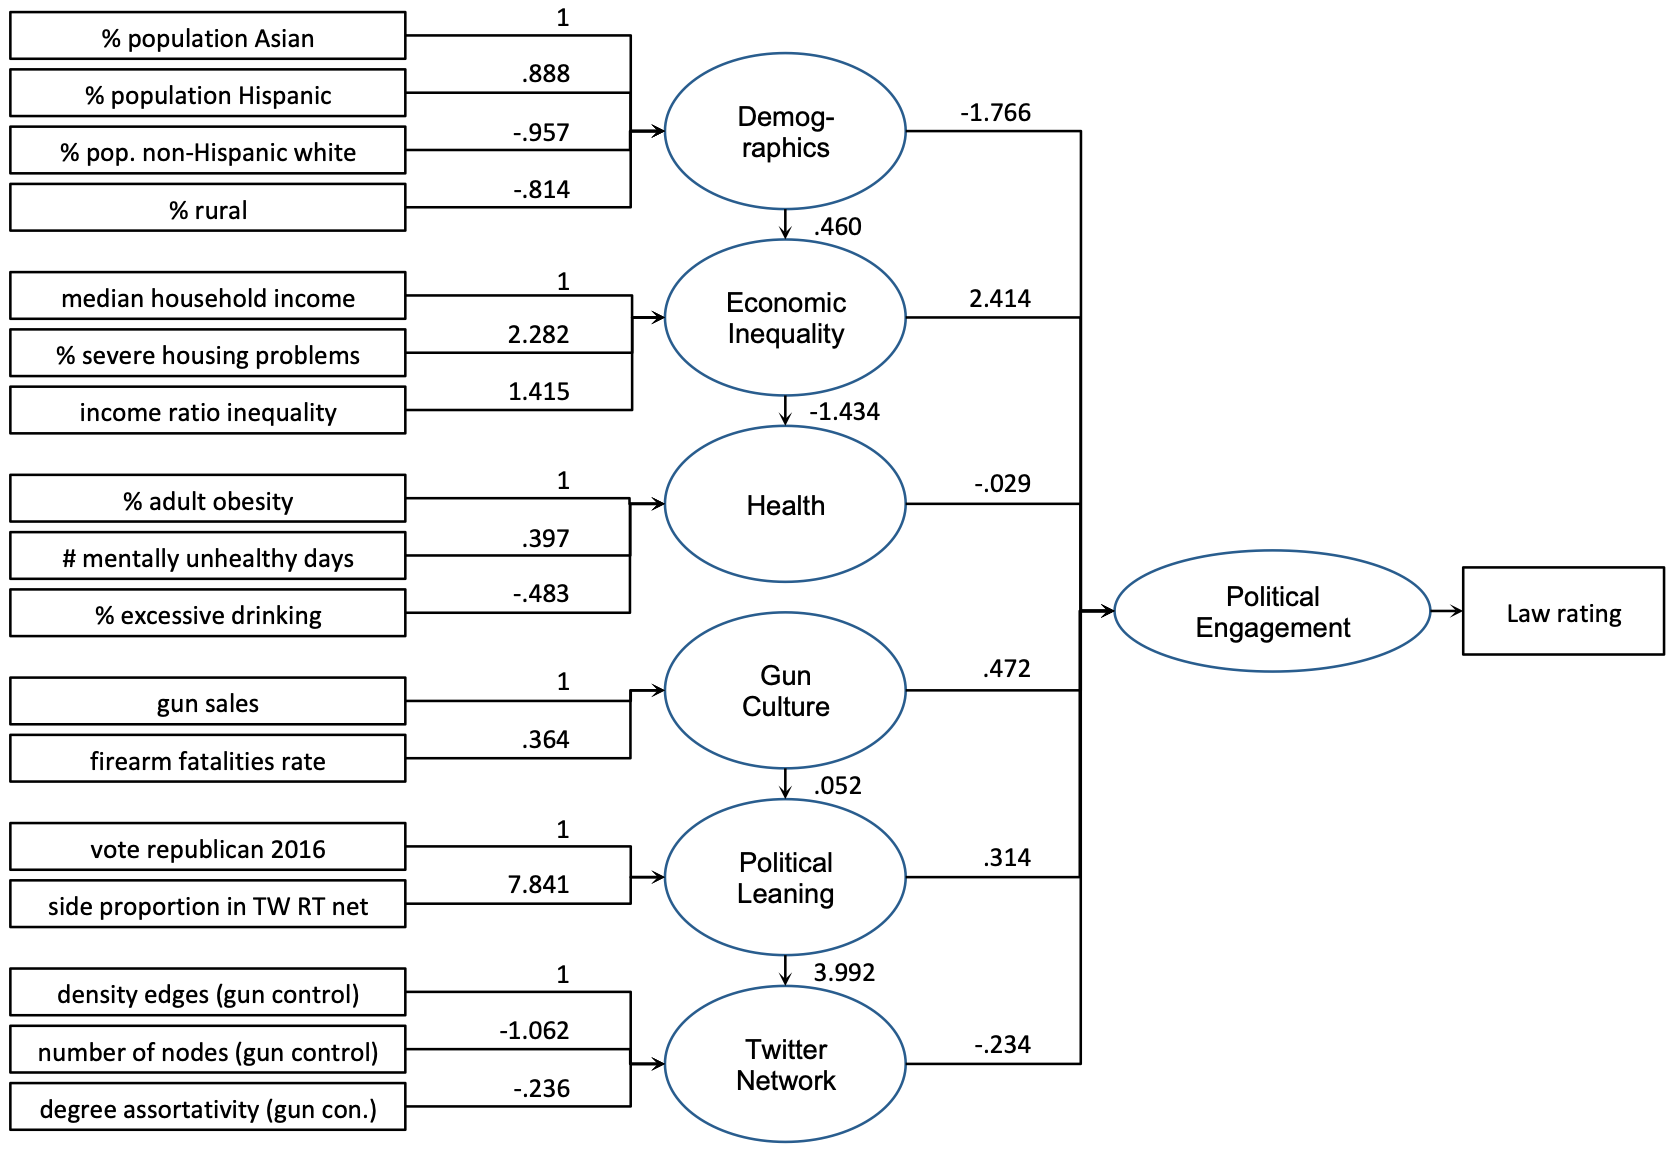
First, we remind the reader that the higher gun law rating in a state, the fewer restrictions there are on gun ownership, and the more successful is the gun rights side. Demographics and social inequality latent variables show the strongest coefficients when relating to the law rating. In particular, percentages of Asian and Hispanic population have negative effect (more gun control), and percentages of non-Hispanic white and rural population have positive effect (more gun rights), with about same magnitude. The strongest effect is by economic variables, especially percentage of severe housing problems (struggling with overcrowding, high costs, or lack of facilities) and income inequality, both associated positively with gun law rating (more gun rights). These effects are stronger than that of the median income, and much stronger than the demographic ones. Health-related variables have the least effect on the gun laws, possibly because the demographic and economic dimensions of these variables are already accounted for (note the strong relationship between economic inequality and health). On the cultural side, while we find gun sales and firearm fatalities to be positively associated with the gun law rating (more gun rights), these gun-related variables have a very slight effect on the political leaning latent variable. Instead, we find a strong relationship between the political leaning and the Twitter network latent variables, and here also find the strongest effect in the model: proportion of nodes on gun rights side in Twitter retweet network, which is 7 times stronger than the proportion of population who voted for Republican. Finally, the rest of the Twitter-related indicators show a negative relationship with gun law ratings. We find that Twitter retweet networks of users identified to be on gun control side with higher edge density and lower number of nodes and lower assortativity (smaller communities with star-like structures) are associated with gun control laws.
In summary, we find socio-economic and demographic variables to be some of the most predictive of law ratings in a state. However, we also discover a strong predictor from Twitter: the proportion of nodes in the two sides of the Twitter debate, with the higher proportion of gun rights to gun control, the higher the gun law rating of the state.
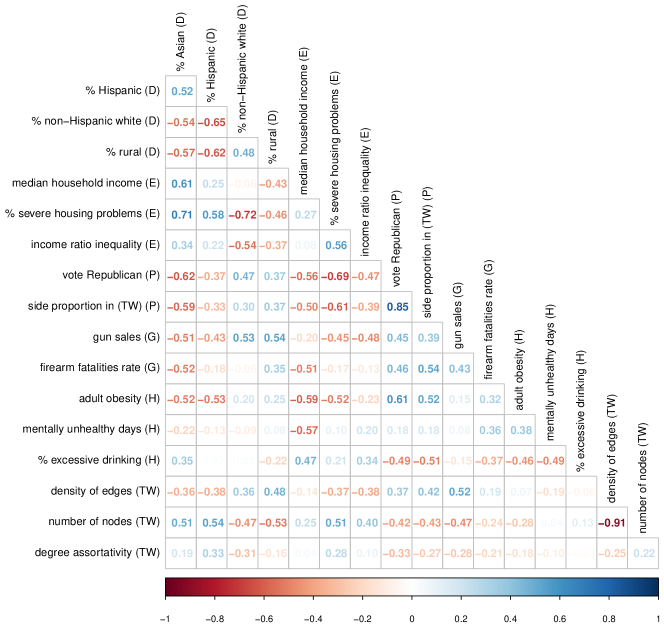
Although we are constrained from making statistical significance claims due to the data size, we perform several checks in other to ascertain the importance of the features. Table 4 shows the model fit measured using Multiple R2 for a OLS regression models using subsets of features discussed above. The left column shows the fit of models using features of only one group, and right column that of models which use all features except those in a group. The best single-group model contains the Demographic variables, followed by Gun Culture, and Economic Inequality. Whereas Twitter Network features provide the least information (similarly to Health features), when all Twitter features are considered (including those used to measure the political leaning of the state), the model achieves R2 = . When considering the ablation experiments in the right column, we find that no exclusion of a single group of features brings the fit down substantially. Thus, we explore the relationship between the variables in Figure 3 with a correlation matrix among the features. Indeed, we find several striking relationships, including those between demographic and gun-related variables and Twitter-related ones. For instance, the proportion of retweet network that is pro-gun rights is positively related to higher proportion of votes for Republican party ( = ) and negatively to the median household income ( = ). Furthermore, the proportion of rural areas in the state is positively related to the density of nodes in the retweet network ( = ), and negatively to the number of nodes ( = ). Thus, it is possible that the retweet network captures some of the relevant demographic and gun-culture specific attributes of the states.
| Feature group | Group Only | Group Excluded | ||
|---|---|---|---|---|
| Full model | 0.658 | *** | 0.658 | *** |
| Economic Inequality | 0.440 | *** | 0.632 | ** |
| Demographic | 0.492 | *** | 0.626 | *** |
| Political Leaning | 0.370 | *** | 0.639 | ** |
| Gun Culture | 0.453 | *** | 0.597 | * |
| Health | 0.163 | . | 0.655 | *** |
| Twitter (all) | 0.331 | *** | 0.638 | *** |
4.3. Model 2: Individual March Attendance
Next, we turn to examining the predictors of political engagement on the individual scale, in particular, predicting whether an individual declares one’s attendance to the March for Our Lives on March 24, 2018. Table 5 shows the performance of the three classifiers – Support Vector Machine, Logistic Regression, and Random Forest – when using all features, estimated via 5-fold cross-validation. The best performance in terms of F1 score is achieved by Logistic Regression at F1, mainly by having the best recall of the three (). Hence, we use Logistic Regression model for the rest of the analyses.
| Accuracy | Precision | Recall | F1 | |
|---|---|---|---|---|
| Support Vector Machine | 0.801 (0.021) | 0.829 (0.023) | 0.781 (0.038) | 0.804 (0.023) |
| Logistic Regression | 0.802 (0.019) | 0.822 (0.021) | 0.794 (0.042) | 0.807 (0.022) |
| Random Forest | 0.793 (0.006) | 0.811 (0.002) | 0.788 (0.013) | 0.799 (0.007) |
To deepen our understanding on which set of features have more predictive power, we conduct an ablation study of the proposed feature sets. Table 6 shows the results of prediction models based on different set of features. First, when focusing on individual feature sets, we find that ‘Twitter Content (C)’ feature set alone achieves a high prediction performance with F1. Then, the following three feature sets: Twitter Behavior (B), LIWC (L), and Demographics (D) marginally improve the model performance (0.011, 0.002, 0.010, respectively) when added to the model. The other features sets, such as Socio-Economics (S), Health (H), Politics - Gun Culture (P), and Twitter Network (N), in fact, degrades the model performances. The model with the four feature sets (CBDL) shows the best prediction performance with F1, which is higher than the model with all features. Next, we use the best model (CBDL) to investigate which features are most important in predicting individual political engagement.
| Feature sets | Accuracy | Precision | Recall | F1 |
|---|---|---|---|---|
| Twitter Network (N) | 0.569 (0.011) | 0.633 (0.015) | 0.422 (0.047) | 0.504 (0.032) |
| Politics - Gun Culture (P) | 0.585 (0.022) | 0.616 (0.020) | 0.545 (0.045) | 0.578 (0.032) |
| Health (H) | 0.599 (0.031) | 0.629 (0.032) | 0.567 (0.049) | 0.596 (0.038) |
| Socio-Economics (S) | 0.604 (0.037) | 0.636 (0.036) | 0.569 (0.065) | 0.599 (0.048) |
| Demographics (D) | 0.596 (0.018) | 0.607 (0.018) | 0.651 (0.040) | 0.627 (0.020) |
| LIWC (L) | 0.677 (0.018) | 0.754 (0.006) | 0.569 (0.050) | 0.647 (0.033) |
| Twitter Behavior (B) | 0.704 (0.017) | 0.712 (0.016) | 0.729 (0.028) | 0.720 (0.018) |
| Twitter Content (C) | 0.791 (0.027) | 0.816 (0.017) | 0.775 (0.041) | 0.795 (0.030) |
| C | 0.791 (0.027) | 0.816 (0.017) | 0.775 (0.041) | 0.795 (0.030) |
| CB | 0.803 (0.008) | 0.828 (0.008) | 0.786 (0.026) | 0.806 (0.011) |
| CBL | 0.806 (0.015) | 0.835 (0.014) | 0.784 (0.036) | 0.808 (0.019) |
| CBLD | 0.813 (0.020) | 0.837 (0.024) | 0.800 (0.029) | 0.818 (0.020) |
| CBLDS | 0.801 (0.019) | 0.826 (0.019) | 0.786 (0.034) | 0.805 (0.022) |
| CBLDSH | 0.806 (0.020) | 0.826 (0.021) | 0.797 (0.034) | 0.811 (0.021) |
| CBLDSHP | 0.803 (0.018) | 0.824 (0.023) | 0.794 (0.038) | 0.808 (0.020) |
| CBLDSHPN | 0.802 (0.019) | 0.822 (0.021) | 0.794 (0.042) | 0.807 (0.022) |
| Attended (+) | Did not attend (-) |
| liwc_time, con_hashtag_entropy, liwc_i, twt_guntweetcnt, liwc_we, liwc_male, liwc_hear, liwc_relativ, liwc_conj, liwc_anger, liwc_tentat, twt_userfollowerscount, liwc_posemo, liwc_work, liwc_achiev, twt_accage, liwc_space, liwc_discrep, liwc_article, liwc_affiliation | liwc_death, liwc_motion, liwc_insight, liwc_shehe, liwc_leisure, liwc_family, liwc_money, liwc_assent, con_rt_entropy, liwc_swear, liwc_cause, liwc_they, liwc_adverb, twt_engtweetcnt, liwc_cogproc, liwc_risk, liwc_ingest, liwc_differ, con_voca, con_voca_2 |
Examining the most important features based on the coefficients of variables in the best model (CBLD) listed in Table 7, we find the LIWC categories to be among some of the most useful ones. In particular, those who declared their attendance to the protest used more words concerning time, personal pronouns “I” and “we”, expressed both anger and positive emotion in their prior tweets. They also used a greater variety of hashtags (hashtag entropy, con_hashtag_entropy) and had more tweets about the gun issue (twt_guntweetcnt), which is well-aligned with the result in the previous literature, which finds that a large volumes of tweeting has a strong predictive power for forecasting state-level offline protest events (Ertugrul et al., 2019). Those who did not go to the march are more likely to tweet words associated with insight (about thinking or believing), and motion, as well as swear words and those of sad emotion. Further, they are more likely to use “he”, “she”, and impersonal pronouns (“it”, “everyone”, and “what”). They are also more likely to retweet many different sources (retweet entropy) and have more tweets in general. Note that, although demographic variables were present in the data, they were not as powerful predictors as these content-based ones.
To get the external validity of linguistic characteristics we found, we compare our results with other LIWC-driven studies in various social context. First, it is well known that the usage of pronouns is different across social groups. For example, women and young people tend to use more first-person singular pronouns (Graesser et al., 2014). The observation that our march-attending users also show higher usage of first-person singular pronouns (liwc_i) is well aligned with a survey showing that 70 percent of participants were women (Fisher, 2019).
We conduct a further analysis to see whether we indeed have more females among the march attenders in our data. In doing so, for those 1,206 users used in building the individual march attendance prediction model, we infer their gender using their self-reported first names in their Twitter profiles. Such approach has been popularly used to infer gender of social media users (Mislove et al., 2011; An and Weber, 2015). In particular, we use a ‘Name gender classifier’ that infers the gender based on a given first name (Liu and Ruths, 2013), which is a widely used approach in social media analytics (Culotta et al., 2015; Hovy, 2015). Out of 631 users who attended the march, 227 (35.97%), 289 (48.80%), 115 (18.23%) are detected as male, female, and unknown, respectively. On the other hand, out of 575 users who did not attend the march, 230 (40%), 182 (31.65%), 163 (28.35%) are detected as male, female, and unknown, respectively. First, we find that those who attended the march have more proportion of users with ‘inferred gender’ when compared with those who did not attend the march. In other words, those who did not attend the march are less likely to have complete profiles, potentially avoiding to express their identities. Second, we observe that those who attended the march have higher proportion of female users than those who did not attend the march. After excluding those unknown users whose gender are not identified, we find that 56% (44.17%) of those who attended (did not attend) the march are females. Finally, attempts have been made at automatically classifying age of Twitter users (Wang et al., 2019), however insufficient performance precludes analysis similar to gender.
Also, as March for Our Lives is a student-led movement from the start, it is reasonable to assume that young people actively engaged in online discussion and the march. Second, we compare our results with previous work from the perspectives of formality in discourse. Formality entails that the focus of discourse is to be “precise, coherent, articulate, and convincing to an educated audience” (Graesser et al., 2014). By contrast, informal discourse has been characterized by a higher usage of swear words, internet slang, assents, and fillers. Although not all four linguistic markers appear in our experiment, we find two of them (liwc_swear, liwc_assents) to be statically significantly more frequent in the vocabulary of non-attending users. This result indicates that users who attended the march show linguistic patterns that are closer to formal discourse, which aims to convince an educated audience, as opposed to non-attending users who are closer to informal discourse. Third, cognitive complexity has been modeled through usage of conjunctions, because they connect multiple thoughts and thus build coherent narratives (Graesser et al., 2004). We find that march-attending users use more conjunctions (liwc_conj) than non-attending users, thus indicating their online discussions show a richness of reasoning by differentiation or integration of thoughts through conjunctions. Finally, it is somewhat surprising to observe that march-attending users show more anger (liwc_anger) and higher positive emotions (liwc_posemo). Both categories of words, however, have been reported as indicators of protests; the anger is a good predictor of state-level Charlottesville and Ferguson protests (Ertugrul et al., 2019), and positive emotion could inspire collective action (Goodwin and Jasper, 2006).
The results show that users’ online activity on Twitter, and language they use while participating in gun-related debates in particular, can be meaningful cues in understanding their offline behaviors.
5. Discussion
This work contributes to a rich multidisciplinary research line on the interplay between the use of social media and political engagement. Previous studies about the gun debate on social media are often descriptive analyses of content such as images (Stefanone et al., 2015) and text (Wang et al., 2016). Others move beyond description and correlate the opinions expressed on Twitter with those determined from polls; they find a moderate correlation at 0.51 Pearson , despite using a low-recall (high-precision) hashtag matching approach (Benton et al., 2016). The state-level model we present here puts into context the importance of Twitter as a factor in political engagement in the gun rights/control issue. We find that some of the strongest factors are socioeconomic (especially housing problems and income inequality ratio), but we find that political leaning as expressed on Twitter — more precisely the relative size of the two sides in the network — also has a substantial relationship with the laws (in fact, more than the percentage of state residents who voted for Republican in the previous election). Although the SEM structure represents our causal assumptions about the relationship among the variables, and we find supporting evidence for our model in the data, we cannot be certain that the model accurately represents reality, and we certainly do not make any causal claims about the findings. Nevertheless, our findings suggest that there is a useful signal in Twitter data, as it pertains to concrete public policies and laws regarding gun control. Consequently, the outcomes of both state and individual models illustrate that political action can be captured on social media, beyond simple rhetoric or “slacktivism” (Vitak et al., 2011).
Much of the research on political speech online deals with markers of political alignment (Conover et al., 2011; Colleoni et al., 2014), but the presence of these markers does not always lead to political engagement offline. An indirect relationship with political action (voting) was explored in early work on the prediction of election outcomes by using online political sentiment (Metaxas et al., 2011; Gayo-Avello, 2012; Mejova et al., 2013; Jungherr et al., 2012). The fact that our automated classifier is able to predict attendance of a political march (albeit in a limited setting) suggests that social media provides signals not only of online “activism” but also of offline actions. Unlike previous studies, which either predict online political action of individual users (e.g., by looking at factors such as gender (Bode, 2017) and personality traits (Russo and Amnå, 2016)), or predict offline political outcomes by looking at users collectively (Metaxas et al., 2011; Gayo-Avello, 2012; Mejova et al., 2013; Jungherr et al., 2012; Conover et al., 2011; Colleoni et al., 2014), our study examines an individual social media user and their tweets indicating offline political action. Although we use aggregated census data for demographics here, it is possible to enrich the view of individuals with additional information, such as gender, age, and personality traits, all of which can be extracted from social media to a certain extent (Vicente et al., 2019; Chen et al., 2019; Skowron et al., 2016). Studying political action at an individual level could provide a detailed view to understand the major problems of political representation of under-served populations, political apathy, intimidation, and radicalization, which is not straightforward to be studied in a collective manner. Of course, such research would need to be heavily scrutinized in order to maximally protect the privacy of individuals to be studied, for example, by pre-registering the methodology and receiving the approval of an Institutional Review Board (IRB).181818As will be done by collaborators with Facebook who study the 2020 U.S. Election https://about-fb-com.cdn.ampproject.org/c/s/about.fb.com/news/2020/08/research-impact-of-facebook-and-instagram-on-us-election/amp/
Considering the political issue of gun rights/control in particular, we observe the two sides of the argument to be well separated on the Twitter retweet network —a sign of the echo-chamber effect (Conover et al., 2011; Garimella et al., 2018a; Bakshy et al., 2015; Barberá et al., 2015). Even though they do mention prominent politicians from the other side, they do not interact with each other’s content. This finding supports the observation that gun control is one of the most divisive political issues in the U.S. (Cohn and Quealy, 2017). Recent research provides some support that social media may contribute to the worsening of polarization. For instance, Republicans expressed substantially more conservative views after being exposed to opposing political views on social media (though no statistically significant effect was found for Democrats) (Bail et al., 2018). Large-scale experiments on Facebook also showed that “random variation in exposure to news on social media substantially affects the slant of news sites that individuals visit” (Levy, 2021) and that “social media expose individuals to at least some ideologically crosscutting viewpoints” but that “individual choices more than algorithms limit exposure to attitude-challenging content” (Bakshy et al., 2015). Still, these effects are not consistent among the platforms, as recently de-polarization was detected on the messaging service WhatsApp (although Twitter remained highly polarized) (Yarchi et al., 2021). Further, because social media accounts for an estimated 4.2% of total online consumption (Allen et al., 2020), additional research on how other news and communication behaviors intersect with the polarization on the gun issue would allow for a broader understanding of its context. For instance, local and national news consumption may impact beliefs around the prevalence of gun violence, which is a crucial concern for those leaning Democrat politically (Schaeffer, 2021). With the decline of printed news media, the influence of social media on mainstream news is being documented around the globe (e.g. in China (Yan, 2020), U.S. (Su and Borah, 2019), and Kashmir (Noor, 2017)), thus it is important to understand whether potentially divisive stances affect other sources of information and public fora.
Another exciting future research direction is to observe whether these sides remain static if mass shootings keep rocking the country. Historical survey data shows swings in the public opinion around mass shootings, but the overall trend is toward fewer restrictions on gun ownership (ROPER, 2016); longitudinal studies will reveal whether these short- and long-term trends are reflected on the internet, as well as at the ballot box. Although one may find the binarization of such a complex topic to be an over-simplification, we point the reader to the high inter-annotator agreement on the stances of the users in this data, suggesting that, at least on Twitter, the issue has few discussants in the “grey area” of the opinion spectrum (similar findings about the polarization of this platform have been found in other domains, such as vaccination (Cossard et al., 2020)).
Within the network, we show that denser, smaller communities of gun control Twitter users are associated with more restrictive state-wide laws. We also find a lower degree of assortativity to be beneficial to their cause, which indicates more star-like structures around highly connected nodes (who may be leaders or facilitators bringing the community together). Both these findings which echo Granovetter’s “embeddedness” argument (Granovetter, 1985), according to which the causes of (in our case, political) action are not entirely determined by the individual (considered as rational and self-interested), nor determined by social categories only (e.g., by class or race); rather the action is ‘embedded’ in the social structure, which requires an investigation of the social networks of individuals to be fully understood. One possible explanation is that hierarchical structures have lower interdependence between the peers. Therefore, a “pooled” interdependence structure that leverages the center of the network is more efficient (Thompson, 2003). These findings are in contrast with a recent study of English Wikipedia that finds the successful editors collaborate in a more assortative, egalitarian network (Rychwalska et al., 2020). Thus, we urge future research to examine to what extent social media enables explicit coordination between users, and whether this is reflected in the hierarchical structure of its networks.
In the user model, content features were the most predictive of declaring offline political action on Twitter, and especially those concerning self-reference, as well as emotion. Previous literature shows excessive emotion to be associated with partisanship, negative when threatened and positive when reassured (Huddy et al., 2015). In addition, emotion can also be spurred by events going against one’s moral stance, thus resulting in a “moral outrage” (Mullen and Skitka, 2006). However, greater emotion has been also associated with political “sophistication” (attention to, interest in, and knowledge of the political sphere) (Miller, 2011). In an age of increased populist political movements (Caramani and Manucci, 2019; Hawkins and Littvay, 2019; Jungherr et al., 2021), it is imperative to understand the relationship between heightened emotions and political engagement, and the direction of their causality. Social media may provide a valuable record of people’s expressed emotional states that can contribute to further understanding the role of emotion in political activity.
This study has several notable limitations, common to social media studies in general, and those on ongoing political issues in particular. Only those with access to and interest in social media are included in our dataset (Olteanu et al., 2016), as well as those who choose to be vocal on the subject. Thus, not everyone who attended the march was captured in our dataset. In fact, there are several “filters” which were used to select the users for the attendance classification, including self-selection by the users to post on Twitter, post specifically on the topic of interest, and, of course, indicate that they are going to the march. Also, these users have shared their location in their profile, which adds to the likelihood that these individuals are comfortable with sharing personal information (note that this information was shared by the user generally, not in the context of gun control). The results of the classification exercise, then, is applicable largely to those who are vocal enough to be included in the data, and open enough to share their approximate location. The task would be much more difficult if we were to look for potential march attendees in a generic Twitter stream. Further, although our classifiers achieve a substantial accuracy (96% using network and 70% using content features), the user stances on the issue can only be approximated by using the limited information we have. Similarly, the limited number of geographical divisions (in this case, states), does not allow for the inclusion of too many variables, thus forcing a strict feature selection before the SEM can be constructed, which limits the hypothesis space. The selection of English language may also mean an exclusion of minority groups within the U.S. who use other languages – additional data collection (using keywords in target languages) and NLP pipelines would need to be created to capture them. Finally, one of the major limitations of this work is the relatively short span of the data, which does not reflect the historical political activity that has resulted in the current political climate around the gun rights/control issue. A longitudinal study over several years would be able to capture a greater variety of political activity and opinions expressed, and possibly even changes in opinion over time.
Implications for design. What we found, however, is that online discussions can be done in strikingly different ways across the regions if they have different offline contexts. In the experiment of predicting the strictness of gun control laws at the state level, we observe that people’s interaction patterns (i.e., retweet) in online discussions are strongly coupled with their offline context (i.e., gun law rating of the state they live in). In other words, offline context defines what kinds of online discussion one would expect and experience. Typically, there is a consensus that online platforms serve as an open place where the public can discuss social issues without limitations of geographic distances. Our finding, however, is that online discussions on certain issues, which are strongly coupled with state-level policies (e.g., gun control), can be shaped by geographical factor or other offline context. This observation allows us to explore the potential of offline context for better online discussions on social media platforms. Let us simplify the challenge and start from a familiar instance of offline context, location. Incorporating the location of users into online platforms is not a new concept. In several online communities that mainly involve offline meetings, locations have been a crucial factor for user experience. For example, Meetup personalizes user experience based on locations and enable users to discover local events. Such platform proves that, when location is appropriately considered as a design choice, online platforms can connect online and offline and provide continuous experience to users. Beyond these location-based services, our findings imply that conventional social media platforms also can benefit from considering offline context into their designs. While social media platforms use locations in a limited way, such as trending topics for a specific region, the benefit of locations can be extended. As social issues become more frequently discussed online, the context and tone around discussion can be quite different across the regions (i.e., states) even for the same issue (i.e., debate on guns). Consequently, how online platforms (1) consider offline context that might lead to nuanced discussions, (2) make users aware of it, and (3) allow them not to mislead others’ opinions or stance by avoiding wrong assumptions about offline context will be a crucial design choice to support better discussions online.
Moreover, it is interesting that predicting individual-level tweeting about their attendance of the march was highly accurate (though on a class-balanced sample, “real-world” performance may be much lower). The prediction model, however, should be implemented with extra caution. As social media has become the place to empower social movements by grassroots activists in recent years, predicting who will or did attend offline protests from online data could be misused in both prospective and retrospective ways. This risk can be managed by giving early warnings to users when needed so that they know the risk in advance, seek more secure channels, and so on.
Privacy and ethics. This study has been performed on publicly available tweets and user information, as Twitter API does not provide any data on private accounts or personal messages between users. The fact that, using this data, our automated classifier is able to predict whether users attend a political march and make it known through a public tweet, which suggests that social media provides signals not only of online activism but also of offline actions. It is therefore reasonable to assume that government or political actors are already using such techniques,191919https://www.bbc.com/news/blogs-china-blog-48552907,202020https://www.reuters.com/article/us-iran-internet/irans-guards-increase-monitoring-of-social-media-state-tv-idUSKBN0LY1YC20150302 so it is important both to raise awareness of the public about the risk of online activities that can be used to predict their offline political activities in the future, and to outline restrictions to large-scale data analysis by powerful entities. Finally, since current study does not interact with subjects, nor attempts to extract personally identifiable information and uses only public data, this study does not fall in the category of human participant research. Instead, the authors has followed the ethics guidelines outlined by their institutions. Furthermore, our study adheres to the Twitter Terms of Service for the publicly available data through their API.212121https://developer.twitter.com/en/developer-terms/agreement-and-policy
Appendix A Features
We list all features used for Model 2. Individual March Attendance below.
| Demographics | LIWC |
| perc under 18 | Total function words (liwc_function) |
| perc 65 and over | Total pronouns (liwc_pronoun) |
| perc African American | Personal pronouns (liwc_ppron) |
| perc Asian | 1st person singular (liwc_i) |
| perc Hispanic | 1st person plural (liwc_we) |
| perc non Hispanic white | 2nd person (liwc_you) |
| perc rural | 3rd person singular (liwc_shehe) |
| 3rd person plural (liwc_they) | |
| Socio-Economic | Impersonal pronouns (liwc_ipron) |
| high school graduation rate | Articles (liwc_article) |
| perc some college | Prepositions (liwc_prep) |
| perc unemployment | Auxiliary verbs (liwc_auxverb) |
| income inequality ratio | Common Adverbs (liwc_adverb) |
| perc uninsured | Conjunctions (liwc_conj) |
| perc single parent households | Negations (liwc_negate) |
| perc association rate | Common verbs (liwc_verb) |
| violent crime rate | Common adjectives (liwc_adj) |
| perc severe housing problems | Comparisons (liwc_compare) |
| median household income | Interrogatives (liwc_interrog) |
| residential segregation black white | Numbers (liwc_number) |
| homicide rate | Quantifiers (liwc_quant) |
| Affective processes (liwc_affect) | |
| Health | Positive emotion (liwc_posemo) |
| mentally unhealthy days | Negative emotion (liwc_negemo) |
| perc adult smoking | Anxiety (liwc_anx) |
| perc adult obesity | Anger (liwc_anger) |
| perc excessive drinking | Sadness (liwc_sad) |
| Social processes (liwc_social) | |
| Politics & Gun Culture | Family (liwc_family) |
| gun sales | Friends (liwc_friend) |
| firearm fatalities rate | Female references (liwc_female) |
| perc vote republican | Male references (liwc_male) |
| Twitter Network | Cognitive processes (liwc_cogproc) |
| indicator whether in GCC (net_inGCC) | Insight (liwc_insight) |
| Causation (liwc_cause) | |
| Twitter Content | Discrepancy (liwc_discrep) |
| retweet count (con_rt_account) | Tentative (liwc_tentat) |
| retweet entropy (con_rt_entropy) | Certainty (liwc_certain) |
| hashtag count (con_hashtag_count) | Differentiation (liwc_differ) |
| hashtag entropy (con_hashtag_entropy) | Perceptual processes (liwc_percept) |
| vocabulary count (con_voca) | See (liwc_see) |
| vocabulary entropy (con_voca_2) | Hear (liwc_hear) |
| hate word rate (con_hateword) | Feel (liwc_feel) |
| avg sentiment polarity (con_sentiment) | Biological processes (liwc_bio |
| Body (liwc_body) | |
| Twitter Behavior | Health (liwc_health) |
| user followers count | Sexual (liwc_sexual) |
| user friends count | Ingestion (liwc_ingest) |
| follower/friend ratio | Drives (liwc_drives) |
| account age (twt_accage) | Affiliation (liwc_affiliation) |
| gun tweet rate (twt_guntweetrate) | Achievement (liwc_achiev) |
| all tweet rate (twt_alltweetrate) | Power (liwc_power) |
| gun tweet count (twt_guntweetcnt) | Reward (liwc_reward) |
| English tweet count (twt_engtweetcnt) | Risk (liwc_risk) |
| Past focus (liwc_focuspast) | |
| Present focus (liwc_focuspresent) | |
| Future focus (liwc_focusfuture) | |
| Relativity (liwc_relativ) | |
| Motion (liwc_motion) | |
| Space (liwc_space) | |
| Time (liwc_time) | |
| Work (liwc_work) | |
| Leisure (liwc_leisure) | |
| Home (liwc_home) | |
| Money (liwc_money) | |
| Religion (liwc_relig) | |
| Death (liwc_death) | |
| Informal language (liwc_informal) | |
| Swear words (liwc_swear) | |
| Netspeak (liwc_netspeak) | |
| Assent (liwc_assent) | |
| Nonfluencies (liwc_nonflu) | |
| Fillers (liwc_filler) |
References
- (1)
- Abbar et al. (2015) Sofiane Abbar, Yelena Mejova, and Ingmar Weber. 2015. You tweet what you eat: Studying food consumption through twitter. In Proceedings of the 33rd Annual ACM Conference on Human Factors in Computing Systems. 3197–3206.
- Allen et al. (2020) Jennifer Allen, Baird Howland, Markus Mobius, David Rothschild, and Duncan J Watts. 2020. Evaluating the fake news problem at the scale of the information ecosystem. Science Advances 6, 14 (2020), eaay3539.
- An et al. (2016) Jisun An, Haewoon Kwak, Yelena Mejova, Sonia Alonso Saenz De Oger, and Braulio Gomez Fortes. 2016. Are you Charlie or Ahmed? Cultural pluralism in Charlie Hebdo response on Twitter. In Tenth International AAAI Conference on Web and Social Media.
- An et al. (2019) Jisun An, Haewoon Kwak, Oliver Posegga, and Andreas Jungherr. 2019. Political discussions in homogeneous and cross-cutting communication spaces. In Proceedings of the International AAAI Conference on Web and Social Media, Vol. 13. 68–79.
- An and Weber (2015) Jisun An and Ingmar Weber. 2015. Whom should we sense in “social sensing”-analyzing which users work best for social media now-casting. EPJ Data Science 4 (2015), 1–22.
- Anderson et al. (2018) Monica Anderson, Skye Toor, Lee Rainie, and Aaron Smith. 2018. Activism in the Social Media Age. https://www.pewresearch.org/internet/2018/07/11/activism-in-the-social-media-age/
- Bail et al. (2018) Christopher A Bail, Lisa P Argyle, Taylor W Brown, John P Bumpus, Haohan Chen, MB Fallin Hunzaker, Jaemin Lee, Marcus Mann, Friedolin Merhout, and Alexander Volfovsky. 2018. Exposure to opposing views on social media can increase political polarization. Proceedings of the National Academy of Sciences 115, 37 (2018), 9216–9221.
- Bakshy et al. (2015) Eytan Bakshy, Solomon Messing, and Lada A Adamic. 2015. Exposure to ideologically diverse news and opinion on Facebook. Science 348, 6239 (2015), 1130–1132.
- Barberá et al. (2015) Pablo Barberá, John T Jost, Jonathan Nagler, Joshua A Tucker, and Richard Bonneau. 2015. Tweeting from left to right: Is online political communication more than an echo chamber? Psychological science 26, 10 (2015), 1531–1542.
- Barberá and Rivero (2015) Pablo Barberá and Gonzalo Rivero. 2015. Understanding the political representativeness of Twitter users. Social Science Computer Review 33, 6 (2015), 712–729.
- Barnard-Wills (2012) David Barnard-Wills. 2012. Surveillance and identity: Discourse, subjectivity and the state. Ashgate Publishing, Ltd.
- Benton et al. (2016) Adrian Benton, Braden Hancock, Glen Coppersmith, John W Ayers, and Mark Dredze. 2016. After Sandy Hook Elementary: A year in the gun control debate on Twitter. Bloomberg Data for Good Exchange Conference (2016).
- Bifet et al. (2015) Albert Bifet, Gianmarco De Francisci Morales, Jesse Read, Geoff Holmes, and Bernhard Pfahringer. 2015. Efficient online evaluation of big data stream classifiers. In KDD ’15: 21th ACM SIGKDD international conference on knowledge discovery and data mining. 59–68.
- Blondel et al. (2008) Vincent D Blondel, Jean-Loup Guillaume, Renaud Lambiotte, and Etienne Lefebvre. 2008. Fast unfolding of communities in large networks. Journal of statistical mechanics: theory and experiment 2008, 10 (2008), P10008.
- Bode (2017) Leticia Bode. 2017. Closing the gap: Gender parity in political engagement on social media. Information, Communication & Society 20, 4 (2017), 587–603.
- Bond et al. (2012) Robert M Bond, Christopher J Fariss, Jason J Jones, Adam DI Kramer, Cameron Marlow, Jaime E Settle, and James H Fowler. 2012. A 61-million-person experiment in social influence and political mobilization. Nature 489, 7415 (2012), 295.
- Boulianne (2015) Shelley Boulianne. 2015. Social media use and participation: A meta-analysis of current research. Information, communication & society 18, 5 (2015), 524–538.
- Campbell et al. (1980) Angus Campbell, Philip E Converse, Warren E Miller, and Donald E Stokes. 1980. The american voter. University of Chicago Press.
- Caramani and Manucci (2019) Daniele Caramani and Luca Manucci. 2019. National past and populism: the re-elaboration of fascism and its impact on right-wing populism in Western Europe. West European Politics 42, 6 (2019), 1159–1187.
- Celinska (2007) Katarzyna Celinska. 2007. Individualism and collectivism in America: The case of gun ownership and attitudes toward gun control. Sociological Perspectives 50, 2 (2007), 229–247.
- Chemerinsky (2004) Erwin Chemerinsky. 2004. Putting the Gun Control Debate in Social Perspective. Fordham L. Rev. 73 (2004), 477.
- Chen et al. (2019) Jing Chen, Long Cheng, Xi Yang, Jun Liang, Bing Quan, and Shoushan Li. 2019. Joint learning with both classification and regression models for age prediction. In Journal of Physics: Conference Series, Vol. 1168. IOP Publishing, 032016.
- Cilluffo and Fry (2019) Anthony Cilluffo and Richard Fry. 2019. Gen Z, Millennials and Gen X outvoted older generations in 2018 midterms. https://www.pewresearch.org/fact-tank/2019/05/29/gen-z-millennials-and-gen-x-outvoted-older-generations-in-2018-midterms/
- Cohn and Quealy (2017) Nate Cohn and Kevin Quealy. 2017. Nothing Divides Voters Like Owning a Gun. https://www.nytimes.com/interactive/2017/10/05/upshot/gun-ownership-partisan-divide.html
- Colleoni et al. (2014) Elanor Colleoni, Alessandro Rozza, and Adam Arvidsson. 2014. Echo chamber or public sphere? Predicting political orientation and measuring political homophily in Twitter using big data. Journal of communication 64, 2 (2014), 317–332.
- Conover et al. (2013a) Michael D Conover, Clayton Davis, Emilio Ferrara, Karissa McKelvey, Filippo Menczer, and Alessandro Flammini. 2013a. The geospatial characteristics of a social movement communication network. PloS one 8, 3 (2013), e55957.
- Conover et al. (2013b) Michael D Conover, Emilio Ferrara, Filippo Menczer, and Alessandro Flammini. 2013b. The digital evolution of occupy wall street. PloS one 8, 5 (2013), e64679.
- Conover et al. (2011) Michael D Conover, Jacob Ratkiewicz, Matthew Francisco, Bruno Gonçalves, Filippo Menczer, and Alessandro Flammini. 2011. Political polarization on twitter. In Fifth international AAAI conference on weblogs and social media.
- Cossard et al. (2020) Alessandro Cossard, Gianmarco De Francisci Morales, Kyriaki Kalimeri, Yelena Mejova, Daniela Paolotti, and Michele Starnini. 2020. Falling into the Echo Chamber: the Italian Vaccination Debate on Twitter. In ICWSM ’20: International AAAI Conference on Web and Social Media.
- Cota et al. (2019) Wesley Cota, Silvio C Ferreira, Romualdo Pastor-Satorras, and Michele Starnini. 2019. Quantifying echo chamber effects in information spreading over political communication networks. arXiv preprint arXiv:1901.03688 (2019).
- Crocker (1982) Royce Crocker. 1982. Attitudes toward gun control: A survey. Federal regulation of firearms (1982), 229–267.
- Culotta et al. (2015) Aron Culotta, Nirmal Ravi Kumar, and Jennifer Cutler. 2015. Predicting the demographics of twitter users from website traffic data. In Twenty-Ninth AAAI Conference on Artificial Intelligence.
- Darwish et al. (2017) Kareem Darwish, Dimitar Alexandrov, Preslav Nakov, and Yelena Mejova. 2017. Seminar users in the Arabic Twitter sphere. In International Conference on Social Informatics. Springer, 91–108.
- Davis et al. (2016) Clayton Allen Davis, Onur Varol, Emilio Ferrara, Alessandro Flammini, and Filippo Menczer. 2016. Botornot: A system to evaluate social bots. In Proceedings of the 25th International Conference Companion on World Wide Web. International World Wide Web Conferences Steering Committee, 273–274.
- Dodds et al. (2011) Peter Sheridan Dodds, Kameron Decker Harris, Isabel M. Kloumann, Catherine A. Bliss, and Christopher M. Danforth. 2011. Temporal Patterns of Happiness and Information in a Global Social Network: Hedonometrics and Twitter. PLOS ONE 6, 12 (12 2011), 1–1. https://doi.org/10.1371/journal.pone.0026752
- Drezner and Farrell (2004) Daniel W Drezner and Henry Farrell. 2004. The power and politics of blogs. In American Political Science Association, Vol. 2.
- Earl et al. (2013) Jennifer Earl, Heather McKee Hurwitz, Analicia Mejia Mesinas, Margaret Tolan, and Ashley Arlotti. 2013. THIS PROTEST WILL BE TWEETED. Information, Communication & Society 16, 4 (2013), 459–478.
- Enten (2017) Harry Enten. 2017. The U.S. Has Never Been So Polarized On Guns. FiveThirtyEight (2017). https://fivethirtyeight.com/features/the-u-s-has-never-been-so-polarized-on-guns/
- Ertugrul et al. (2019) Ali Mert Ertugrul, Yu-Ru Lin, Wen-Ting Chung, Muheng Yan, and Ang Li. 2019. Activism via attention: interpretable spatiotemporal learning to forecast protest activities. EPJ Data Science 8, 1 (2019), 5.
- Fast et al. (2016) Ethan Fast, Binbin Chen, and Michael S Bernstein. 2016. Empath: Understanding topic signals in large-scale text. In Proceedings of the 2016 CHI Conference on Human Factors in Computing Systems. 4647–4657.
- Fisher (2019) Dana R Fisher. 2019. American Resistance: From the Women’s March to the Blue Wave. Columbia University Press.
- Freelon et al. (2018) Deen Freelon, Charlton McIlwain, and Meredith Clark. 2018. Quantifying the power and consequences of social media protest. New Media & Society 20, 3 (2018), 990–1011.
- Garimella et al. (2016) Kiran Garimella, Gianmarco De Francisci Morales, Aristides Gionis, and Michael Mathioudakis. 2016. Quantifying Controversy in Social Media. In WSDM ’16: 9th ACM International Conference on Web Search and Data Mining. 33–42.
- Garimella et al. (2017) Kiran Garimella, Gianmarco De Francisci Morales, Aristides Gionis, and Michael Mathioudakis. 2017. The effect of collective attention on controversial debates on social media. In Proceedings of the 2017 ACM on Web Science Conference. ACM, 43–52.
- Garimella et al. (2018a) Kiran Garimella, Gianmarco De Francisci Morales, Aristides Gionis, and Michael Mathioudakis. 2018a. Political Discourse on Social Media: Echo Chambers, Gatekeepers, and the Price of Bipartisanship. In WWW ’18: 27th International World Wide Web Conference.
- Garimella et al. (2018b) Kiran Garimella, Gianmarco De Francisci Morales, Aristides Gionis, and Michael Mathioudakis. 2018b. Quantifying Controversy on Social Media. ACM Transactions on Social Computing 1, 1 (2018), 3.
- Gayo-Avello (2012) Daniel Gayo-Avello. 2012. No, You Cannot Predict Elections with Twitter. Internet Computing, IEEE 16, 6 (2012), 91–94.
- Gil de Zúñiga et al. (2012) Homero Gil de Zúñiga, Nakwon Jung, and Sebastián Valenzuela. 2012. Social media use for news and individuals’ social capital, civic engagement and political participation. Journal of computer-mediated communication 17, 3 (2012), 319–336.
- González-Bailón et al. (2011) Sandra González-Bailón, Javier Borge-Holthoefer, Alejandro Rivero, and Yamir Moreno. 2011. The dynamics of protest recruitment through an online network. Scientific reports 1 (2011), 197.
- Goodwin and Jasper (2006) Jeff Goodwin and James M Jasper. 2006. Emotions and social movements. In Handbook of the Sociology of Emotions. Springer, 611–635.
- Graesser et al. (2014) Arthur C Graesser, Danielle S McNamara, Zhiqang Cai, Mark Conley, Haiying Li, and James Pennebaker. 2014. Coh-Metrix measures text characteristics at multiple levels of language and discourse. The Elementary School Journal 115, 2 (2014), 210–229.
- Graesser et al. (2004) Arthur C Graesser, Danielle S McNamara, Max M Louwerse, and Zhiqiang Cai. 2004. Coh-Metrix: Analysis of text on cohesion and language. Behavior research methods, instruments, & computers 36, 2 (2004), 193–202.
- Granovetter (1983) Mark Granovetter. 1983. The strength of weak ties: A network theory revisited. (1983).
- Granovetter (1985) Mark Granovetter. 1985. Economic action and social structure: The problem of embeddedness. American journal of sociology 91, 3 (1985), 481–510.
- Grimmer et al. (2018) Justin Grimmer, Eitan Hersh, Marc Meredith, Jonathan Mummolo, and Clayton Nall. 2018. Obstacles to estimating voter ID laws’ effect on turnout. The Journal of Politics 80, 3 (2018), 1045–1051.
- Grinberg et al. (2019) Nir Grinberg, Kenneth Joseph, Lisa Friedland, Briony Swire-Thompson, and David Lazer. 2019. Fake news on Twitter during the 2016 U.S. presidential election. Science 363, 6425 (Jan. 2019), 374–378. https://doi.org/10.1126/science.aau2706
- Grinshteyn and Hemenway (2016) Erin Grinshteyn and David Hemenway. 2016. Violent death rates: the US compared with other high-income OECD countries, 2010. The American journal of medicine 129, 3 (2016), 266–273.
- Guess et al. (2018) Andrew Guess, Brendan Nyhan, Benjamin Lyons, and Jason Reifler. 2018. Avoiding the echo chamber about echo chambers. Knight Foundation 2 (2018).
- Habermas et al. (1991) Jurgen Habermas, Jürgen Habermas, and Thomas Mccarthy. 1991. The structural transformation of the public sphere: An inquiry into a category of bourgeois society. MIT press.
- Hajnal et al. (2017) Zoltan Hajnal, Nazita Lajevardi, and Lindsay Nielson. 2017. Voter identification laws and the suppression of minority votes. The Journal of Politics 79, 2 (2017), 363–379.
- Halpern and Gibbs (2013) Daniel Halpern and Jennifer Gibbs. 2013. Social media as a catalyst for online deliberation? Exploring the affordances of Facebook and YouTube for political expression. Computers in Human Behavior 29, 3 (2013), 1159–1168.
- Hawkins and Littvay (2019) Kirk Hawkins and Levente Littvay. 2019. Contemporary US Populism in Comparative Perspective. Cambridge University Press.
- Hinds et al. (2020) Joanne Hinds, Emma J Williams, and Adam N Joinson. 2020. “It wouldn’t happen to me”: Privacy concerns and perspectives following the Cambridge Analytica scandal. International Journal of Human-Computer Studies (2020), 102498.
- Hovy (2015) Dirk Hovy. 2015. Demographic factors improve classification performance. In Proceedings of the 53rd annual meeting of the Association for Computational Linguistics and the 7th international joint conference on natural language processing (volume 1: Long papers). 752–762.
- Hox and Bechger (1998) Joop J Hox and Timo M Bechger. 1998. An introduction to structural equation modeling. (1998).
- Hoyle (1995) Rick H Hoyle. 1995. The structural equation modeling approach: Basic concepts and fundamental issues. (1995).
- Hu and Bentler (1999) Li-tze Hu and Peter M Bentler. 1999. Cutoff criteria for fit indexes in covariance structure analysis: Conventional criteria versus new alternatives. Structural equation modeling: a multidisciplinary journal 6, 1 (1999), 1–55.
- Huckfeldt (2009) Robert Huckfeldt. 2009. Interdependence, Density Dependence, and Networks in Politics. In American Politics Research. Vol. 37. 921–950.
- Huddy et al. (2015) Leonie Huddy, Lilliana Mason, and Lene Aarøe. 2015. Expressive partisanship: Campaign involvement, political emotion, and partisan identity. American Political Science Review 109, 1 (2015), 1–17.
- Huntington et al. (1993) Samuel P Huntington et al. 1993. The clash of civilizations?
- Johnson et al. (2009) Thomas J Johnson, Shannon L Bichard, and Weiwu Zhang. 2009. Communication communities or “cyberghettos?”: A path analysis model examining factors that explain selective exposure to blogs. Journal of Computer-Mediated Communication 15, 1 (2009), 60–82.
- Jungherr et al. (2012) Andreas Jungherr, Pascal Jürgens, and Harald Schoen. 2012. Why the pirate party won the german election of 2009 or the trouble with predictions: A response to tumasjan, a., sprenger, to, sander, pg, & welpe, im “predicting elections with twitter: What 140 characters reveal about political sentiment”. Social Science Computer Review 30, 2 (2012), 229–234.
- Jungherr et al. (2021) Andreas Jungherr, Oliver Posegga, and Jisun An. 2021. Populist Supporters on Reddit: A Comparison of Content and Behavioral Patterns Within Publics of Supporters of Donald Trump and Hillary Clinton. Social Science Computer Review (2021), 0894439321996130. https://doi.org/10.1177/0894439321996130 arXiv:https://doi.org/10.1177/0894439321996130
- Kalesan et al. (2016) Bindu Kalesan, Marcos D Villarreal, Katherine M Keyes, and Sandro Galea. 2016. Gun ownership and social gun culture. Injury prevention 22, 3 (2016), 216–220.
- Karypis and Kumar (1998) George Karypis and Vipin Kumar. 1998. A fast and high quality multilevel scheme for partitioning irregular graphs. SIAM Journal on scientific Computing 20, 1 (1998), 359–392.
- Kleck (2017) Gary Kleck. 2017. Point blank: Guns and violence in America. Routledge.
- Krogstad et al. (2019) Jens Manuel Krogstad, Luis Noe-Bustamante, and Antonio Flores. 2019. Historic highs in 2018 voter turnout extended across racial and ethnic groups. https://www.pewresearch.org/fact-tank/2019/05/01/historic-highs-in-2018-voter-turnout-extended-across-racial-and-ethnic-groups/
- Leighley (1990) Jan E Leighley. 1990. Social interaction and contextual influences on political participation. American Politics Quarterly 18, 4 (1990), 459–475.
- Lever (2013) Rob Lever. 2013. Debate flares on ‘Twitter revolutions’, Arab Spring. https://www.dawn.com/news/791757
- Levy (2021) Ro’ee Levy. 2021. Social media, news consumption, and polarization: Evidence from a field experiment. American economic review 111, 3 (2021), 831–70.
- Liu and Ruths (2013) Wendy Liu and Derek Ruths. 2013. What’s in a name? using first names as features for gender inference in twitter. In 2013 AAAI Spring Symposium Series.
- Lotan et al. (2011) Gilad Lotan, Erhardt Graeff, Mike Ananny, Devin Gaffney, Ian Pearce, et al. 2011. The Arab Spring— the revolutions were tweeted: Information flows during the 2011 Tunisian and Egyptian revolutions. International journal of communication 5 (2011), 31.
- MacCoun and Paletz (2009) Robert J MacCoun and Susannah Paletz. 2009. Citizens’ perceptions of ideological bias in research on public policy controversies. Political Psychology 30, 1 (2009), 43–65.
- Madden et al. (2014) Mary Madden, Lee Rainie, Kathryn Zickuhr, Maeve Duggan, and Aaron Smith. 2014. Public perceptions of privacy and security in the post-Snowden era. Pew Research Center 12 (2014). arXiv:https://www.pewresearch.org/internet/2014/11/12/public-privacy-perceptions/
- Magdy et al. (2016) Walid Magdy, Kareem Darwish, and Ingmar Weber. 2016. # FailedRevolutions: Using Twitter to study the antecedents of ISIS support. First Monday 21, 2 (2016).
- Mejova et al. (2013) Yelena Mejova, Padmini Srinivasan, and Bob Boynton. 2013. GOP primary season on Twitter: “Popular” political sentiment in social media. In (WSDM) Proceedings of the 6th ACM International Conference on Web Search and Data Mining. https://doi.org/10.1145/2433396.2433463
- Mejova et al. (2015) Yelena Mejova, Ingmar Weber, and Michael W Macy. 2015. Twitter: a digital socioscope. Cambridge University Press.
- Metaxas et al. (2011) Panagiotis Metaxas, Eni Mustafaraj, and Daniel Gayo-Avello. 2011. How (Not) To Predict Elections. International Conference on Social Computing (2011).
- Miller (2011) Patrick R Miller. 2011. The emotional citizen: Emotion as a function of political sophistication. Political psychology 32, 4 (2011), 575–600.
- Mislove et al. (2011) A Mislove, S Lehmann, Y Y Ahn, and J P Onnela. 2011. Understanding the Demographics of Twitter Users. ICWSM (2011).
- Monroe et al. (2008) Burt L Monroe, Michael P Colaresi, and Kevin M Quinn. 2008. Fightin’words: Lexical feature selection and evaluation for identifying the content of political conflict. Political Analysis 16, 4 (2008), 372–403.
- Mullen and Skitka (2006) Elizabeth Mullen and Linda J Skitka. 2006. Exploring the psychological underpinnings of the moral mandate effect: Motivated reasoning, group differentiation, or anger? Journal of personality and social psychology 90, 4 (2006), 629.
- Mummolo (2016) Jonathan Mummolo. 2016. News from the other side: How topic relevance limits the prevalence of partisan selective exposure. The Journal of Politics 78, 3 (2016), 763–773.
- Nelson and Webster (2017) Jacob L Nelson and James G Webster. 2017. The myth of partisan selective exposure: A portrait of the online political news audience. Social Media+ Society 3, 3 (2017), 2056305117729314.
- Noor (2017) Rabia Noor. 2017. Citizen journalism vs. mainstream journalism: A study on challenges posed by amateurs. Athens Journal of Mass Media and Communications 3, 1 (2017), 55–76.
- Olteanu et al. (2016) Alexandra Olteanu, Carlos Castillo, Fernando Diaz, and Emre Kiciman. 2016. Social data: Biases, methodological pitfalls, and ethical boundaries. Methodological Pitfalls, and Ethical Boundaries (December 20, 2016) (2016).
- Opp (2009) Karl-Dieter Opp. 2009. Theories of political protest and social movements: A multidisciplinary introduction, critique, and synthesis. Routledge.
- Owen (2017) Stephen Owen. 2017. Monitoring social media and protest movements: ensuring political order through surveillance and surveillance discourse. Social Identities 23, 6 (2017), 688–700.
- Reeping et al. (2019) Paul M Reeping, Magdalena Cerdá, Bindu Kalesan, Douglas J Wiebe, Sandro Galea, and Charles C Branas. 2019. State gun laws, gun ownership, and mass shootings in the US: cross sectional time series. BMJ 364 (2019). https://doi.org/10.1136/bmj.l542 arXiv:https://www.bmj.com/content/364/bmj.l542.full.pdf
- Romero et al. (2011) Daniel M Romero, Brendan Meeder, and Jon Kleinberg. 2011. Differences in the mechanics of information diffusion across topics: idioms, political hashtags, and complex contagion on twitter. In Proceedings of the 20th international conference on World wide web. 695–704.
- Rooduijn and Burgoon (2018) Matthijs Rooduijn and Brian Burgoon. 2018. The paradox of well-being: do unfavorable socioeconomic and sociocultural contexts deepen or dampen radical left and right voting among the less well-off? Comparative Political Studies 51, 13 (2018), 1720–1753.
- ROPER (2016) ROPER. 2016. Shootings, Guns and Public Opinion. Center for Public Opinions Research (2016). https://ropercenter.cornell.edu/shootings-guns-and-public-opinion
- Russo and Amnå (2016) Silvia Russo and Erik Amnå. 2016. The personality divide: Do personality traits differentially predict online political engagement? Social Science Computer Review 34, 3 (2016), 259–277.
- Rychwalska et al. (2020) Agnieszka Rychwalska, Szymon Talaga, and Karolina Ziembowicz. 2020. Quality in peer production systems–impact of assortativity of communication networks on group efficacy. In Proceedings of the 53rd Hawaii International Conference on System Sciences.
- Schaeffer (2021) Katherine Schaeffer. 2021. Key facts about Americans and guns. [Accessed on Nov 1, 2021]. https://www.pewresearch.org/fact-tank/2021/09/13/key-facts-about-americans-and-guns/.
- Scheufele et al. (2004) Dietram A Scheufele, Matthew C Nisbet, Dominique Brossard, and Erik C Nisbet. 2004. Social structure and citizenship: Examining the impacts of social setting, network heterogeneity, and informational variables on political participation. Political Communication, 21, 3 (2004), 315–338.
- Skowron et al. (2016) Marcin Skowron, Marko Tkalčič, Bruce Ferwerda, and Markus Schedl. 2016. Fusing social media cues: personality prediction from twitter and instagram. In Proceedings of the 25th international conference companion on world wide web. 107–108.
- Stefanone et al. (2015) Michael A Stefanone, Gregory D Saxton, Michael J Egnoto, Wayne Wei, and Yun Fu. 2015. Image attributes and diffusion via Twitter: the case of# guncontrol. In 2015 48th Hawaii International Conference on System Sciences. IEEE, 1788–1797.
- Stone (2015) Michael H Stone. 2015. Mass murder, mental illness, and men. Violence and gender 2, 1 (2015), 51–86.
- Stone and Socia (2017) Rebecca Stone and Kelly M Socia. 2017. Boy With Toy or Black Male With Gun: An Analysis of Online News Articles Covering the Shooting of Tamir Rice. Race and Justice (2017), 2153368716689594.
- Stroud (2008) Natalie Jomini Stroud. 2008. Media use and political predispositions: Revisiting the concept of selective exposure. Political Behavior 30, 3 (2008), 341–366.
- Su and Borah (2019) Yan Su and Porismita Borah. 2019. Who is the agenda setter? Examining the intermedia agenda-setting effect between Twitter and newspapers. Journal of Information Technology & Politics 16, 3 (2019), 236–249.
- Tang and Lee (2013) Gary Tang and Francis LF Lee. 2013. Facebook use and political participation: The impact of exposure to shared political information, connections with public political actors, and network structural heterogeneity. Social Science Computer Review 31, 6 (2013), 763–773.
- Thibaut and Kelley (1959) John W Thibaut and Harold H Kelley. 1959. The social psychology of groups. (1959).
- Thompson (2003) James D Thompson. 2003. Organizations in action: Social science bases of administrative theory. Transaction publishers.
- Tufekci and Wilson (2012) Zeynep Tufekci and Christopher Wilson. 2012. Social media and the decision to participate in political protest: Observations from Tahrir Square. Journal of communication 62, 2 (2012), 363–379.
- Tumasjan et al. (2010) Andranik Tumasjan, Timm Sprenger, Philipp Sandner, and Isabell Welpe. 2010. Predicting elections with twitter: What 140 characters reveal about political sentiment. In Proceedings of the International AAAI Conference on Web and Social Media, Vol. 4.
- Tyson (2018) Alec Tyson. 2018. The 2018 midterm vote: Divisions by race, gender, education. https://www.pewresearch.org/fact-tank/2018/11/08/the-2018-midterm-vote-divisions-by-race-gender-education/
- Valenzuela (2013) Sebastián Valenzuela. 2013. Unpacking the use of social media for protest behavior: The roles of information, opinion expression, and activism. American Behavioral Scientist 57, 7 (2013), 920–942.
- Valenzuela et al. (2018) Sebastián Valenzuela, Teresa Correa, and Homero Gil de Zúñiga. 2018. Ties, likes, and tweets: Using strong and weak ties to explain differences in protest participation across Facebook and Twitter use. Political Communication 35, 1 (2018), 117–134.
- Van Hauwaert et al. (2019) Steven M Van Hauwaert, Christian H Schimpf, and Régis Dandoy. 2019. Populist demand, economic development and regional identity across nine European countries: exploring regional patterns of variance. European Societies 21, 2 (2019), 303–325.
- Vicente et al. (2019) Marco Vicente, Fernando Batista, and Joao P Carvalho. 2019. Gender detection of Twitter users based on multiple information sources. In Interactions Between Computational Intelligence and Mathematics Part 2. Springer, 39–54.
- Vitak et al. (2011) Jessica Vitak, Paul Zube, Andrew Smock, Caleb T Carr, Nicole Ellison, and Cliff Lampe. 2011. It’s complicated: Facebook users’ political participation in the 2008 election. CyberPsychology, behavior, and social networking 14, 3 (2011), 107–114.
- Vraga et al. (2015) Emily K Vraga, Kjerstin Thorson, Neta Kligler-Vilenchik, and Emily Gee. 2015. How individual sensitivities to disagreement shape youth political expression on Facebook. Computers in Human Behavior 45 (2015), 281–289.
- Walker and Eva Matsa (2021) Mason Walker and Katerina Eva Matsa. 2021. News Consumption Across Social Media in 2021. [Accessed on Nov 1, 2021]. https://www.pewresearch.org/journalism/2021/09/20/news-consumption-across-social-media-in-2021/.
- Wang (2010) Alex Hai Wang. 2010. Detecting spam bots in online social networking sites: a machine learning approach. In IFIP Annual Conference on Data and Applications Security and Privacy. Springer, 335–342.
- Wang et al. (2016) Nan Wang, Blesson Varghese, and Peter D Donnelly. 2016. A machine learning analysis of Twitter sentiment to the Sandy Hook shootings. In 2016 IEEE 12th International Conference on e-Science (e-Science). IEEE, 303–312.
- Wang et al. (2019) Zijian Wang, Scott Hale, David Ifeoluwa Adelani, Przemyslaw Grabowicz, Timo Hartman, Fabian Flöck, and David Jurgens. 2019. Demographic inference and representative population estimates from multilingual social media data. In The world wide web conference. 2056–2067.
- Winter et al. (2016) Stephan Winter, Miriam J Metzger, and Andrew J Flanagin. 2016. Selective use of news cues: A multiple-motive perspective on information selection in social media environments. Journal of Communication 66, 4 (2016), 669–693.
- Xenos et al. (2014) Michael Xenos, Ariadne Vromen, and Brian D Loader. 2014. The great equalizer? Patterns of social media use and youth political engagement in three advanced democracies. Information, Communication & Society 17, 2 (2014), 151–167.
- Yan (2020) Xuyan Yan. 2020. The Impact of Social Media on Traditional Mainstream Media——A Case Study of People’s Daily. In 2020 4th International Seminar on Education, Management and Social Sciences (ISEMSS 2020). Atlantis Press, 479–482.
- Yarchi et al. (2021) Moran Yarchi, Christian Baden, and Neta Kligler-Vilenchik. 2021. Political polarization on the digital sphere: A cross-platform, over-time analysis of interactional, positional, and affective polarization on social media. Political Communication 38, 1-2 (2021), 98–139.