0.5pt
Piezoelectric ferromagnetism in two dimensional FeCl2
Abstract
We predict that monolayer FeCl2 is a two-dimensional piezoelectric ferromagnet (PFM) with easy-axis magnetism and a Curie temperature of 260 K. Our ab initio calculations combined with data mining reveal 2H-FeCl2 as the only easy-axis 2D monolayer PFM, and that its magnetic anisotropy increases many-fold with moderate hole doping. We develop an analysis based on magnetic anisotropies densities that explain the magnetic and doping-dependent behavior of FeCl2, as well as VSe2 and CrI3, and can enable the design of future 2D magnetically ordered materials.
Controlling ferromagnetism using electric fields in a two-dimensional (2D) material offers significant scientific and technological interest Spaldin and Ramesh (2019); Ramesh and Spaldin (2007); Ma et al. (2011). Regarding magnetism, this is very challenging due to (i) typically weak magnetic exchange couplings, and (ii) the easy-axis (Ising) magnetic anisotropy (MA) required by the Mermin-Wagner theorem is rarely achieved Mermin and Wagner (1966); Halperin (2019). Nevertheless, 2D monolayers of Cr2Ge2Te6, CrI3 and Fe3GeTe2 are ferromagnetic with Curie temperatures of 5 K Carteaux et al. (1995), 45 K Huang et al. (2017) and 126 K Roemer et al. (2020); Deng et al. (2018), respectively, but room temperature ferromagnetism of 2D monolayers has not been achieved yet. Recent experiments report that multi-layered H-phase VSe2 is an Ising (easy-axis) ferromagnet above room temperature Bonilla et al. (2018); Wang et al. (2021), but, disappointingly, theory shows that in the monolayer limit, H-VSe2 has strong ferromagnetic coupling with an easy-plane anisotropy Fuh et al. (2016); Zhuang and Hennig (2016). Open questions include the origin of easy-axis anisotropy in multilayered H-VSe2 and experimental measurement of the magnetic properties of yet-to-be-synthesized monolayer H-VSe2.
A 2D ferromagnetic system that is also piezoelectric will permit electric field control of magnetism via field-induced strain and structural distortions Lei et al. (2013). One approach is to create 2D van der Waals heterostructures with separate piezoelectric and ferromagnetic layers: this approach may circumvent the weak ferromagnetism often observed in type-II multiferroics Lei et al. (2013); Ma et al. (2011); Eerenstein et al. (2007). However, in practice, only a fraction of the strain is transferred from the piezoelectric layer to the ferromagnetic layer in these materials Lei et al. (2013). Ideally, a single monolayer that combines piezoelectric and ferromagnetic properties may lead to significantly improved coupling.
Here, we screen two-dimensional materials databases using density functional theory (DFT) to find candidate piezoelectric ferromagnetic materials (PFM) with easy-axis MA. We find only one compound, monolayer H-phase FeCl2. Excitingly, we predict that H-FeCl2 has a Curie temperature () near 260 K and its and MA are tunable with strain and doping. We develop a theoretical analysis method for MA densities as a function of electron band energies that allows us to identify the key features of the electronic structure of Fe-dihalides, V-dichalcogenides, and Cr-trihalides that generate easy-axis or easy-plane anisotropy: e.g., we find that compounds are most likely to have easy-axis MA in H-phase 2D materials. We also can explain the trends in MA and exchange couplings as a function of the chosen ligands.
Materials screening — Our main materials discovery is that FeCl2 is the only PFM as an isolated monolayer. After screening a database of calculated magnetic ground states and electronic band gaps of more than 1600 exfoliable 2D materials Torelli et al. (2020), we find that only 48 compounds can meet our screening criteria: a finite electronic bandgap, no inversion symmetry, and a finite ferromagnetic (FM) moment in the primitive cell. Since many of the entries in the databases use very small (primitive) unit cells, the associated prediction of an FM ground state is checked using larger supercell calculations. This leads to a further decrease in the number of screened compounds to 30. Using our magnetic stability calculations with these larger supercells, we further screen these 30 compounds by requiring a minimal energetic stability requirement of at least 10 meV/formula unit for the FM ground state relative to other magnetic orderings. Table 1 lists the resulting 14 compounds along with their key magnetic properties. For comparison, the last three rows describe the Cr-trihalides: they lack inversion symmetry but are well-known 2D ferromagnets Kim et al. (2019); Tiwari et al. (2021). Only FeCl2 shows positive MAE and can display Ising-type (easy axis) FM ordering in the out-of-plane direction along with a piezoelectric response.
| E(FM-AFM) | MAEtot | MAEtm | Eg | |
| Compound | (meV/f.u.) | (meV/f.u.) | (meV/f.u.) | (eV) |
| ScCl2 | -18 | -0.01 | -0.008 | 0.14 |
| ScBr2 | -32 | -0.11 | -0.030 | 0.18 |
| ScI2 | -34 | -0.42 | -0.060 | 0.14 |
| VS2 | -48 | -0.21 | -0.152 | 0.05 |
| VSeS | -52 | -0.38 | -0.202 | 0.38 |
| VSe2 | -83 | -0.57 | -0.241 | 0.26 |
| VTeSe | -69 | -0.97 | -0.249 | 0.14 |
| VTe2 | -87 | -1.63 | -0.310 | 0.24 |
| TiSeCl | -49 | -0.21 | -0.094 | 0.09 |
| TiSeBr | -57 | -0.26 | -0.104 | 0.11 |
| TiSeI | -49 | -0.34 | -0.133 | 0.05 |
| FeCl2 | -182 | 0.18 | 0.169 | 0.41 |
| FeBr2 | -148 | -0.06 | 0.397 | 0.28 |
| FeI2 | -110 | -3.99 | 0.892 | 0.19 |
| Cr-Halides | ||||
| CrCl3 | -4 | 0.03 | 0.015 | 1.76 |
| CrBr3 | -6 | 0.19 | 0.032 | 1.53 |
| CrI3Lado and Fernández-Rossier (2017) | -9 | 0.67 | 0.059 | 1.02 |
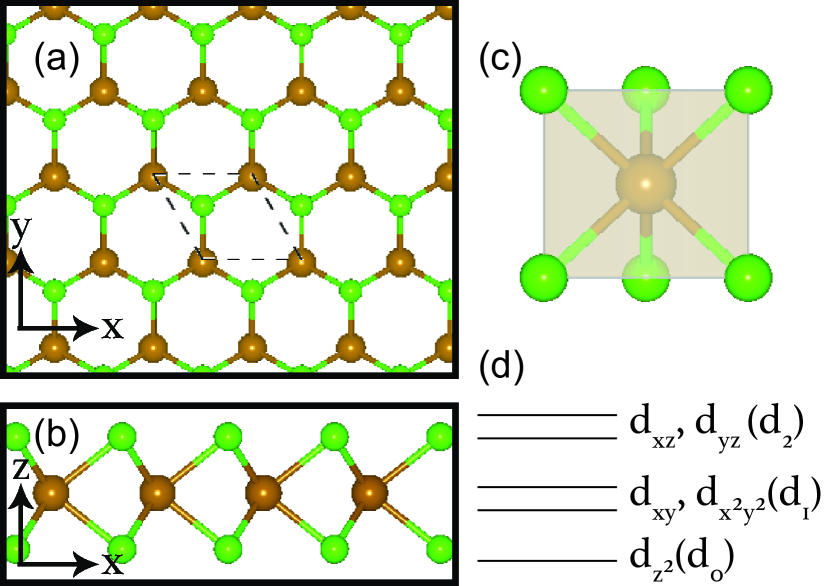
In Table 1, we provide the energy differences between the FM state and the minimum energy antiferromagnetic state (AFM), electronic band gaps including the effect of spin-orbit coupling (SOC), total MAE, and transition metal site projected magnetic anisotropy (MAEtm) energies (the remainder of the MAE is due to the halide or chalcogenide). Compounds in Table 1, except for Cr-halides, can be divided into two main groups depending on their electronic structure. Sc2+, Ti3+, and V4+ are formally in a valence state, whereas Fe2+ has a valence of . As these are all H-phase compounds, the trigonal prismatic crystal field surrounding the transition metal atoms leads to the ligand-field splittings of Fig. 1d. Hence, the compounds should only have the level filled. We find that Fe2+ in the Fe-halides has high-spin configuration Sup (a), hence in the minority spin channel only the state should be filled. Among the compounds, FM phase stabilizes with heavier ligands, whereas the compounds show the opposite trend. However, for both and , MAE decreases with heavier ligands as opposed to the increasing MAE trend in the Cr-halides. Finally, the relative importance of the contribution from the transition metal site MAEtm to the total MAEtot decreases systematically with progressively heavier ligands.
All compounds in Table 1 (except for the Cr-trihalides) have the H-phase symmetry shown in Fig. 1a-c. Most 2D materials (e.g., transition metal dichalcogenides) have two stable phases, the H and T phases. These two phases often have similar thermodynamic stabilities, and the ground state phase can depend on the environment Vettier and Yelon (1975); Xu et al. (2013); Ghosh et al. (2021); Wang et al. (2021); Li et al. (2020). Though H-phase FeCl2 has yet to be synthesized, computational studies show that H-FeCl2 is dynamically stable Zheng et al. (2018). Additionally, the mixed chalcogen and halide compounds in Table 1, known as Janus monolayers, exist and are under active areas of experimental and theoretical research Lu et al. (2017); Smaili et al. (2021). In sum, the majority of our tabulated compounds, including H-phase FeCl2, should be experimentally realizable.
In terms of comparing Table 1 to the literature, V-chalcogenides have been studied most intensively. For VS2, =E(FM-AFM) of -47, -70 and -158 meV/f.u. were reported using PBE, LDA+U and HSE functionals, respectively Fuh et al. (2016); Zhuang and Hennig (2016), while of -77 and -89 meV/f.u. were found for VSe2 and VTe2 using PBE Fuh et al. (2016): all are in good agreement with Table 1. A of -249 meV was reported for FeCl2 using PBE Zheng et al. (2018), although this is considerably larger than our value of -182 meV. Prior work has found that the magnetic coupling in VS2 originates from superexchange interactions through S atoms Zhuang and Hennig (2016) and agrees with the Goodenough-Kanamori-Anderson rules: superexchange of orthogonal configuration is dominated by the FM contributions Goodenough (1955); Kanamori (1959); Blasse (1965). Investigating the densities of states in FM and AFM phases, we find that the reason FM interactions are strongly favored in Fe-halides and V-chalcogenides is due to very small crystal field splitting in these materials across the electronic gap compared to Cr-halides. Fe-halides also have stronger exchange splitting compared to V-chalcogenides which can explain increased in these compounds Sup (a).
We find that the theoretical piezoelectric and elastic constants of FeCl2 are similar to those of other 2D materials Blonsky et al. (2015); Duerloo et al. (2012): FeCl2 has a strain piezoelectric constant of pm/V, a piezoelectric constant of pC/m, and elastic coefficients and N/m. FeCl2 monolayers have the m2 point group symmetry so and are the only independent piezoelectric coefficients De Jong et al. (2015).
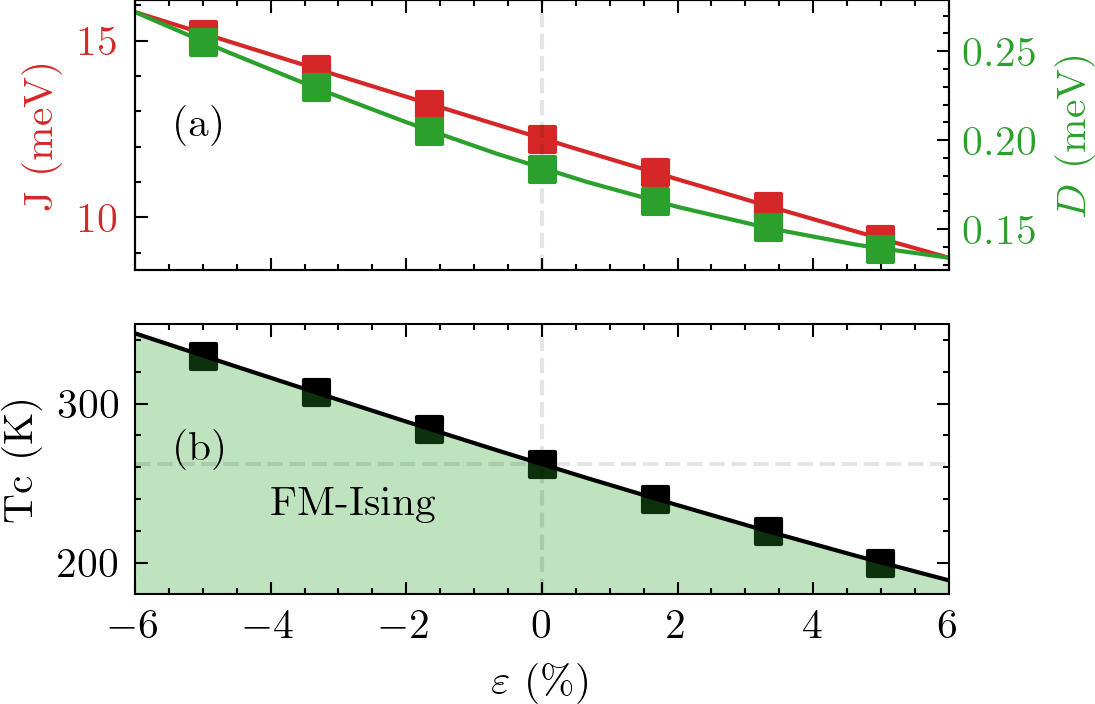
Materials engineering — We will now discuss various strategies to manipulate and enhance the ferromagnetism of FeCl2 as it is the only Ising ferromagnet in our dataset. In Fig. 2, we explain how the magnetic coupling constants and Curie temperature of monolayer FeCl2 change as a function of strain. To obtain the magnetic coupling parameters, we use the XXZ spin Hamiltonian to describe the spin moments on the Fe atoms:
| (1) |
The sums run over Fe atoms, and pair interactions include the nearest neighbor Fe atoms. The first term describes easy-axis onsite anisotropy, and the second term is the isotropic Heisenberg exchange. When , FM interactions are favored, whereas favors AFM configurations. The last term, , is the anisotropic symmetric exchange that captures the magnetic anisotropy due to coupling between Fe sites via the ligands and is related to the strength of spin-orbit coupling interactions on the ligand atoms. We find that the magnetic interactions are short-ranged within the first nearest neighbors and that the anisotropic exchange is negligible in FeCl2 Sup (a). To determine the magnetic coupling parameters from DFT, we use the FM and striped AFM phases with spins oriented in in-plane () and out-of-plane () directions. Using the and determined from the DFT calculations at each strain level, we determine the critical transition temperature () using linear spin-wave theory Toth and Lake (2015) up to second-order terms Sup (a) using our in-house code Sup (b). Fig. 2(b) shows that at equilibrium the is about 260 K, while at reasonable strain values, achievable using a substrate, can be tuned between 200 and 320 K.
In terms of piezoelectric response, Fig. 2 shows that 0.1% strain changes by 1 K, and this in-plane strain can be obtained with electric fields of 3 kV/cm in MoSe2 Mitra et al. (2020). As MoSe2 and FeCl2 have similar coefficients, fields of a few tens of kV/cm, which are attainable in similar systems Lei et al. (2013), will lead to significant changes in of order 10 K and a clear change of magnetic phase from FM to paramagnetic (PM) at a fixed temperature. However, a full FM to PM phase change may not be necessary for applications: smaller magnetic modulations can lead to domain wall propagation in nanowires of 2D ferromagnets which can enable spintronic data storage Lei et al. (2013).
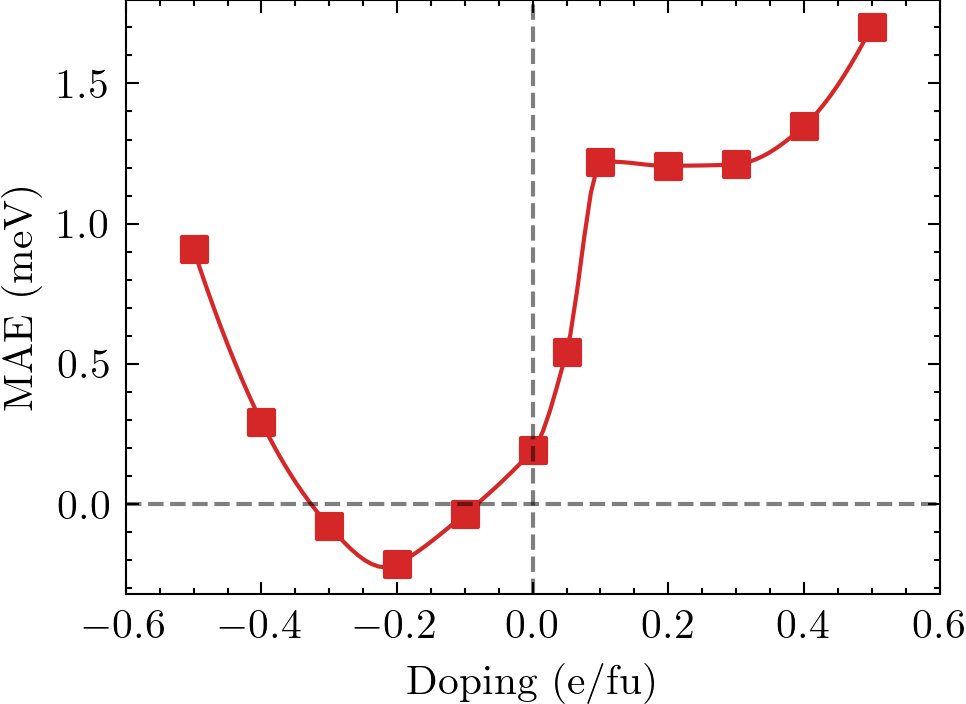
Beyond strain, one can enhance the easy-axis MA of FeCl2 via charge transfer between the monolayer and external material. Fig. 3 shows the doping dependence of the MAE. Even a modest hole doping of 0.05 per formula unit makes increase threefold from 0.18 meV to 0.54 meV. A change transfer of 0.05 per formula unit means a downward shift of eV in the Fermi level compared to the valence band edge, therefore only the occupations of the minority spin -electrons are modified.
Materials analysis and discussion — Although ab initio calculations of MAE (c.f. Table 1) are useful to screen materials, such calculations often only provide orbital or site decomposed MAE from integration over the entire Brillouin zone (BZ). The MAE is a delicate quantity that originates from spin-orbit interactions and depends on the distribution of valence and conduction spin and orbital states over the BZ. Hence, an analysis of MAE requires a more fine-grained description.
A second-order perturbation theory analysis of the MAE can provide band, k-vector, and spin decomposition of the MAE for a deeper understanding of the electronic band structure Wang et al. (1993). The second-order treatment begins with the atomic spin-orbit coupling on each atom ( and are defined as spin and atomic orbital angular momentum operators). One begins with a collinear description of the spins before adding the perturbation, so the spin operator acts globally on each Bloch state. Thus the spin-orbit perturbation due to multiple atoms takes the form where runs over the atomic sites in the material with site-dependent spin-orbit constants . Physically, the spin moment is localized on the transition metal atoms: when refers to the same site as , we have a direct SOC coupling with being the intrinsic SOC parameter for the atom; otherwise, we have an indirect SOC coupling and the associated is an effective parameter deriving from the metal-ligand hopping parameters and differences of their energy levels Kim et al. (2020). Within second-order perturbation theory, the MAE contribution from the atomic site is Wang et al. (1993):
| (2) |
In Eq. 2, and refer to valence and conduction bands, is the reciprocal grid index, is a DFT Bloch state, the spin indices take the values , and are DFT band energies. To calculate the MAE of Eq. 2, we expand the valence and conduction band states of atom-centered orbitals : e.g.,
DFT postprocessing provides the inner products for real-valued (e.g., or ), and we compute by rewriting the angular character of the as linear combinations of spherical harmonics and using textbook angular momentum matrices in the basis. When one atom dominates the MAE, analysis of the MAE from Eq. 2 can ignore the numerical value of since it simply acts as an overall scaling.
Eq. 2 is not so useful as it stands since it produces an aggregate site-specific MAE like standard DFT calculations. But, since it is an analytical formula as a sum over interband transitions, we can define an MAE density for pairs of valence and conduction energies to see fine-grained and energy-resolved contributions:
| (3) |
One can integrate this density along the valence and conduction energies to get quantities directly comparable to the density of states (DOS): the valence MAE density is MAE, and the conduction MAE density is MAE. One can also define cumulative integrals for each density: CMAE and CMAE. At , both are equal to the total MAEi, .
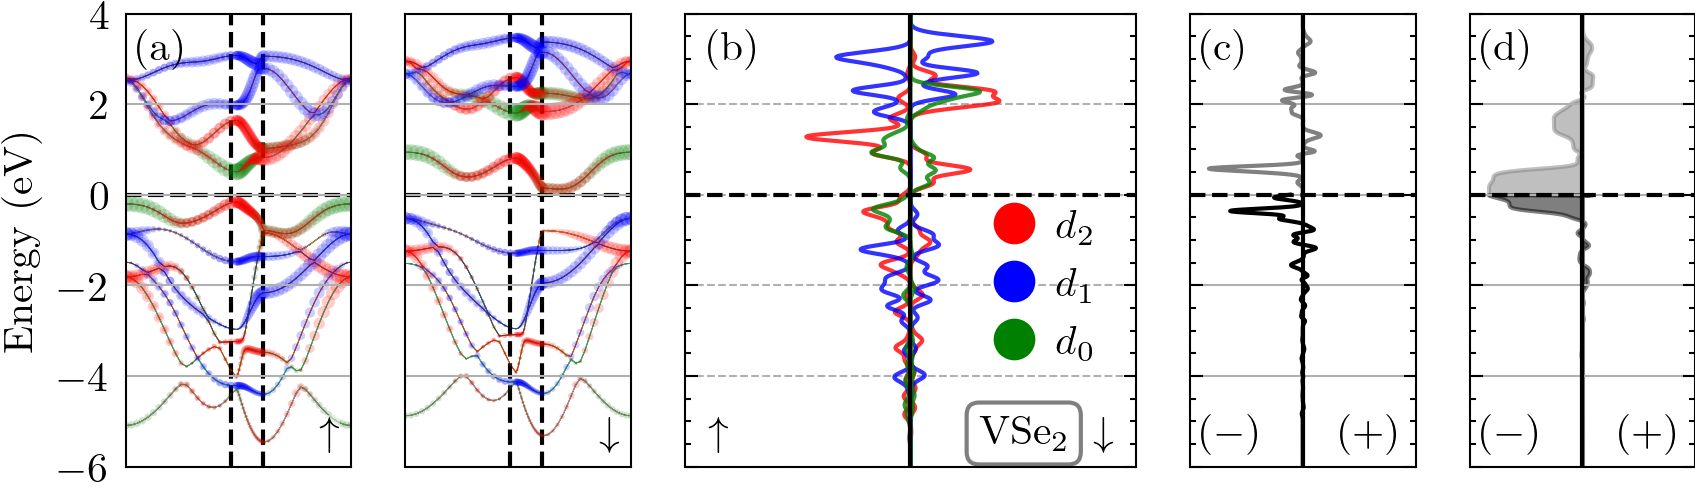
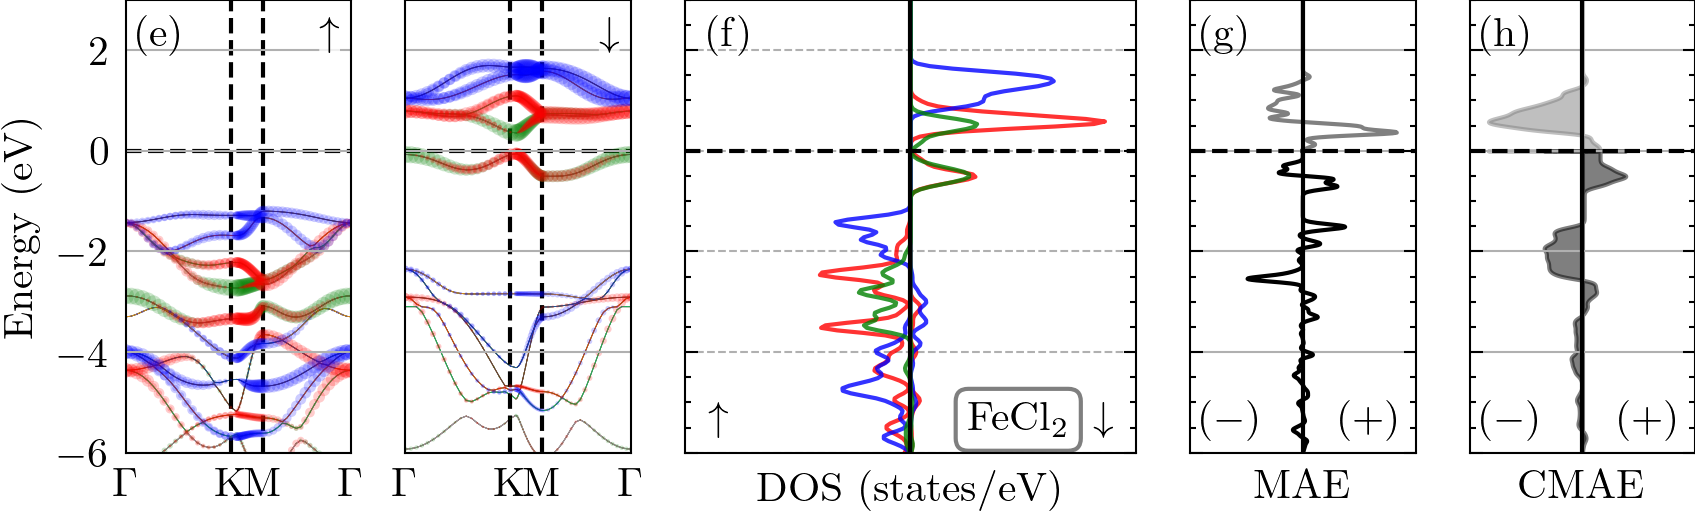
We begin the analysis with a comparison and discussion of the electronic structure of VSe2 and FeCl2. The trigonal prismatic symmetry of the H phase leads to the -orbital crystal field levels shown in Fig. 1(d): the non-degenerate is lowest in energy (denoted as ), followed by the degenerate pair / (denoted as ), and the degenerate pair / () is highest in energy. This ordering strictly holds at the -point in the band structures of Fig. 4, but we caution in making broad arguments based on this: the orbital projections show significant mixing of different orbitals within a given band across the BZ. The lowest energy conduction and valence bands have mixed / character across the BZ in both FeCl2 and VSe2. Since both monolayers are insulators, it is easy to see that Fe2+ has formal valence in FeCl2 whereas V4+ has valence in VSe2. A key difference between the two insulators is that the lowest energy interband transition in FeCl2 is spin-preserving (minority to minority) while for VSe2 it is a spin-flip process (majority to minority). Table 1 shows that the Fe or V MAE completely dominates the total MAE with lighter ligands. Ligand contribution to MAE is negative, except for a small positive contribution in FeCl2, which can qualitatively depend on the orthogonalization of the atomic orbitals at small magnitudes Steiner et al. (2016). Hence, we need to focus only on the contributions from transition metal sites to MAE and respective electronic structures to understand the origin of the positive MAE in FeCl2.
Origin of the negative MAE of VSe2 is relatively straightforward to understand: the valence MAEv is dominated by the highest energy valence band while the conduction MAEc is dominated by the lowest conduction band as shown in Fig. 4a-d. (The small and fluctuating valence MAE below eV in Fig. 4c is due to the weak hybridization of V- and Se- states in the Se -dominated valence bands.) Both these valence/conduction bands are mixtures of and orbitals, and the only non-zero angular momentum matrix elements are among orbitals, Sup (a). The spin-flip nature of the low energy transition means in Eq. 2 hence, giving a negative MAEV. We argue that choices are limited to drive a positive MAE in these materials. The tensile strain would drive the V towards the atomic limit by reducing mixing in the low-energy valence and conduction bands and thus reduce the magnitude of the MAE. On the other hand, enhanced exchange splitting (e.g., an enlarged acting on the manifold) would push the minority bands higher in energy and thus turn the lowest energy transition into a spin-conserving one between majority spin bands with and possibly create positive MAE. However, typical ions such as Sc2+ or Ti3+ are expected to have smaller exchange splittings than V4+ making this difficult to achieve, as per the examples in Table 1. The effect of heavier ligands for strong indirect SOC will be analyzed further below.
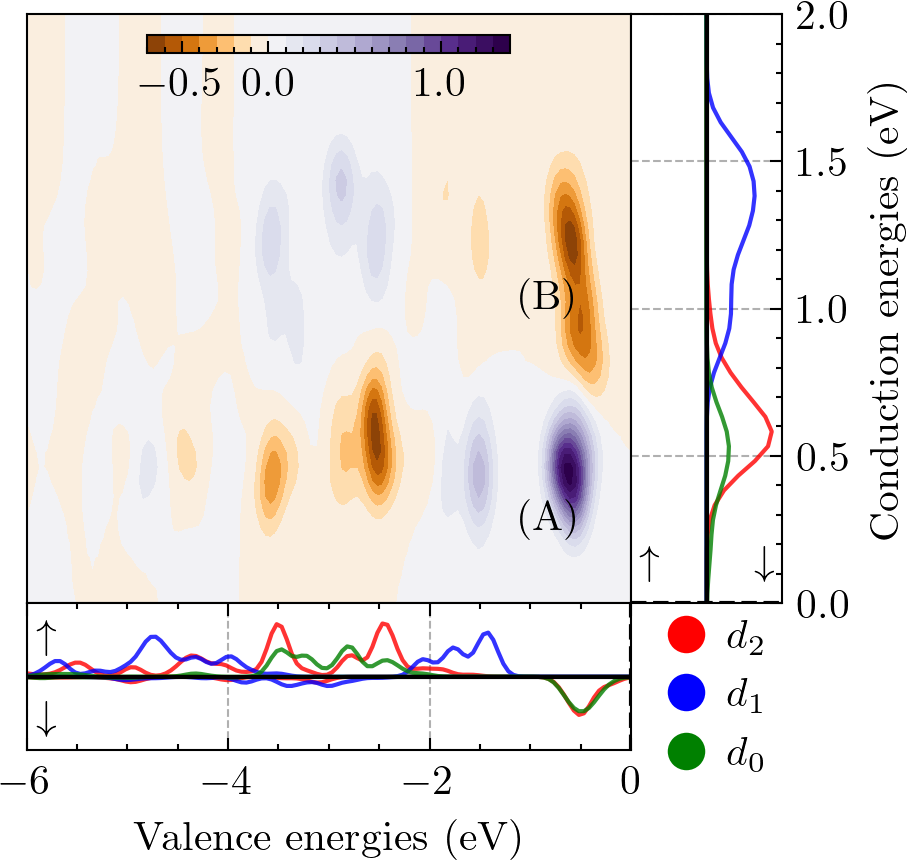
We now turn to the MAE analysis of the FeCl2 Fe-site which is a bit more involved than VSe2 V-site due to the filled majority spin Fe- states. The valence and conduction CMAE plots in Fig. 4h show that the total MAE is dominated by the highest energy valence band and the low-lying conduction bands. The valence MAE (Fig. 4g) has significant values at energies eV and lower corresponding to the low-energy filled majority spin -bands, but their net integrated effect is negligible since CMAEv is very close to zero at eV. Such cancellation is expected for a full atomic shell, especially if it has full rotational symmetry; using a simple cluster model with the trigonal prismatic ligand field, we show that only a weak contribution to MAE is expected when the majority spins are fully occupied and the minority spin is empty or only the state is occupied Sup (a). Thus, the total MAE in FeCl2 is determined by the interband transitions between the filled and empty minority bands. Fig. 4g shows that the MAE has a prominent positive peak at eV and smaller but widers peak above this energy up to eV. The MAE has a positive peak near eV and a smaller negative peak around eV. Hence, compared to VSe2 where there was only one type of prominent interband transition, in FeCl2 we have strong positive and negative MAE contributions that sum up to a net positive final answer. To visualize this point directly, Fig. 5 displays the MAE density (Eq. 3) for FeCl2 along with valence and conduction densities of states: a strong positive peak (A) is visible near (, ) coming from the interaction of the highest valence and lowest conduction band (both having character) while a broader negative peak (B) near (, ) comes from the interaction of highest valence band with higher energy conduction bands having primarily character. Inspection of the matrices Sup (a) shows that peak (A) is due to while peak (B) is from interactions. Since for transitions between the same spin (minority) bands, Eq. 2 then explains the signs of peaks (A) and (B). Finally, the positive-signed interactions (A) correspond to smaller transition energies, a smaller denominator in Eq. 2, and a larger overall contribution leading to a net positive MAE.
The analysis of MAE densities also easily explains the behavior of the total MAE versus small doping seen in Fig. 3. The MAEv in Fig. 4(c) has a negative peak right below (peak (B) of Fig. 5): hole doping pushes down the Fermi energy and removes part of this negative MAE contribution. Conversely, electron doping moves up in energy and removes the positive contributions of MAEc right above the Fermi energy hence driving the total MAE to smaller and eventually negative values.
The MAE analysis of FeCl2 and VSe2 helps us extrapolate to other high-spin transition metal electronic configurations in trigonal prismatic symmetry. We will assume that the primary low-energy orbital mixing is between and and that higher energy bands are mainly of character. The main lesson from the and cases above is that a large exchange splitting, , would help such systems achieve positive MAE via the direct spin-orbit interaction effect on the transition metal site (not the ligands) since the lowest energy transitions would be between the same spin channels with and via the matrix elements. Under trigonal pyramidal symmetry, only other likely high-spin magnetic insulating phases are , , and transition metal electronic configurations. For a high-spin case with large , while would be satisfied, the dominant interaction would now be of type leading to negative MAE. For with small , would hold, but interactions would dominate due to their small energy denominators and give negative MAE contributions. Stabilizing a high-spin configuration requires a sizeable in the first place, and for a cluster model Sup (a), we expect the MAE to be always positive but small and scaling as . The picture for with large is identical to , leading to negative MAE since the contribution from majority spin electrons would be negligible. For a with small , the main low-energy contributions would come from spin-conserving and spin-flip interactions, both of which give negative MAE.
Our final analysis will explain the robust trend of decreasing MAE with heavier ligands seen in Table 1: heavy enough ligands (e.g., I or Te) which will dominate the SOC and the MAE. We can apply the perturbation analysis, Eq. 2 to these systems, but we remember that we are describing an indirect SOC effect: the parameter is modified from its pure atomic value at the ligand sites Kim et al. (2020), and the angular momentum operators act on the ligand valence orbital manifold.
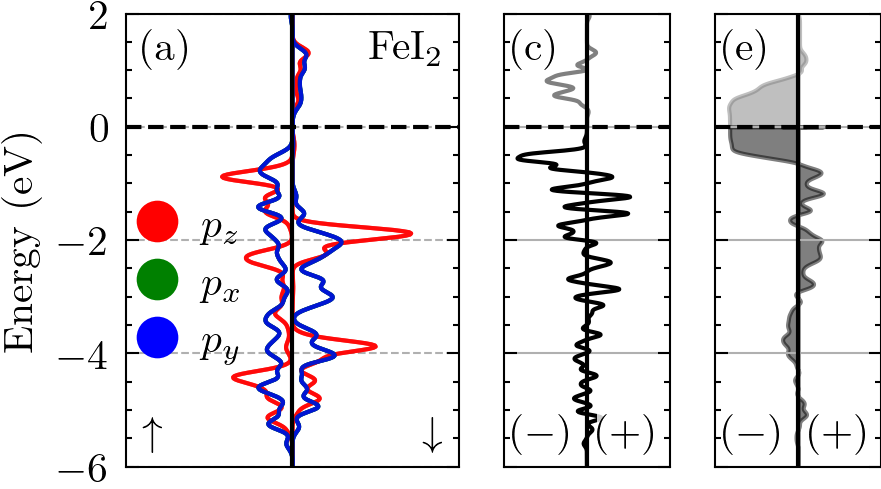
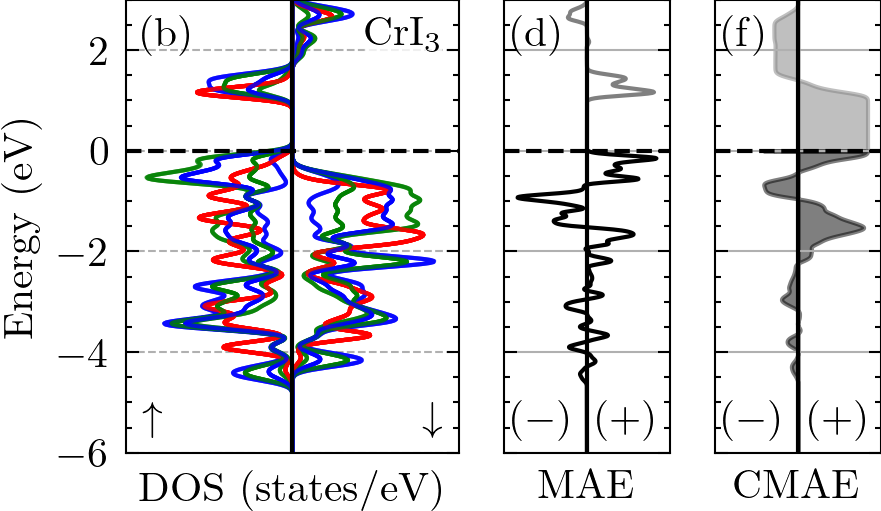
We compare CrI3 and FeI2 to understand their opposite signed total MAEs via an analysis of the I-5 contributions. Figs. 6a,b show spin-polarized I-5 DOS above the Fermi level which stem from hybridization to the spin-polarized Fe and Cr-3 states, and therefore one can get finite MAE contributions in Eq. 2 from I- interband transitions. For FeI2, the low-energy conduction I- DOS is for minority spin, whereas in CrI3 the low energy conduction bands are of majority spin. The conduction MAEc densities in Figs. 6c,d show that the total MAE is determined primarily by interactions with the lowest conduction bands ( to about in energy). The valence MAEv contribution is similarly controlled by interactions with the highest valence bands ( to ). In both materials, the valence band maxima are of majority spin character. We have analyzed in detail the contributions from the and terms in Eq. 2 across the BZ and find that the matrix element contributions dominate. Since the lowest energy transition in FeI2 involves a spin-flip with while in CrI3 it is spin conserving (), explaining the sign of the total MAE.
The MAE densities in Fig. 6(e) also show that hole doping of CrI3 should lead to a decrease in the MAE (due to the removal of positive contributions near the valence band maximum) which agrees with the prior ab initio MAE results Kim et al. (2020). However, our analysis disagrees with their explanation of this effect: their qualitative discussion, based on band structure visualization and mean angular momenta, argues that interactions should dominate while we have explicitly verified that interactions are the key ones. We note that MAE is a quantity derived from integration across the BZ, and with significant orbital mixing in the low-energy bands, MAE contributions in energy space are best compared to the BZ-integrated density of states.
In summary, we studied piezoelectric ferromagnetic two-dimensional monolayers using the first-principles density functional theory. Our data mining yields a single monolayer, FeCl2, with a finite electronic bandgap, no inversion symmetry, and ground-state ferromagnetic ordering. Using linear spin-wave theory, we show that FeCl2 has a Tc of 260 K. Magnetic anisotropy of FeCl2 can be enhanced using hole doping and compressive strain. Our analysis based on magnetic anisotropy densities directly connects the magnetic anisotropy properties of each material to key features of its electronic structure and thereby helps provide tools for the community interested in the design of magnetic materials.
Methods — All first-principles calculations for materials screening and engineering use density functional theory (DFT) with the Perdew-Burke-Ernzerhof (PBE) exchange-correlation functional Perdew et al. (1996) as implemented in the VASP 5.4.1 software Kresse and Furthmüller (1996a, b). We use a kinetic energy cutoff of 520 eV, periodic boundary conditions, projector-augmented wave (PAW) pseudopotentials, Kresse and Joubert (1999) and dipole correction Neugebauer and Scheffler (1992). A reciprocal grid density of 250 Å-3 is used which corresponds to 12121 for monolayer FeCl2. The MA energy (MAE) of a 2D material is
where is the ground state energy as a function of the spin quantization axis : positive MAE means easy axis whereas negative MAE means easy-plane. The screening was automated using the atomate Mathew et al. (2017) and pymatgen Ong et al. (2013) software.
The analysis of MAE via second-order perturbation theory used the Quantum Espresso 7.0 software Giannozzi et al. (2009), PBE, and fully relativistic ultrasoft pseudopotentials from PSLibrary 1.0.0 Dal Corso (2014); Lejaeghere et al. (2016). A plane-wave cutoff of 100 Ry and a 12121 k-grid were found to converge total energies to 1 meV/atom. Post-processing software tools generate the overlaps of Bloch states and real-valued atomic orbitals Sup (b). Curie temperatures are calculated using linear spin-wave theory Toth and Lake (2015); Lado and Fernández-Rossier (2017) using up to second-order terms Sup (b). We calculate piezoelectric coefficients using density functional perturbation theory (DFPT) Baroni et al. (1987, 2001) and elastic coefficients using finite differences.
Data availability — Structural coordinates and all the scripting/programming tools used to realize this work are available through Zenodo database with DOI number (X). The authors declare that other data related to this research are available within the paper and its Supplementary Information, or from the authors upon reasonable request.
Acknowledgements — We thank the Army Research Office via grant W911NF-19-1-0371 for support of this work. We thank the Yale Center for Research Computing for guidance and use of the research computing infrastructure. We also thank the Extreme Science and Engineering Discovery Environment (XSEDE), which is supported by the National Science Foundation grant number ACI-1548562, for computer time on the Expanse supercomputer via XSEDE allocation MCA08X007.
References
- Spaldin and Ramesh (2019) N. A. Spaldin and R. Ramesh, Nat. Mater. 18, 203 (2019).
- Ramesh and Spaldin (2007) R. Ramesh and N. A. Spaldin, Nat. Mater. 6, 21 (2007).
- Ma et al. (2011) J. Ma, J. Hu, Z. Li, and C.-W. Nan, Adv. Mater. 23, 1062 (2011).
- Mermin and Wagner (1966) N. D. Mermin and H. Wagner, Phys. Rev. Lett. 17, 1133 (1966).
- Halperin (2019) B. I. Halperin, J. Stat. Phys. 175, 521 (2019).
- Carteaux et al. (1995) V. Carteaux, D. Brunet, G. Ouvrard, and G. Andre, J. Phys. Condens. Matter 7, 69 (1995).
- Huang et al. (2017) B. Huang, G. Clark, E. Navarro-Moratalla, D. R. Klein, R. Cheng, K. L. Seyler, D. Zhong, E. Schmidgall, M. A. McGuire, D. H. Cobden, W. Yao, D. Xiao, P. Jarillo-Herrero, and X. Xu, Nature 546, 270 (2017).
- Roemer et al. (2020) R. Roemer, C. Liu, and K. Zou, npj 2D Mater. Appl. 4, 33 (2020).
- Deng et al. (2018) Y. Deng, Y. Yu, Y. Song, J. Zhang, N. Z. Wang, Z. Sun, Y. Yi, Y. Z. Wu, S. Wu, J. Zhu, J. Wang, X. H. Chen, and Y. Zhang, Nature 563, 94 (2018), arXiv:1803.02038 .
- Bonilla et al. (2018) M. Bonilla, S. Kolekar, Y. Ma, H. C. Diaz, V. Kalappattil, R. Das, T. Eggers, H. R. Gutierrez, M. H. Phan, and M. Batzill, Nat. Nanotechnol. 13, 289 (2018).
- Wang et al. (2021) X. Wang, D. Li, Z. Li, C. Wu, C.-M. Che, G. Chen, and X. Cui, ACS Nano 15, 16236 (2021).
- Fuh et al. (2016) H. R. Fuh, C. R. Chang, Y. K. Wang, R. F. Evans, R. W. Chantrell, and H. T. Jeng, Sci. Rep. 6, 1 (2016).
- Zhuang and Hennig (2016) H. L. Zhuang and R. G. Hennig, Phys. Rev. B 93, 054429 (2016).
- Lei et al. (2013) N. Lei, T. Devolder, G. Agnus, P. Aubert, L. Daniel, J. V. Kim, W. Zhao, T. Trypiniotis, R. P. Cowburn, C. Chappert, D. Ravelosona, and P. Lecoeur, Nat. Commun. 4, 1 (2013).
- Eerenstein et al. (2007) W. Eerenstein, M. Wiora, J. L. Prieto, J. F. Scott, and N. D. Mathur, Nat. Mater. 6, 348 (2007).
- Torelli et al. (2020) D. Torelli, H. Moustafa, K. W. Jacobsen, and T. Olsen, npj Comput. Mater. 6, 158 (2020).
- Kim et al. (2019) H. H. Kim, B. Yang, S. Li, S. Jiang, C. Jin, Z. Tao, G. Nichols, F. Sfigakis, S. Zhong, C. Li, S. Tian, D. G. Cory, G. X. Miao, J. Shan, K. F. Mak, H. Lei, K. Sun, L. Zhao, and A. W. Tsen, Proc. Natl. Acad. Sci. U. S. A. 166, 11131 (2019).
- Tiwari et al. (2021) S. Tiwari, M. L. Van De Put, B. Sorée, and W. G. Vandenberghe, Phys. Rev. B 103, 14432 (2021).
- Lado and Fernández-Rossier (2017) J. L. Lado and J. Fernández-Rossier, 2D Materials 4, 035002 (2017).
- Sup (a) (a), link to SI.
- Vettier and Yelon (1975) C. Vettier and W. B. Yelon, J. Phys. Chem. Solids 36, 401 (1975).
- Xu et al. (2013) K. Xu, P. Chen, X. Li, C. Wu, Y. Guo, J. Zhao, X. Wu, and Y. Xie, Angew. Chemie - Int. Ed. 52, 10477 (2013).
- Ghosh et al. (2021) R. K. Ghosh, A. Jose, and G. Kumari, Phys. Rev. B 103, 054409 (2021).
- Li et al. (2020) D. Li, X. Wang, C. M. Kan, D. He, Z. Li, Q. Hao, H. Zhao, C. Wu, C. Jin, and X. Cui, ACS Appl. Mater. Interfaces 12, 25143 (2020).
- Zheng et al. (2018) H. Zheng, H. Han, J. Zheng, and Y. Yan, Solid State Commun. 271, 66 (2018).
- Lu et al. (2017) A. Y. Lu, H. Zhu, J. Xiao, C. P. Chuu, Y. Han, M. H. Chiu, C. C. Cheng, C. W. Yang, K. H. Wei, Y. Yang, Y. Wang, D. Sokaras, D. Nordlund, P. Yang, D. A. Muller, M. Y. Chou, X. Zhang, and L. J. Li, Nat. Nanotechnol. 12, 744 (2017).
- Smaili et al. (2021) I. Smaili, S. Laref, J. H. Garcia, U. Schwingenschlögl, S. Roche, and A. Manchon, Phys. Rev. B 104, 104415 (2021).
- Goodenough (1955) J. B. Goodenough, Phys. Rev. 100, 564 (1955).
- Kanamori (1959) J. Kanamori, J. Phys. Chem. Solids 10, 87 (1959).
- Blasse (1965) G. Blasse, J. Phys. Chem. Solids 26, 1969 (1965).
- Blonsky et al. (2015) M. N. Blonsky, H. L. Zhuang, A. K. Singh, and R. G. Hennig, ACS Nano 9, 9885 (2015).
- Duerloo et al. (2012) K.-A. N. Duerloo, M. T. Ong, and E. J. Reed, J. Phys. Chem. Lett. 3, 2871 (2012).
- De Jong et al. (2015) M. De Jong, W. Chen, H. Geerlings, M. Asta, and K. A. Persson, Sci. Data 2015 21 2, 1 (2015).
- Toth and Lake (2015) S. Toth and B. Lake, J. Phys. Condens. Matter 27, 10 (2015), 1402.6069 .
- Sup (b) (b), link to codes and outputs using Zenodo.
- Mitra et al. (2020) S. Mitra, D. Srivastava, S. S. Singha, S. Dutta, B. Satpati, M. Karppinen, A. Ghosh, and A. Singha, npj 2D Mater. Appl. 4, 6 (2020).
- Wang et al. (1993) D. S. Wang, R. Wu, and A. J. Freeman, Phys. Rev. B 47, 14932 (1993).
- Kim et al. (2020) J. Kim, K. W. Kim, B. Kim, C. J. Kang, D. Shin, S. H. Lee, B. C. Min, and N. Park, Nano Lett. 20, 929 (2020).
- Steiner et al. (2016) S. Steiner, S. Khmelevskyi, M. Marsmann, and G. Kresse, Phys. Rev. B 93, 224425 (2016).
- Perdew et al. (1996) J. P. Perdew, K. Burke, and M. Ernzerhof, Physical Review Letters 77, 3865 (1996).
- Kresse and Furthmüller (1996a) G. Kresse and J. Furthmüller, Comput. Mater. Sci. 6, 15 (1996a).
- Kresse and Furthmüller (1996b) G. Kresse and J. Furthmüller, Phys. Rev. B. Condens. Matter 54, 11169 (1996b).
- Kresse and Joubert (1999) G. Kresse and D. Joubert, Phys. Rev. B 59, 11 (1999).
- Neugebauer and Scheffler (1992) J. Neugebauer and M. Scheffler, Phys. Rev. B 46, 16067 (1992).
- Mathew et al. (2017) K. Mathew, J. H. Montoya, A. Faghaninia, S. Dwarakanath, M. Aykol, H. Tang, I. heng Chu, T. Smidt, B. Bocklund, M. Horton, J. Dagdelen, B. Wood, Z. K. Liu, J. Neaton, S. P. Ong, K. Persson, and A. Jain, Comput. Mater. Sci. 139, 140 (2017).
- Ong et al. (2013) S. P. Ong, W. D. Richards, A. Jain, G. Hautier, M. Kocher, S. Cholia, D. Gunter, V. L. Chevrier, K. A. Persson, and G. Ceder, Comput. Mater. Sci. 68, 314 (2013).
- Giannozzi et al. (2009) P. Giannozzi, S. Baroni, N. Bonini, M. Calandra, R. Car, C. Cavazzoni, D. Ceresoli, G. L. Chiarotti, M. Cococcioni, I. Dabo, A. D. Corso, S. de Gironcoli, S. Fabris, G. Fratesi, R. Gebauer, U. Gerstmann, C. Gougoussis, A. Kokalj, M. Lazzeri, L. Martin-Samos, N. Marzari, F. Mauri, R. Mazzarello, S. Paolini, A. Pasquarello, L. Paulatto, C. Sbraccia, S. Scandolo, G. Sclauzero, A. P. Seitsonen, A. Smogunov, P. Umari, and R. M. Wentzcovitch, Journal of Physics: Condensed Matter 21, 395502 (2009).
- Dal Corso (2014) A. Dal Corso, Comput. Mater. Sci. 95, 337 (2014).
- Lejaeghere et al. (2016) K. Lejaeghere, G. Bihlmayer, T. Björkman, P. Blaha, S. Blügel, V. Blum, D. Caliste, I. E. Castelli, S. J. Clark, A. D. Corso, S. de Gironcoli, T. Deutsch, J. K. Dewhurst, I. D. Marco, C. Draxl, M. Dułak, O. Eriksson, J. A. Flores-Livas, K. F. Garrity, L. Genovese, P. Giannozzi, M. Giantomassi, S. Goedecker, X. Gonze, O. Grånäs, E. K. U. Gross, A. Gulans, F. Gygi, D. R. Hamann, P. J. Hasnip, N. A. W. Holzwarth, D. Iuşan, D. B. Jochym, F. Jollet, D. Jones, G. Kresse, K. Koepernik, E. Küçükbenli, Y. O. Kvashnin, I. L. M. Locht, S. Lubeck, M. Marsman, N. Marzari, U. Nitzsche, L. Nordström, T. Ozaki, L. Paulatto, C. J. Pickard, W. Poelmans, M. I. J. Probert, K. Refson, M. Richter, G.-M. Rignanese, S. Saha, M. Scheffler, M. Schlipf, K. Schwarz, S. Sharma, F. Tavazza, P. Thunström, A. Tkatchenko, M. Torrent, D. Vanderbilt, M. J. van Setten, V. V. Speybroeck, J. M. Wills, J. R. Yates, G.-X. Zhang, and S. Cottenier, Science 351, aad3000 (2016).
- Baroni et al. (1987) S. Baroni, P. Giannozzi, and A. Testa, Phys. Rev. Lett. 58, 1861 (1987).
- Baroni et al. (2001) S. Baroni, S. de Gironcoli, A. Dal Corso, and P. Giannozzi, Rev. Mod. Phys. 73, 515 (2001).