Are there larger stellar velocity dispersions in low redshift Type-1 AGN than in Type-2 AGN?
Abstract
The main objective is to check the Unified Model (UM) expected similar stellar velocity dispersions between Type-1 AGN and Type-2 AGN, then to provide further clues on BH mass properties. Not similar as previous comparisons of BH masses estimated by relations to Type-2 AGN but Virial BH masses in Type-1 AGN, reliable stellar velocity dispersions measured through absorption features around 4000Å are directly compared between so-far the largest samples of 6260 low redshift () Type-1 AGN and almost all the Type-2 AGN in SDSS DR12. Although half of Type-1 AGN do not have measured due to unapparent absorption features overwhelmed by AGN activities, both properties of mean spectra of Type-1 AGN with and without measured and positive dependence of on [O iii] luminosity can lead to statistically larger of all the Type-1 AGN than the 6260 Type-1 AGN with measured stellar velocity dispersions. Then, direct comparisons can lead to statistically larger in Type-1 AGN, with confidence level higher than 10sigma, after considering necessary effects of different redshift and different central AGN activities. Although Type-1 AGN have only about % larger than Type-2 AGN, the difference cannot be well explained at current stage. Unless there was strong evidence to support different relations or to support quite different evolution histories between Type-1 AGN and Type-2 AGN, the statistically larger in Type-1 AGN provides a strong challenge to the Unified model of AGN.
1 Introduction
The well-known constantly being revised Unified Model (UM) of AGN (Active Galactic Nuclei) has been widely accepted to explain most of different observational phenomena between broad line AGN (Type-1 AGN) and narrow line AGN (Type-2 AGN), due to effects of different orientation angles of central accretion disk Antonucci (1993), combining with different central activities and different properties of inner dust torus etc. (Marinucci et al., 2012; Oh et al., 2015; Mateos et al., 2016; Balokovic et al., 2018; Brown et al., 2019; Kuraszkiewicz et al., 2021). More recent reviews on the UM can be found in Bianchi et al. (2012) and in Netzer (2015). Considering different viewing angles relative to central dust torus, the UM simply indicates that Type-2 AGN are intrinsically like Type-1 AGN, but Type-2 AGN have their central accretion disk around black hole (BH) and broad line regions (BLRs) seriously obscured by central dust torus, leading to no optical broad line emission features in Type-2 AGN. The simple UM has been strongly supported by clearly detected polarized broad emission lines and/or clearly detected broad infrared emission lines for some Type-2 AGN (Miller & Goodrich, 1990; Heisler, Lumsden & Bailey, 1997; Tran, 2003; Nagao et al., 2004; Onori et al., 2017; Savic et al., 2018; Moran et al., 2020), and the strong resonance of silicate dust at 10 seen in absorption towards many Type-2 AGN but in emission in Type-1 AGN (Siebenmorgen et al., 2005).
However, even after necessary modifications to the UM, such as different properties of central dust torus and central activities, there are some other challenges to the UM. Franceschini et al. (2002) have supported different evolutionary patterns in Type-1 and Type-2 AGN. Hiner et al. (2009) have shown higher average star formation rates in Type-2 AGN than in Type-1 AGN. More recently, Villarroel & Korn (2014) have shown different neighbours around Type-1 AGN and Type-2 AGN. Zou et al. (2019) have shown that Type-1 AGN tend to have lower stellar masses of host galaxies than Type-2 AGN, through 2463 X-ray selected AGN in the COSMOS field. Bornancini & Garcia Lambas (2020) have discussed different host galaxy properties, such as UV/optical/IR colours and masses, together with differences in projected galaxy density at small scales (smaller than 100 kpc) and neighbouring galaxy properties, to favour an evolutionary scenario rather than a strict unified model in obscured and unobscured AGN. As detailed discussions in Netzer (2015), the UM has been successfully applied to explain different features between Type-1 and Type-2 AGN in many different ways, however, there are many other features of structures/environments proved to be far from homogeneous among the AGN family.
Based on commonly accepted framework of the UM, BH mass properties could be expected to be similar between Type-1 AGN and Type-2 AGN. As a pioneer work in Netzer (2009), similar BH masses have been found between Type-1 AGN and Type-2 AGN with redshift from 0.1 to 0.2, although the main objective of Netzer (2009) is to check effects of radiation pressure force on gas dynamics in BLRs of AGN. BH masses in Netzer (2009) are estimated by the well-known relations (Ferrarese & Merritt, 2000; Gebhardt et al., 2000) in Type-2 AGN but by the Virialization assumption (Vestergaard, 2002; Peterson et al., 2004; Shen et al., 2011; Rafiee & Hall, 2011) applied in Type-1 AGN. However, in recent years, relations with much different slopes have been reported in different literature for different samples of objects,
| (1) |
The relation with has been firstly reported in Ferrarese & Merritt (2000); Gebhardt et al. (2000), based on dynamic measured BH masses and stellar velocity dispersions of a small sample of nearby quiescent galaxies. More recent reviews of the relations can be found in Kormendy & Ho (2013), McConnell & Ma (2013) and Savorgnan & Graham (2015) for samples of quiescent galaxies.
Meanwhile, many studies have reported applications of relations from quiescent galaxies to broad line AGN, such as results in Barth et al. (2005); Woo et al. (2013); Ho & Kim (2014); Woo et al. (2015). After well applications of reverberation mapping technique (Blandford & McKee, 1982) to determine BLRs sizes (, distance between BLRs and central BH) in the sample of reverberation mapped broad line AGN in AGNWATCH project (http://www.astronomy.ohio-state.edu/~agnwatch) (Peterson et al., 2004), Onken et al. (2004) have reported a scaling factor required to bring reverberation-based BH masses into agreement with the quiescent galaxy relationship. And then, Woo et al. (2010) have reported a virial factor as based on an updated reverberation sample including the low-mass local Seyfert 1 galaxies in the Lick AGN Monitoring Project (LAMP) (https://www.physics.uci.edu/~barth/lamp.html) (Bentz et al., 2010; Barth et al., 2015; Williams et al., 2018). Graham et al. (2011) have reported a virial factor as , based on an updated relation of quiescent galaxies and an updated sample of AGN. Park et al. (2012) have shown a preferred virial factor as based on a preferred forward statistical estimations. Woo et al. (2015) have reported a virial factor relative to full width at half maximum as broad line width, considering narrow-line Seyfert 1 galaxies. Moreover, considering the reverberation mapped broad line AGN, there are some improved relations with much different slopes from 3.25 to 6.34 for different samples of objects listed and discussed in Bennert et al. (2015); Batiste et al. (2017); Zhang et al. (2019); Bennert et al. (2021), which should lead to different BH masses of Type-2 AGN with different relations accepted.
Based on the determined virial factors and the well-known R-L empirical relation for BLRs of reverberation mapped broad line AGN as discussed in Kaspi et al. (2000); Bentz et al. (2013), expression on virial BH masses of Type-1 AGN is being improved in common broad line AGN (not only in reverberation mapped broad line AGN), under the Virialization assumptions accepted to broad line emission clouds of central BLRs,
| (2) |
where represents Kepler velocity of broad line emission clouds which can be traced by broad emission line width, and shows hints of distance of BLRs () to central BH. Since the empirical R-L relation has been firstly reported by Kaspi et al. (2000) with through variabilities of broad Balmer emission lines of the 17 nearby PG quasars, the R-L relation has been modified to by more reverberation mapped broad line AGN with necessary corrections of host galaxy contaminations in Bentz et al. (2013). The well accepted different from the one used in Netzer (2009) should lead to different BH masses of Type-1 AGN. And moreover, there are different scale factors of in different literature. Meanwhile, for broad line AGN with measured stellar velocity dispersions, such as the AGN in Bennert et al. (2015), the virial BH masses have large scatters in space, leading to large uncertainties on statistical comparisons of virial BH masses of Type-1 AGN under the Virialization assumption and the BH masses of Type-2 AGN by the relations.
Moreover, some independent methods have been proposed and applied to estimate central BH mass of individual AGN. Brewer et al. (2011) have presented a direct BH mass measurement in the AGN Arp 151, based on motions of the gas responsible for the broad emission lines. Pancoast et al. (2017) have reported central BH mass measurements that does not depend upon the virial factor of five Seyfert 1 galaxies from the LAMP 2008 sample, by directly modelling the AGN continuum light curves and the broad H line profiles. And more recently, Williams et al. (2018) have reported central BH mass measurements of seven Seyfert 1 galaxies from the LAMP 2011 sample, by re-constructing dynamic structures of central BLRs. However, the proposed independent method to estimate central BH masses of AGN can not be widely applied in normal AGN with single-epoch spectra.
Different slopes in relations and different factors in Virialization assumptions can lead to different properties of estimated BH masses in Type-2 AGN and in Type-1 AGN. It is necessary and interesting to re-check BH mass properties between large samples of Type-1 AGN and Type-2 AGN by different but direct methods, which is the main objective of the manuscript. In the manuscript, rather than the relations applied to Type-2 AGN and the Virialization assumptions applied to Type-1 AGN, measured stellar velocity dispersions are directly compared between large samples of Type-2 AGN and Type-1 AGN from SDSS DR12 (Sloan Digital Sky Survey, Data Release 12, Alam et al. (2015)). Section 2 presents data samples of Type-1 AGN and Type-2 AGN, methods to measure stellar velocity dispersions through absorption features around 4000Å. Section 3 shows effects of AGN continuum emissions and broad line emissions on our measured stellar velocity dispersions in Type-1 AGN. Section 4 shows reliability of the measured stellar velocity dispersions. Section 5 shows the main results and necessary discussions. Section 6 gives the final summaries and conclusions. And in the manuscript, the cosmological parameters of , and have been adopted.
2 Data Samples and Methods to Measure Stellar Velocity Dispersions
2.1 Parent samples of Type-1 AGN and Type-2 AGN
The work is starting from parent samples of Type-1 AGN and Type-2 AGN. Here, only one criterion of redshift smaller than 0.3 () is applied to collect all the low redshift Type-1 AGN from SDSS pipeline classified QSOs (Richards et al., 2002; Ross et al., 2012; Peters et al., 2015; Lyke et al., 2020) in DR12, through the SDSS provided SQL (Structured Query Language) Search tool (http://skyserver.sdss.org/dr12/en/tools/search/sql.aspx) by the following query
where ’SpecObjall’ is the SDSS pipeline provided database including basic properties of spectroscopic emission features of emission line galaxies in SDSS DR12. More detailed information of the database ’SpecObjall’ can be found in http://skyserver.sdss.org/dr12/en/help/docs/tabledesc.aspx. The SQL query leads 12342 QSOs collected as Type-1 AGN included in the parent sample of Type-1 AGN. And the collected information of plate, fiberid and mjd can be conveniently applied to download SDSS spectra of the 12342 Type-1 AGN.
The same criteria combining with criterion of ’subclass=’AGN” are applied to collect all the low redshift Type-2 AGN from SDSS pipeline classified main galaxies in DR12 by the following query
where ’subclass=’AGN” can be applied to ensure the collected narrow emission line objects well classified as AGN based on the emission line properties. More detailed information of SDSS spectroscopic catalogs can be found in https://www.sdss.org/dr12/spectro/catalogs/. The query above leads 16269 narrow emission line galaxies collected as Type-2 AGN included in the parent sample of Type-2 AGN. Therefore, in the parent samples, there are 12342 Type-1 AGN and 16269 Type-2 AGN.
In the manuscript, high redshift () SDSS AGN are not considered, not only because that it is hard to measure reliable stellar velocity dispersions through spectroscopic features of high redshift SDSS AGN, but also because that the SDSS spectra of high redshift AGN will not completely cover the broad H emission features which will be applied to determine whether the collected Type-1 AGN have apparent broad emission lines.
2.2 Method to measure the stellar velocity dispersions
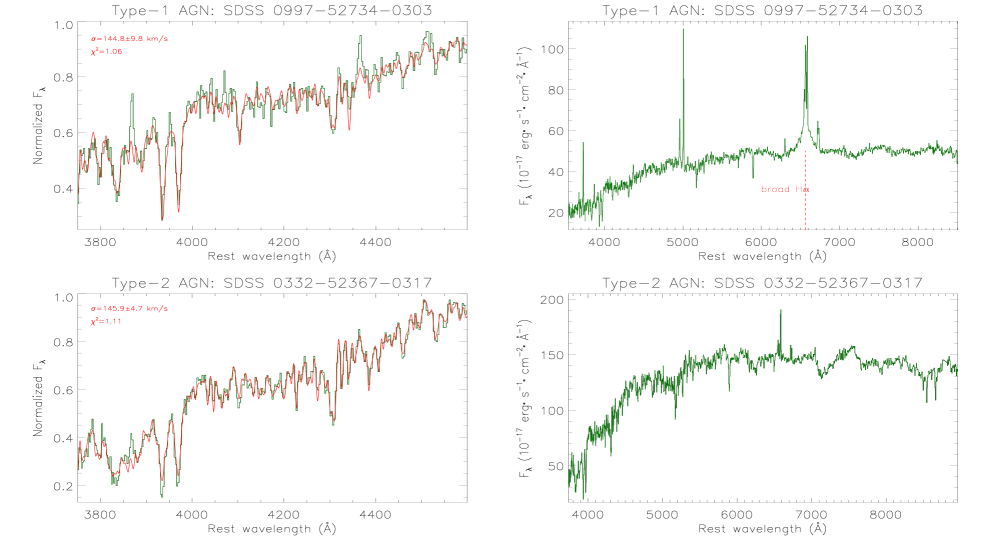
Stellar velocity dispersions are measured through absorption features within rest wavelength from 3750 to 4600Å described by one broadened template stellar spectrum plus one four-degree polynomial function111Higher order polynomial functions have few effects on the final measured velocity dispersions., similar as the direct fitting method proposed and discussed in Rix & White (1992); Barth et al. (2002); Greene & Ho (2006). Meanwhile, when the absorption features are described, the narrow emission lines are being masked out by line width (full width at zero intensity) about 450, including H, , He iÅ, Ca H & K, [S ii]Å, H, H and [O iii]Å, the broad emission lines are being masked out by full width at zero intensity about 3000, especially for the Balmer lines. Here, the 1273 template stellar spectra with high resolution about are collected from Indo-U.S. Coude Feed Spectral Library222https://www.noao.edu/cflib/ (Valdes et al., 2004). Then, through Levenberg-Marquardt least-squares minimization technique333 https://pages.physics.wisc.edu/~craigm/idl/cmpfit.html, absorption features around 4000Å can be best described by the most appropriate single template stellar spectrum, leading to the well measured stellar velocity dispersions and corresponding uncertainties. Because of stronger AGN continuum emissions in SDSS spectra of Type-1 AGN, stellar velocity dispersions can be well measured in about half of the collected Type-1 AGN, but in almost all the Type-2 AGN. Here, we do not show the best fitting results to the absorption features around 4000Å in all the AGN, but Fig. 1 shows two examples, one Type-1 AGN and one Type-2 AGN, on the best fitting results to the absorption features around 4000Å. Among the several methods to measured stellar velocity dispersions (such as the following discussed Simple Stellar Population method), the direct fitting method in the manuscript is mainly considered due to the following reason. Among the Type-1 AGN, absorption features of host galaxies are not apparent in the whole spectra but apparent enough around 4000Å, the direct fitting method applied to the absorption features around 4000Å can lead as many Type-1 AGN as possible with stellar velocity dispersions well measured.
Rather than Ca iiÅ triplets and Mg ib absorption features around 5175Å, the absorption features around 4000Å are mainly considered in the manuscript, due to the following main reasons. On the one hand, for Type-1 AGN in SDSS, only dozens of objects with redshift less than 0.06 have high quality Ca ii triplets, leading to a quite small sample of Type-1 AGN of which stellar velocity dispersions can be well measured through Ca ii triplets. Moreover, in the following section, it will be confirmed that the measured stellar velocity dispersions are consistent through the Ca ii triplets and through the absorption features around 4000Å. On the other hand, not similar as Ca ii triplets and absorption features around 4000Å, Mg ib absorption features in Type-1 AGN have serious contaminations from optical Fe ii emissions and prominent Fe i blends. Greene & Ho (2006) have clearly pointed out that the absorption features of the Ca H+K region may provide the only recourse for estimating stellar velocity dispersions, at higher AGN contaminations. Similar discussions can also be found in Harris et al. (2012) which have shown that using Ca H&K instead of CaT seems to be working relatively well.
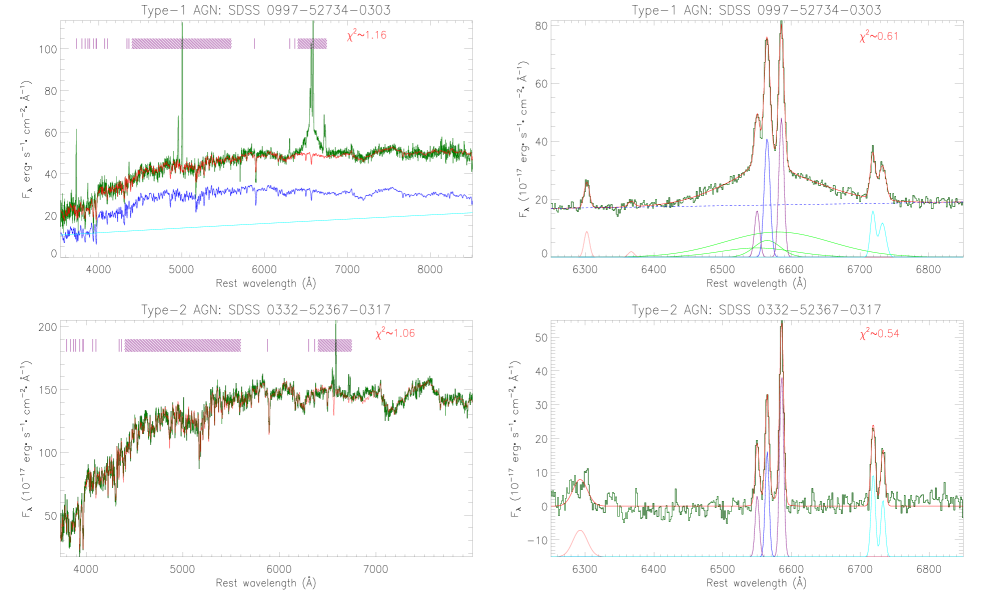
Before proceeding further, it is necessary to ensure broad Balmer emission lines in SDSS spectra of the collected Type-1 AGN but no broad lines in the collected Type-2 AGN. Therefore emission line properties should be further checked after subtractions of host galaxy contributions (if there are). The commonly applied SSP method (Simple Stellar Population) has been applied to determine contributions of host galaxies. The method above to measured stellar velocity dispersions through a single stellar template spectrum is not appropriate to determine host galaxy contributions. More detailed descriptions on the SSP method can be found in Bruzual & Charlot (2003); Kauffmann et al. (2003); Cid Fernandes et al. (2005); Cappellari (2017) and in our previous paper Zhang (2014); Zhang et al. (2016); Rakshit et al. (2017); Zhang et al. (2019, 2021); Zhang (2021a, b). Here, we do not show further detailed discussions on the SSP method any more, but simple descriptions on SSP method as follows. The 39 simple stellar population templates from Bruzual & Charlot (2003) have been exploited, which can be used to well-describe the characteristics of almost all the SDSS galaxies as detailed discussions in Bruzual & Charlot (2003). Meanwhile, there is an additional component, a power law component, which is applied to describe intrinsic AGN continuum emissions, especially when the SSP method is applied to describe spectra of Type-1 AGN. And the power law component is not limited to be blue, because intrinsic host galaxy reddening effects can lead to red power law component, such as the following shown results in the top left panel of Fig. 2 in the Type-1 AGN SDSS 0997-52734-0303. Meanwhile, when the SSP method is applied, the narrow emission lines listed in http://classic.sdss.org/dr1/algorithms/speclinefits.html#linelist are masked out by full width at zero intensity about 450, And the wavelength ranges from 4450 to 5600Å and from 6250 to 6750Å are also masked out for the probably broad H and the broad H emission lines. Then, through the Levenberg-Marquardt least-squares minimization technique, SDSS spectra with emission lines being masked out can be well described. Here, the SSP method determined host galaxy contributions are not shown in plots for all the AGN, but for the two AGN shown in Fig. 1, the SSP determined host galaxy contributions are shown in left panels of Fig. 2.
After subtractions of host galaxy contributions (if there are), emission lines around H within rest wavelength from 6250 to 6850Å can be carefully measured, in order to check whether there are broad H emission lines. To measure properties of emission lines are not the objective of the manuscript, but simple descriptions are as follows on the emission line fitting procedure. Similar as what we have recently done in Zhang (2021a, b, c), three broad Gaussian functions (second moment larger than 600) are applied to describe broad H, and seven narrow Gaussian components (second moment smaller than 600) are applied to describe narrow H, [O i], [N ii] and [S ii] doublets, and a power law component is applied to describe continuum emissions underneath broad H. Based on the measured parameters of broad H through the Levenberg-Marquardt least-squares minimization technique, the criteria are accepted to determine that there are no broad H: the determined three broad Gaussian components for broad H with the measured line fluxes and line widths 2 times smaller than the corresponding uncertainties, and the criteria are accept to determine that there are reliable broad H: there are at least one broad Gaussian component with measured line flux and line width at least 5 times larger than their corresponding uncertainties and second moment larger than 600. The best descriptions to the emission lines around H are not shown in plots for all the AGN, but for the two AGN shown in Fig. 1, the best descriptions to the emission lines around H are shown in right panels of Fig. 2.
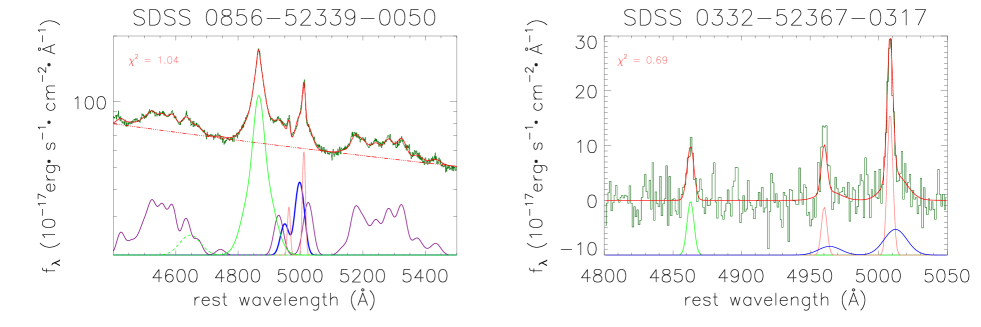
Furthermore, emission line properties of [O iii] line should be applied in the manuscript. Therefore, simple descriptions are shown on the model functions to describe emission lines around H within rest wavelength from 4400 to 5600Å after subtractions of host galaxy contributions. Similar as what we have recently done in Zhang (2021a, b, c), three broad Gaussian functions are applied to describe broad H, one narrow Gaussian component is applied to describe narrow H, two narrow and two broad Gaussian components are applied to describe core and extended components of [O iii]Å doublet, one Gaussian component is applied to describe He ii line, broadened and scaled Fe ii templates discussed in Kovacevic et al. (2010) are applied to describe probable optical Fe ii lines, and a power law component is applied to describe continuum emissions underneath broad H. Fig. 3 shows two examples on the best-fitting results to emission lines around H through the Levenberg-Marquardt least-squares minimization technique.
Finally, based on the following criteria,
-
•
The measured stellar velocity dispersions are at least 5 times larger than their corresponding uncertainties.
-
•
The measured stellar velocity dispersions are larger than 50 and smaller than 400 .
-
•
The should be smaller than 2, based on the best fitting results to the absorption features around 4000Å.
-
•
For the Type-1 AGN, there are reliable broad emission lines with at least one broad Gaussian component with the measured line flux and line width at least 5 times larger than the corresponding uncertainties and second moment larger than 600.
-
•
For the Type-2 AGN, there are no broad emission lines with the determined three broad Gaussian components for broad H with the measured line fluxes and line widths 2 times smaller than the corresponding uncertainties.
there are 6260 Type-1 AGN with apparent broad H emission lines and reliable stellar velocity dispersions, and 15353 Type-2 AGN with reliable stellar velocity dispersions but no broad H emission lines. And the sample of the 6260 Type-1 AGN is so far the largest sample of Type-1 AGN with reliable measured stellar velocity dispersions, about 85 times larger than the more recent sample of Type-1 AGN with measured stellar velocity dispersions in Bennert et al. (2015, 2021). And through absorption features around 4000Å, there are 50.7% (6260 of 12342) of Type-1 AGN with stellar velocity dispersions well measured, and 94.4% (15353 of 16269) of Type-2 AGN with stellar velocity dispersions well measured.
The necessary parameters of all the 6260 Type-1 AGN and all the 15353 Type-2 AGN are not listed in the manuscript, but can be downloaded from https://pan.baidu.com/s/1NCDqFtJwRaG-u21ekxlvvQ with validation code sj6f. There are 11 columns in the data file of type1_vd.list and type2_vd.list in ASCII format for the 6260 Type-1 AGN and the 15353 Type-2 AGN with information of SDSS PLATE-MJD-FIBERID, measured and uncertainty in unit of without corrections of instrument resolutions, value for the best fitting results to the absorption features around 4000Å, redshift, logarithmic line luminosity and uncertainty of total [O iii] line in unit of , logarithmic line luminosity and uncertainty of core component of [O iii] line in unit of , logarithmic ratio of O3HB (flux ratio of core component of [O iii]Å to narrow H), logarithmic ratio of N2HA (flux ratio of [N ii]Å to narrow H).
3 To confirmed few effects of AGN activities on the measured stellar velocity dispersions in Type-1 AGN
Before proceeding further, it is necessary to check effects of AGN activities, especially power law AGN continuum emissions and broad line emissions, on our measured stellar velocity dispersions through absorption features around 4000Å by the fitting procedure described in the Section above, due to apparent AGN continuum emissions and broad line emissions in Type-1 AGN. In the section, series of artificial spectra are created including different contributions of AGN continuum emissions and broad emission lines, and then to check whether are there apparent effects of continuum emissions or broad line emissions on the measured stellar velocity dispersions in Type-1 AGN.
Based on SDSS spectra of Type-2 AGN with well measured stellar velocity dispersions, artificial spectra can be created with contributions of AGN continuum emissions and broad line emissions ,
| (3) |
where means AGN continuum emissions, means Gaussian like broad emission lines. For AGN continuum emissions, is randomly selected from -2 to 0.5, as well discussed results on composite spectrum of SDSS QSOs in Vanden Berk et al. (2001). And for broad emission lines within rest wavelength range from 3750Å to 4600Å, the three broad lines of H (Å), H (Å) and the broad optical Fe ii (opt37, opt38, Å) are mainly considered. The other broad line features (such as H and the other optical Fe ii features) within rest wavelength from 3750 to 4600Å are not considered, because they are quite weak. Flux ratios of the three broad line features ( as line flux of broad H, as line flux of broad H, as line flux of the optical Fe ii feature) are accepted as from the composite spectrum of SDSS QSOs. The same second moments from 600 to 2000 are accepted to the three broad line features. Accepted the strong correlation between continuum luminosity at 5100Å and the H luminosity in Greene & Ho (2005b) and based on the reported continuum luminosity and broad H luminosity of the quasars in SDSS DR7 in Shen et al. (2011), the input values of and are tied to be
| (4) |
where the factor 3.3 is the flux ratio of H to H.
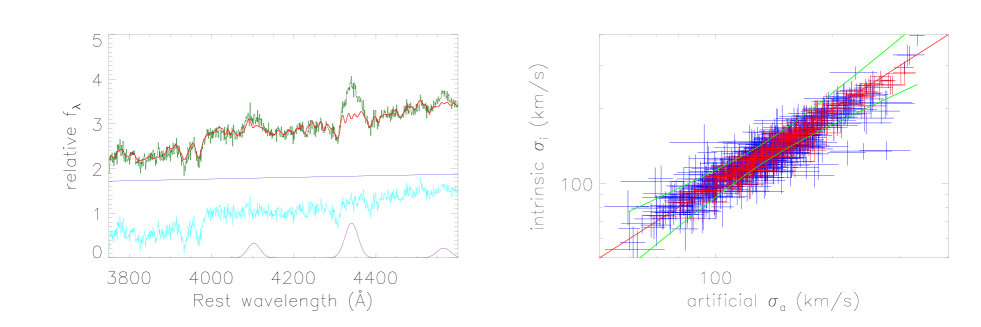
Based on randomly selected from 0.2 to 10 times of the mean intensity of , randomly selected from -2 to 0.5 and randomly selected from 600 to 2000 and randomly collected among the 11353 Type-2 AGN, 1000 artificial spectra are created with contributions of both AGN continuum emissions and broad line emissions. If there were apparent effects of AGN activities on the measured stellar velocity dispersions, re-measured stellar velocity dispersions in should be quite different from the stellar velocity dispersions in of Type-2 AGN. Left panel of Fig. 4 shows an example of and the best fitting results to the absorption features in the artificial spectrum. Right panel of Fig. 4 shows the correlation between artificial and intrinsic of the 628 artificial spectra with measured five times larger than corresponding uncertainties. There are no reliable measured stellar velocity dispersions in the other 372 artificial spectra which have the mean about two times higher than the applied in the 628 artificial spectra with reliable measured stellar velocity dispersions, due to their measured three times smaller than their corresponding uncertainties. There is a strong positive linear correlation with Spearman Rank correlation coefficient about 0.92 with for the results shown in right panel of Fig. 4. Under considerations of uncertainties in both coordinates, the correlation can be described by
| (5) |
through the FITEXY code (https://idlastro.gsfc.nasa.gov/ftp/pro/math/fitexy.pro written by Frank Varosi) (Tremaine et al., 2002). Meanwhile, the mean ratio of artificial to intrinsic is about 1.040.03, with the uncertainty 0.03 estimated through the bootstrap method with 1000 loops. For each loop, a new sample of is created with more than half data points randomly collected from the sample of . After 1000 loops, there are 1000 new samples with 1000 mean values, the half width at half maximum of distribution of the 1000 mean values is accepted as the uncertainty of the mean value of .
Moreover, the mean ratio 1.04 of artificial to intrinsic kindly larger than 1 apparently indicates central AGN continuum emissions and/or broad emission lines can lead the measured stellar velocity dispersions to be about 4% larger than the intrinsic values in Type-1 AGN. In order to confirm the mean ratio of artificial to intrinsic , one another sample of 1000 artificial spectra are created. The totally same mean ratio 1.04 can be found in the new sample of 1000 artificial spectra. Therefore, the mean ratio of artificial to intrinsic about 1.04 is intrinsically true, due to effects of central AGN continuum emissions and/or broad emission lines.
Before the end of the section, one point is noted. In right panel of Fig. 4, there are some outliers. However, there is only one criterion collect artificial that at least 5 times larger than their corresponding uncertainties. If firm criteria are applied that smaller than 2 (the critical value applied in Section 2) and at least 10 times larger than their corresponding uncertainties, the collected 262 data points marked as red symbols are well lying within 99.99% confidence bands of the linear correlation . Moreover, the mean ratio of artificial to intrinsic of the 262 high quality data points is about 1.038 totally similar as the 1.04 for all the data points. Therefore, the outliers are only due to rough selection criteria, and there are no further discussions on the outliers in the Fig. 4 which have few effects on our final results.
Contributions of AGN continuum emissions and broad line emissions have apparent effects on measuring stellar velocity dispersions in the Type-1 AGN, the effects can lead to unmeasured stellar velocity dispersions in the Type-1 AGN with strong AGN continuum emissions, meanwhile, the effects can lead the measured reliable stellar velocity dispersions in the Type-1 AGN to be about 4% larger than their intrinsic values, which will be carefully discussed in the following stellar velocity dispersion comparisons between Type-2 AGN and Type-1 AGN.
4 To confirm the reliability of the measured stellar velocity dispersions
The main objective of the section is to provide evidence to confirm/support the reliability of our measured stellar velocity dispersions in Type-2 AGN and in Type-1 AGN, by comparing our measured values and reported values in the literature.
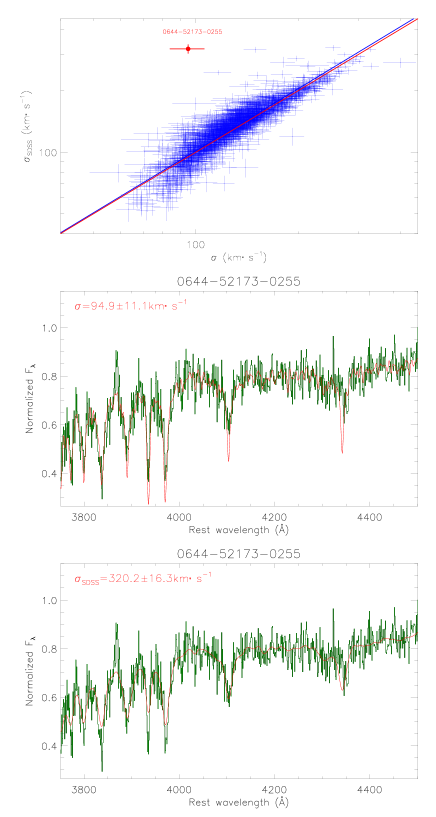
For Type-2 AGN, the measured are compared with SDSS provided values , shown in top panel of Fig. 5. The SDSS pipeline determined are based on the 24 broadened template eigen-spectra from the ELODIE stellar library well discussed in Prugniel & Soubiran (2001) applied to describe the whole host galaxy absorption features in SDSS spectra, through the similar minimum least-squares minimization technique. More discussions on the SDSS pipeline determined can be found in Shu et al. (2012); Thomas et al. (2013). More detailed information of the SDSS pipeline determined can be found in https://www.sdss.org/dr12/algorithms/redshifts/. More recently, Woo et al. (2016) have compared the SDSS pipeline provided stellar velocity dispersions with the [O iii] line width on studying properties of outflows in Type-2 AGN.
Between the measured and the , there is one strong linear correlation with Spearman Rank correlation coefficient of 0.92 with . Under considerations of uncertainties in both coordinates, the correlation can be described by
| (6) |
through the FITEXY code. The mean ratio of to is about 0.9850.003, with the uncertainty 0.003 estimated by the bootstrap method with 1000 loops. The strong linear correlation and the mean ratio of to near to 1 clearly indicate that the measured through absorption features around 4000Å are reliable enough for the Type-2 AGN.
Although there is a strong linear correlation in Fig. 5, there are some outliers in the space of versus , such as the extreme outlier SDSS 0644-52173-0255 which has measured through absorption features around 4000Å in the manuscript however in SDSS database. The best fitting results to the absorption features around 4000Å are shown in middle panel of Fig. 5 with . And in order to show further clues to support our measured stellar velocity dispersion in SDSS 0644-52173-0255, bottom panel of Fig. 5 shows the fitting results to the absorption features around 4000Å with stellar velocity dispersion fixed to the SDSS pipeline provided , leading to bad fitting results to the absorption features with rest wavelength from 3800Å to 4000Å, indicating stellar velocity dispersion around not preferred in SDSS 0644-52173-0255. We do not know the exact reason leading to so large SDSS pipeline determined stellar velocity dispersion in SDSS 0644-52173-0255, but probably due to the following main reason that the SDSS pipeline provided stellar velocity dispersion is measured through the whole host galaxy absorption features including more contaminations. We do not have an idea to determine how many outliers in the space of versus , however the strong linear correlation and the mean ratio of to being well near to 1 can be applied as strong statistical evidence to support the reliability of our measured stellar velocity dispersions in the Type-2 AGN.
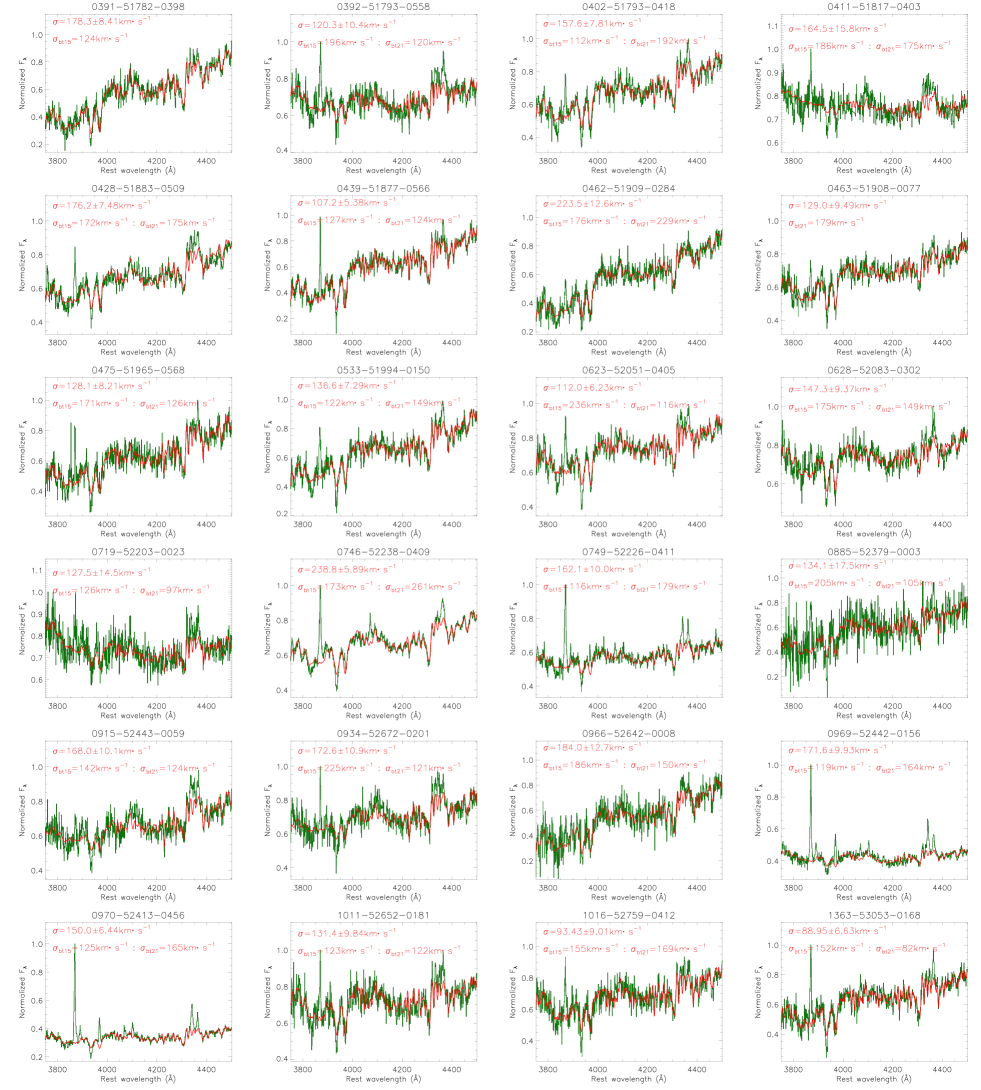
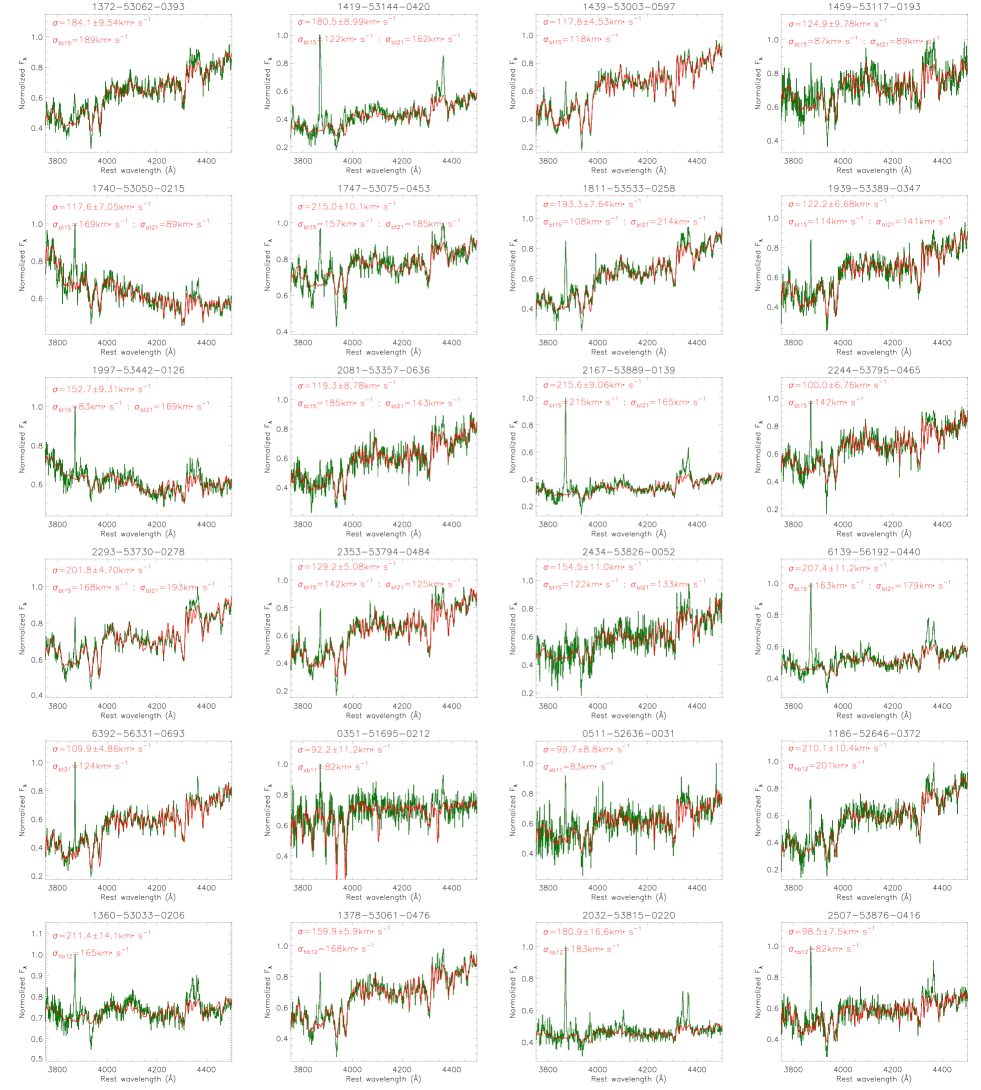
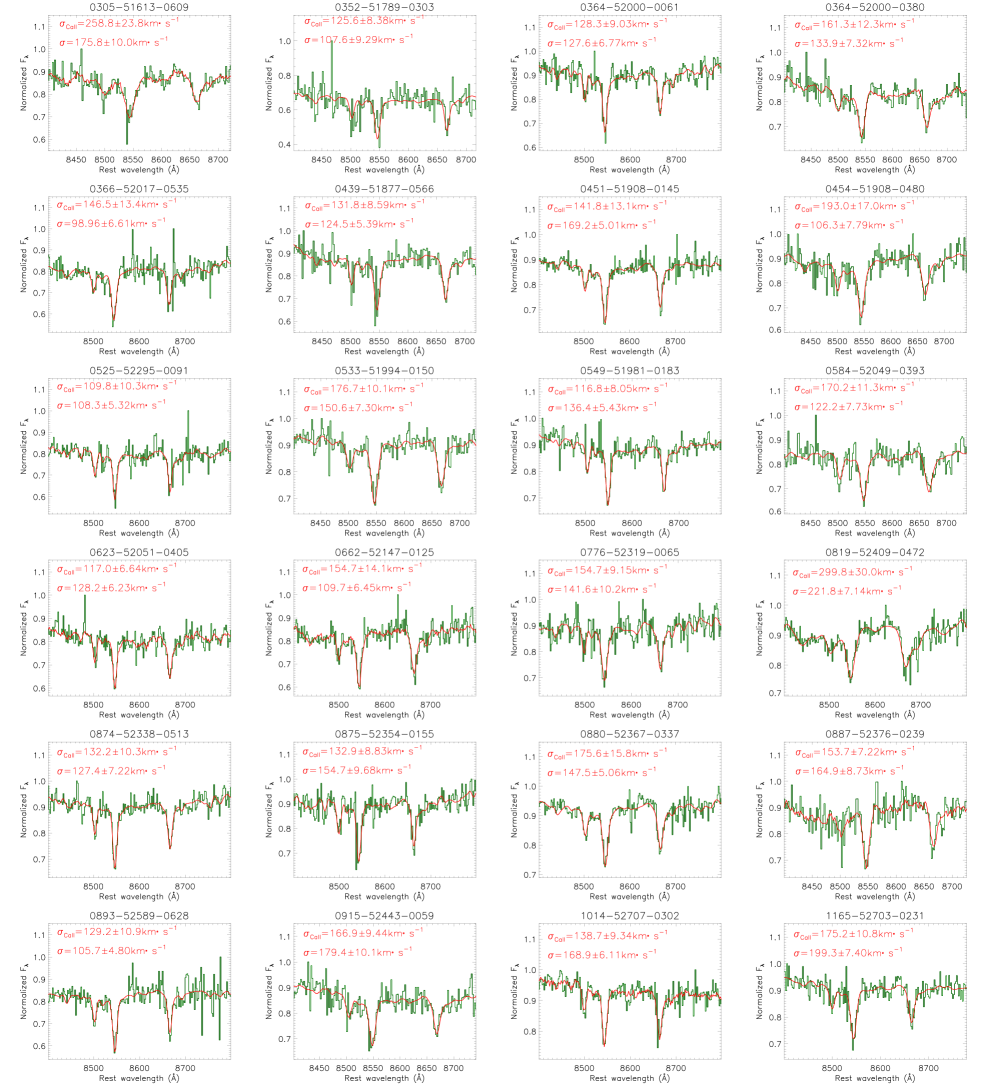
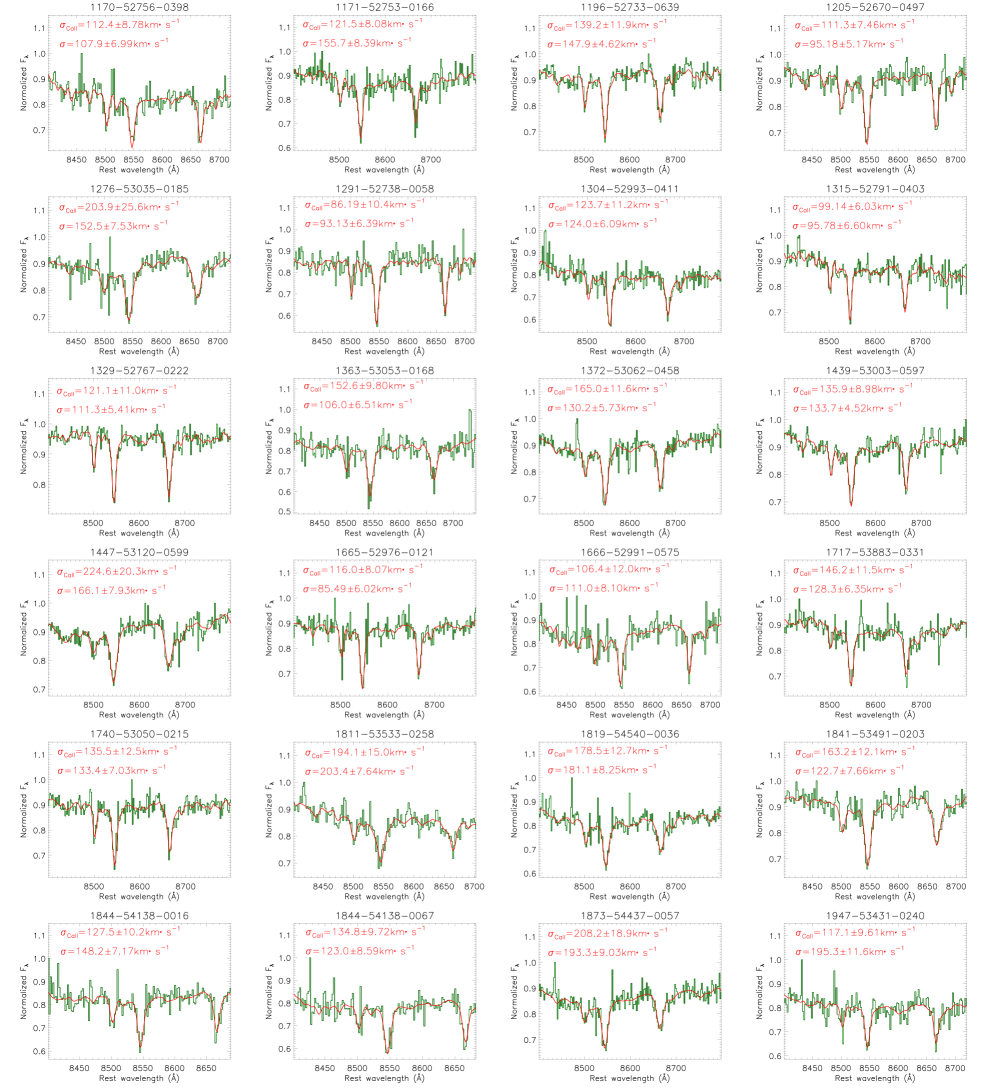
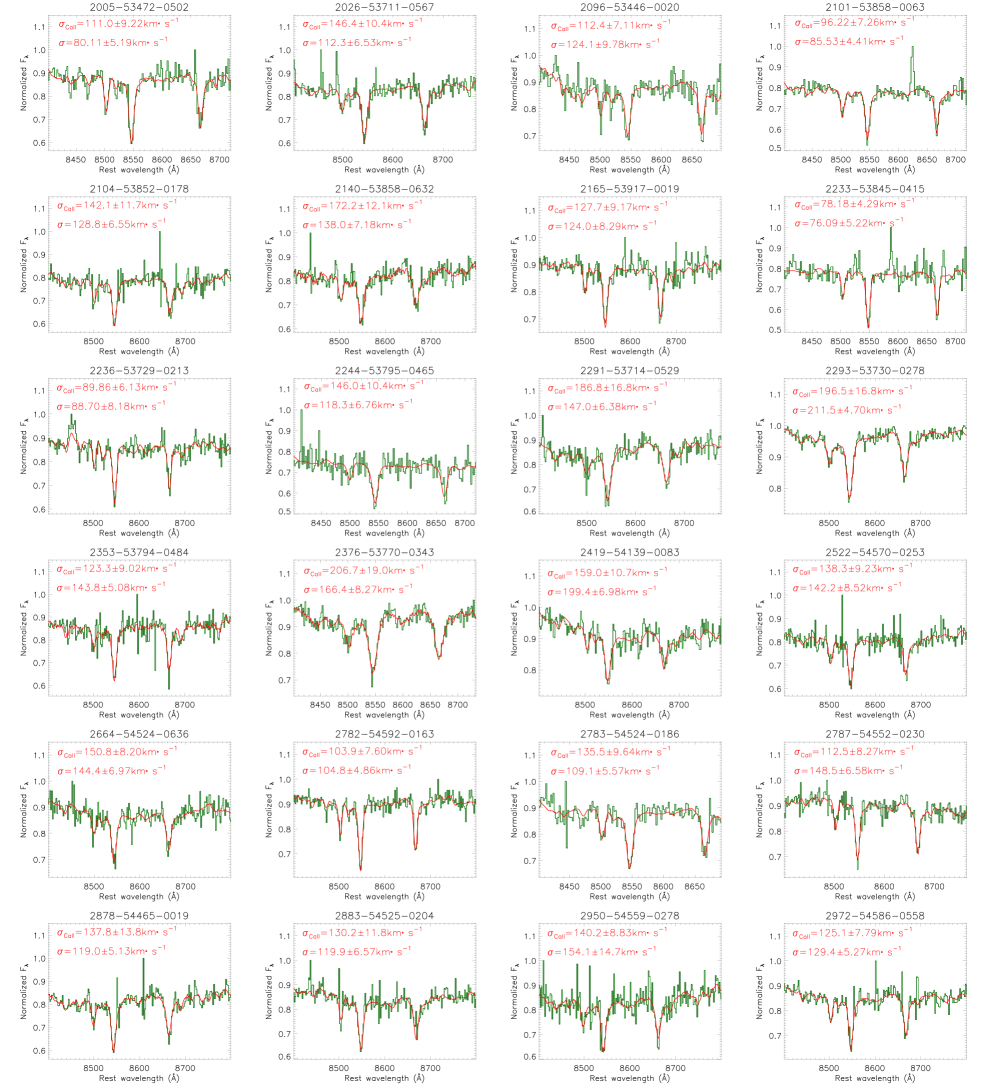
There are no provided by SDSS for Type-1 AGN, but the following three methods are applied to confirm the reliability of the measured in Type-1 AGN. First, it can be applied to confirm the reliability of our measured stellar velocity dispersions in Type-1 AGN, by comparing our measured values and the more confident spatially resolved values in Bennert et al. (2015, 2021). The spatially-resolved stellar velocity dispersion measurements from Keck long-slit spectra in Bennert et al. (2015, 2021) have more advantages in the measurements than relying only on fiber-based SDSS spectra. There are 65 Type-1 AGN included in the sample of Bennert et al. (2015) with measurements of stellar velocity dispersions derived for both aperture and spatially resolved spectra, and 66 Type-1 AGN in the sample of Bennert et al. (2021) (63 Type-1 AGN included in the sample of Bennert et al. (2015) and 3 new Type-1 AGN) with determined stellar velocity dispersions from spatially resolved measurements integrated within effective spheroid radius. Among the 65 Type-1 AGN in Bennert et al. (2015) and the 66 Type-1 AGN in Bennert et al. (2021), there are 41 AGN of which can be well measured through absorption features around 4000Å. Among the 41 Type-1 AGN, 2 Type-1 AGN is firstly reported in the sample of Bennert et al. (2021), 4 Type-1 AGN are only reported in the sample of Bennert et al. (2015), the other 35 Type-1 AGN are reported both in the sample of Bennert et al. (2015) and in the sample of Bennert et al. (2021). The best fitting results to the absorption features around 4000Å are shown in Fig. 6 for the 41 Type-1 AGN, with the measured stellar velocity dispersions in the manuscript and the reported stellar velocity dispersions in Bennert et al. (2015) and in Bennert et al. (2021) marked in each panel of Fig. 6 (the velocity dispersions are not listed in a table any more).
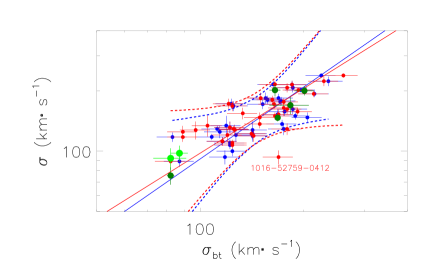
Then, comparisons are shown in Fig. 7 between and , with Spearman Rank correlation coefficients of 0.76 with for the 39 Type-1 AGN with in Bennert et al. (2015) and of 0.71 with for the 37 Type-1 AGN with reported in Bennert et al. (2021). Here, in order to find more reasonable results, similar as discussed in Greene & Ho (2005), effects of SDSS instrument resolutions can be corrected on the measured stellar velocity dispersions by
| (7) |
where represents the measured stellar velocity dispersions, represents the SDSS instrument resolution around 4000Å, and represents the instrument resolution of the applied stellar template. Under considerations of uncertainties in both coordinates, through the FITEXY code, the linear correlations can be described by
| (8) |
for the 39 Type-1 AGN with in Bennert et al. (2015), and for the 37 Type-1 AGN with reported in Bennert et al. (2021), respectively. Moreover, the mean ratio of to is 1.0160.045 for the 39 Type-1 AGN in Bennert et al. (2015), and the mean ratio of to is 0.9990.052 for the 37 Type-1 AGN in Bennert et al. (2021). The uncertainties of the mean ratios are estimated through the bootstrap method with 1000 loops. The strong linear correlations provide evidence to support the reliability of the measured stellar velocity dispersions in the Type-1 AGN.
Moreover, besides the reported Type-1 AGN with spatially resolved stellar velocity dispersions in Bennert et al. (2015, 2021), there are three known large samples of SDSS Type-1 AGN with measured stellar velocity dispersions, a sample of 76 Seyfert 1 galaxies in Xiao et al. (2011), the Type-1 AGN in the SDSS reverberation mapping project in Shen et al. (2015a, b); Grier et al. (2017) (SDSSRM) and a sample of low redshift Type-1 AGN in Harris et al. (2012). However, Xiao et al. (2011) mainly focused on Type-1 AGN with lower stellar velocity dispersions, and there are only 2 Type-1 AGN which have reliable stellar velocity dispersions measured through Ca ii triplets in Xiao et al. (2011) and also have reliable stellar velocity dispersions measured through absorption features around 4000Å in the manuscript: SDSS J112526+022039 (plate-mjd-fiberid=0511-52636-0031) and SDSS J170246+602818 (plate-mjd-fiberid=0351-51695-0212). And there are 17 SDSSRM AGN with redshift smaller than 0.3 and with reported stellar velocity dispersions, however, none of the 17 SDSSRM AGN is included in our sample of Type-1 AGN in SDSS DR12 with reliable stellar velocity dispersions measured absorption features around 4000Å. Among the Type-1 AGN in Harris et al. (2012), there are only 5 Type-1 AGN with stellar velocity dispersions reported in Harris et al. (2012) but not reported in Bennert et al. (2015, 2021), and also included in our main sample of Type-1 AGN with measured stellar velocity dispersions through absorption features around 4000Å. Therefore, besides the 41 Type-1 AGN collected from Bennert et al. (2015, 2021), two additional Type-1 AGN are collected from Xiao et al. (2011) and 5 additional Type-1 AGN are collected from Harris et al. (2012), of which the best fitting results to absorption features around 4000Å are shown in the last 7 panels of Fig. 6 and the corresponding properties of stellar velocity dispersions are shown as solid green circles and as solid dark green circles in Fig. 7.
Moreover, as shown in Fig. 6 and Fig. 7, there are quite different stellar velocity dispersions in individual Type-1 AGN, such as in SDSS 1016-52759-0412 (SDSS J114545+554759) with stellar velocity dispersion 118 in Bennert et al. (2015) but with 169 in Bennert et al. (2021). Quite different stellar velocity dispersions in individual objects are mainly due to different definitions of measuring stellar velocity dispersions. The most expected result is that stellar velocity dispersions measured by different definitions lead to totally similar measurements, therefore, stellar velocity dispersions both in Bennert et al. (2015) and in Bennert et al. (2021) are collected and compared in the manuscript. And, the mean ratios of to well near to 1 strongly indicate that the measured stellar velocity dispersions can not lead to statistically larger or smaller stellar velocity dispersions in the Type-1 AGN by the method in the manuscript.
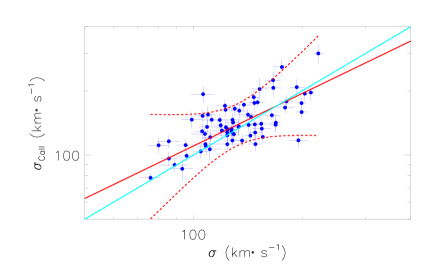
Second, it is interesting to compare the measured through absorption features around 4000Å and dispersions measured through absorption features of Ca ii triplets. Among the Type-1 AGN with measured through absorption features around 4000Å, there are 72 AGN with high quality Ca ii triplets leading to well measured reliable stellar velocity dispersions (at least 5 times larger than their corresponding uncertainties and corresponding smaller than 2) in the SDSS spectra with median signal-to-noises larger than 20, through the same procedure applied to measure stellar velocity dispersions through absorption features around 4000Å. Fig. 8 shows the best fitting results to Ca ii triplets of the 72 Type-1 AGN. The measured and are marked in each panel, and the measured are not listed in a table any more. Fig. 9 shows the comparisons between and , through different absorption features, with Spearman Rank correlation coefficient of 0.63 with . Under considerations of uncertainties in both coordinates, through the FITEXY code, the correlation can be described by
| (9) |
. And the mean ratio of to is about 0.950.04, with the uncertainty calculated by the bootstrap method with 1000 loops. Therefore, based on the results in Fig. 7 and in Fig. 9, the measured are reliable for the Type-1 AGN.
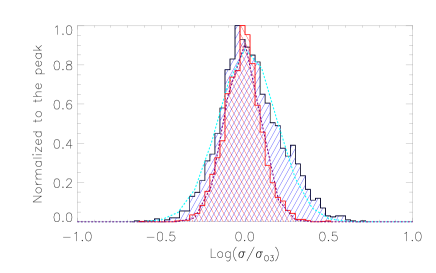
The third comparisons between stellar velocity dispersion and narrow line width are applied as indirect evidence to support reliability of the measured stellar velocity dispersions in the manuscript. Nelson & Whittle (1996) have reported a moderately strong correlation between stellar velocity dispersion and [O iii] profile width, strongly indicating gravitational motion playing an important role in NLRs (narrow emission line regions) velocity field, through a large sample of Seyfert galaxies. Nelson (2000) has shown a strong correlation between BH mass and [O iii] line width, indicating [O iii] line width can well treated as substitute of stellar velocity dispersion. Greene & Ho (2005) have shown that line width of core components of [O iii] doublets can trace stellar velocity dispersions, through a large and homogeneous sample of SDSS narrow line AGN. Komossa & Xu (2007) have shown that the [O iii] line width is a good surrogate for stellar velocity dispersions, especially after removal of asymmetric blue wings and after excluding [O iii] lines with strong blue-shifts. More recently, Woo et al. (2016) have reported a broad correlation between [O iii] line width and stellar velocity dispersion in a large sample of Type-2 AGN, re-confirming that bulge gravitational potential plays a main role in NLRs kinematics. Bennert et al. (2018) have shown average ratio of core [O iii] line width to stellar velocity dispersion is about 1, but with individual data points off by up to a factor of two, through a sample of about 80 SDSS Seyfert 1 galaxies. Therefore, comparisons between our measured stellar velocity dispersion and core [O iii] line width are applied, and shown in top left panel of Fig. 10. The mean ratios of are about 0.0350.005 and -0.0140.003 for the Type-1 AGN and the Type-2 AGN respectively, with uncertainties simply estimated by the bootstrap method with 1000 loops. The average ratios are well consistent with reported results in the literature, to provide further clues to support the reliability of the measured stellar velocity dispersions in both the Type-2 AGN and the Type-1 AGN in the manuscript.
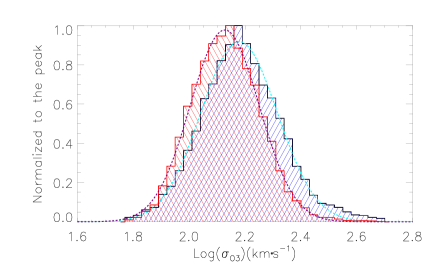
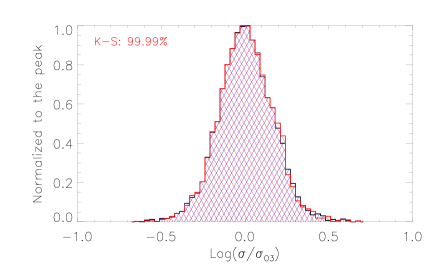
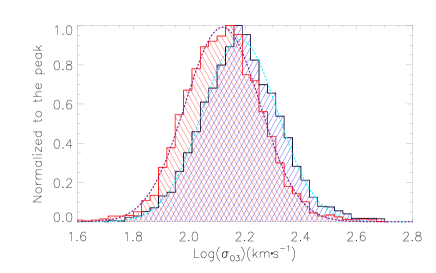
Besides the similar mean ratios of between Type-1 AGN and Type-2 AGN shown in top left panel of Fig. 10, there are different distributions of between Type-1 AGN and Type-2 AGN, especially the right hand side of the distributions. It is necessary and interesting to discuss whether over-estimated stellar velocity dispersions in Type-1 AGN can be applied to explain the different distributions. As is well known, there are few contaminations of stellar absorption features or continuum emissions or optical broad Fe ii emissions on measured line width of core components of [O iii] emission lines both in Type-1 AGN as shown in Shen et al. (2011) and in Type-2 AGN as shown in Greene & Ho (2005). Top right panel of Fig. 10 shows distributions of Type-1 AGN and Type-2 AGN. There are higher in Type-1 AGN with mean about 2.1790.005 (about ) than in Type-2 AGN with mean about 2.1270.004 (about ). Besides the different distributions shown in top right panel of Fig. 10 for the samples of Type-1 AGN and Type-2 AGN with quite different distributions of , two subsamples444It is quite easy to create the two subsamples, based on the shown distributions of in top left panel of Fig. 10. Here, there are no detailed descriptions on how to create the subsamples, but quite similar as what will be done in Section 5.3. of 5468 Type-1 AGN and 5468 Type-2 AGN are collected to have the same distributions of which is shown in bottom left panel of Fig. 10 with significance levels higher than 99.99% through the two-sided Kolmogorov-Smirnov statistic technique. If there were over-estimated stellar velocity dispersions in Type-1 AGN leading to the different distributions shown in top left panel of Fig. 10, there should be quite smaller difference between Type-1 AGN and Type-2 AGN in the subsamples than in the main samples. However, as shown distributions in bottom right panel of Fig. 10 of in the Type-1 AGN and Type-2 AGN in the subsamples which have the same distributions of , the mean values are about 2.1820.005 and 2.1190.004 in the Type-1 AGN and in the Type-2 AGN in the subsamples, respectively. The quite similar mean values of between Type-1 AGN and Type-2 AGN in the subsamples and in the main samples strongly indicate that the different distributions of shown in top left panel of Fig. 10 are not due to over-estimated stellar velocity dispersions in Type-1 AGN, but mainly due to different distributions of between Type-1 AGN and Type-2 AGN. Therefore, results in Fig. 10 can be accepted as indirect evidence to support the reliability of our measured stellar velocity dispersions, but there are no further discussions on the different distributions of in Type-1 AGN and Type-2 AGN which is beyond the scope of the manuscript and have few effects on our final conclusions in the manuscript.
5 Main Results and Discussions
5.1 Direct comparisons of stellar velocity dispersions
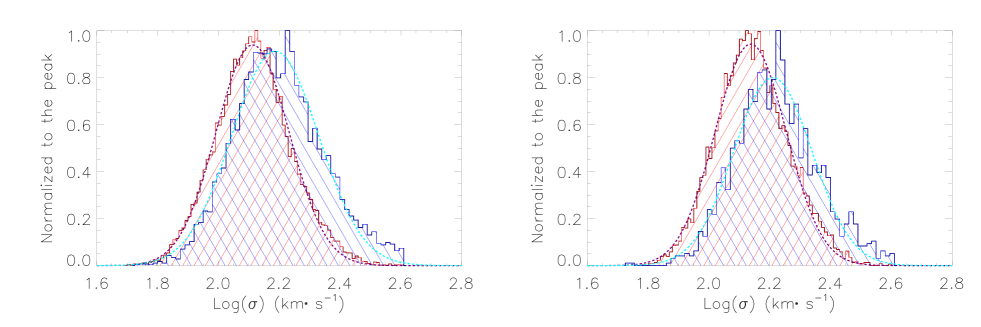
Based on the measured through absorption features around 4000Å, left panel of Fig. 11 shows the direct comparisons between the largest sample of 6260 Type-1 AGN and the largest sample of 15353 Type-2 AGN in SDSS DR12. The mean are about () and 0.004 () for the Type-1 AGN and the Type-2 AGN, respectively, indicating statistically larger stellar velocity dispersions in Type-1 AGN. Uncertainty of each mean value is determined by the bootstrap method with 1000 loops. Meanwhile, in order to ensure few effects of data quality on the different distributions of , there are 1680 Type-1 AGN and 8535 Type-2 AGN collected through the criterion that the measured stellar velocity dispersions at least 10 times larger than their uncertainties. The corresponding comparison results on the high quality stellar velocity dispersions are shown in right panel of Fig. 11, with mean about () and () for the Type-1 AGN and the Type-2 AGN, respectively, with uncertainty of each mean value determined by the bootstrap method with 1000 loops.
Moreover, considering the discussed results in Section 3 that the measured stellar velocity dispersions in Type-1 AGN are about 4% larger than the intrinsic values, the corrected mean are about and for the 6260 Type-1 AGN and for the 1680 Type-1 AGN with high quality stellar velocity dispersions, respectively, to re-confirm statistically larger stellar velocity dispersions in Type-1 AGN. After considering the measured stellar velocity dispersions in Type-1 AGN about 4% larger than the intrinsic values, the Students T-statistic technique is re-applied to determine the different mean values of between Type-1 AGN (with measured stellar velocity dispersions scaled by 0.96) and Type-2 AGN with confidence level higher than 10sigma, and the two-sided Kolmogorov-Smirnov statistic technique indicates stellar velocity dispersions of the Type-1 AGN and the Type-2 AGN obey the same distributions of with significance level smaller than . Therefore, in spite of the following necessary discussed effects, the basic results can be found that Type-1 AGN have their stellar velocity dispersions statistically 16% larger than Type-2 AGN.
5.2 Dependence of stellar velocity dispersion on [O iii] luminosity
As the shown results in section 2, there are half of Type-1 AGN of which stellar velocity dispersions can not be well measured. Therefore, in the subsection, necessary discussions are given on expected probable properties of the intrinsic stellar velocity dispersions of the half of Type-1 AGN without measured in the parent sample.
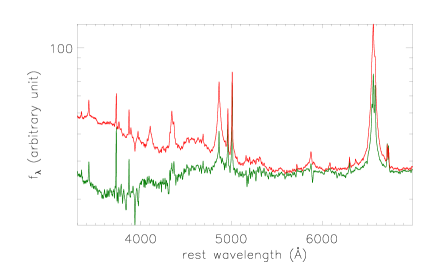
There is only one probability leading to stellar velocity dispersions not be well measured through absorption features around 4000Å in Type-1 AGN, the host galaxy contributions are weak enough that absorption features around 4000Å are overwhelmed in emission features of AGN activities. Therefore, it is interesting to check spectral features of the Type-1 AGN with and without measured . Fig. 12 shows the inverse variance weighted mean spectra of the 6260 Type-1 AGN with well measured and of the other Type-1 AGN with not measured due to unapparent absorption features around 4000Å. The mean spectra with bluer continuum emissions around 4000Å can be well applied to confirm that the half of Type-1 AGN without measured are mainly due to unapparent absorption features around 4000Å which are overwhelmed by emission features of central AGN activities.
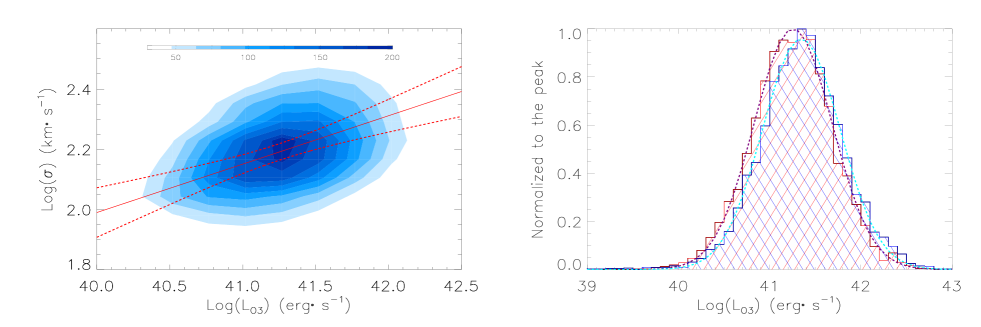
Meanwhile, left panel Fig. 13 shows dependence of measured on total [O iii] line luminosity of the 6260 Type-1 AGN with well measured . The dependence could provide clues to expected properties of intrinsic of the other half of Type-1 AGN without measured in the parent sample. There is a positive linear correlation between and with Spearman Rank correlation coefficient of 0.38 with . And the positive linear correlation can be described by
| (10) |
indicating that Type-1 AGN with higher [O iii] line luminosity will have statistically larger intrinsic . Then, right panel of Fig. 13 shows distributions of with mean values of () and () of the Type-1 AGN with and without well measured . The uncertainties of the mean values are estimated by the bootstrap method with 1000 loops. And the two-sided Kolmogorov-Smirnov statistic technique indicates the two distributions of obey the same distributions with significance level only about . Therefore, the half of Type-1 AGN without measured should have statistically larger (at least not smaller) than the 6260 Type-1 AGN with apparent absorption features around 4000Å. Therefore, considering the half of Type-1 AGN without well measured , the mean of all the 12342 Type-1 AGN in the parent sample should be larger than the ones shown in Fig. 11.
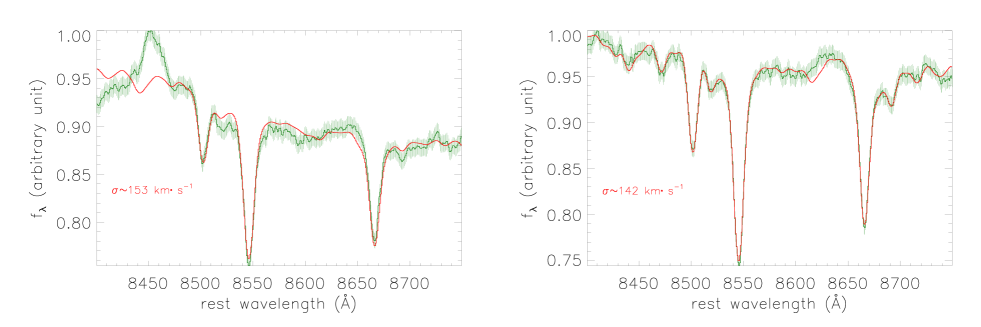
Moreover, although only dozens of Type-1 AGN have Ca ii triplets in SDSS spectra, mean spectra around 8500Å of the low redshift Type-1 AGN with and without measured are well checked, in order to examine whether the Type-1 AGN without measured through absorption features around 4000Å have statistically larger , based on the measured through Ca ii triplets. Fig. 14 shows the mean spectra around 8500Å of Type-1 AGN with and without measured through absorption features around 4000Å, and the best fitting results by single stellar template as what have been done to absorption features around 4000Å. The determined stellar velocity dispersions are about and for the Type-1 AGN without and with apparent absorption features around 4000Å, respectively. The results are consistent with the expected larger of the Type-1 AGN without apparent absorption features around 4000Å. Therefore, considering the half Type-1 AGN without measured will lead to statistically larger for all the 12342 Type-1 AGN than those shown in Fig. 11 for the 6260 Type-1 AGN in the main sample.
Furthermore, as discussed in Kewley et al. (2006), ratio of [O iii] line luminosity to (applied to trace central BH mass) can be accepted as a good indicator of central accretion rate relative to the Eddington ratio, leading to continuous sequence for different subclasses of Type-2 AGN. Here, properties of are checked for Type-1 AGN and Type-2 AGN, with in unit of and in unit of .
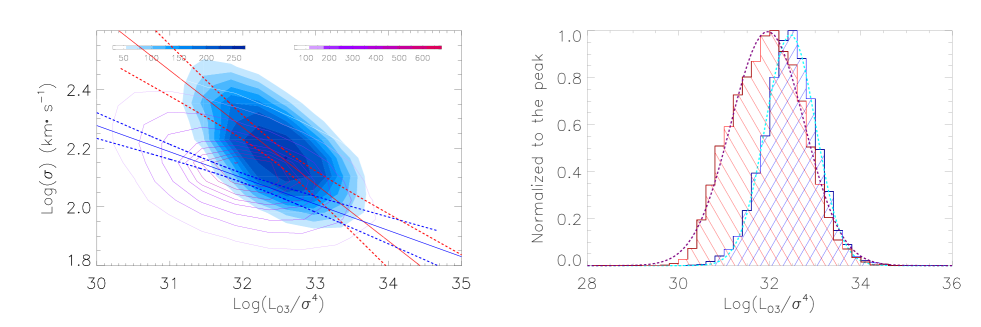
Before proceeding further, as discussed results on extended components of [O iii] doublets in AGN in Zhang et al. (2017, 2021), not line luminosity of total [O iii]Å but of the core component of [O iii]Å is applied to check the properties of of Type-1 AGN and Type-2 AGN, because of seriously obscured extended components of [O iii]Å in Type-2 AGN and of the strong linear correlation between AGN continuum luminosity and the luminosity of the core component of [O iii]Å. Properties of are shown in Fig. 15. Different can be confirmed between Type-1 AGN and Type-2 AGN. There are positive linear correlations between and with Spearman rank correlation coefficients of about 0.38 and 0.31 with for the Type-1 AGN and the Type-2 AGN, and the linear correlations can be described by
| (11) |
The mean are about 32.4480.009 and 31.9480.008 of the Type-1 AGN and the Type-2 AGN respectively, with the uncertainties estimated by the bootstrap method with 1000 loops. Therefore, Type-1 AGN and Type-2 AGN have quite different properties of . Actually, line luminosity of total [O iii]Å can lead to the similar results on the quite different ratios of total [O iii] line luminosity to in Type-1 AGN and Type-2 AGN. Different provide different central activity properties of the collected Type-1 AGN and Type-2 AGN, indicating further effects should be carefully considered on the shown results in Fig. 11.
5.3 Necessary effects on the comparisons of stellar velocity dispersions
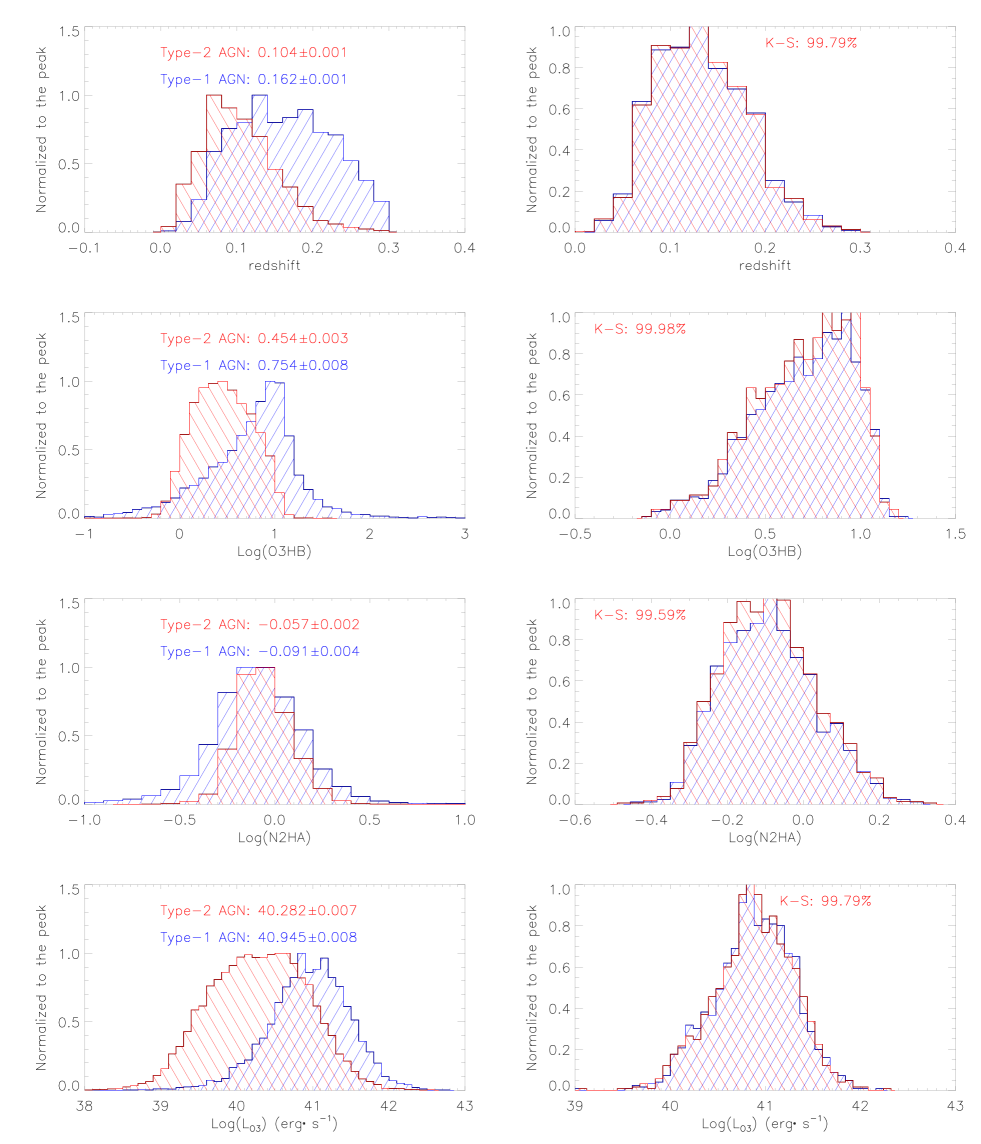
Effects of different redshift are firstly considered on the results shown in Fig. 11, because different redshift provides different evolutionary histories of host galaxies and central BHs. Different distributions of redshift of Type-1 AGN and Type-2 AGN are shown in top left panel of Fig. 16. Mean redshifts are about 0.1620.001 and 0.1040.001 of the Type-1 AGN and the Type-2 AGN, respectively. Meanwhile, effects of different central AGN activities should be considered, because BH mass is one of fundamental parameters relative to AGN activities. Here, the narrow emission line flux rations of core component of [O iii]Å to narrow H (O3HB) and of [N ii]Å to narrow H (N2HA) are mainly considered to trace central AGN activities, the commonly applied ratios in the well-known Baldwin-Phillips-Terlevich diagrams (Baldwin et al., 1981; Kewley et al., 2001; Kauffmann et al., 2003a; Kewley et al., 2006, 2019; Zhang et al., 2020). Different distributions of O3HB and N2HA are shown in left middle two panels of Fig. 16 with mean values of () about 0.7540.008 and 0.4540.003 (-0.0910.004 and -0.0570.002) of the Type-1 AGN and the Type-2 AGN, respectively. Moreover, considering emission luminosity also sensitively depending on central AGN activities, effects of different [O iii] line luminosity of core component are also well checked. Different distributions of are shown in the bottom left panel of Fig. 16, with mean values of about 40.9450.008 and 40.2820.007 of the Type-1 AGN and the Type-2 AGN, respectively. Uncertainty of each mean value of each distribution in the left panels of Fig. 16 is simply estimated by the bootstrap method with 1000 loops.
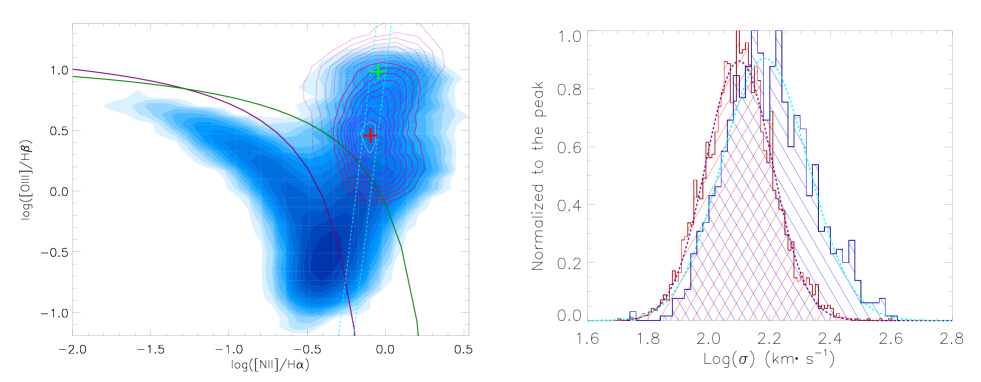
Before proceeding further, besides the distributions of O3HB and N2HA in left panels of Fig. 16, it is interesting to show properties of the collected Type-1 AGN and Type-2 AGN in the well-known BPT diagram in left panel of Fig. 17, to show different locations between Type-1 AGN and Type-2 AGN in the BPT diagram. There are quite different central positions (marked as thick pluses) for the Type-1 AGN and the Type-2 AGN in the BPT diagram, to provide further clues to discuss effects of different central AGN activities on our final results on the different stellar velocity dispersions between Type-1 AGN and Type-2 AGN. Meanwhile, through the strip marked by dashed cyan lines with width about 0.1 in the BPT diagram in left panel of Fig. 17, the 1044 Type-1 AGN and the 4202 Type-2 AGN lying in the strip are collected to simply check effects of AGN activities on stellar velocity dispersions comparisons. The stellar velocity dispersion comparisons are shown in right panel of Fig. 17 of the 1044 Type-1 AGN and the 4202 Type-2 AGN in the strip, with mean about () and () for the 1044 Type-1 AGN and the 4202 Type-2 AGN in the strip, respectively. The uncertainties of the mean values are determined by the bootstrap method with 1000 loops. Considering the measured stellar velocity dispersions in Type-1 AGN 4% higher than the intrinsic values, the corrected mean stellar velocity dispersion is about in the 1044 Type-1 AGN, still indicating higher stellar velocity dispersions in Type-1 AGN. Different strips in the BPT diagram can lead to the similar higher stellar velocity dispersions in Type-1 AGN covered in the strips. Here, we do not show more results in different strips, however, the results indicate more detailed discussions are necessary on effects of AGN activities.
In order to ignore the necessary effects of different distributions of redshift (), narrow line flux ratios (O3HB and N2HA) and line luminosity of core components of [O iii] line () on direct comparisons, the most convenient way is to create two subsamples of Type-1 AGN and Type-2 AGN having the same distributions of , O3HB, N2HA and . Based on the measured , O3HB, N2HA and of the 6260 Type-1 AGN and the 15353 Type-2 AGN in the main samples, it is easy to create a subsample of Type-2 AGN having the same distributions of , O3HB, N2HA and as those of the Type-1 AGN in the subsample, through finding minimum parameter distance calculated as
| (12) |
where , , and mean parameters of the th Type-1 AGN in the main sample (), , , and mean parameters of all () Type-2 AGN in the main sample, , , and are scale factors leading to , , and not much different in quantity, and means a critical value to prevent high leading to much different distributions of , O3HB, N2HA and between the created final two subsamples. Then, based on and , and and , one subsample of 1445 Type-1 AGN and one subsample of 1445 Type-2 AGN are created, which have the same distributions of , O3HB, N2HA and with significance levels higher than 99.5% through the two-sided Kolmogorov-Smirnov statistic technique. Certainly, each object in the main samples is selected once in the two subsamples. The distributions of , O3HB, N2HA and for the AGN in the subsamples are shown in right panels of Fig. 16. The parameters, such as , , O3HB, N2HA and , etc., of the 1445 Type-1 AGN and the 1445 Type-2 AGN in the subsamples are listed in Table 1 and in Table 2.
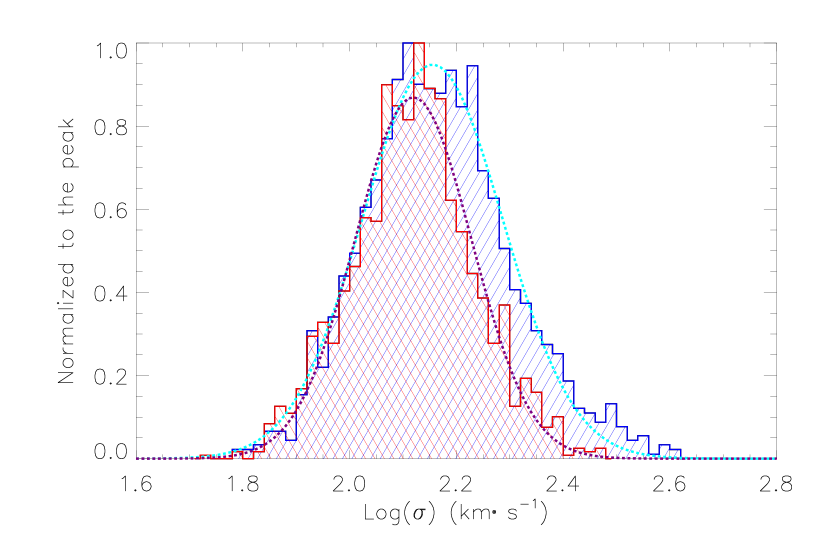
Similar as Fig. 11 but for the 1445 Type-1 AGN and the 1445 Type-2 AGN in the subsamples, stellar velocity dispersion comparisons are shown in Fig. 18. After considering necessary effects, statistically larger can also be clearly confirmed in Type-1 AGN with mean () than in Type-2 AGN with mean (). Considering the measured stellar velocity dispersions in Type-1 AGN 4% higher than the intrinsic values, the corrected mean stellar velocity dispersions is about in the 1445 Type-1 AGN in the subsample, still indicating % higher stellar velocity dispersions in Type-1 AGN. And the Students T-statistic technique is applied to determine the different mean values of shown in Fig. 18 with confidence level higher than 10sigma between the Type-1 AGN and the Type-2 AGN.
It is hard to reasonably explain the statistically larger in Type-1 AGN than in Type-2 AGN, unless to assume that there were some lost Type-2 AGN with larger and/or assume that there were some lost Type-1 AGN with smaller . Larger commonly indicates stronger host galaxy contributions, indicating it is hard to miss Type-2 AGN with larger , due to their expected more apparent absorption features. Meanwhile, it could be expected to miss Type-1 AGN with smaller , due to weaker host galaxy contributions but stronger central AGN activities. The expected strong AGN activities can clearly lead the lost Type-1 AGN with smaller intrinsic to be a true Type-1 AGN but without measured stellar velocity dispersions, quite similar as the Type-1 AGN without measured in the parent sample. As discussed results in subsection 4.3, the Type-1 AGN without measured could have statistically larger (at least not smaller) than the Type-1 AGN with well measured . Therefore, statistically larger is robust enough in Type-1 AGN than in Type-2 AGN.
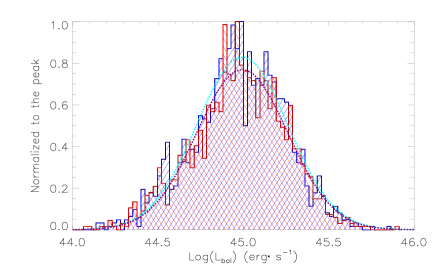
Before the end of the subsection, three points are noted. First, effects of different aperture sizes are not considered on measured , because the same effects can be confirmed for the 1445 Type-1 AGN and the 1445 Type-2 AGN in the subsamples with the same redshift distributions, indicating few effects of different aperture sizes on the results shown in Fig. 18. Second, effects of host galaxy morphologies (including contributions of bars and/or disks of host galaxies) are not considered on the measured , because barred galaxies, unbarred galaxies, merging galaxies, and those hosting pseudo-bulges do not represent outliers in relations as discussed in more recent Bennert et al. (2015, 2021) and as shown results in Batiste et al. (2017). Third, effects of inclination are not considered on the measured stellar velocity dispersions. As discussed in Bellovary et al. (2014) and then followed in Sexton et al. (2019), there are apparent effects of galaxy orientation on measured stellar velocity dispersions, due to contributions of disk rotating components. However, more recently, from a Hubble Space Telescope snapshot imaging survey, Kim et al. (2021) have shown555In 2018, Bornancini & Garcia Lambas (2018) have shown that host galaxies of the majority of Type 1 AGN are elliptical and/or compact galaxies, while host galaxies of Type 2 AGN present more scatters, but through samples of high redshift Type-1 AGN and Type-2 AGN with redshift larger than 0.3 and smaller than 1.1. Therefore, in the manuscript, results in Kim et al. (2021) for low redshift AGN are preferred and mainly considered. that Type-1 and Type-2 AGN are almost indistinguishable in terms of their Hubble type distributions, through Swift-BAT unbiased X-ray selected AGN with redshift smaller than 0.1 and with bolometric luminosity around . Based on the reported luminosity of core components of [O iii] lines of the AGN in the subsamples, the bolometric luminosities (Richards et al., 2006; Duras et al., 2020; Netzer, 2020) can be estimated by the reported correlation between continuum luminosity and in Zhang et al. (2017), and shown in Fig. 19 for the Type-1 AGN and Type-2 AGN in the subsamples, which are well comparable to the bolometric luminosities of AGN in Kim et al. (2021). Therefore, considering the results in Kim et al. (2021) that there is negligible difference in terms of Hubble type between Type-1 and Type-2 AGN, there are no statistical inclination effects on our final stellar velocity dispersion comparisons between Type-1 AGN and Type-2 AGN in the manuscript.
Based on the results above, statistically larger can be well confirmed in the Type-1 AGN than in the Type-2 AGN with significance level higher than 10sigma, after considerations of necessary effects. Therefore, unless there was stable evidence to support different relations applied to determine central BH masses or to support quite different evolution histories in Type-1 AGN and in Type-2 AGN, larger stellar velocity dispersions in the Type-1 AGN than in the Type-2 AGN leads to an interesting challenge to the Unified Model of AGN.
6 Summaries and Conclusions
The main summaries and conclusions are as follows.
-
•
So-far the largest sample of 6260 low redshift Type-1 AGN (), about 85 times larger than the more recent sample of Type-1 AGN with measured spatially resolved stellar velocity dispersions in Bennert et al. (2015, 2021), have their stellar velocity dispersions measured through absorption features around 4000Å. And the measured are well consistent with the for the Type-1 AGN with apparent absorption features around 4000Å.
-
•
Meanwhile, almost all the low redshift Type-2 AGN () in SDSS DR12 have the stellar velocity dispersions measured through absorption features around 4000Å. And the measured are well consistent with the SDSS provided dispersions of the Type-2 AGN.
-
•
Based on series of artificial spectra created by Type-2 AGN spectrum plus contributions from both AGN continuum emissions and broad line emissions, contributions from both AGN continuum emissions and broad line emissions can also lead to reliable measured stellar velocity dispersions through the absorption features around 4000Å, however, strong AGN continuum emissions can lead to part of Type-1 AGN of which stellar velocity dispersions cannot be measured, and lead to the measured stellar velocity dispersions about 4% higher than the intrinsic values.
-
•
Although half of low redshift Type-1 AGN, about 6082 Type-1 AGN, have not apparent absorption features around 4000Å , leading the half of low redshift Type-1 AGN without measured stellar velocity dispersions, properties of the mean spectra of the 6260 Type-1 AGN with measured and the 6082 Type-1 AGN without measured can be applied to confirm that the 6082 Type-1 AGN without measured are mainly due to weak absorption features overwhelmed in the emission features of central AGN activities.
-
•
Based on the positive correlation between and [O iii] line luminosity, the half of low redshift Type-1 AGN without apparent absorption features around 4000Å should have intrinsic stellar velocity dispersions statistically larger (at least not smaller) than the 6260 Type-1 AGN with measured stellar velocity dispersions, due to statistically higher [O iii] line luminosities of the half of low redshift Type-1 AGN without apparent absorption features around 4000Å.
-
•
Based on the measured stellar velocity dispersions of the largest sample of Type-1 AGN and the largest sample of Type-2 AGN in SDSS DR12, direct comparisons can lead to statistically larger in the Type-1 AGN than in the Type-2 AGN, without considerations of necessary further effects.
-
•
Even after considering necessary effects of different evolution histories and central AGN activities on direct comparisons between Type-1 AGN and Type-2 AGN, such as the effects of different redshift, different [O iii] line luminosities of core components and different narrow line ratios of O3HB and N2HA, statistically % larger can be well confirmed in the Type-1 AGN than in the Type-2 AGN with significance level higher than 10sigma.
-
•
Unless there was strong evidence to support different relations or to support quite different evolution histories between Type-1 AGN and Type-2 AGN, the statistically larger in Type-1 AGN provides an interesting but strong challenge to the Unified model of AGN.
| mpf | O3HB | N2HA | mpf | O3HB | N2HA | ||||||
|---|---|---|---|---|---|---|---|---|---|---|---|
| 0266-51602-0239 | 0.063 | 10611 | 40.22 | 0.705 | -0.33 | 0267-51608-0300 | 0.067 | 9913 | 40.32 | 0.583 | -0.03 |
| 0270-51909-0266 | 0.110 | 12413 | 41.06 | 1.045 | -0.11 | 0270-51909-0429 | 0.128 | 8314 | 39.87 | 0.104 | -0.29 |
| 0271-51883-0200 | 0.061 | 1409 | 40.57 | 0.929 | 0.162 | 0271-51883-0322 | 0.086 | 1409 | 41.10 | 1.032 | 0.181 |
| 0272-51941-0329 | 0.078 | 13510 | 41.21 | 0.936 | -0.01 | 0273-51957-0460 | 0.096 | 13115 | 41.28 | 1.013 | 0.005 |
| 0273-51957-0579 | 0.131 | 23822 | 41.91 | 1.072 | 0.022 | 0274-51913-0141 | 0.138 | 11110 | 41.28 | 0.988 | 0.098 |
| mpf | O3HB | N2HA | mpf | O3HB | N2HA | ||||||
|---|---|---|---|---|---|---|---|---|---|---|---|
| 0266-51630-0147 | 0.030 | 997 | 39.92 | 1.007 | -0.05 | 0266-51630-0392 | 0.122 | 12418 | 41.21 | 0.571 | -0.04 |
| 0269-51910-0105 | 0.184 | 12621 | 40.75 | 0.531 | -0.04 | 0269-51910-0168 | 0.176 | 13121 | 40.78 | 0.889 | -0.03 |
| 0271-51883-0178 | 0.181 | 12415 | 41.76 | 0.814 | -0.19 | 0272-51941-0529 | 0.177 | 20824 | 40.91 | 0.871 | -0.04 |
| 0274-51913-0115 | 0.095 | 10710 | 40.38 | 0.633 | -0.24 | 0274-51913-0230 | 0.077 | 1157 | 41.19 | 0.650 | -0.24 |
| 0275-51910-0438 | 0.150 | 9212 | 41.27 | 0.681 | -0.15 | 0276-51909-0147 | 0.108 | 11718 | 40.12 | 0.443 | -0.29 |
Acknowledgements
Zhang gratefully acknowledge the anonymous referee for giving us constructive comments and suggestions to greatly improve the paper. Zhang gratefully thanks the kind financial support from Nanjing Normal University and the kind grant support from NSFC-12173020. This manuscript has made use of the data from the SDSS projects. The SDSS-III web site is http://www.sdss3.org/. SDSS-III is managed by the Astrophysical Research Consortium for the Participating Institutions of the SDSS-III Collaborations. The manuscript has made use of the data from the Indo-U.S. Coude Feed Spectral Library (https://www.noao.edu/cflib/) which consists of spectra for 1273 stars obtained with the 0.9m Coude Feed telescope at Kitt Peak National Observatory.
References
- Alam et al. (2015) Alam, S., et al., 2015, ApJS, 219, 12
- Antonucci (1993) Antonucci, R., 1993, ARA&A, 31, 473
- Baldwin et al. (1981) Baldwin, J. A.; Phillips, M. M.; Terlevich, R. 1981, PASP, 93, 5
- Balokovic et al. (2018) Balokovic, M.; Brightman, M. ; Harrison, F. A.; et al., 2018, ApJ, 854, 42
- Barth et al. (2002) Barth, A. J.; Ho, L. C.; Sargent, W. L. W., 2002, AJ, 124, 2607
- Barth et al. (2005) Barth, A. J.; Greene, J. E.; Ho, L. C., 2005, ApJL, 619, 151
- Barth et al. (2015) Barth, A. J.; Bennert, V. N.; Canalizo, G., et al., 2015, ApJS, 217, 26
- Batiste et al. (2017) Batiste, M.; Bentz, M. C.; Raimundo, S. I.; Vestergaard, M.; Onken, C. A., 2017, ApJL, 838, 10
- Bellovary et al. (2014) Bellovary, J. M.; Holley-Bockelmann, K.; Gultekin, K.; et al., 2014, MNRAS, 445, 2667
- Bennert et al. (2015) Bennert, V. N., Treu, T.; Auger, M. W.; et al., 2015, ApJ, 809, 20
- Bennert et al. (2018) Bennert, V. N.; Loveland, D.; Donohue, E.; et al., 2018, MNRAS, 481, 138
- Bennert et al. (2021) Bennert, V. N.; Treu, T.; Ding, X.; et al., 2021, ApJ, 921, 36
- Bentz et al. (2010) Bentz, M. C.; Walsh, J. L.; Barth, A. J., et al., 2010, ApJ, 716, 993
- Bentz et al. (2013) Bentz, M. C., et al., 2013, ApJ, 767, 149
- Bianchi et al. (2012) Bianchi, S.; Maiolino, R.; Risaliti, G., 2012, Advances in Astronomy, 2012, 17
- Blandford & McKee (1982) Blandford, R. D.; McKee, C. F., 1982, ApJ, 255, 419
- Bornancini & Garcia Lambas (2018) Bornancini, C.; Garcia Lambas, D., 2018, MNRAS, 479, 2308
- Bornancini & Garcia Lambas (2020) Bornancini, C.; Garcia Lambas, D., 2020, MNRAS, 494, 1189
- Brewer et al. (2011) Brewer, B. J. ; Treu, T.; Pancoast, A.; et al., 2011, ApJL, 733, 33
- Brown et al. (2019) Brown, A.; Nayyeri, H.; Cooray, A.; Ma, J.; Hickox, R. C.; Azadi, M, 2019, ApJ, 871, 87
- Bruzual & Charlot (2003) Bruzual, G.; Charlot, S. 2003, MNRAS, 344, 1000
- Cappellari (2017) Cappellari, M., 2017, MNRAS, 466, 798
- Cid Fernandes et al. (2005) Cid Fernandes, R.; Mateus, A.; Sodre, L.; Stasinska, G.; Gomes, J. M., 2005, MNRAS, 358, 363
- Duras et al. (2020) Duras, F., Bongiorno, A., Ricci, F., et al. 2020, A&A, 636, 73
- Ferrarese & Merritt (2000) Ferrarese, F.; Merritt, D., 2000, ApJL, 539, 9
- Franceschini et al. (2002) Franceschini, A.; Braito, V.; Fadda, D., 2002, MNRAS Letter, 335, 51
- Gebhardt et al. (2000) Gebhardt, K., et al., 2000, ApJL, 539, 13
- Graham et al. (2011) Graham, A. W., Onken, C. A., Athanassoula, E., Combes, F. 2011, MNRAS, 412, 2211
- Greene & Ho (2005) Greene, J. E.; Ho, L. C., 2005, ApJ, 627, 721
- Greene & Ho (2005b) Greene, J. E.; Ho, L. C., 2005, ApJ, 630, 122
- Greene & Ho (2006) Greene, J. E.; Ho, L. C., 2006, ApJ, 641, 117
- Grier et al. (2017) Grier, C. J.; Trump, J. R.; Shen, Y.; et al., 2017, ApJ, 851, 21
- Harris et al. (2012) Harris, C. E.; Bennert, V. N.; Auger, M. W.; Treu, T.; Woo, J.-H.; Malkan, M. A., 2012, ApJS, 201, 29
- Heisler, Lumsden & Bailey (1997) Heisler, C. A.; Lumsden, S. L.; Bailey, J. A., 1997, Nature, 385, 700
- Hiner et al. (2009) Hiner, K. D., et al., 2009, ApJ, 706, 508
- Ho & Kim (2014) Ho, L. C.; Kim, M.-J., 2014, ApJ, 789, 17
- Kaspi et al. (2000) Kaspi, S., et al., 2000, ApJ, 533, 631
- Kauffmann et al. (2003a) Kauffmann, G.; Heckman, T. M. ; White, S. D. M.; et al., 2003a, MNRAS, 341, 33
- Kauffmann et al. (2003) Kauffmann, G., et al. 2003, MNRAS, 346, 1055
- Kewley et al. (2001) Kewley, L. J.; Dopita, M. A.; Sutherland, R. S.; Heisler, C. A.; Trevena, J. 2001, ApJ, 556, 121
- Kewley et al. (2006) Kewley, L. J.; Groves, B.; Kauffmann, G.; Heckman, T., 2006, MNRAS, 372, 961
- Kewley et al. (2019) Kewley, L. J.; Nicholls, D. C.; Sutherland, R. S., 2019, ARA&A, 57, 511
- Kim et al. (2021) Kim, M.; Barth, A. J.; Ho, L. C.; Son, S., 2021, ApJS, 256, 40
- Komossa & Xu (2007) Komossa, S. ; Xu, D., 2007, ApJL, 667, 33
- Kormendy & Ho (2013) Kormendy, J.; Ho, L. C., 2013, ARA&A, 51, 511
- Kovacevic et al. (2010) Kovacevic, J.; Popovic, L. C.; Dimitrijevic, M. S., 2010, ApJS, 189, 15
- Kuraszkiewicz et al. (2021) Kuraszkiewicz, J.; Wilkes, B. J.; Atanas, A.; et al., 2021, ApJ, 913, 134
- Lyke et al. (2020) Lyke, B. W.; Higley, A. N.; McLane, J. N.; et al., 2020, ApJS, 250, 8
- Marinucci et al. (2012) Marinucci, A.; Bianchi, S.; Nicastro, F.; Matt, G.; Goulding, A. D., 2012, ApJ, 748, 130
- Mateos et al. (2016) Mateos, S., et al., 2016, ApJ, 819, 166
- McConnell & Ma (2013) McConnell, N. J.; Ma, C. P., 2013, ApJ, 764, 184
- Miller & Goodrich (1990) Miller, J. S.; Goodrich, R. W., 1990, ApJ, 355, 456
- Moran et al. (2020) Moran, E. C.; Barth, A. J.; Kay, L. E.; Filippenko, A. V., 2020, ApJL, 540, 73
- Nagao et al. (2004) Nagao, T., et al., 2004, AJ, 128, 109
- Nelson & Whittle (1996) Nelson, C. H.; Whittle, M., 1996, ApJ, 465, 96
- Nelson (2000) Nelson, C. H., 2000, ApJL, 544, 91
- Netzer (2009) Netzer, H., 2009, ApJ, 695, 793
- Netzer (2015) Netzer, H., 2015, ARA&A, 53, 365
- Netzer (2020) Netzer, H. 2020, MNRAS, 488, 5185
- Oh et al. (2015) Oh, K., et al., 2015, ApJS, 219, 1
- Onken et al. (2004) Onken, C. A.; Ferrarese, L.; Merritt, D.; Peterson, B. M.; Pogge, R. W.; Vestergaard, M.; Wandel, A., 2004, ApJ, 615, 645
- Onori et al. (2017) Onori, F.; Ricci, F.; La Franca, F.; et al., 2017, MNRAS Letter, 468, 97
- Pancoast et al. (2017) Pancoast, A.; Brewer, B. J.; Treu, T.; Park, D.; Barth, A. J.; Bentz, M. C.; Woo, J.-H., 2014, MNRAS, 445, 3073
- Park et al. (2012) Park, D.; Kelly, B. C.; Woo, J.-H.; Treu, T., 2012, ApJS, 203, 6
- Peterson et al. (2004) Peterson, B. M., et al., 2004, ApJ, 613, 682
- Peters et al. (2015) Peters, C. M.; Richards, G. T.; Myers, A. D.; et al., 2015, ApJ, 811, 95
- Prugniel & Soubiran (2001) Prugniel, Ph.; Soubiran, C., 2001, A&A, 369, 1048
- Rafiee & Hall (2011) Rafiee, A.; Hall, P. B., 2011, ApJS, 194, 42
- Rakshit et al. (2017) Rakshit, S.; Stalin, C. S.; Chand, H.; Zhang, X. G., 2017, ApJS, 229, 39
- Richards et al. (2002) Richards, G. T., et al., 2002, AJ, 123, 2945
- Richards et al. (2006) Richards, G. T., Lacy, M., Storrie-Lombardi, L. J., et al. 2006, ApJS, 166, 470
- Rix & White (1992) Rix, H.-W.; White, S. D. M., 1992, MNRAS, 254, 389
- Ross et al. (2012) Ross, N. P.; et al., 2012, ApJS, 199, 3
- Savorgnan & Graham (2015) Savorgnan, G. A. D.; Graham, A. W., 2015, MNRAS, 446, 2330
- Savic et al. (2018) Savic, D.; Goosmann, R.; Popovic, L. C.; Marin, F.; Afanasiev, V. L., 2018, A&A, 614, 120
- Shen et al. (2011) Shen, Y.; Richards, G. T.; Strauss, M. A., et al., 2011, ApJS, 194,
- Shen et al. (2015a) Shen, Y.; Brandt, W. N.; Dawson, K. S.; ET AL., 2015a, ApJS, 2015a, 216, 4
- Shen et al. (2015b) Shen, Y.; Greene, J. E.; Luis C. Ho, L. C.; et al., 2015b, ApJ, 805, 96
- Shu et al. (2012) Shu, Y.; Bolton, A. S.; Schlegel, D. J.; et al., 2012, AJ, 143, 90
- Siebenmorgen et al. (2005) Siebenmorgen, R.; Haas, M.; Krugel, E.; Schulz, B., 2005, A&A, 436, 5
- Sexton et al. (2019) Sexton, R. O.; Canalizo, G.; Hiner, K. D.; et al., 2019, ApJ, 878, 101
- Tran (2003) Tran, H. D., 2003, ApJ, 583, 632
- Thomas et al. (2013) Thomas, D.; Steele, O.; Maraston, C.; et al., 2013, MNRAS, 431, 1383
- Tremaine et al. (2002) Tremaine, S.; Gebhardt, K.; Bender, R.; et al., 2002, ApJ, 574, 740
- Valdes et al. (2004) Valdes, F.; Gupta, R.; Rose, J. A.; Singh, H. P.; Bell, D. J., 2004, ApJS, 152, 251
- Villarroel & Korn (2014) Villarroel, B.; Korn, A. J., 2014, Nature Physics, 10, 417
- Vestergaard (2002) Vestergaard, M., 2002, ApJ, 571, 733
- Williams et al. (2018) Williams, P. R.; Pancoast, A.; Treu, T., et al., 2018, ApJ, 866, 75
- Woo et al. (2010) Woo, J.-H.; Treu, T.; Barth, A. J.; et al., 2010, ApJ, 716, 269
- Woo et al. (2013) Woo, J.-H., et al., 2013, ApJ, 772, 49
- Woo et al. (2015) Woo, J.-H.; Yoon, Y.; Park, S.; Park, D.; Kim, S. C., 2015, ApJ, 801, 38
- Woo et al. (2016) Woo, J.-H.; Bae, H. J.; Son, D.; Karouzos, M., 2016, ApJ, 817, 108
- Vanden Berk et al. (2001) Vanden Berk D. E., et al., 2001, AJ, 122, 549
- Xiao et al. (2011) Xiao, T.; Barth, A.; Greene, J. E.; Ho, L. C.; Bentz, M. C.; Ludwig, R. R., Jiang Y., 2011, ApJ, 739, 28
- Zhang (2014) Zhang, X. G., 2014, MNRAS, 438, 557
- Zhang et al. (2016) Zhang, X. G.; Feng, L., 2016, MNRAS, 457, 3878
- Zhang et al. (2017) Zhang, X. G.; Feng, L., 2017, MNRAS, 468, 620
- Zhang et al. (2019) Zhang, X. G.; Bao M.; Yuan, Q., 2019, MNRAS Letter, 490, 81
- Zhang et al. (2020) Zhang, X. G.; Feng Y.; Chen, H.; Yuan, Q., 2020, ApJ, 905, 97
- Zhang et al. (2021) Zhang, X. G., 2021, MNRAS, 502, 2508
- Zhang (2021a) Zhang, X. G., 2021a, ApJ, 909, 16, ArXiv:2101.02465
- Zhang (2021b) Zhang, X. G., 2021b, ApJ accepted, ArXiv:2107.09214
- Zhang (2021c) Zhang, X. G., 2021c, MNRAS accepted, ArXiv:2108.09714
- Zou et al. (2019) Zou, F.; Yang, G.; Brandt, W. N.; Xue, Y., 2019, ApJ, 878, 11