A CT18 global PDF fit at the leading order in QCD
Abstract
In this paper, we present a CT18 PDFs fitted with Leading-Order QCD perturbation theory. The CT18 LO PDFs is obtained within the general CT18 framework Hou:2019efy , along with two additional treatments being imposed to improve the quality of the fit. We take the -boson charge asymmetry and inclusive single-top production at LHC as examples to illustrate the implication of the CT18 LO PDFs.
MSUHEP-22-013, SMU-HEP-22-05
1 Introduction
Parton distribution functions (PDFs) describes the structure of hadrons as composed of (anti)quarks and gluons. PDFs is needed to make predictions for hard scattering processes in high-energy collisions. Currently, with measurements at the Large Hadron Collider (LHC) becoming unprecedentedly precise, PDFs must be known at a high level of accuracy and precision. Such precise PDF parametrizations are provided by several groups Hou:2019efy ; Bailey:2020ooq ; Ball:2021leu by taking advantage of the availability of predictions at next-to-next-to-leading order (NNLO) in QCD coupling for a large number of collider processes. Meanwhile, predictive power of leading order (LO) QCD theory is no longer sufficient for today’s precise measurements. However, the need for LO PDFs still exists. Commonly used event generators, such as PYTHIA, still rely on simulations of parton showers using LO splitting kernels Sjostrand:2014zea , though progress has been made in literature to implement parton showers at the next-to leading order (NLO) Nason:2004rx .
The latest LO PDFs in the high-precision LHC era are MSHT20 LO Bailey:2020ooq and NNPDF4.0 LO Ball:2021leu . To improve the description of Drell-Yan (DY) processes, a -factor of has been adopted in LO PDFs fits of MSHT family Martin:2009iq ; Harland-Lang:2014zoa ; Bailey:2020ooq . The fit quality of MSHT20 LO is , which is worse than their previous LO results and the MSHT20 PDFs beyond LO. The NNPDF4.0 LO is not able to fit experimental data well either, with . Such bad qualities of fits for these LO results come from the inclusion of high precise LHC measurements, where NNLO corrections to theory predictions are already essential for a precise description.
The optimized CTEQ-TEA PDFs, CT09MCS, CT09MC1, and CT09MC2, dedicated for the use with event generator Lai:2009ne were obtained by generalizing the conventional QCD global analysis. The CT09MC candidate PDFs are constrained by not only the real experimental data sets, but also the NLO pseudo-data sets for representative LHC processes as joint input to the global fit, so that the description of the underlying event at the Tevatron and LHC is at a reasonably good level. Specifically, in CT09MCS, the factorization scales in the LO matrix elements and the normalization for each pseudo-data sets are allowed to be varied to reach the best agreement with NLO pseudo-data. In CT09MC1 and CT09MC2 PDFs, the total momentum sum rule, which reflects the conservation of total momentum carried by partons, is relaxed, and the factorization scales for pseudo-data sets are fixed. The normalization to each pseudo-data sets is still fitted as in the CT09MCS analysis. Two PDFs sets, CT09MC1 and CT09MC2 PDFs, are determined with 1-loop and 2-loop expression of running respectively. For the last LO result of CTEQ-TEA family, CT14 LO PDFs Dulat:2015mca , there are two PDFs sets provided. One is obtained with LO evolution and for making up the insufficient PDFs evolution. The other PDFs set is obtained with NLO evolution and . The qualities of fits are 1.99, 2.17 for CT14 LO with LO evolution and with NLO evolution, respectively.
Coming to the CT18 Hou:2019efy global analysis, a wide variety of precise LHC measurements, on top of the combine HERA I+II DIS H1:2015ubc data sets and CT14 data sets, are used in the determination of CT18 NLO and NNLO PDFs. We shall expect that a LO fit within the CT18 global analysis framework would suffer from the difficulty of describing high-precise LHC data without higher-order corrections, like the situation occurs in MSHT20 LO Bailey:2020ooq and NNPDF4.0 LO Ball:2021leu .
In this work, we present the CT18 LO PDFs global fit within the general framework of CT18 NLO and NNLO studies Hou:2019efy . The experimental data sets and the settings of the fit are introduced in Sec. 2. Sec. 3 describes the results of the fit and analysis on the impacts of the new LHC precision data. In Sec. 4, we study the implication of the CT18 LO PDFs by comparing some of the LHC observables, such as the -boson charge asymmetry and the single-top production. Sec. 5 contains our conclusion.
2 Description of the CT18 LO global fit
In this section, we firstly introduce the experimental data sets as input for CT18 LO global fit. Then we impose two additional treatments to improve the results of fit from the limitation of LO perturbation theory.
2.1 CT18 data sets
The CT18 QCD global analysis Hou:2019efy is obtained by fitting from a wide range of LHC data sets with high precision, the combined HERA I+II DIS data sets, and data sets already included in CT14 global QCD analysis Dulat:2015mca , totally 40 data sets. The global fits are performed with NLO and NNLO QCD perturbation theories. Both NLO and NNLO fits can describe this large data set well in the measurement of as shown in Tables 1 and 2. In the following section 2.2, we will show that a subset of CT18 data set, particularly consisting of high-precision LHC data sets in Run-II era, is difficult to fit with LO QCD theory.
For the high-precision LHC data sets included in the CT18 analyses, there are six data sets corresponding to and vector boson production. For the ATLAS measurements, they are the TeV and combined cross-section measurement with 4.6 fb-1 of integrated luminosity (ID=248) ATLAS:2016nqi , and TeV transverse momentum of lepton pairs distribution in the production with 20.3 fb-1 of integrated luminosity (ID=253) ATLAS:2015iiu . For the CMS measurement, the TeV muon charge asymmetry for inclusive production with 18.8 fb-1 of integrated luminosity (ID=249) CMS:2016qqr is included. For the LHCb measurements, the data sets included in CT18 are TeV and forward rapidity cross-section distribution measurement with 1.0 fb-1 of integrated luminosity (ID=245) LHCb:2015okr , TeV forward rapidity cross-section distribution measurement with 2.0 fb-1 of integrated luminosity (ID=246) LHCb:2015kwa , and TeV and production cross-section distribution measurement with 2.0 fb-1 of integrated luminosity (ID=250) LHCb:2015mad , respectively. The ATLAS TeV and combined cross-section measurement (ID=248) data set ATLAS:2016nqi is not included in the nominal CT18, since this data set is observed to have tension with other data sets (Sec. II.C of Hou:2019efy ). Alternative PDFs sets, CT18A and CT18Z, have been generated with the inclusion of ATLAS TeV and data set.
In the analysis of CT18 LO, we start from the CT18 data sets, without the inclusion of the mentioned ATLAS TeV and data set. Then, as will be shown in the next section, we shall exclude five data sets which cannot be correctly described at LO.
2.2 Special treatments adapted in the CT18 LO fit
In comparison to the PDF fits at NLO and NNLO, a naive fit at LO tends to be problematic. Theory predictions at LO are less complicated than at higher orders, but they miss some contributions of quantum corrections that are especially vital for describing the most precise experimental data. For example, many NLO predictions of LHC cross-sections tend to be larger than predictions at LO in terms of magnitudes, see Figure 1 of Ref. Lai:2009ne for comparison between LO and NLO predictions of SM boson rapidity distributions at LHC. On the other hand, shapes and magnitudes of PDFs are restricted by the momentum sum rule and the flavour number sum rules. Consequently, PDFs determined at LO is known to have incorrect behaviour over wide range of . So predictions of spectrum with LO PDFs and LO matrix elements are unreliable also in terms of shape, for example see Figure 1 of Ref. Lai:2009ne for comparison between LO and NLO PDFs with LO matrix elements. To resolve the difficultly in the determination of LO PDFs and the generation of LO predictions with LO PDFs, the conventional approach of PDFs determination is in need for extension.
In CT18 global analyses, several vector boson production data sets from LHC Run-II are included. The experimental uncertainty in these data sets is at a percent level and can strongly constrain PDFs at the electroweak scale. A LO fit with the inclusion of these data sets is difficult, and the best-fit PDFs fails to describe fitted data sets well. To illustrate this point, a PDF set named CT18 LOpert has been generated, where all theoretical predictions are computed at LO, and no other adjustments have been applied. In Tables 1 and 2, the CT18 LOpert presents undesirable qualities of fit both totally and individually to specific data sets. In order to improve the fit at LO, in our final result, CT18 LO, we have applied the following two special treatments:
-
•
From the CT18 data set, we exclude ID 169 H1 H1:2015ubc , ID 145 H1 bottom reduced cross-section H1:2004esl , ID 147 combined HERA charm production H1:2012xnw , ID 253 ATLAS 8 TeV boson distribution ATLAS:2015iiu , and ID 268 ATLAS 7 TeV and bosons rapidity distribution plus charge asymmetry distribution ATLAS:2011qdp , since these data sets cannot be well described by the QCD theory at leading order. Furthermore, the ID248 ATLAS 7 TeV precision and data ATLAS:2016nqi were not included in the nominal CT18 NLO and NNLO analysis, due to their tension with other datasets in the global fit Hou:2019efy . For comparison, alternative CT18A and CT18Z NLO and NNLO PDFs sets were generated Hou:2019efy with the inclusion of this data set. After excluding all the above-mentioned data sets, the total number of remaining data points is 3547, which is 134 points less than the number of CT18 data set.
-
•
Fot the rest of Drell-Yan data sets, for the inclusive production of either or bosons, we adopt a -factor as in Eq. 1 to partially make up the limitation of LO matrix elements,
| (1) |
| ID | Data set | CT18 LO | CT18 LOpert | CT18 NLO | CT18 NNLO |
|---|---|---|---|---|---|
| 145 | H1 H1:2004esl | 6.14∗ | 6.26 | 1.49 | 0.68 |
| 147 | Combined HERA charm production H1:2012xnw | 21.14∗ | 11.54 | 0.80 | 1.24 |
| 169 | H1 H1:2010fzx | 17.15∗ | 17.15 | 0.77 | 1.89 |
| 245 | LHCb 7 TeV W/Z rap. LHCb:2015okr | 5.85 | 8.36 | 2.29 | 1.63 |
| 246 | LHCb 8 TeV Zee rap. LHCb:2015kwa | 5.84 | 11.06 | 2.09 | 1.00 |
| 249 | CMS 8 TeV W Ach CMS:2016qqr | 2.17 | 9.14 | 0.60 | 1.03 |
| 250 | LHCb 8 TeV W/Z rap. LHCb:2015mad | 10.59 | 13.61 | 3.36 | 2.17 |
| 253 | ATLAS 8 TeV Z ATLAS:2015iiu | 19.21∗ | 19.20 | 2.06 | 1.12 |
| total | 1.60 | 2.15 | 1.17 | 1.17 |
| ID | Data set | CT18 LO | CT18 LOpert | CT18 NLO | CT18 NNLO |
|---|---|---|---|---|---|
| 160 | HERAI+II 1 fb-1 H1 and ZEUS NC | 1.72 | 1.64 | 1.22 | 1.26 |
| and CC e±p reduced cross sec. comb. H1:2015ubc | |||||
| 101 | BCDMS BCDMS:1989ggw | 1.16 | 1.26 | 1.08 | 1.11 |
| 102 | BCDMS BCDMS:1989qop | 1.29 | 1.64 | 1.13 | 1.12 |
| 104 | NMC NewMuon:1996fwh | 1.17 | 1.43 | 0.97 | 1.02 |
| 108 | CDHSW Berge:1989hr | 1.09 | 1.52 | 0.90 | 1.01 |
| 109 | CDHSW Berge:1989hr | 1.22 | 1.42 | 0.82 | 0.90 |
| 110 | CCFR CCFRNuTeV:2000qwc | 1.78 | 2.55 | 1.15 | 1.14 |
| 111 | CCFR Seligman:1997mc | 0.53 | 0.80 | 0.41 | 0.39 |
| 124 | NuTeV SIDIS Mason:2006qa | 1.02 | 2.11 | 0.52 | 0.49 |
| 125 | NuTeV SIDIS Mason:2006qa | 1.73 | 2.46 | 1.03 | 1.17 |
| 126 | CCFR SIDIS NuTeV:2001dfo | 0.60 | 1.43 | 0.79 | 0.75 |
| 127 | CCFR SIDIS NuTeV:2001dfo | 0.58 | 1.15 | 0.54 | 0.52 |
| 504 | CDF Run-2 inclusive jet production CDF:2008hmn | 1.54 | 1.46 | 1.49 | 1.70 |
| 514 | D Run-2 inclusive jet production D0:2008nou | 1.22 | 1.38 | 1.07 | 1.03 |
| 542 | CMS 7 TeV 5 fb-1 single incl. jet | 1.41 | 1.56 | 1.23 | 1.23 |
| cross sec., = 0.7 (extended in ) CMS:2014nvq | |||||
| 544 | ATLAS 7 TeV 4.5 fb-1 single incl. jet | 1.50 | 1.58 | 1.40 | 1.45 |
| cross sec., = 0.6 ATLAS:2014riz | |||||
| 545 | CMS 8 TeV 19.7 fb-1 single incl. jet | 1.65 | 1.78 | 1.10 | 1.14 |
| cross sec., R = 0.7, (extended in ) CMS:2016lna | |||||
| 573 | CMS 8 TeV 19.7 fb-1 norm. double-diff. | 2.05 | 2.38 | 1.56 | 1.18 |
| top and cross sec. single CMS:2017iqf | |||||
| 580 | ATLAS 8 TeV 20.3 fb-1 and | 2.41 | 3.38 | 1.29 | 0.63 |
| absolute spectrum ATLAS:2015lsn | |||||
| total | 1.60 | 2.15 | 1.17 | 1.17 |
To elaborate on the first treatment, we first note that the longitudinal structure function at leading order respects the Callan-Gross relation Callan:1969uq ,
| (2) |
Beyond LO, the gluon emission would give arise of a non-vanishing , and the Callan-Gross relation is violated accordingly. In CT18 data set, the ID 169 H1 data H1:2010fzx measures the longitudinal structure function by collision. With the reason just said, a LO PDF fit can never be able to describe this data. Hence we exclude this data set from the LO fit. The ID 145 H1 bottom reduced cross-section H1:2004esl and the ID 147 Combined HERA charm production H1:2012xnw data measure the inclusive bottom and charm production rates, respectively, from deep inelastic scattering, which are sensitive to higher order QCD corrections due to the non-vanishing mass of heavy partons of the proton. Detailed discussions can be found in Refs. Aivazis:1993pi ; Aivazis:1993kh ; Kramer:2000hn ; Tung:2001mv ; Guzzi:2011ew . Therefore, we also exclude these two data sets. Moreover, a LO QCD calculation, at , cannot describe well the ID 253 ATLAS 8 TeV boson distribution ATLAS:2015iiu , because of the presence of large logarithm . Likewise, a QCD calculation, at , cannot describe well the inclusive or productions, but with asymmetric kinematic cuts applied to the two decay leptons of the vector boson, such as the ID 268 ATLAS 7 TeV charge lepton rapidity asymmetry measurement ATLAS:2011qdp . Needless to say that at , the distribution of the Drell-Yan pair produced at the LHC is a delta function with peak at zero, and the two decay leptons must have the same transverse momenta, as predicted by the parton model with longitudinal PDFs. Hence, these data sets are also excluded in our LO fits.
The importance of the second treatment will be discussed in Sec. 3.3. In LO PDFs studies of the MSHT family Martin:2009iq ; Harland-Lang:2014zoa ; Bailey:2020ooq , this -factor, Eq. 1, was also adopted for helping describing vector boson production data. Apart from these two special treatments, there is no other treatment been applied to CT18 LO, as we wish to keep the balance between a LO PDFs fit and a good fit quality. As for the strong coupling as input, it is expected that in a LO PDFs analysis the best-fit would prefer a larger value of . We decide to fix the strong coupling at -boson mass scale to be for CT18 LO. The dependence of CT18 LO fit will be discussed in Sec. 3.4.
3 Results
In this section, we present results of the CT18 LO PDFs fit, which is obtained based on the CT18 framework but with two additional treatments as defined in Sec. 2.2. Along with the fit quality, the presentation of PDF configuration and various PDF moments, the impact of Drell-Yan data from LHC precision measurements and dependence of the fit will also be discussed.
3.1 Quality of the fit
Goodness-of-fit figures, , for selected data sets are summarised in Tables 1, 2. The overall of CT18 LO is 1.60, significantly improved from 2.15, the total of CT18 LOpert fit. In total, the fit to the CT18 LO data set is clearly enhanced by two special treatments introduced in Sec. 2.2, though it is still much worse than the CT18 NLO and NNLO fits.
For individual data sets, the majority of them receives a smaller in CT18 LO, comparing to in CT18 LOpert. With the help of the second special treatment, the Drell-Yan -factor, Eq. (1), the high-precision LHC and bosons production data sets in Table 1 obtain a better in CT18 LO than in CT18 LOpert. But the fits to them by no means are good. For DIS and jet data sets shown in Table 2, fits to these data sets are mostly improved from in CT18 LOpert, but again it is difficult to obtain a good fit with at this order. In CT18 LO the ID160 HERA I+II combined reduced cross-section H1:2015ubc has a slightly larger than in CT18 LOpert. This increase only comes from several data points with very low energy scale GeV in the neutral current channel of collision, where the correlated systematic errors pull the central values of data points away from theory prediction. In the CTEQ-TEA program, the best-fit value of is the combination of the best-fit to the shifted data and the contribution from the optimal nuisance parameters Hou:2019efy ; Pumplin:2002vw . The optimal nuisance parameters for these low energy neutral current HERA data points thus have very large values, suggesting that there is a noticeable systematical bias in the CT18 LO fit to these data points. The fits to the rest of HERA data points for CT18 LO and CT18 LOpert are in general comparable. A similar phenomenon, that one data point being pulled far away by correlated systematic errors results in an increase in from CT18 LOpert to CT18 LO, also happens to ID504 CDF Run-2 inclusive jet production CDF:2008hmn .
The equivalent information of the agreement to experimental data can be provided by the effective Gaussian variables Lai:2010vv , whose distribution theoretically approaches for large . In Table 3, we summarize the effective Gaussian variables of CT18 LO and CT18 LOpert for selected data sets in Tables 1, 2. We notice that there is a plenty of data sets in CT18 LO and CT18 LOpert having , so that totally the distribution of the effective Gaussian variable in CT18 LO deviates significantly from , which is expected in a good fit. The distribution of the effective Gaussian variables , along with the distribution of , indicates that the experiments are strongly underfitted in CT18 LO, although two special treatments introduced in Sec. 2.2 can help improving the quality of the fit.
| ID | Data set | CT18 LO | CT18 LOpert | CT18 NLO | CT18 NNLO |
| 145 | H1 H1:2004esl | 5.93∗ | 6.02 | -0.32 | -0.65 |
| 147 | Combined HERA charm production H1:2012xnw | 30.13∗ | 20.06 | 2.15 | 1.15 |
| 169 | H1 H1:2010fzx | 11.54∗ | 11.54 | -0.36 | 1.65 |
| 245 | LHCb 7 TeV W/Z rap. LHCb:2015okr | 10.23 | 13.41 | 3.99 | 2.24 |
| 246 | LHCb 8 TeV Zee rap. LHCb:2015kwa | 7.38 | 11.76 | 2.55 | 1.42 |
| 249 | CMS 8 TeV W Ach CMS:2016qqr | 2.22 | 8.32 | -0.95 | 0.22 |
| 250 | LHCb 8 TeV W/Z rap. LHCb:2015mad | 16.09 | 19.10 | 6.34 | 3.73 |
| 253 | ATLAS 8 TeV Z ATLAS:2015iiu | 21.45∗ | 21.44 | 3.10 | 0.51 |
| 160 | HERAI+II 1 fb-1 H1 and ZEUS NC | 14.06 | 12.78 | 4.92 | 5.66 |
| and CC e±p reduced cross sec. comb. H1:2015ubc | |||||
| 101 | BCDMS BCDMS:1989ggw | 2.05 | 3.19 | 1.05 | 1.39 |
| 102 | BCDMS BCDMS:1989qop | 3.01 | 6.02 | 1.40 | 1.34 |
| 104 | NMC NewMuon:1996fwh | 1.32 | 3.00 | -0.22 | 0.21 |
| 108 | CDHSW Berge:1989hr | 0.64 | 3.00 | -0.64 | 0.10 |
| 109 | CDHSW Berge:1989hr | 1.46 | 2.65 | -1.31 | -0.66 |
| 110 | CCFR CCFRNuTeV:2000qwc | 3.80 | 6.57 | 0.88 | 0.86 |
| 111 | CCFR Seligman:1997mc | -3.67 | -1.36 | -5.09 | -5.24 |
| 124 | NuTeV SIDIS Mason:2006qa | 0.14 | 3.80 | -2.51 | -2.72 |
| 125 | NuTeV SIDIS Mason:2006qa | 2.53 | 4.39 | 0.19 | 0.72 |
| 126 | CCFR SIDIS NuTeV:2001dfo | -1.98 | 1.77 | -1.27 | -1.17 |
| 127 | CCFR SIDIS NuTeV:2001dfo | -2.08 | 0.70 | -2.34 | -2.49 |
| 504 | CDF Run-2 inclusive jet production CDF:2008hmn | 2.85 | 2.46 | 2.60 | 3.54 |
| 514 | D Run-2 inclusive jet production D0:2008nou | 1.59 | 2.55 | 0.55 | 0.30 |
| 542 | CMS 7 TeV 5 fb-1 single incl. jet | 3.28 | 4.33 | 1.97 | 1.96 |
| cross sec., = 0.7 (extended in ) CMS:2014nvq | |||||
| 544 | ATLAS 7 TeV 4.5 fb-1 single incl. jet | 3.65 | 4.19 | 3.01 | 3.34 |
| cross sec., = 0.6 ATLAS:2014riz | |||||
| 545 | CMS 8 TeV 19.7 fb-1 single incl. jet | 5.28 | 6.16 | 0.96 | 1.30 |
| cross sec., R = 0.7, (extended in ) CMS:2016lna | |||||
| 573 | CMS 8 TeV 19.7 fb-1 norm. double-diff. | 2.41 | 2.97 | 1.48 | 0.60 |
| top and cross sec. single CMS:2017iqf | |||||
| 580 | ATLAS 8 TeV 20.3 fb-1 and | 2.94 | 4.28 | 0.86 | -1.07 |
| absolute spectrum ATLAS:2015lsn |
3.2 Functional dependence and moments of PDFs
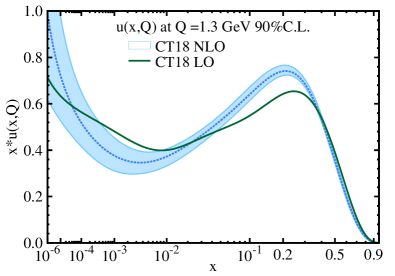
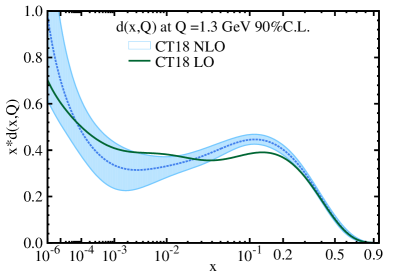
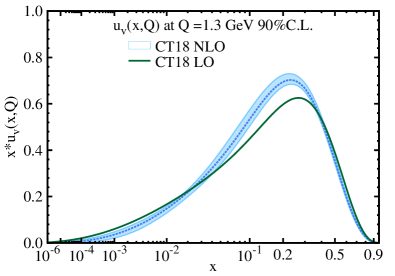
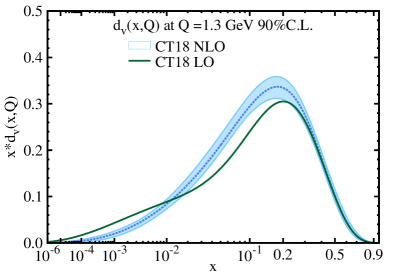
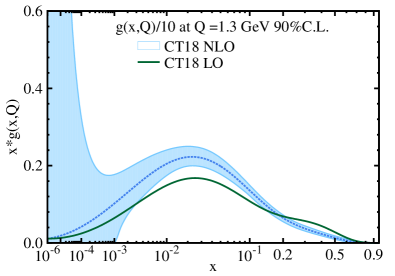
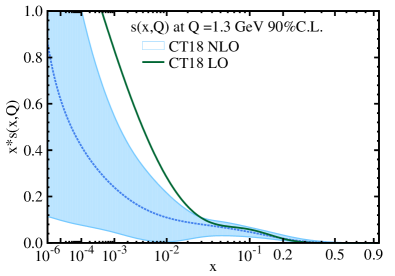
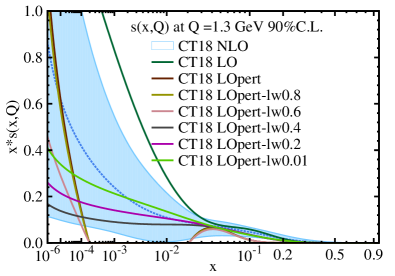
Figure 1 compares CT18 LO PDFs and CT18 NLO PDFs at the inital scale GeV. In comparison to CT18 NLO, the CT18 LO exhibits a different configuration due to the significant difference between the LO and NLO QCD perturbation theory. In Figs. 1 and 1 for and , the CT18 LO in the small- and large- limits is consistent with CT18 NLO. As shown in Figs. 1 and 1, the bumps in valence quarks around are reduced so that CT18 LO is outside of the CT18 NLO error band. Meanwhile, the and distributions are enhanced in the region due to the valence number sum rules. The CT18 LO gluon PDF exhibits deviations from CT18 NLO in the ranges and , cf. Fig. 1. Enhancement of the gluon PDF in the large- region is needed at LO in order to compensate for the missing higher order contribution to the Wilson coefficients of a number of scattering processes, such as high jet production at Tevatron and LHC and the precision DIS data at HERA, as required by a consistent NLO (or NNLO) theory calculation for describing the existing data. Fig. 1 shows that the CT18 LO strange PDF has a good agreement with CT18 NLO for . In the range , the CT18 LO strange PDF shows a larger magnitude than the CT18 NLO.
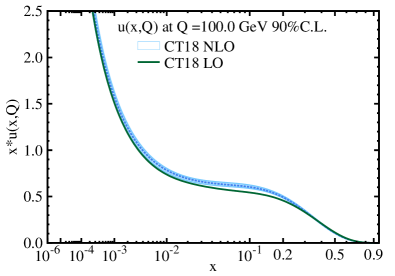
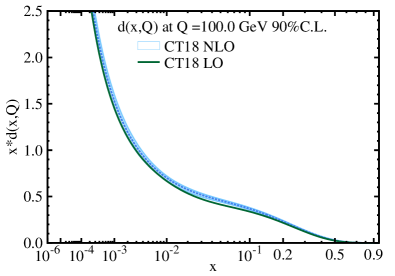
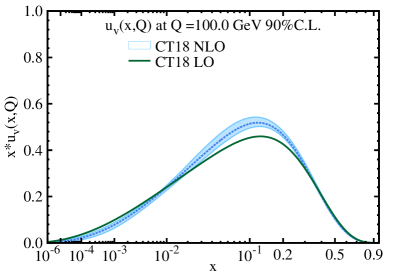
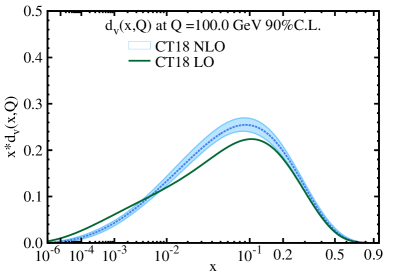
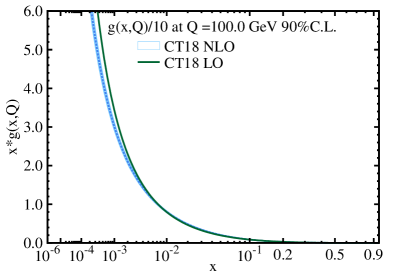
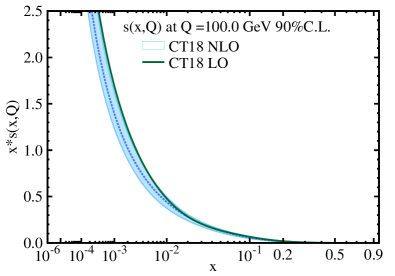
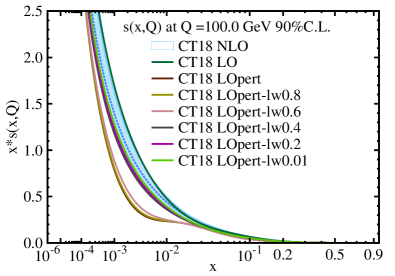
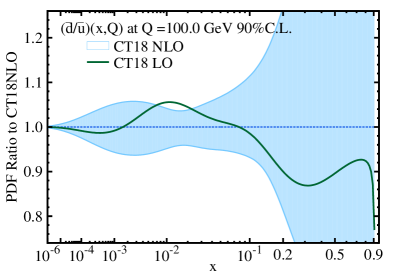
The CT18 LO PDFs at 100 GeV are shown in Fig. 2. For the and quarks distributions in the small- and large- limits, the CT18 LO is consistent with CT18 NLO up to its uncertainty bands. In Figs. 2 and 2, the CT18 LO and distributions at 100 GeV are still different from the CT18 NLO distributions in the way similar to Fig. 1 at 1.3 GeV. The CT18 LO gluon PDF at 100 GeV is higher than CT18 NLO for . In Fig. 2, the CT18 LO quark PDF at 100 GeV is consistent with CT18 NLO.
In Table 4, we summarize the second moments at the initial scale, which quantifies the momentum carried by an individual flavour parton. Comparing to CT18 NLO central values, there are significant increments in the strange and gluon second moments. As mentioned before, more hard gluons are particularly required at the LO in order to describe the precision data, by increasing the parton densities of sea (anti)quarks and gluons in the smaller- region via the LO DGLAP evolution. Similarly, the parametrised strange PDF at scale is also driven to acquire more momentum in order to describe data which are sensitive to -quark PDF, such as DIS di-muon data and precision and data. Due to the momentum sum rule, all parton densities are correlated. Hence, because of the enhancements in and , all the other flavours are allocated with less momenta than in CT18 NLO. The CT18 LO second moments at scale in general are consistent with CT18 NLO within one standard deviation, except for the strange PDF. Without higher-order corrections, a better determination of strange PDF is difficult, as to be seen below.
| PDFs | ||||
|---|---|---|---|---|
| CT18 LO | 0.3362 | 0.1571 | 0.3076 | 0.1201 |
| CT18 NLO | 0.3480(359) | 0.1692(402) | 0.3188(359) | 0.1317(401) |
| CT18 LO | 0.0286 | 0.0370 | 0.0183 | 0.4045 |
| CT18 NLO | 0.0292(21) | 0.0375(26) | 0.0125(33) | 0.3911(101) |
3.3 Impact of precise LHC and production data
Today, vector boson production at the LHC can be measured so precisely that total experimental uncertainty is at a percent level. At NLO, the production cross-sections of the Drell-Yan processes receive large corrections from contributions of additional quark-gluon subprocesses and the virtual correction on the vertex of quark associated with vector boson, so that the Born-level cross-section is not capable of describing experimental data as accurately as those beyond the leading order. The fourth column of Table 1 shows the values of of the CT18 LOpert fit, which uses the LO theory prediction without including the -factor, as introduced in Eq. (1), for computing Drell-Yan cross-sections. It is evident that the CT18 LOpert fit cannot describe the data well, with a very large value of for each individual Drell-Yan data. Furthermore, the resulting PDFs are also problematic, especially the strange quark PDF.
To illustrate the impact of these gauge boson production data sets, we compare a series of fits, starting from CT18 LOpert introduced in Sec. 2.2, with various weights to LHC Run-II vector boson production data sets, namely, ID 245, 246, 249, 250, and 253, as shown in Fig. 3. For weights of these data sets being larger or equal to 0.6, the strange PDF vanishes in the range at = 1.3 GeV under the impact of these data sets. When evolved to 100 GeV, the strange distribution is still quite small in this range of . If the impact of these data sets is gradually removed from fits as weights becoming smaller, the resulting -quark PDF will become larger. When fitting the vector boson production, the up and down sea quark distributions is driven by data to increase their magnitudes to compensate for the deficiency in the LO Wilson coefficients. Since all flavours are correlated under the total momentum sum rule, the magnitude of the strange PDF has to be reduced when that of the others is increased. Such a strong suppression of the strange PDF is well resolved in CT18 LO by applying the Drell-Yan -factor, Eq. 1 to those Drell-Yan data sets, so that and PDFs are suppressed and -quark PDF is increased as compared to those in CT18 LOpert.
As an example, in Fig. 4, we compare predictions for the ID 245 LHCb and bosons production at 7 TeV LHCb:2015okr by CT18 LO, CT18 LOpert, and CT18 NLO to the experimental data points. The theory predictions are calculated by using the APPLgird package Carli:2010rw . Without the application of -factor, Eq. 1, CT18 LOpert cannot provide enough cross-sections for either or production, and yields a as large as 8.36, as shown in Table 1. Such a difficulty in fitting vector bosons production data results in the vanishing feature of the CT18 LOpert -quark PDF at lower energy scale as shown in Fig. 3. In CT18 LO, the prediction of overall magnitude of this process, ID 245, is improved by the Drell-Yan -factor and consistent with predictions by CT18 NLO. Hence, the quality of fit to this data is improved to . Consequently, the suppression on the -quark PDF as in CT18 LOpert is accordingly relaxed. But the improvement of the shape of rapidity spectrum still requires higher-order QCD corrections.
3.4 dependence of CT18 LO
The strong coupling constant is one of key elements in computing theory predictions, and hence fed as input into a PDFs global fit. For the PDFs fit beyond LO, it is widely accepted Hou:2019efy ; Ball:2021leu ; Bailey:2020ooq ; NNPDF:2017mvq ; Dulat:2015mca ; Harland-Lang:2014zoa ; Martin:2009iq that the value of strong coupling at -boson mass scale is fixed at its PDG value ParticleDataGroup:2020ssz . Due to the missing of important quantum corrections, to generate more sea quarks via parton evolution to resolve the difficulty in a LO PDF fit, the value of as input is often fixed at a higher value than the PDG global average . A number of LO PDFs Bailey:2020ooq ; NNPDF:2017mvq ; Dulat:2015mca takes to be at 0.130. For NNPDF4.0 Ball:2021leu , NNPDF3.1 NNPDF:2017mvq , and CT14 Dulat:2015mca , LO PDFs with are also provided. For MSTW08 LO Martin:2009iq and MMHT14 LO Harland-Lang:2014zoa is fixed at 0.140 and 0.135 respectively.
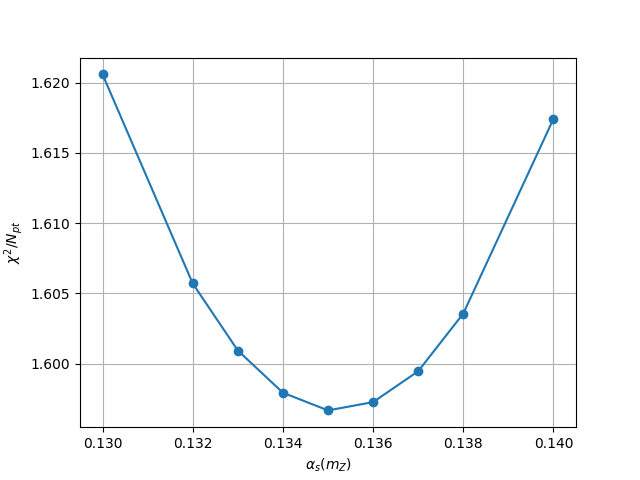
Determination of the input value of of CT18 LO PDFs is done by searching for the optimal value of this theoretical input parameter. We scan over various values of by performing a series of fits with all the other theoretical and experimental setups identical to those of CT18 LO. Fig. 5 shows the value of of global fits while varying the value of . As shown in the figure, the best-fit value of is found to be around 0.135. Compared to the usual choice for most of the LO PDFs, a CT18 LO PDFs fit with could reduce the by 0.024, equivalent to about 84 units for total . A larger value of than 0.135 cannot lead to a better fit to the data sets. Accordingly, we decide to fix the value of to be 0.135 as input for the CT18 LO PDFs.
4 Phenomenology
In this section, we present the implication of the CT18 LO PDFs by comparing some LHC phenomenologies generated with CT18 LO and NLO PDFs. Specifically, for the differential distributions, we consider the experimental measurement of the charge asymmetry in -boson production at 8 TeV with the CMS detector. For the inclusive total cross-section, the prediction of the single-top production at 14 TeV is calculated. In these computations, the input physical parameters are set as follows:
| (3) |
4.1 Charge asymmetry in -boson production
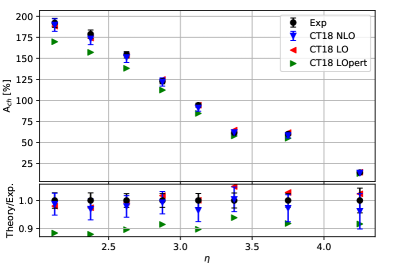
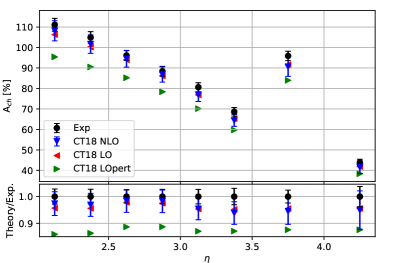
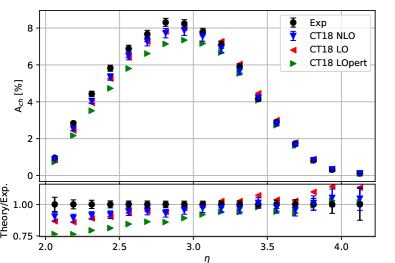
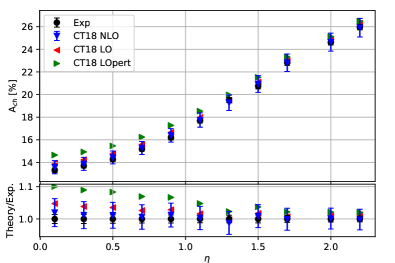
The difference between and production cross-sections via the Drell-Yan process is dominated by PDFs of incoming quarks. Hence, the rapidity asymmetry of the charged lepton from boson decay serves as a good observable to probe the ratio of parton luminosities. In Fig. 6, the comparison between predictions for ID 249 CMS muon charge asymmetry at 8 TeV CMS:2016qqr and experimental data points are shown, as a function of the pseudo-rapidity of muon from boson decay. The calculation of differential cross-sections rapidity distributions are performed with APPLgrid Carli:2010rw .
As shown in the left panel of Fig. 6, predictions by CT18 LO exhibits a different shape from the experimental data. For lower rapidity region, the CT18 LO predictions are about 5% higher than the measurements. For larger rapidity, the CT18 LO predictions for tends to be more consistent with measurements. While the CT18 LO predictions for muon charge asymmetry generally lies within the CT18 NLO uncertainty band over whole rapidity range, the CT18 LOpert prediction shows a worse agreement. This phenomenon indicates that the CT18 LO and NLO are consistent in the ratio of down and up antiquark PDFs, which can be directly observed in the right panel of Fig. 6, where the CT18 LO is mostly inside of CT18 NLO error band for the ratio of , except for the range where the CT18 LO is outside of CT18 NLO error band.
4.2 Single-top production
We select the calculation of total cross-section for the -channel inclusive single-top production as a representative process to study the implication of CT18 LO PDFs.
This process plays an important role in constraining the heavy quark PDF, and it has been measured at LHC ATLAS:2012byx ; ATLAS:2014sxe ; CMS:2011oen ; CMS:2012xhh ; ATLAS:2017rso ; CMS:2014mgj ; ATLAS:2016qhd ; CMS:2016lel ; CMS:2018lgn at various center-of-mass energies. The theoretical calculation of this process could serve as a test on the consistency in PDFs at different perturbation orders Sullivan:2017aiz ; Campbell:2021qgd , since the total inclusive cross-sections consistently predicted at different orders are all expected to reproduce the data. We make use of this property to illustrate the consistency of CT18 LO with CT18 NLO. In our calculation, the -channel inclusive single-top production cross-section is computed by MCFM Campbell:2010ff ; Boughezal:2016wmq ; Campbell:2015qma . For this calculation, the input parameters take the values as shown in Eq. 3, along with the renormalization and factorization scales chosen as , while the top mass is chosen to be consistent with the corresponding PDF sets.
Predictions for the -channel inclusive single-top production with a variety of PDFs are presented in Table 5. In general, due to the lack of higher-order corrections, the LO predictions for this process tend to be smaller than their corresponding NLO predictions. The CT18 LO prediction of single top quark production is slightly outside of the CT18 NLO uncertainty band, while for the single anti-top quark production the CT18 LO and CT18 NLO are well consistent. Comparing to CT14 LO predictions, the CT18 LO predictions to both top and anti-top production are enhanced substantially, and better consistent with its corresponding NLO fit.
| PDFs | [pb] | [pb] | [pb] | [pb] | |
|---|---|---|---|---|---|
| CT18 LO | 0.135 | 153.5 | 93.5 | - | - |
| CT18 NLO Hou:2019efy | 0.118 | - | - | 156.8 2.5 | 93.4 1.6 |
| CT14 LO Dulat:2015mca | 0.118 | 137.6 | 80.6 | - | - |
| CT14 NLO Dulat:2015mca | 0.118 | - | - | 157.0 3.3 | 93.2 1.9 |
| MSHT20 LO Bailey:2020ooq | 0.130 | 142.3 1.0 | 97.3 0.6 | - | - |
| MSHT20 NLO Bailey:2020ooq | 0.118 | - | - | 156.5 1.1 | 94.7 0.7 |
| NNPDF4.0 LO Ball:2021leu | 0.118 | 133.6 1.1 | 83.2 0.8 | - | - |
| NNPDF4.0 NLO Ball:2021leu | 0.118 | - | - | 155.1 0.9 | 93.7 0.5 |
| NNPDF3.1 LO NNPDF:2017mvq | 0.118 | 141.7 1.8 | 85.4 2.0 | - | - |
| NNPDF3.1 LO NNPDF:2017mvq | 0.130 | 153.5 1.8 | 92.6 1.6 | - | - |
| NNPDF3.1 NLO NNPDF:2017mvq | 0.118 | - | - | 155.2 1.2 | 93.4 0.7 |
| NNPDF3.0 LO NNPDF:2014otw | 0.118 | 149.1 13.1 | 90.5 8.5 | - | - |
| NNPDF3.0 LO NNPDF:2014otw | 0.130 | 159.4 7.7 | 96.6 5.1 | - | - |
| NNPDF3.0 NLO NNPDF:2014otw | 0.118 | - | - | 162.6 1.9 | 99.2 1.5 |
| HERAPDF20 LO H1:2015ubc | 0.130 | 154.6 0.8 | 92.1 0.7 | - | - |
| HERAPDF20 NLO H1:2015ubc | 0.118 | - | - | 162.5 0.9 | 96.5 0.7 |
5 Conclusion
In this paper, we present CT18 LO PDFs, which is obtained within the general framework of CT18 global analysis with extensions of two special treatments, as defined in Sec. 2.2. One is to discard some data sets, which cannot be properly described at LO (such as Drell-Yan data with different cuts on the transverse momemta of the two final state leptons), from the CT18 data set. The other is to apply a -factor to predictions for Drell-Yan processes for making up the insufficiency of LO predictions. As the result, the quality of the LO fit, cf. CT18 LO, is substantially improved from that of a naive LO fit, cf. CT18 LOpert. In CT18 LOpert, strange quark distributions are strongly impacted by the high-precision and production data from LHC Run-II era, as shown in Fig. 3, since LO Wilson coefficients cannot provide enough normalization to predictions to these precise measurements. The strong suppression on is relaxed in CT18 LO via the implementation of the Drell-Yan -factor, which supplies additional normalization to Drell-Yan processes. We have checked that CT18 LO PDFs is capable in generating numerical predictions close to CT18 NLO PDFs for the rapidity distribution of charge asymmetry in -boson production and the total cross-section of -channel inclusive single-top production. But still we should stress that the CT18 LO PDFs is different from CT18 NLO PDFs on many aspects, including the quality of fit, PDFs configurations, and the ability of describing experimental data. Therefore we would not suggest to use this result, CT18 LO, in analyses where precision is the dominant requirement. Since the LO PDF fits embed a huge theoretical uncertainty, we do not provide an error set for the CT18 LO PDFs.
The central CT18 LO PDFs in LHAPDF format Buckley:2014ana is publicly available:
Acknowledgements
PMN is partially supported by the U.S. Department of Energy under Grant No. DE-SC0010129. The work of CPY is partially supported by the U.S. National Science Foundation under Grant No. PHY- 2013791. CPY is also grateful for the support from the Wu-Ki Tung endowed chair in particle physics.
References
- (1) T.-J. Hou et al., “New CTEQ global analysis of quantum chromodynamics with high-precision data from the LHC,” Phys. Rev. D 103 no. 1, (2021) 014013, arXiv:1912.10053 [hep-ph].
- (2) S. Bailey, T. Cridge, L. A. Harland-Lang, A. D. Martin, and R. S. Thorne, “Parton distributions from LHC, HERA, Tevatron and fixed target data: MSHT20 PDFs,” Eur. Phys. J. C 81 no. 4, (2021) 341, arXiv:2012.04684 [hep-ph].
- (3) R. D. Ball et al., “The Path to Proton Structure at One-Percent Accuracy,” arXiv:2109.02653 [hep-ph].
- (4) T. Sjöstrand, S. Ask, J. R. Christiansen, R. Corke, N. Desai, P. Ilten, S. Mrenna, S. Prestel, C. O. Rasmussen, and P. Z. Skands, “An introduction to PYTHIA 8.2” Comput. Phys. Commun. 191 (2015) 159–177, arXiv:1410.3012 [hep-ph].
- (5) P. Nason, “A New method for combining NLO QCD with shower Monte Carlo algorithms,” JHEP 11 (2004) 040, arXiv:hep-ph/0409146.
- (6) A. D. Martin, W. J. Stirling, R. S. Thorne, and G. Watt, “Parton distributions for the LHC,” Eur. Phys. J. C 63 (2009) 189–285, arXiv:0901.0002 [hep-ph].
- (7) L. A. Harland-Lang, A. D. Martin, P. Motylinski, and R. S. Thorne, “Parton distributions in the LHC era: MMHT 2014 PDFs,” Eur. Phys. J. C 75 no. 5, (2015) 204, arXiv:1412.3989 [hep-ph].
- (8) H.-L. Lai, J. Huston, S. Mrenna, P. Nadolsky, D. Stump, W.-K. Tung, and C. P. Yuan, “Parton Distributions for Event Generators,” JHEP 04 (2010) 035, arXiv:0910.4183 [hep-ph].
- (9) S. Dulat, T.-J. Hou, J. Gao, M. Guzzi, J. Huston, P. Nadolsky, J. Pumplin, C. Schmidt, D. Stump, and C.-P. Yuan, “New parton distribution functions from a global analysis of quantum chromodynamics,” Phys. Rev. D93 no. 3, (2016) 033006, arXiv:1506.07443 [hep-ph].
- (10) H1, ZEUS Collaboration, H. Abramowicz et al., “Combination of measurements of inclusive deep inelastic scattering cross sections and QCD analysis of HERA data,” Eur. Phys. J. C 75 no. 12, (2015) 580, arXiv:1506.06042 [hep-ex].
- (11) ATLAS Collaboration, M. Aaboud et al., “Precision measurement and interpretation of inclusive , and production cross sections with the ATLAS detector,” Eur. Phys. J. C 77 no. 6, (2017) 367, arXiv:1612.03016 [hep-ex].
- (12) ATLAS Collaboration, G. Aad et al., “Measurement of the transverse momentum and distributions of Drell–Yan lepton pairs in proton–proton collisions at TeV with the ATLAS detector,” Eur. Phys. J. C 76 no. 5, (2016) 291, arXiv:1512.02192 [hep-ex].
- (13) CMS Collaboration, V. Khachatryan et al., “Measurement of the differential cross section and charge asymmetry for inclusive production at TeV,” Eur. Phys. J. C 76 no. 8, (2016) 469, arXiv:1603.01803 [hep-ex].
- (14) LHCb Collaboration, R. Aaij et al., “Measurement of the forward boson production cross-section in collisions at TeV,” JHEP 08 (2015) 039, arXiv:1505.07024 [hep-ex].
- (15) LHCb Collaboration, R. Aaij et al., “Measurement of forward production at TeV,” JHEP 05 (2015) 109, arXiv:1503.00963 [hep-ex].
- (16) LHCb Collaboration, R. Aaij et al., “Measurement of forward W and Z boson production in collisions at TeV,” JHEP 01 (2016) 155, arXiv:1511.08039 [hep-ex].
- (17) H1 Collaboration, A. Aktas et al., “Measurement of F2() and F2() at high using the H1 vertex detector at HERA,” Eur. Phys. J. C 40 (2005) 349–359, arXiv:hep-ex/0411046.
- (18) H1, ZEUS Collaboration, H. Abramowicz et al., “Combination and QCD Analysis of Charm Production Cross Section Measurements in Deep-Inelastic ep Scattering at HERA,” Eur. Phys. J. C 73 no. 2, (2013) 2311, arXiv:1211.1182 [hep-ex].
- (19) ATLAS Collaboration, G. Aad et al., “Measurement of the inclusive and Z/gamma cross sections in the electron and muon decay channels in collisions at TeV with the ATLAS detector,” Phys. Rev. D 85 (2012) 072004, arXiv:1109.5141 [hep-ex].
- (20) H1 Collaboration, F. D. Aaron et al., “Measurement of the Inclusive e\pmp Scattering Cross Section at High Inelasticity y and of the Structure Function ,” Eur. Phys. J. C 71 (2011) 1579, arXiv:1012.4355 [hep-ex].
- (21) BCDMS Collaboration, A. C. Benvenuti et al., “A High Statistics Measurement of the Deuteron Structure Functions F2 (X, ) and R From Deep Inelastic Muon Scattering at High ,” Phys. Lett. B 237 (1990) 592–598.
- (22) BCDMS Collaboration, A. C. Benvenuti et al., “A High Statistics Measurement of the Proton Structure Functions F(2) (x, Q**2) and R from Deep Inelastic Muon Scattering at High Q**2,” Phys. Lett. B 223 (1989) 485–489.
- (23) New Muon Collaboration, M. Arneodo et al., “Measurement of the proton and deuteron structure functions, F2(p) and F2(d), and of the ratio sigma-L / sigma-T,” Nucl. Phys. B 483 (1997) 3–43, arXiv:hep-ph/9610231.
- (24) J. P. Berge et al., “A Measurement of Differential Cross-Sections and Nucleon Structure Functions in Charged Current Neutrino Interactions on Iron,” Z. Phys. C 49 (1991) 187–224.
- (25) CCFR/NuTeV Collaboration, U.-K. Yang et al., “Measurements of and from CCFR Fe and Fe data in a physics model independent way,” Phys. Rev. Lett. 86 (2001) 2742–2745, arXiv:hep-ex/0009041.
- (26) W. G. Seligman et al., “Improved determination of alpha(s) from neutrino nucleon scattering,” Phys. Rev. Lett. 79 (1997) 1213–1216, arXiv:hep-ex/9701017.
- (27) D. A. Mason, Measurement of the strange-antistrange asymmetry at NLO in QCD from NuTeV dimuon data. PhD thesis, Oregon U., 2006.
- (28) NuTeV Collaboration, M. Goncharov et al., “Precise Measurement of Dimuon Production Cross-Sections in Fe and Fe Deep Inelastic Scattering at the Tevatron.,” Phys. Rev. D 64 (2001) 112006, arXiv:hep-ex/0102049.
- (29) CDF Collaboration, T. Aaltonen et al., “Measurement of the Inclusive Jet Cross Section at the Fermilab Tevatron p anti-p Collider Using a Cone-Based Jet Algorithm,” Phys. Rev. D 78 (2008) 052006, arXiv:0807.2204 [hep-ex]. [Erratum: Phys.Rev.D 79, 119902 (2009)].
- (30) D0 Collaboration, V. M. Abazov et al., “Measurement of the inclusive jet cross-section in collisions at =1.96-TeV,” Phys. Rev. Lett. 101 (2008) 062001, arXiv:0802.2400 [hep-ex].
- (31) CMS Collaboration, S. Chatrchyan et al., “Measurement of the Ratio of Inclusive Jet Cross Sections using the Anti- Algorithm with Radius Parameters R=0.5 and 0.7 in pp Collisions at TeV,” Phys. Rev. D 90 no. 7, (2014) 072006, arXiv:1406.0324 [hep-ex].
- (32) ATLAS Collaboration, G. Aad et al., “Measurement of the inclusive jet cross-section in proton-proton collisions at TeV using 4.5 1/fb of data with the ATLAS detector,” JHEP 02 (2015) 153, arXiv:1410.8857 [hep-ex]. [Erratum: JHEP 09, 141 (2015)].
- (33) CMS Collaboration, V. Khachatryan et al., “Measurement and QCD analysis of double-differential inclusive jet cross sections in pp collisions at TeV and cross section ratios to 2.76 and 7 TeV,” JHEP 03 (2017) 156, arXiv:1609.05331 [hep-ex].
- (34) CMS Collaboration, A. M. Sirunyan et al., “Measurement of double-differential cross sections for top quark pair production in pp collisions at TeV and impact on parton distribution functions,” Eur. Phys. J. C 77 no. 7, (2017) 459, arXiv:1703.01630 [hep-ex].
- (35) ATLAS Collaboration, G. Aad et al., “Measurements of top-quark pair differential cross-sections in the lepton+jets channel in collisions at TeV using the ATLAS detector,” Eur. Phys. J. C 76 no. 10, (2016) 538, arXiv:1511.04716 [hep-ex].
- (36) C. G. Callan, Jr. and D. J. Gross, “High-energy electroproduction and the constitution of the electric current,” Phys. Rev. Lett. 22 (1969) 156–159.
- (37) M. A. G. Aivazis, J. C. Collins, F. I. Olness, and W.-K. Tung, “Leptoproduction of heavy quarks. 2. A Unified QCD formulation of charged and neutral current processes from fixed target to collider energies,” Phys. Rev. D50 (1994) 3102–3118, arXiv:hep-ph/9312319 [hep-ph].
- (38) M. A. G. Aivazis, F. I. Olness, and W.-K. Tung, “Leptoproduction of heavy quarks. 1. General formalism and kinematics of charged current and neutral current production processes,” Phys. Rev. D50 (1994) 3085–3101, arXiv:hep-ph/9312318 [hep-ph].
- (39) M. Kramer, 1, F. I. Olness, and D. E. Soper, “Treatment of heavy quarks in deeply inelastic scattering,” Phys. Rev. D62 (2000) 096007, arXiv:hep-ph/0003035 [hep-ph].
- (40) W.-K. Tung, S. Kretzer, and C. Schmidt, “Open heavy flavor production in QCD: Conceptual framework and implementation issues,” J. Phys. G28 (2002) 983–996, arXiv:hep-ph/0110247 [hep-ph].
- (41) M. Guzzi, P. M. Nadolsky, H.-L. Lai, and C. P. Yuan, “General-Mass Treatment for Deep Inelastic Scattering at Two-Loop Accuracy,” Phys. Rev. D86 (2012) 053005, arXiv:1108.5112 [hep-ph].
- (42) J. Pumplin, D. R. Stump, J. Huston, H. L. Lai, P. M. Nadolsky, and W. K. Tung, “New generation of parton distributions with uncertainties from global QCD analysis,” JHEP 07 (2002) 012, arXiv:hep-ph/0201195.
- (43) H.-L. Lai, M. Guzzi, J. Huston, Z. Li, P. M. Nadolsky, J. Pumplin, and C. P. Yuan, “New parton distributions for collider physics,” Phys. Rev. D 82 (2010) 074024, arXiv:1007.2241 [hep-ph].
- (44) T. Carli, D. Clements, A. Cooper-Sarkar, C. Gwenlan, G. P. Salam, F. Siegert, P. Starovoitov, and M. Sutton, “A posteriori inclusion of parton density functions in NLO QCD final-state calculations at hadron colliders: The APPLGRID Project,” Eur. Phys. J. C 66 (2010) 503–524, arXiv:0911.2985 [hep-ph].
- (45) NNPDF Collaboration, R. D. Ball et al., “Parton distributions from high-precision collider data,” Eur. Phys. J. C 77 no. 10, (2017) 663, arXiv:1706.00428 [hep-ph].
- (46) Particle Data Group Collaboration, P. A. Zyla et al., “Review of Particle Physics,” PTEP 2020 no. 8, (2020) 083C01.
- (47) ATLAS Collaboration, G. Aad et al., “Measurement of the -channel single top-quark production cross section in collisions at TeV with the ATLAS detector,” Phys. Lett. B 717 (2012) 330–350, arXiv:1205.3130 [hep-ex].
- (48) ATLAS Collaboration, G. Aad et al., “Comprehensive measurements of -channel single top-quark production cross sections at TeV with the ATLAS detector,” Phys. Rev. D 90 no. 11, (2014) 112006, arXiv:1406.7844 [hep-ex].
- (49) CMS Collaboration, S. Chatrchyan et al., “Measurement of the -channel single top quark production cross section in collisions at TeV,” Phys. Rev. Lett. 107 (2011) 091802, arXiv:1106.3052 [hep-ex].
- (50) CMS Collaboration, S. Chatrchyan et al., “Measurement of the Single-Top-Quark -Channel Cross Section in Collisions at TeV,” JHEP 12 (2012) 035, arXiv:1209.4533 [hep-ex].
- (51) ATLAS Collaboration, M. Aaboud et al., “Fiducial, total and differential cross-section measurements of -channel single top-quark production in collisions at 8 TeV using data collected by the ATLAS detector,” Eur. Phys. J. C 77 no. 8, (2017) 531, arXiv:1702.02859 [hep-ex].
- (52) CMS Collaboration, V. Khachatryan et al., “Measurement of the t-channel single-top-quark production cross section and of the CKM matrix element in pp collisions at = 8 TeV,” JHEP 06 (2014) 090, arXiv:1403.7366 [hep-ex].
- (53) ATLAS Collaboration, M. Aaboud et al., “Measurement of the inclusive cross-sections of single top-quark and top-antiquark -channel production in collisions at = 13 TeV with the ATLAS detector,” JHEP 04 (2017) 086, arXiv:1609.03920 [hep-ex].
- (54) CMS Collaboration, A. M. Sirunyan et al., “Cross section measurement of -channel single top quark production in pp collisions at 13 TeV,” Phys. Lett. B 772 (2017) 752–776, arXiv:1610.00678 [hep-ex].
- (55) CMS Collaboration, A. M. Sirunyan et al., “Measurement of the single top quark and antiquark production cross sections in the channel and their ratio in proton-proton collisions at 13 TeV,” Phys. Lett. B 800 (2020) 135042, arXiv:1812.10514 [hep-ex].
- (56) Z. Sullivan, “Are PDFs still consistent with Tevatron data?,” EPJ Web Conf. 172 (2018) 03008, arXiv:1711.04018 [hep-ph].
- (57) J. Campbell, T. Neumann, and Z. Sullivan, “Testing parton distribution functions with t-channel single-top-quark production,” Phys. Rev. D 104 no. 9, (2021) 094042, arXiv:2109.10448 [hep-ph].
- (58) J. M. Campbell and R. K. Ellis, “MCFM for the Tevatron and the LHC,” Nucl. Phys. B Proc. Suppl. 205-206 (2010) 10–15, arXiv:1007.3492 [hep-ph].
- (59) R. Boughezal, J. M. Campbell, R. K. Ellis, C. Focke, W. Giele, X. Liu, F. Petriello, and C. Williams, “Color singlet production at NNLO in MCFM,” Eur. Phys. J. C 77 no. 1, (2017) 7, arXiv:1605.08011 [hep-ph].
- (60) J. M. Campbell, R. K. Ellis, and W. T. Giele, “A Multi-Threaded Version of MCFM,” Eur. Phys. J. C 75 no. 6, (2015) 246, arXiv:1503.06182 [physics.comp-ph].
- (61) NNPDF Collaboration, R. D. Ball et al., “Parton distributions for the LHC Run II,” JHEP 04 (2015) 040, arXiv:1410.8849 [hep-ph].
- (62) A. Buckley, J. Ferrando, S. Lloyd, K. Nordström, B. Page, M. Rüfenacht, M. Schönherr, and G. Watt, “LHAPDF6: parton density access in the LHC precision era,” Eur. Phys. J. C 75 (2015) 132, arXiv:1412.7420 [hep-ph].