Coherent Control of Evanescent Waves via Beam Shaping
Abstract
Evanescent waves are central to many technologies such as near-field imaging that beats the diffraction limit and plasmonic devices. Frustrated total internal reflection (FTIR) is an experimental method commonly used to study evanescent waves. In this paper, we shape the incident beam of the FTIR process with a Mach-Zehnder interferometer and measure light transmittance while varying the path length difference and interferometric visibility. Our results show that the transmittance varies with the path length difference and, thus, the intensity distribution of the shaped beam. Experiment and finite element method simulation produce results that agree. We also show, through simulations, that the transmittance can be controlled via other methods of beam shaping. Our work provides a proof-of-concept demonstration of the coherent control of the FTIR process, which could lead to advancements in numerous applications of evanescent waves and FTIR.
,
-
October 2022
1 Introduction
Evanescent waves are inhomogeneous waves resulting from the continuity of the electric field under the conditions of total internal reflection (TIR). TIR occurs when a light wave propagates from an optically denser medium into one of lower density and the incidence angle is greater than the critical angle. Under such conditions, the electric field decays exponentially into the medium with lower optical density while the evanescent wave propagates parallel to the interface and, on average, no energy is carried across the interface. The penetration depth of the decaying field is on the order of magnitude of the wavelength of the incident light wave. The decaying field can be coupled into a third, optically dense medium to induce a forward-propagating wave by placing said medium after the TIR interface such that the distance between the two interfaces is close to the penetration depth. When this happens, energy may flow through the two interfaces into the third medium in what is known as frustrated total internal reflection (FTIR) [1]. FTIR is commonly used in the study of evanescent waves.
Evanescent waves and FTIR have been known and studied since the formulation of Maxwell’s equations more than 150 years ago. Traditionally, evanescent waves were considered to be elusive and merely a by-product of TIR. However, with technological advances in lasers, nano-scale fabrication, and photonics, evanescent waves and FTIR have been found useful in several different fields of study. The invention of the near-field scanning optical microscope [2, 3, 4], breaking the diffraction limit, utilized and bettered our understanding of FTIR. Other applications include near field sensing [5], non-radiative energy transfer through the Förster process [6], and manipulation of particles using near-field photonic forces [7]. Recent studies in near-field optics have shown that evanescent waves can carry transverse spin angular momentum [8, 9, 10], leading to the photonic quantum spin Hall effect [11, 12, 13]. Evanescent waves of vector beams and non-paraxial beams have also been subjects of interest due to their potential applications in photonics and sensing [14, 15, 16, 17]. More notably, FTIR is considered to be a close analogy to quantum tunneling [18, 19, 20], the further study of which may give us insight into both classical optics and quantum mechanics.
In this paper, we shape the incident beam with the interference pattern from a Mach-Zehnder interferometer (MZI). We measure the transmittance of the induced forward-propagating wave while varying the path length difference between the two arms of the MZI and the interferometric visibility. We find that the transmittance can be enhanced or suppressed depending on the phase difference between the waves in the incident interference pattern. We show, through simulation, that this control of the transmittance comes from beam shaping of the incident beam. Our results serve as a proof-of-principle demonstration for the coherent control of FTIR. Enhancement of the FTIR transmittance could improve the sensitivity of spectroscopy and imaging techniques based on evanescent waves and FTIR. More accurate control of the FTIR transmittance could also lead to advancements in plasmonics technology based on the photonic quantum spin Hall effect [21, 22, 23, 24, 25]. Previously, controlling and shaping the evanescent field by metamaterials has been proposed and demonstrated [26].
2 Experimental measurement
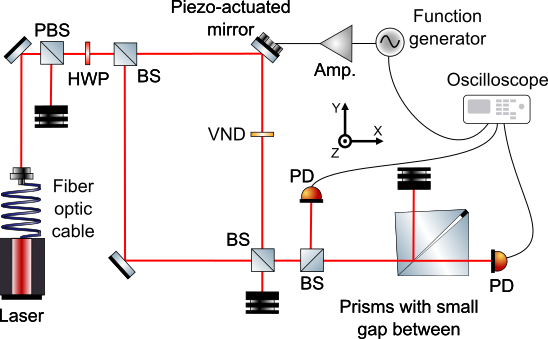
Figure 1 shows our experimental setup for FTIR with an interference pattern from a MZI as incident light. Two large, glass, uncoated prisms are clamped together with a small aluminum foil shim, allowing for pressure to be concentrated in a small area and the separation between the prisms to be on the order of tens of micrometers [27]. The incidence angle into the hypotenuse of the first prism is greater than the critical angle () and TIR occurs between the first prism and the air gap. The exponentially decaying field of the evanescent wave is coupled into the second prism to produce a forward-propagating wave via FTIR. The optical path lengths from the final beamsplitter to the two photodetectors are made to be equal. We verify that we are in fact observing FTIR by translating the incidence beam in the -direction, which corresponds to a linear increase in the air gap width. This results in an exponential decay of the total intensity on the output side of the FTIR prisms as the air gap width increases, which confirms FTIR.
The incidence light into the FTIR prisms is an interference pattern between two overlapping Gaussian beams in a MZI. A piezoelectric steering mirror is placed in one arm to change the path length difference between the two arms. The interferometric visibility, defined as
| (1) |
where and are the respective maximum and minimum intensity of the output of the MZI as the path length difference changes from 0 to , can be varied by attenuating one arm of the MZI with a variable neutral density filter. We are able to obtain a maximum interferometric visibility of in our experiment. We measured the transmittance of energy of the FTIR process, defined as the ratio of the total transmitted intensity to the total incident intensity of the FTIR prisms, of both -polarized and -polarized incidence light.
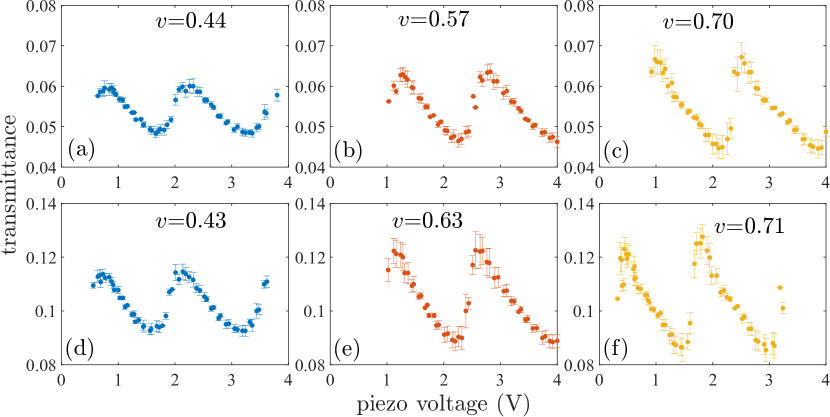
We experimentally measure the transmittance of the FTIR process with the interference pattern from a MZI as the incident beam using the setup shown in figure 1. The transmittance is the ratio of the total intensity of the forward-propagating wave to the total incident intensity. We measure the transmittance while varying the voltage on the piezoelectric driver for different incident polarizations and interferometric visibility. In the experimental setup, the varying piezo voltage leads to varying path-length difference in the two arms of the MZI, which ultimately results in different intensity profiles of the interference pattern incident on the FTIR prisms. Figure 2 shows the experimentally measured transmittance. These measurements show it is possible to change the transmittance by varying the phase difference between the two beams that make up the incident interference pattern. Another point of interest to note is that -polarized incident light has a higher transmittance for the same phase difference and visibility than -polarized incident light. We notice that there appears to be a small shift in the x-axis between different trials. This is not due to a phase sift, but rather due to the nature of our method of varying phase with a piezo motor. The zero point of the piezo does not necessarily reset to the same phase for every trial, producing this artifact. We compare these measurements to the simulation results obtained in the next section.
3 Simulation
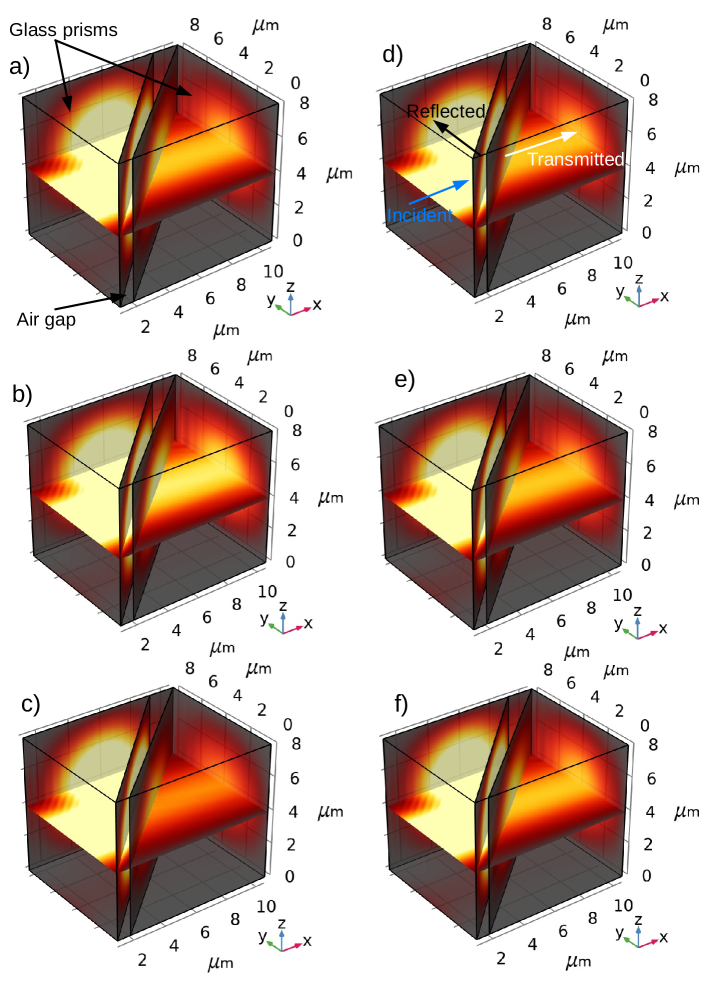
We use the COMSOL Wave Optics [28] software to simulate the measurements done with the experimental setup shown in figure 1. In the simulation, the light propagates in the -direction through two glass prisms that have refractive index and that are separated by an air gap as displayed in figure 3 (a). We chose to use a wavelength nm and set the prisms to measure 8 µm 8 µm 8 µm so that the simulations could be run in a reasonable amount of time. The beams were set to have a waist size µm to reduce the presence of boundary effects in our results. The prisms were also oriented so that the thickness of the air gap was one on one side of the system and on the other. For all of our simulations, the hypotenuse of the first prism is set to make a 45∘ angle with the -axis so that the incident angle is greater than the critical angle () of the FTIR process.
The surface plots of the norm of the electric field in figure 3 are generated by simulating the propagation of two Gaussian beams with offset optical axes and a phase difference between them through our two prism setup. The offset was chosen to be small, but non-zero to reflect the fact that the beams cannot be perfectly aligned in the experiment. In figure 3 (a)-(c), the beams are offset in the -direction by 0.04 µm, while in figure 3 (d)-(f), they are offset in the -direction by 0.04 µm. In figure 3, the phase difference between the two incident beams is zero for (a) and (d), for (b) and (e), and for (c) and (f). The plots in figure 3 show that the phase difference between the two incident beams affect the forward-propagating wave only when they are offset in the -direction, not when they are offset in the -direction. The intuition behind this phenomenon is that the two incident beam travel through different optical path lengths in the first prism before arriving at the air gap when they are offset in the -direction, but they see the same optical path length when they are offset in the -direction.
We then want to investigate the dependence of transmittance on all values of the phase difference and the interferometric visibility . Since FTIR is a linear optics phenomena, we can do this by first simulating the propagation of a single Gaussian beam and a single shifted beam separately and then add the results together to obtain the total field
| (2) |
where is the phase difference between the beams and is a coefficient that allows us to tune the amplitude of , leading to a change in . For these simulations, the offset between and is 0.04 µm in the -direction.
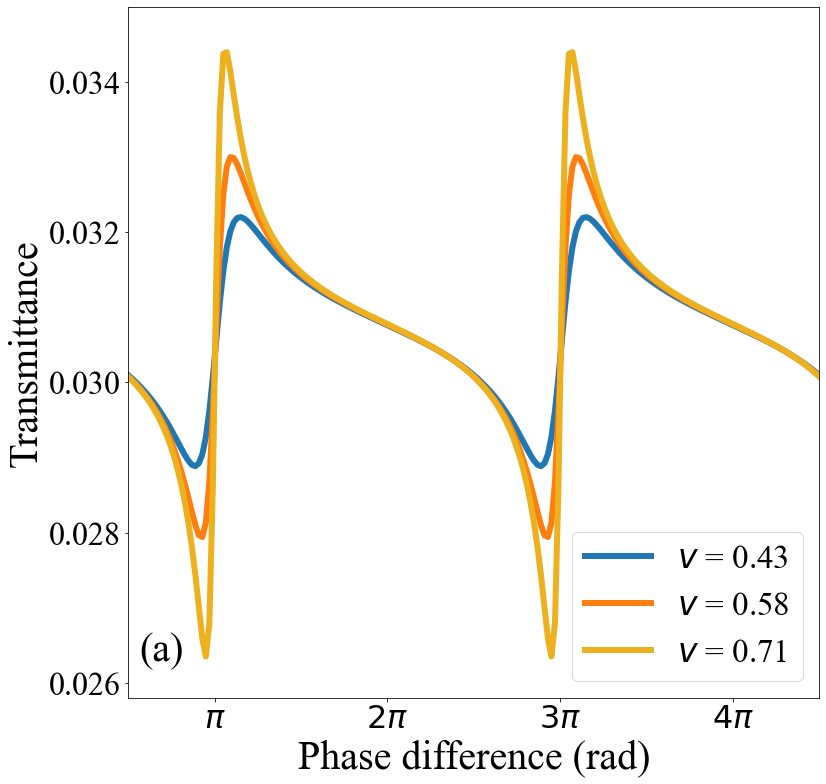
This approach is used to obtain results when and are -polarized and -polarized. Figure 4 shows the simulated results. Here, the transmittance is the ratio of the total intensity of the forward-propagating wave to the total intensity of the incident waves. The simulation results shown in figure 4 has a qualitative agreement with the experimental measurements shown in figure 2. In both the simulation and experiment, -polarized incident light has a higher transmittance for the same phase difference and visibility. The difference between the simulation and experiment is mainly due to the different wavelength and geometry of the prisms used in the simulation to speed up calculations. Both experimental measurement and simulation result show that it is possible to modulate the transmittance in FTIR by varying the phase difference and higher visibility increases the range of this modulation.
| 0.090 | 0.084 | 0.076 | |
| 0.203 | 0.193 | 0.177 | |
| 0.303 | 0.292 | 0.273 |
The previous simulations suggest that the transmittance in the FTIR process could be controlled by beam shaping of the incident beam. To confirm that other methods of beam shaping can be used to control this process, we simulate the propagation of single Hermite-Gauss beams through our two-prism setup. The Hermite-Gauss modes were chosen because the nodes that occur in the beam profile as one moves to higher order modes resemble the offsets between beams that were used in our previous simulations. Table 1 shows the transmittance obtained by simulating the propagation of a single Hermite-Gauss beam through the FTIR prisms for mode indices ranging from 0 to 2. These results show that for any given -mode index, the transmittance is larger for a larger -mode index. In contrast, it is also clear that for any given -mode index, the transmittance is smaller for a larger -mode index. This confirms that control of evanescence is more generally a beam shaping phenomenon.
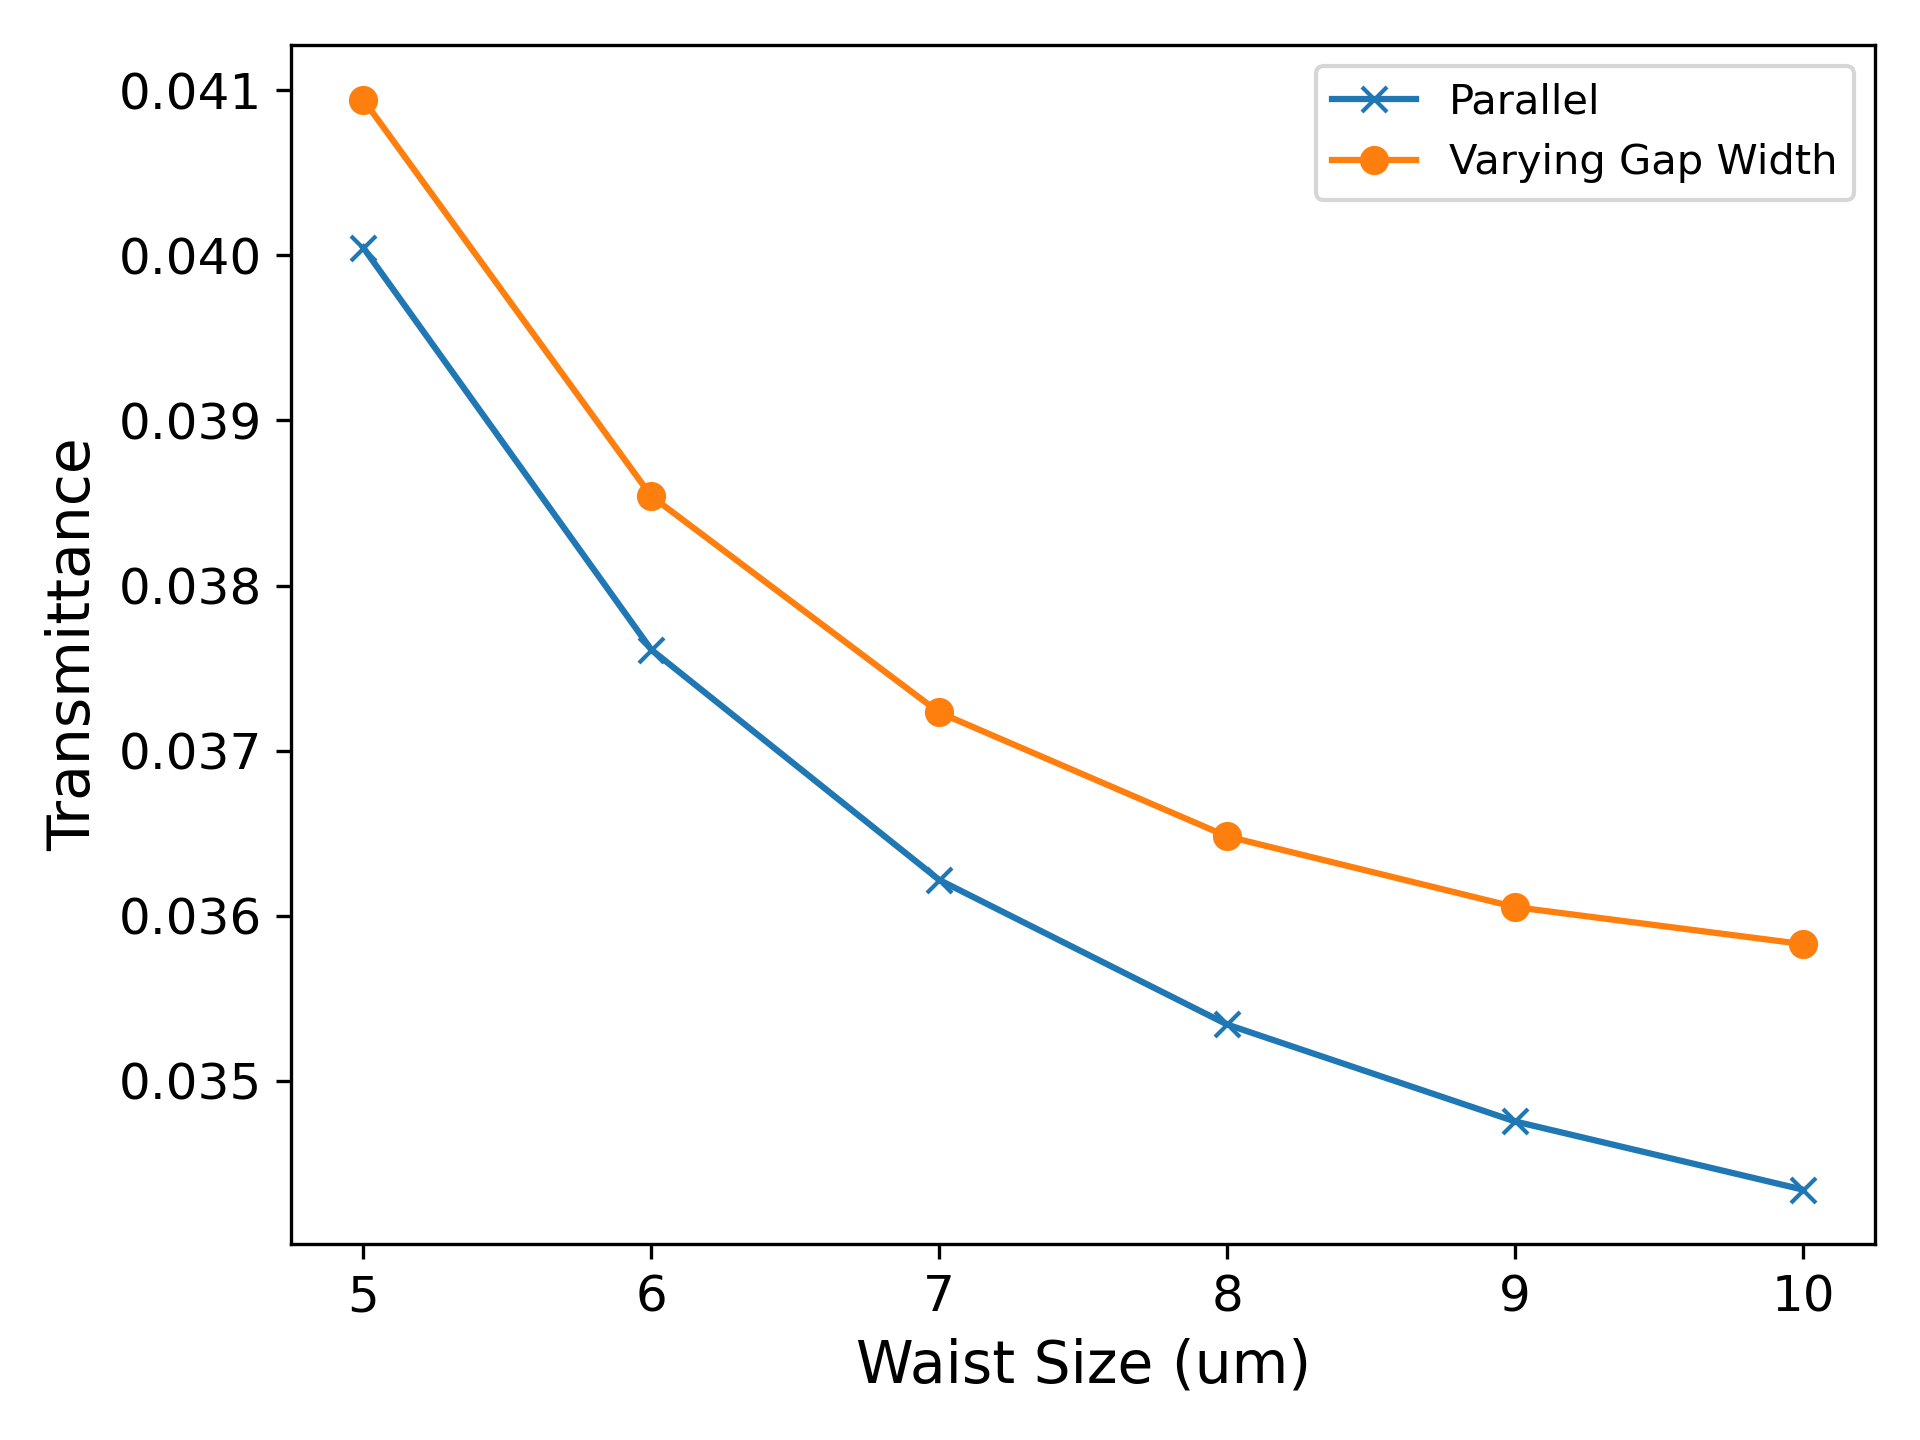
As another confirmation that control of evanescence is achieved by beam shaping, we consider the simplest case of beam shaping - changing the waist size of a Gaussian beam. We then simulate the propagation of a single Gaussian beam with different waist sizes through the FTIR prisms. In this simulation, the wavelength is nm and the size of the prisms are changed to 60 µm. We consider two different orientations of the prisms. In the first case, the prisms are oriented so that their hypotenuses are parallel and separated by an air gap that is 1.5 thick. In the second case, they are oriented so that the thickness of the air gap varies from on one end to 2 on the other, same as that in the simulations in figure 3. The second case is closer to our experimental setup shown in figure 1. We would like to see if such a varying gap width has an effect on the FTIR process by comparing these two cases. Figure 5 shows the transmittance of the Gaussian beam with different waist sizes for both cases. In figure 5, the transmittance decreases monotonically as the waist size increases and this general trend is the same for both orientation of the prisms. These results suggest that the varying gap width has no major effect on the behavior of the transmittance.
To develop a better intuition for why the transmittance of evanescent waves can be controlled by changing the beam shape, we consider the form of a Gaussian beam propagating in the -direction and polarized in the -direction
| (3) |
where is the initial amplitude, is the waist size of the beam, is the radius of the beam at x, is the radial distance from the optical axis, is the wavenumber, is the radius of curvature of the wavefront, and is the Guoy phase. The Rayleigh range
| (4) |
relates , , and to in the following ways:
| (5) |
| (6) |
| (7) |
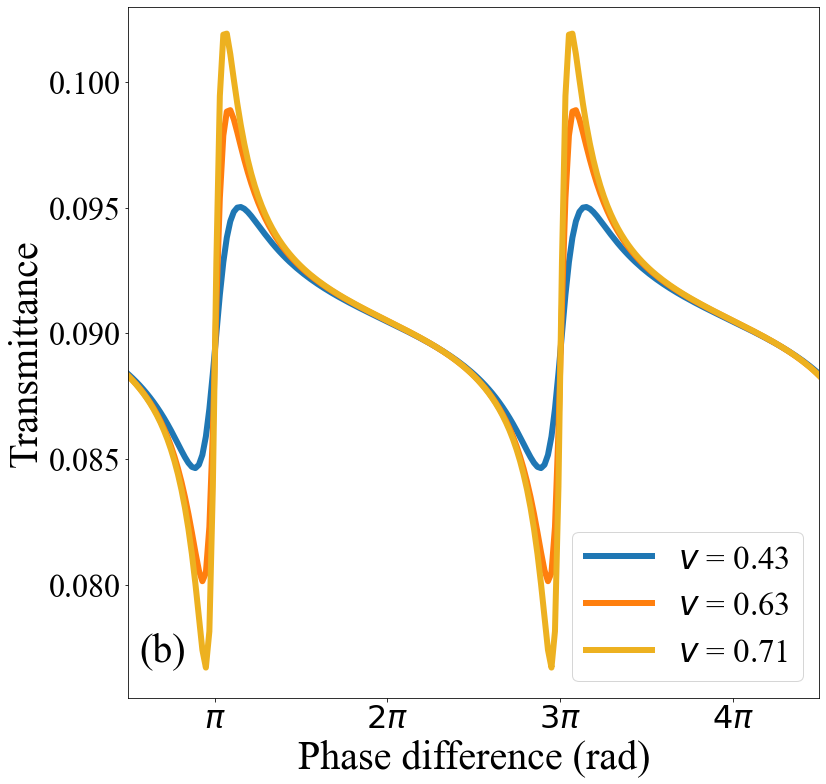
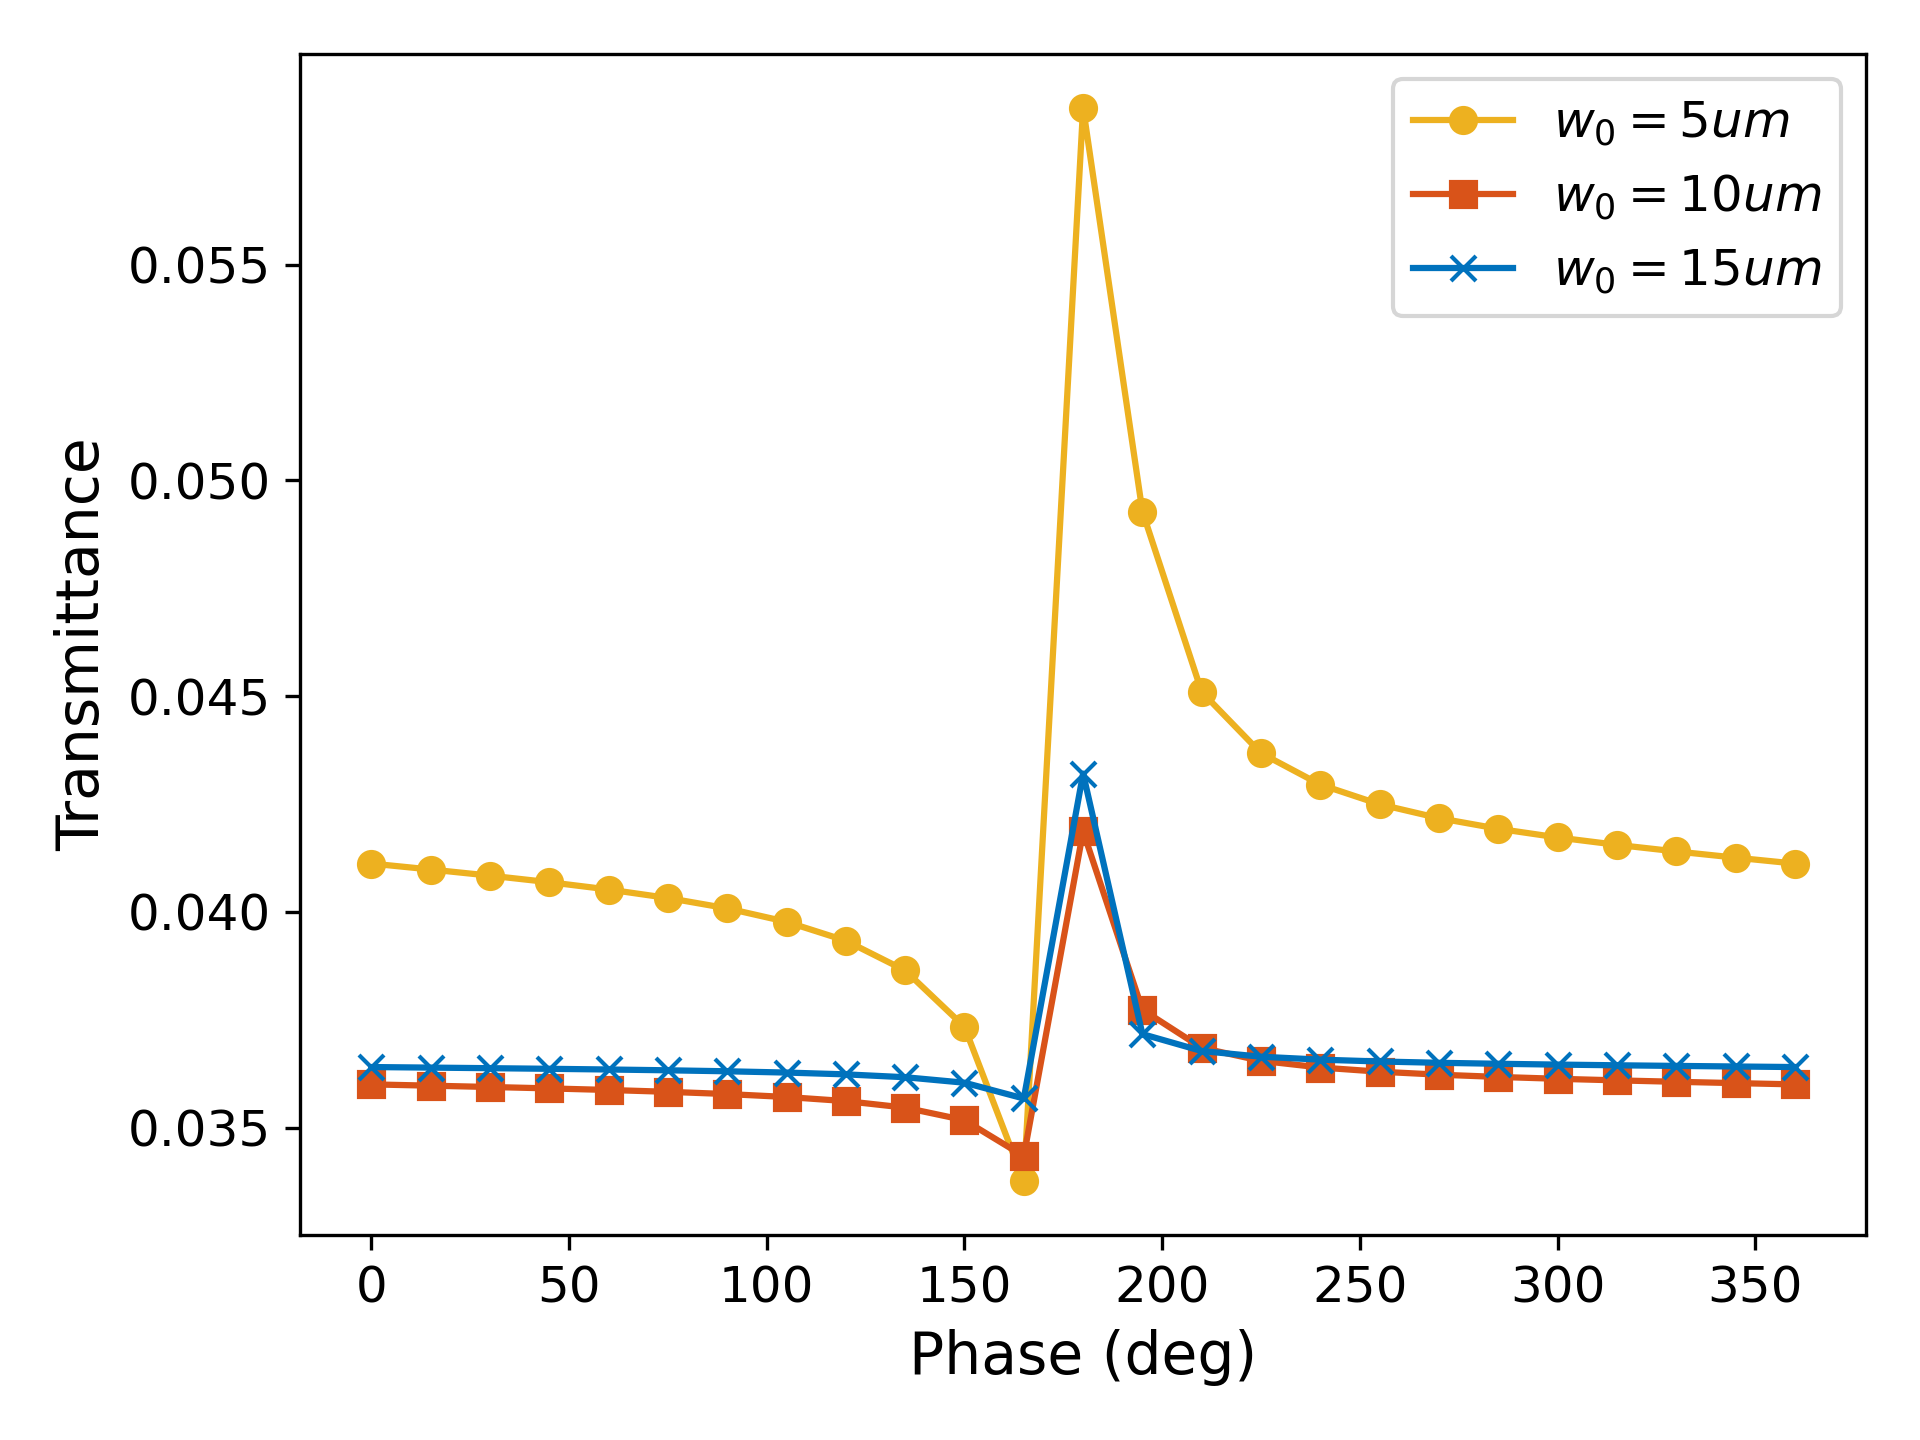
Now if , we see that , , , and . This leaves us with a regular plane wave, which doesn’t allow for controlling the transmittance of evanescent waves. Thus, it appears that controlling evanescence by changing the beam shape depends on the waist size of the beam. We tested this by simulating the propagation of two Gaussian beams through the FTIR prisms in 2D as the phase difference between the beams is changed. We repeat this for different values of , though in each case both beams have the same . In the simulation, nm and the beams are offset by 0.2 µm. The prisms are 60 µm x 60 µm and are oriented so that the air gap has thickness on one edge and thickness 2 on the other. The transmittance of the beams is plotted against the phase difference between them for the cases µm, µm, and µm in figure 6. The curve for the µm case is very similar to the results in figure 4, but the curve flattens out as is increased. This confirms that the ability to modulate evanescence by changing the shape of the beam depends on the beam’s waist size. In particular, a smaller allows for greater modulation.
4 Discussion
We measured the transmittance of energy in an FTIR process with an interference pattern as incident light. Both experimental measurement and simulation result show that the transmittance can be controlled depending on the intensity profile of the incident beam. We also show, through simulation, that the transmittance can be controlled by other means of beam shaping. Our results suggest that more sophisticated designs of coherent control of the FTIR process can be devised. This effect, to the best of our knowledge, have not been previously observed and shows promise for applications where FTIR is utilized, such as near-field sensing [5] and non-radiative energy transfer [6].
Funding
U. S. Office of Naval Research (N000141912374); Defense Advanced Research Projects Agency (D19AP00043); U.S. Army Research Office (W911NF-19-1-0377).
Acknowledgments
This material is based upon research supported by, or in part by, the U. S. Office of Naval Research under award number N000141912374. This work was also supported by the Defense Advanced Research Projects Agency (DARPA) grant number D19AP00043 under mentorship of Dr. Joseph Altepeter. D.I.B. is also supported by the U.S. Army Research Office (ARO) under grant W911NF-19-1-0377. The views and conclusions contained in this document are those of the authors and should not be interpreted as representing the official policies, either expressed or implied, of DARPA, ONR, ARO, or the U.S. Government. The U.S. Government is authorized to reproduce and distribute reprints for Government purposes notwithstanding any copyright notation herein.
Disclosures
The authors declare no conflicts of interest.
Data availability
Data underlying the results presented in this paper are not publicly available at this time but may be obtained from the authors upon reasonable request.
References
References
- [1] Hecht E 2015 Optics 5th ed (Pearson) ISBN 978-0-13-397722-6
- [2] Pohl D W, Denk W and Lanz M 1984 Applied Physics Letters 44 651–653 ISSN 0003-6951, 1077-3118
- [3] Betzig E, Trautman J K, Harris T D, Weiner J S and Kostelak R L 1991 Science 251 1468–1470 ISSN 0036-8075, 1095-9203
- [4] Reddick R C, Warmack R J and Ferrell T L 1989 Physical Review B 39 767–770 ISSN 0163-1829
- [5] Novotny L and Hecht B 2006 Principles of Nano-Optics (Cambridge: Cambridge University Press)
- [6] Andrew P and Barnes W L 2000 Science 290 785–788
- [7] Richards D, Zayats A, Nieto-Vesperinas M, Chaumet P C and Rahmani A 2004 Philosophical Transactions of the Royal Society of London. Series A: Mathematical, Physical and Engineering Sciences 362 719–737
- [8] Marrucci L 2015 Nature Physics 11 9–10 ISSN 1745-2473, 1745-2481
- [9] Bliokh K Y, Rodríguez-Fortuño F J, Nori F and Zayats A V 2015 Nature Photonics 9 796–808 ISSN 1749-4893
- [10] Aiello A, Banzer P, Neugebauer M and Leuchs G 2015 Nature Photonics 9 789–795 ISSN 1749-4885, 1749-4893
- [11] Bliokh K Y, Bekshaev A Y and Nori F 2014 Nature Communications 5 3300 ISSN 2041-1723
- [12] Bliokh K Y, Smirnova D and Nori F 2015 Science 348 1448–1451 ISSN 0036-8075, 1095-9203
- [13] Van Mechelen T and Jacob Z 2016 Optica 3 118 ISSN 2334-2536
- [14] Shchegrov A V and Carney P S 1999 JOSA A 16 2583–2584 ISSN 1520-8532
- [15] Frederique de Fornel 2001 Evanescent Waves: From Newtonian Optics to Atomic Optics 1st ed Springer Series in Optical Sciences (Heidelberg: Springer Berlin) ISBN 978-3-642-08513-0
- [16] Helseth L 2010 Optics Communications 283 29–33 ISSN 00304018
- [17] Chen R P and Li G 2013 Optics Express 21 22246 ISSN 1094-4087
- [18] Zhu S, Yu A W, Hawley D and Roy R 1986 American Journal of Physics 54 601–607 (Preprint https://doi.org/10.1119/1.14514) URL https://doi.org/10.1119/1.14514
- [19] Enders A and Nimtz G 1993 Phys. Rev. E 48(1) 632–634 URL https://link.aps.org/doi/10.1103/PhysRevE.48.632
- [20] Hupert J J 1975 Applied Physics 6 131–149
- [21] Mittal S, Orre V V, Leykam D, Chong Y and Hafezi M 2019 Physical Review Letters 123 043201
- [22] Dai Y and Petek H 2019 ACS Photonics 6 2005–2013
- [23] Wan R G and Zubairy M S 2020 Physical Review A 101 033837
- [24] Bahari B, Hsu L, Pan S H, Preece D, Ndao A, El Amili A, Fainman Y and Kanté B 2021 Nature Physics 17 700–703 ISSN 1745-2481
- [25] Liu J, Liu J, Li X, Li X, Tao J, Tao J, Dong D, Dong D, Liu Y, Liu Y, Liu Y, Fu Y and Fu Y 2021 Optics Letters 46 2537–2540 ISSN 1539-4794
- [26] Ginis V, Piccardo M, Tamagnone M, Lu J, Qiu M, Kheifets S and Capasso F 2020 Science 369 436–440 ISSN 0036-8075, 1095-9203
- [27] Vörös Z and Johnsen R 2008 American Journal of Physics 76 746–749 ISSN 0002-9505, 1943-2909
- [28] COMSOL Multiphysics ®v. 6.0. COMSOL AB, Stockholm, Sweden URL www.comsol.com