A new look at local ultraluminous infrared galaxies: the atlas and radiative transfer models of their complex physics
Abstract
We present the ultraviolet to submillimetre spectral energy distributions (SEDs) of the HERschel Ultra Luminous Infrared Galaxy Survey (HERUS) sample of 42 local Ultraluminous Infrared Galaxies (ULIRGs) and fit them with a Markov chain Monte Carlo (MCMC) code using the CYprus models for Galaxies and their NUclear Spectra (CYGNUS) radiative transfer models for starbursts, active galactic nucleus (AGN) tori and host galaxy. The Spitzer IRS spectroscopy data are included in the fitting. Our bayesian SED fitting method takes comparable time to popular energy balance methods but it is more physically motivated and versatile. All HERUS galaxies harbor high rates of star formation but we also find bolometrically significant AGN in all of the galaxies of the sample. We estimate the correction of the luminosities of the AGN in the ULIRGs due to the anisotropic emission of the torus and find that it could be up to a factor of for nearly edge-on tori. We present a comparison of our results with the smooth torus model of Fritz et al. and the two-phase models of Siebenmorgen et al. and SKIRTOR. We find that the CYGNUS AGN torus models fit significantly better the SEDs of our sample compared to all other models. We find no evidence that strong AGN appear either at the beginning or end of a starburst episode or that starbursts and AGN affect each other. IRAS 01003-2238 and Mrk 1014 show evidence for dual AGN in their SED fits suggesting a minimum dual AGN fraction in the sample of 5%.
keywords:
quasars: general – galaxies: active – galaxies: interactions – infrared: galaxies – submillimetre: galaxies – radiative transfer1 Introduction
Local Ultraluminous Infrared Galaxies (ULIRGs), with infrared luminosities exceeding are an important population in their own right as they are the most luminous galaxies in the local Universe. ULIRGs also allow us to study in detail the role of mergers in triggering extreme star formation and active galactic nucleus (AGN) activity which is deeply obscured by dust. They are therefore important laboratories for understanding these processes in order to aid the interpretation of observations of similar events which took place in the most luminous galaxies in the history of the Universe such as hyperluminous infrared galaxies (Rowan-Robinson et al., 1993; Rowan-Robinson, 2000; Verma et al., 2002; Farrah et al., 2002; Efstathiou, 2006), submillimetre galaxies (Hughes et al., 1998; Barger et al., 1998; Efstathiou & Rowan-Robinson, 2003; Casey et al., 2014; Rowan-Robinson et al., 2018), quasars, and Hot Dust Obscured Galaxies (Hot DOGs; Eisenhardt et al. 2012; Bridge et al. 2013; Farrah et al. 2017; Efstathiou et al. 2021). For these and other reasons ULIRGs have received a lot of attention since their discovery by the Infrared Astronomical Satellite (IRAS) in the 1980s (Houck et al., 1985; Soifer et al., 1986). Excellent reviews of observational and theoretical work are given in Sanders & Mirabel (1996), Lonsdale et al. (2006), and more recently Perez-Torres et al. (2021).
| ID | IRAS | Other | RA | Dec | z | Opt. | Maximum Likelihoods | |||
|---|---|---|---|---|---|---|---|---|---|---|
| Name | Names | Class | CYGNUS | F06 | S15 | SKIRTOR | ||||
| 1 | 00188-0856 | — | 5.360507 | -8.657217 | 0.128 | LINER | -459.7 | -467.7 | -519.9 | -567.3 |
| 2 | 00397-1312 | — | 10.564704 | -12.934122 | 0.262 | HII | -485.5 | -342.5 | -1093.6 | -848.9 |
| 3 | 01003-2238 | — | 15.708365 | -22.365895 | 0.118 | HII | -137.6 | -1227.6 | -125.7 | -1074.0 |
| 4 | 03158+4227 | — | 49.801667 | 42.641111 | 0.134 | Sy2 | -262.8 | -702.0 | -291.9 | -973.9 |
| 5 | 03521+0028 | — | 58.675800 | 0.617611 | 0.152 | LINER | -196.5 | -373.3 | -199.8 | -402.8 |
| 6 | 05189-2524 | — | 80.255800 | -25.362600 | 0.043 | Sy2 | -97.2 | -260.8 | -63.3 | -339.8 |
| 7 | 06035-7102 | — | 90.725042 | -71.052833 | 0.079 | HII | -126.9 | -158.4 | -223.1 | -188.2 |
| 8 | 06206-6315 | — | 95.255042 | -63.289861 | 0.092 | Sy2 | -213.6 | -302.4 | -229.8 | -379.7 |
| 9 | 07598+6508 | — | 121.137833 | 64.996833 | 0.148 | Sy1 | -33.9 | -26.5 | -181.4 | -33.4 |
| 10 | 08311-2459 | — | 128.335833 | -25.159361 | 0.100 | Sy1 | -111.8 | -275.3 | -82.7 | -300.5 |
| 11 | 08572+3915 | — | 135.105792 | 39.065111 | 0.058 | Sy2 | -218.6 | -618.5 | -1365.0 | -1353.1 |
| 12 | 09022-3615 | — | 136.052961 | -36.450274 | 0.060 | HII | -138.5 | -189.8 | -145.6 | -164.4 |
| 13 | 10378+1109 | — | 160.121539 | 10.888415 | 0.136 | LINER | -182.8 | -237.4 | -164.2 | -370.6 |
| 14 | 10565+2448 | — | 164.825493 | 24.542905 | 0.043 | HII | -322.9 | -512.7 | -363.5 | -493.1 |
| 15 | 11095-0238 | — | 168.014071 | -2.906219 | 0.107 | LINER | -187.1 | -773.2 | -547.7 | -983.2 |
| 16 | 12071-0444 | — | 182.438049 | -5.020490 | 0.128 | Sy2 | -177.8 | -643.3 | -168.6 | -662.0 |
| 17 | 13120-5453 | — | 198.776494 | -55.156452 | 0.031 | Sy2 | -349.0 | -503.4 | -343.4 | -508.9 |
| 18 | 13451+1232 | 4C 12.50 | 206.889007 | 12.290067 | 0.122 | Sy2 | -107.3 | -524.5 | -87.6 | -671.4 |
| 19 | 14348-1447 | — | 219.410000 | -15.005556 | 0.083 | LINER | -119.7 | -233.0 | -153.6 | -299.9 |
| 20 | 14378-3651 | — | 220.245867 | -37.075538 | 0.068 | Sy2 | -279.1 | -581.0 | -255.2 | -602.9 |
| 21 | 15250+3609 | — | 231.747517 | 35.977092 | 0.055 | HII | -370.5 | -854.7 | -595.7 | -1198.3 |
| 22 | 15462-0450 | — | 237.236721 | -4.992669 | 0.100 | Sy1 | -174.7 | -104.4 | -54.6 | -193.5 |
| 23 | 16090-0139 | — | 242.918469 | -1.785156 | 0.134 | LINER | -185.5 | -284.5 | -230.7 | -290.2 |
| 24 | 17208-0014 | — | 260.841481 | -0.283594 | 0.043 | HII | -452.6 | -620.9 | -461.0 | -601.8 |
| 25 | 19254-7245 | SuperAntena | 292.839167 | -72.655000 | 0.062 | Sy2 | -165.3 | -134.5 | -125.8 | -195.2 |
| 26 | 19297-0406 | — | 293.088544 | -3.998962 | 0.086 | HII | -179.3 | -265.9 | -186.9 | -340.0 |
| 27 | 20087-0308 | — | 302.849458 | -2.997417 | 0.106 | LINER | -333.2 | -343.5 | -386.3 | -352.2 |
| 28 | 20100-4156 | — | 303.373083 | -41.793028 | 0.130 | HII | -511.7 | -542.4 | -605.0 | -721.8 |
| 29 | 20414-1651 | — | 311.075888 | -16.671172 | 0.087 | HII | -199.7 | -367.5 | -195.0 | -292.7 |
| 30 | 20551-4250 | ESO 286-19 | 314.611589 | -42.650056 | 0.043 | HII | -198.3 | -581.2 | -433.6 | -922.9 |
| 31 | 22491-1808 | — | 342.955267 | -17.873183 | 0.078 | HII | -188.8 | -534.9 | -208.1 | -607.2 |
| 32 | 23128-5919 | ESO 148-2 | 348.944790 | -59.054320 | 0.045 | HII | -208.2 | -573.4 | -205.3 | -517.3 |
| 33 | 23230-6926 | — | 351.515083 | -69.171889 | 0.107 | LINER | -298.4 | -662.7 | -389.8 | -836.7 |
| 34 | 23253-5415 | AM 2325-541 | 352.025417 | -53.975278 | 0.130 | LINER | -190.9 | -612.1 | -141.5 | -688.8 |
| 35 | 23365+3604 | — | 354.755305 | 36.352308 | 0.064 | LINER | -274.9 | -898.9 | -276.3 | -936.6 |
| 36 | 09320+6134 | UGC 5101 | 143.964981 | 61.353182 | 0.039 | LINER | -475.7 | -548.2 | -520.2 | -558.4 |
| 37 | 12540+5708 | Mrk 231 | 194.059308 | 56.873677 | 0.042 | Sy1 | -49.7 | -67.8 | -46.8 | -186.7 |
| 38 | 13428+5608 | Mrk 273 | 206.175463 | 55.886847 | 0.037 | Sy2 | -218.0 | -288.8 | -262.2 | -411.6 |
| 39 | 13536+1836 | Mrk 463 | 209.011963 | 18.372078 | 0.049 | Sy2 | -141.2 | -150.0 | -161.1 | -122.4 |
| 40 | 15327+2340 | Arp 220 | 233.738563 | 23.503139 | 0.018 | Sy2 | -1099.8 | -1938.0 | -868.3 | -2143.5 |
| 41 | 16504+0228 | NGC 6240 | 253.245295 | 2.400926 | 0.024 | LINER | -257.1 | -380.8 | -280.0 | -484.1 |
| 42 | 01572+0009 | Mrk 1014 | 29.959214 | 0.394615 | 0.163 | Sy1 | -483.5 | -425.6 | -96.3 | -536.9 |
The HERschel Ultra Luminous Infrared Galaxy Survey (HERUS) consisted of observations with the Herschel Space Observatory (Pilbratt et al., 2010) of the 42 most luminous ULIRGs in the local Universe in spectroscopy and photometry mode. Farrah et al. (2013) and Spoon et al. (2013) discussed the diagnostics provided by PACS spectroscopy and Pearson et al. (2016) discussed the corresponding diagnostics from SPIRE spectroscopy. Efstathiou et al. (2014) presented a detailed study of IRAS 08572+3915 which exhibits one of the deepest silicate absorption features observed in a galaxy. Clements et al. (2018) presented the SPIRE photometry of the HERUS galaxies.
As ULIRGs are deeply obscured by dust, radiative transfer models for both the starburst and AGN activity are needed for interperting their SEDs. Rowan-Robinson & Efstathiou (1993) presented the first such models for the local ULIRG population and fitted the SED of the prototypical ULIRG Arp 220. They showed that the SED of Arp 220 could be explained by a starburst model which was a factor of four more optically thick than the model for the starbursts in M 82 and NGC 1068 presented in the same paper. They also argued on the basis of fitting the IRAS colours that all ULIRGs in the IRAS Bright Galaxy sample (Sanders et al., 2003) required a similar higher optical depth starburst model to explain the far-infrared emission. Rigopoulou et al. (1996) fitted the SEDs of the first ULIRGs to be detected in the submillimetre with the Rowan-Robinson & Efstathiou (1993) models and arrived at similar conclusions. Farrah et al. (2003) carried out for the first time starburst/AGN de-composition of the near to far-infared SEDs of a sample of 41 local ULIRGs using the starburst library of Efstathiou et al. (2000) and the AGN torus models of Efstathiou & Rowan-Robinson (1995). They concluded from this study that whereas most of the luminosity in local ULIRGs is due to starburst activity in about half of the sample there was significant emission from an AGN. Vega et al. (2008) fitted a sample of ULIRGs and Luminous Infrared Galaxies (LIRGs; ) with the GRASIL models (Silva et al., 1998) reaching a similar conclusion. Efstathiou et al. (2014) de-composed the SED of the deep-silicate ULIRG IRAS 08572+3915 concluding that its emission is dominated by an obscured AGN with its torus viewed almost edge-on.
| Parameter | Symbol | Range | Comments |
|---|---|---|---|
| CYGNUS Starburst | |||
| Initial optical depth of giant molecular clouds | 50-250 | Efstathiou et al. (2000), Efstathiou & Siebenmorgen (2009) | |
| Starburst star formation rate e-folding time | 10-30Myr | Incorporates Bruzual & Charlot (1993, 2003) | |
| Starburst age | 5-35Myr | metallicity=solar, Salpeter Initial Mass Function (IMF) | |
| Standard galactic dust mixture with PAHs | |||
| CYGNUS Spheroidal Host | |||
| Spheroidal star formation rate e-folding time | 0.125-8Gyr | Efstathiou & Rowan-Robinson (2003), Efstathiou et al. (2021) | |
| Starlight intensity | 1-17 | Incorporates Bruzual & Charlot (1993, 2003) | |
| Optical depth | 0.1-15 | metallicity=40% of solar, Salpeter IMF | |
| Standard galactic dust mixture with PAHs | |||
| CYGNUS AGN torus | |||
| Torus equatorial UV optical depth | 250-1450 | Smooth tapered discs | |
| Torus ratio of outer to inner radius | 20-100 | Efstathiou & Rowan-Robinson (1995), Efstathiou et al. (2013) | |
| Torus half-opening angle | 30-75° | Standard galactic dust mixture without PAHs | |
| Torus inclination | 0-90° | ||
| Fritz AGN torus | |||
| Torus equatorial optical depth at 9.7 | 0.1-10 | Smooth flared discs | |
| Torus ratio of outer to inner radius | 10-150 | Fritz et al. (2006) | |
| Torus half-opening angle | 20-70° | Standard galactic dust mixture without PAHs | |
| Torus inclination | 0-90° | ||
| SKIRTOR AGN torus | |||
| Torus equatorial optical depth at 9.7 | 3-11 | Two-phase flared discs | |
| Torus ratio of outer to inner radius | 10-30 | Stalevski et al. (2012), Stalevski et al. (2016) | |
| Torus half-opening angle | 20-70° | Standard galactic dust mixture without PAHs | |
| Torus inclination | 0-90° | ||
| Siebenmorgen15 AGN torus | |||
| Cloud volume filling factor (%) | 1.5-77.7 | Two-phase anisotropic spheres | |
| Optical depth of the individual clouds | 0-45 | Siebenmorgen et al. (2015) | |
| Optical depth of the disk mid-plane | 0-1000 | Fluffy dust mixture without PAHs | |
| Inclination | 0-90° |
| Physical Quantity | Symbol |
|---|---|
| Observed AGN torus Luminosity | |
| Corrected AGN torus Luminosity | |
| Polar dust AGN Luminosity | |
| Starburst Luminosity | |
| Spheroidal host Luminosity | |
| Total observed Luminosity | |
| Total corrected Luminosity | |
| Starburst SFR (averaged over 50Myr) | |
| Starburst SFR (averaged over SB age) | |
| Spheroidal SFR | |
| Total SFR | |
| Starburst Stellar Mass | |
| Spheroidal Stellar Mass | |
| Total Stellar Mass | |
| AGN fraction | |
| Anisotropy correction factor |
| ID | L | L | LSb | Lhost | L | L | A() |
|---|---|---|---|---|---|---|---|
| L⊙ | L⊙ | L⊙ | |||||
| 1 | |||||||
| 2 | |||||||
| 3 | |||||||
| 4 | |||||||
| 5 | |||||||
| 6 | |||||||
| 7 | |||||||
| 8 | |||||||
| 9 | |||||||
| 10 | |||||||
| 11 | |||||||
| 12 | |||||||
| 13 | |||||||
| 14 | |||||||
| 15 | |||||||
| 16 | |||||||
| 17 | |||||||
| 18 | |||||||
| 19 | |||||||
| 20 | |||||||
| 21 | |||||||
| 22 | |||||||
| 23 | |||||||
| 24 | |||||||
| 25 | |||||||
| 26 | |||||||
| 27 | |||||||
| 28 | |||||||
| 29 | |||||||
| 30 | |||||||
| 31 | |||||||
| 32 | |||||||
| 33 | |||||||
| 34 | |||||||
| 35 | |||||||
| 36 | |||||||
| 37 | |||||||
| 38 | |||||||
| 39 | |||||||
| 40 | |||||||
| 41 | |||||||
| 42 | |||||||
This is the first of two papers which present a new look at local ULIRGs which is based on detailed models of their SEDs from the ultraviolet to the submillimetre. In this paper (Paper A) we assemble the SEDs of the 42 local ULIRGs that constitute the HERUS sample and fit them with multi-component radiative transfer models. In paper B (Farrah et al. 2021) we present a detailed analysis of the results.
Our approach has three novel features compared to previous studies. The first novelty of this work is that we fit the ultraviolet to submillimetre SEDs of ULIRGs exclusively with radiative transfer models. The models constitute three libraries which describe the starburst, AGN and host galaxy components. These three libraries are part of the collection of radiative transfer models named CYprus models for Galaxies and their NUclear Spectra (CYGNUS)111The models are publicly available at https://arc.euc.ac.cy/cygnus/. We have used extensively the starburst and AGN libraries for almost three decades to fit the SEDs of a broad range of galaxies (Rowan-Robinson et al., 1993; Rowan-Robinson & Efstathiou, 1993; Efstathiou & Rowan-Robinson, 1995; Efstathiou & Siebenmorgen, 2005; Efstathiou, 2006; Efstathiou et al., 2013, 2021; Rowan-Robinson et al., 1997; Hughes et al., 1998; Alexander et al., 1999; Rowan-Robinson, 2000; Ruiz et al., 2001; Alonso-Herrero et al., 2001, 2003; Verma et al., 2002; Farrah et al., 2002, 2003, 2012, 2017; Mattila et al., 2012, 2018; Lonsdale et al., 2015; Herrero-Illana et al., 2017; Pitchford et al., 2019). To these two well-tested libraries we added a third library of ‘spheroidal’ models which represent the host galaxy in which the starburst and AGN reside (Efstathiou et al., 2021). This library which is an evolution of the ‘cirrus’ models of Efstathiou & Rowan-Robinson (2003) self-consistently takes into account the absorption of starlight and reemission by interstellar dust in a spheroidal geometry. As we discuss below our approach to use a library for the spheroidal component instead of running the model ‘on the fly’ during the fitting (e.g. as with GRASIL, see also discussion by Johnson et al. 2013) speeds up considerably the fitting.
| ID | M∗ | Age | ||||||||
|---|---|---|---|---|---|---|---|---|---|---|
| M⊙ | M⊙yr-1 | yr | ||||||||
| 1 | ||||||||||
| 2 | ||||||||||
| 3 | ||||||||||
| 4 | ||||||||||
| 5 | ||||||||||
| 6 | ||||||||||
| 7 | ||||||||||
| 8 | ||||||||||
| 9 | ||||||||||
| 10 | ||||||||||
| 11 | ||||||||||
| 12 | ||||||||||
| 13 | ||||||||||
| 14 | ||||||||||
| 15 | ||||||||||
| 16 | ||||||||||
| 17 | ||||||||||
| 18 | ||||||||||
| 19 | ||||||||||
| 20 | ||||||||||
| 21 | ||||||||||
| 22 | ||||||||||
| 23 | ||||||||||
| 24 | ||||||||||
| 25 | ||||||||||
| 26 | ||||||||||
| 27 | ||||||||||
| 28 | ||||||||||
| 29 | ||||||||||
| 30 | ||||||||||
| 31 | ||||||||||
| 32 | ||||||||||
| 33 | ||||||||||
| 34 | ||||||||||
| 35 | ||||||||||
| 36 | ||||||||||
| 37 | ||||||||||
| 38 | ||||||||||
| 39 | ||||||||||
| 40 | ||||||||||
| 41 | ||||||||||
| 42 | ||||||||||
The second novelty of our approach is that we feed the three libraries into the Markov Chain Monte Carlo (MCMC) code SATMC (Johnson et al., 2013) to get the best fit. The output of SATMC is then post-processed by our own routines to get the luminosities of all components, star formation rates (SFRs) and stellar masses for the starburst and spheroid separately, AGN fraction, Core-collapse supernova rate and their errors. The fit of a single galaxy takes about 10-15 minutes. This is comparable to the time needed by popular energy balance methods such as MAGPHYS (da Cunha et al., 2008) and CIGALE (Noll et al., 2009; Boquien et al., 2019). The advantage of our method is that the model is more physically motivated and versatile as additional components (e.g. polar dust, a second AGN or a second starburst) can very easily be added to the model. We give examples of this in the paper. We therefore foresee numerous applications of this method for the analysis of the rich datasets of ULIRGs and LIRGs at all redshifts which have been accumulated by multi-wavelength surveys such as H-ATLAS (Eales et al., 2010) and HerMES (Oliver et al., 2012), projects such as the Herschel Extragalactic Legacy Project (HELP) (Shirley et al., 2019), and projects which will be made possible in the near future with facilities such as ALMA, JWST and Euclid.
The third novelty of the method used in this paper is that we include in the SED de-composition the Spitzer IRS spectroscopy at a resolution which is matched to the resolution of the radiative transfer models. PAH features give an indication of star formation activity (Peeters et al., 2002) whereas silicate absorption features constrain the degree of obscuration in either the starburst or AGN torus (Spoon et al., 2007). According to most torus models silicate emission and absorption also constrain the inclination of the torus which as we show in the paper is one of the main factors that determine the intrinsic luminosity of the AGN. Including the spectroscopy in the SED fitting is therefore particularly important for breaking the degeneracy in the fits and constraining the starburst, host and AGN properties.
This paper is organized as follows: In section 2 we describe the sample and in section 3 the data we assembled. In section 4 we describe the models and the SED de-composition method. In section 5 we present our results with the CYGNUS models and compare results for six representative ULIRGs from four different torus models, CYGNUS, the models from Fritz et al. (2006), SKIRTOR (Stalevski et al., 2016) and Siebenmorgen et al. (2015). In sections 6, 7 and 8 we discuss further our results and finally in section 9 we present our conclusions.
Throughout this work, we assume km s-1 Mpc-1, , and .
2 Sample Selection
We start with the sample of ULIRGs observed by the HERschel Ultra Luminous Infrared Galaxy Survey (HERUS) carried out by the Herschel Space Observatory. This sample comprises all 40 ULIRGs from the IRAS PSC-z survey (Saunders et al., 2000) with 60m fluxes greater than 2Jy, together with three randomly selected ULIRGs with lower 60m fluxes; IRAS 00397-1312 (1.8 Jy), IRAS 07598+6508 (1.7 Jy) and IRAS 13451+1232 (1.9 Jy). We then exclude 3C 273 as it is a Blazar, to give a sample of 42 objects (Table 1). Strictly speaking this sample is not complete, but it includes nearly all known ULIRGs at , and so should give an almost unbiased benchmark of local ULIRGs. All 42 objects were observed by the Infrared Spectrograph (IRS, Houck et al. 2004) on board Spitzer and by Herschel as part of both HERUS and the SHINING survey (Fischer et al., 2010; Sturm et al., 2011; Hailey-Dunsheath et al., 2012; González-Alfonso et al., 2013).
3 Data
To assemble the SEDs of the galaxies fitted in this paper we combined data available from the literature and various archives. For all the HERUS galaxies there are Spitzer/IRS data which we downloaded from CASSIS (Lebouteiller et al., 2011). We do not use the IRS data in their full resolution but we reduce their spectral resolution so that they are matched to the spectral resolution of the radiative transfer models. In particular, the IRS data included in the fit with SATMC have a wavelength grid which is separated in steps of 0.05 in the log of the rest wavelength. We also add additional points around the 9.7 silicate feature and the PAH features to the equally spaced wavelength grid. We find that with this approach we maintain the constraining power of the data but make the fitting of the multi-wavelength SED feasible with current methods.
To extend the wavelength coverage of the SEDs from the ultraviolet to the submillimetre we added to the IRS data the HERUS SPIRE photometry (Pearson et al., 2016; Clements et al., 2018) and IRAS data for all the galaxies and where available, GALEX, Pan-STARRS, 2MASS, Spitzer/IRAC and SCUBA or other infrared and submillimetre data. Apart from the Pan-STARRS data all of these data were extracted from the NASA Extragalactic Database (NED) or directly from the 2MASS archive. For IRAS 03158+4227 we used optical data from SDSS. Where available we added to the SEDs the PACS continuum data from Farrah et al. (2013).
For seven of the ULIRGs that are included in the GOALS (Armus et al., 2009) sample (IRAS 05189-2524, IRAS 14348-1447, IRAS 15250+3608, IRAS 22491-1808, Arp 220, Mrk 231, Mrk 273, UGC 5101) we also added the optical photometry from U et al. (2012). For Arp 220, IRAS 08572+3915 and IRAS 10565+2448, we find that the optical photometry is more homogeneous if we use the SDSS data.
4 Modelling
4.1 The CYGNUS models
The available photometry and spectroscopy has been fitted with the MCMC code SATMC (Johnson et al., 2013) using libraries of radiative transfer models for star formation, AGN activity, and host galaxy emission. These are part of the CYprus models for Galaxies and their NUclear Spectra (CYGNUS) project. CYGNUS includes models for starbursts as described in Efstathiou et al. (2000) and Efstathiou & Siebenmorgen (2009). Models for massive star formation and starbursts were also presented and discussed in Rowan-Robinson & Crawford (1989); Rowan-Robinson & Efstathiou (1993); Efstathiou & Rowan-Robinson (1994); Krügel & Siebenmorgen (1994); Silva et al. (1998); Takagi et al. (2003); Dopita et al. (2005); Siebenmorgen & Krügel (2007). The starburst model parameters and their assumed ranges are: the age of the starburst (Myr), the giant molecular clouds’ (GMC’s) initial optical depth , the time constant of the exponentially decaying star formation rate (SFR) Myr.
The method employed for computing the libraries of spheroidal host galaxy models of CYGNUS is an evolution of the ‘cirrus’ model of Efstathiou & Rowan-Robinson (2003) and is described in more detail in Efstathiou et al. (2021) and Efstathiou (in preparation). The models of Bruzual & Charlot (1993, 2003) are used in combination with an assumed star formation history (SFH) to compute the spectrum of starlight which is illuminating the dust throughout the model galaxy. The spectrum of starlight is assumed to be constant throughout the galaxy but its intensity varies throughout the galaxy according to a Sérsic profile with which is equivalent to de Vaucouleurs’s law. Efstathiou & Rowan-Robinson (2003) assumed an exponentially decaying SFH whereas here we assume a delayed exponential (), where is the e-folding time of the exponential.
The parameters assumed by the spheroidal model and their assumed ranges are: the e-folding time of the delayed exponential Gyr, the optical depth of the spherical cloud from its centre to its surface and which controls the bolometric intensity of stellar emission relative to that of the bolometric intensity of starlight in the solar neighborhood. The library used in this paper was computed assuming all the galaxies have an age equal to the age of the Universe at a redshift of . We assumed that all the stars in the galaxy formed with a Salpeter IMF out of gas with a metallicity of 40% of solar.
There exist a wide variety of AGN obscurer models in the literature with different assumptions about the obscurer geometry (Pier & Krolik, 1993; Rowan-Robinson et al., 1993; Granato & Danese, 1994; Efstathiou & Rowan-Robinson, 1995; Nenkova et al., 2002; Dullemond & van Bemmel, 2005; Fritz et al., 2006; Hönig et al., 2006; Nenkova et al., 2008; Schartmann et al., 2008; Heymann & Siebenmorgen, 2012; Stalevski et al., 2012, 2016; Efstathiou et al., 2013; Siebenmorgen et al., 2015; Hönig & Kishimoto, 2017). We therefore explored the impact of four different AGN models:
-
1.
The CYGNUS AGN torus model. More details of the implementation of this combination of models within SATMC are given in Efstathiou et al. (2021). A number of results with this combination of models in the MCMC code SATMC have previously been presented (Herrero-Illana et al., 2017; Kool et al., 2018; Mattila et al., 2018; Pitchford et al., 2019; Efstathiou et al., 2021; Kankare et al., 2021).
-
2.
The AGN torus model of Fritz et al. (2006), hereafter FR06.
-
3.
The two-phase AGN torus model SKIRTOR of Stalevski et al. (2016).
-
4.
The two-phase AGN torus model of Siebenmorgen et al. (2015).
The CYGNUS AGN model parameters and their assumed ranges are the half-opening angle of the torus (), the inclination of the torus (), the ratio of outer to inner disc radius () and the equatorial optical depth at 1000Å (; for the dust model used in Efstathiou & Rowan-Robinson (1995) this translates to an and ). All the models assume that the density distribution in the tapered disc falls off with distance from the supermassive black hole as . In addition we explore for some objects the impact of adding a component of polar dust in the fits. This is discussed further in section 5.5.
For the CYGNUS combination we therefore have a total of 14 free parameters in the fits: , , , , , , , , , , , , , . The last four are scaling factors that determine the luminosities of the starburst, AGN, spheroidal and polar dust components respectively. The parameters of all models used in this work are also listed in Table 2 together with a summary of other useful information.
4.2 The Fritz et al. and SKIRTOR AGN torus models
The FR06 model assumes a smooth torus as in Efstathiou & Rowan-Robinson (1995). The models are available in a public library222https://www.irya.unam.mx/gente/j.fritz/JFhp/AGN_models.html. The FR06 model has two more parameters than the CYGNUS model. We use the subset of the library that results by fixing the two parameters that determine the density distribution within the torus in the radial direction () and polar direction (). This gives the same number of free parameters as the CYGNUS AGN torus model. The four parameters are the equatorial optical depth at 9.7, the ratio of outer to inner radius, the half-opening angle of the torus and the inclination plus the scaling factor. For these parameters we use the full range available in the library. For the FR06 combination we also have a total of 14 free parameters in the fits. It is important to note that the FR06 models have a lower resolution in inclination compared to the CYGNUS model, with 10 angles covering the range degrees. We linearly interpolate the models between these values to obtain the same resolution we have in CYGNUS.
The SKIRTOR model assumes a two-phase geometry, i.e. it assumes that the torus dust lies in discrete clouds that are embedded in a smooth distribution. The SKIRTOR models are also available in a public library333https://sites.google.com/site/skirtorus/. As in the case of the FR06 models we selected the subset of the library by fixing the parameters that describe the density distribution in the torus in the radial direction () and polar direction (). The parameter takes four discrete values in the library (0, 0.5, 1 and 1.5). As we discuss later in the paper the main problem with these models is that they do not produce deep enough silicate absorption features to fit the SEDs of the ULIRGs in this sample. Assuming a value for leads to AGN torus spectra with shallower silicate absorption features and therefore worse fits with these models. We have four remaining free parameters in the SKIRTOR model which are the same as those in the FR06 model. For these parameters we also use the full range available in the library. For the SKIRTOR combination we also have a total of 14 free parameters in the fits. The SKIRTOR models also has 10 inclinations that cover the range so again we linearly interpolate the templates to have the same resolution as in the CYGNUS fits.
4.3 The Siebenmorgen et al. models
As in the case of the SKIRTOR models, the Siebenmorgen et al. (2015) models also assume a two-phase geometry and they are computed with a Monte Carlo radiative transfer code. The models are available in a public library444http://www.eso.org/~rsiebenm/agn_models/index.html. A particular feature of the Siebenmorgen models is that the opening angle of the torus is not a parameter of the model. This model is in that respect similar to the smooth ‘anisotropic sphere’ model of Efstathiou & Rowan-Robinson (1995) which was used to fit the SED of IRASF 10214+4724 (Rowan-Robinson et al., 1993). Another feature of the model is that it assumes that the dust grains are fluffy and have higher emissivity in the far-infrared and submillimeter compared to normal interstellar grains. The model assumes the following parameters: The cloud volume filling factor, the optical depth (in the V band) of the individual clouds, the optical depth (in the V band) of the disk mid-plane and the inclination which takes 9 values corresponding to bins at 86, 80, 73, 67, 60, 52, 43, 33, and 19 degrees measured from the pole. As in the case of the SKIRTOR and Fritz models we interpolate the models to have the same resolution in inclination as the CYGNUS model. The model also has as a parameter the inner radius of the dusty torus. We select the value of cm which for an AGN luminosity of gives a temperature at the inner torus radius of about 1000K. Our fits with the Siebenmorgen models also have a total of 14 free parameters.
5 Results
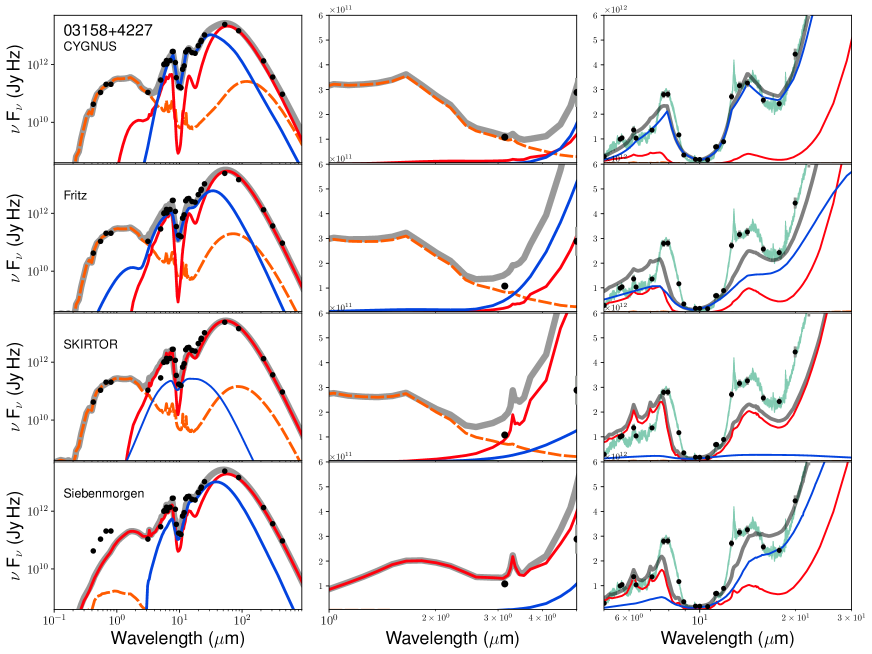
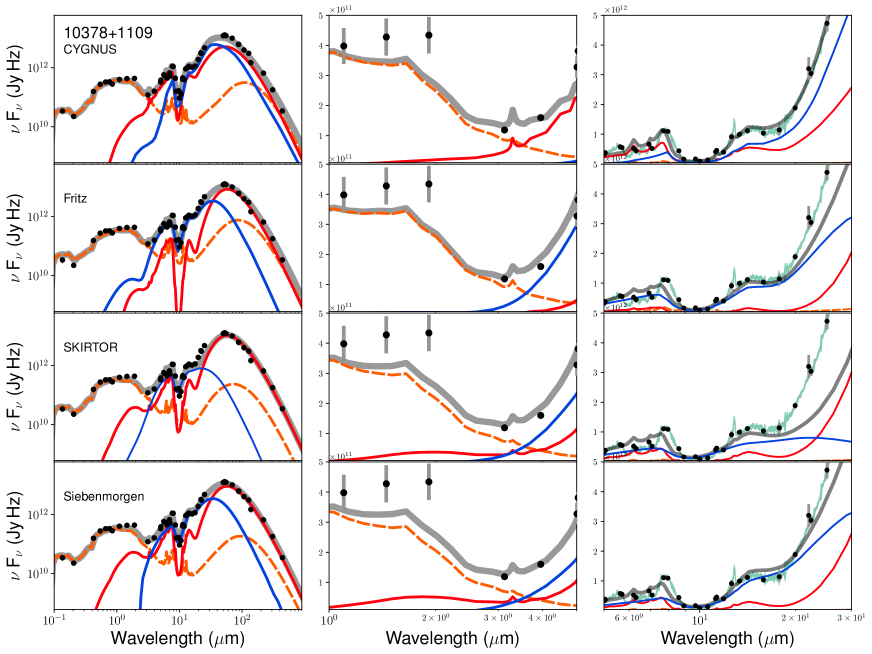
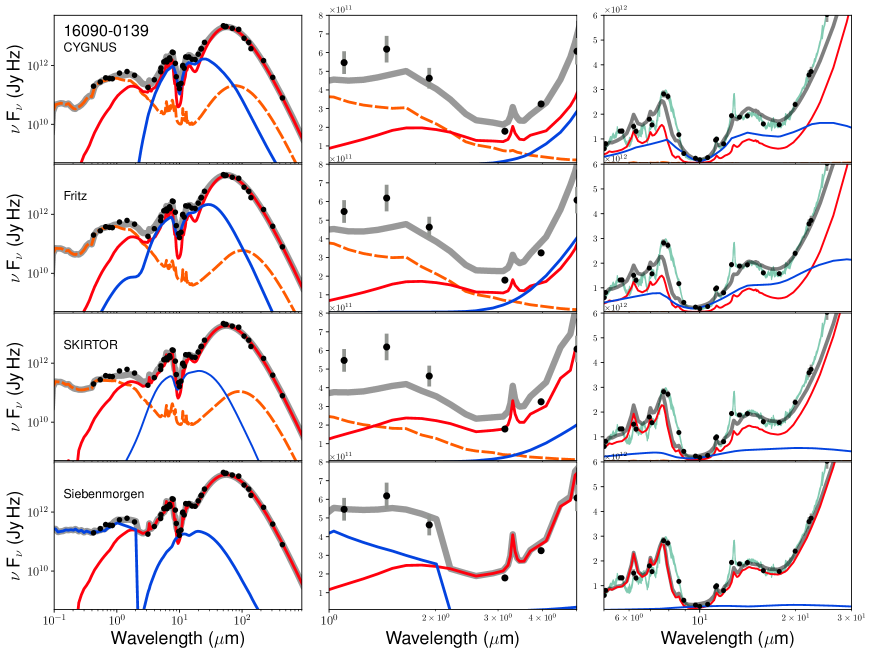
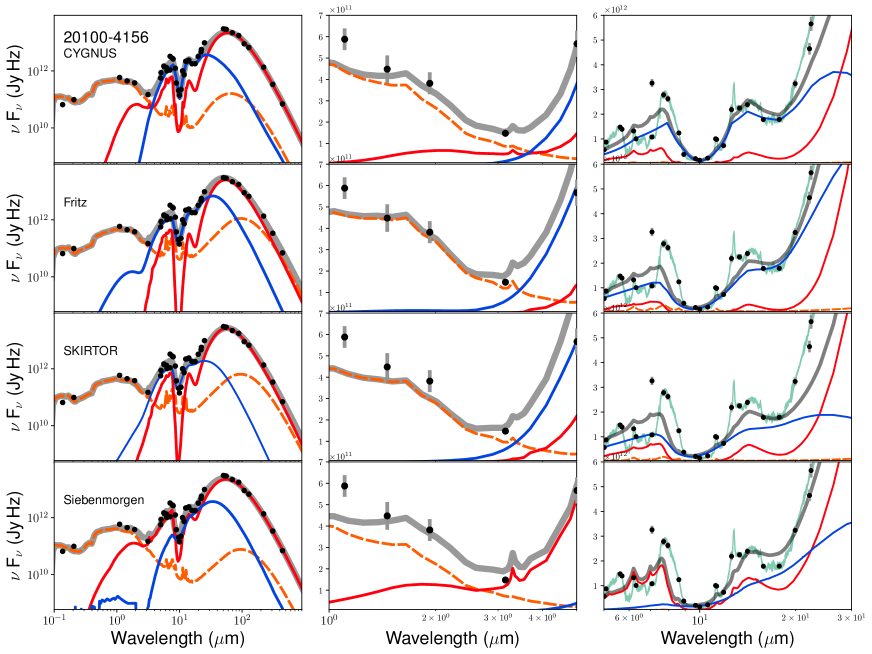
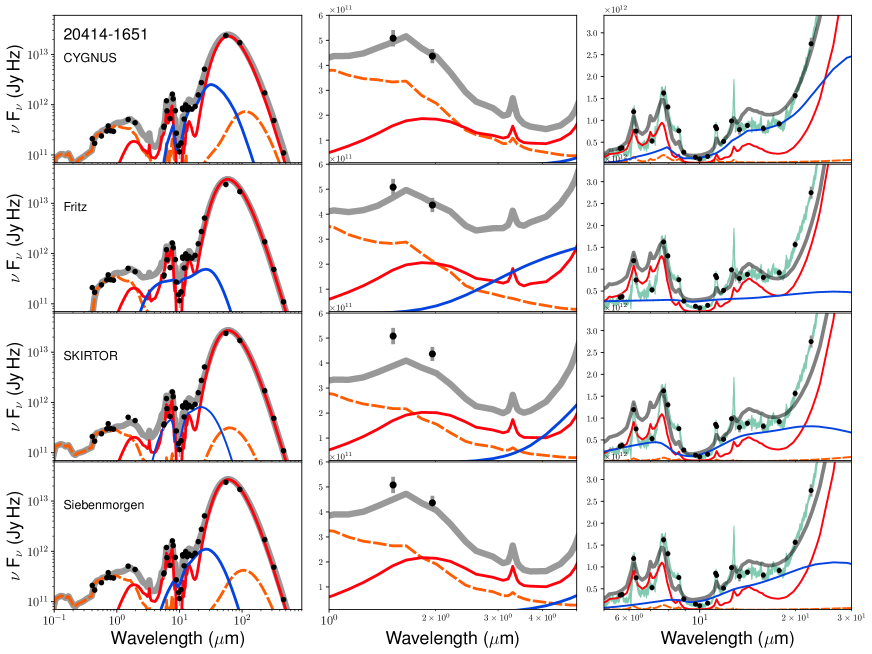
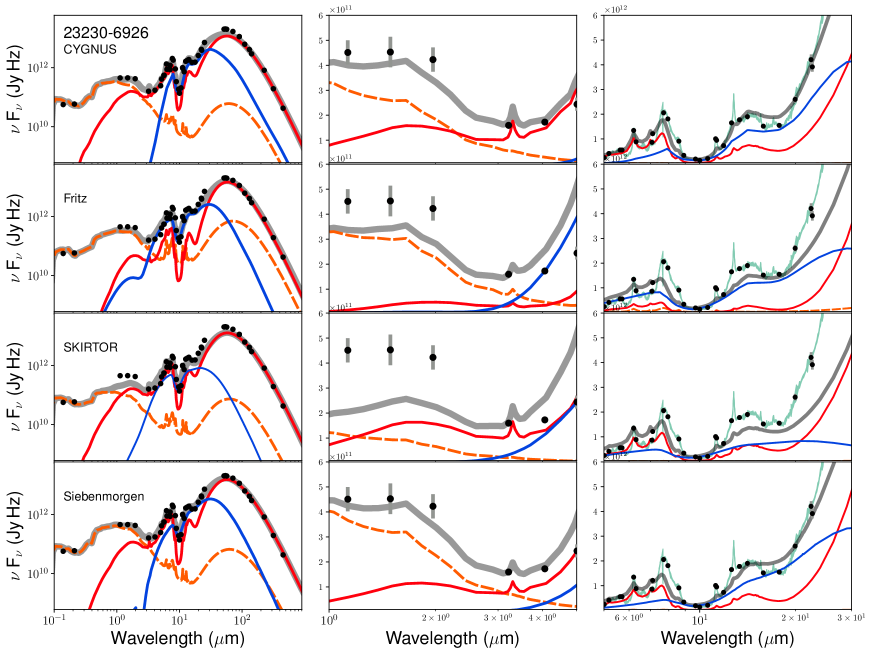
The infrared luminosities and derived parameters and physical quantities from the SED fits are presented in Tables 4 and 5. We also give additional derived physical quantities in Tables B1, B2, B3 and B4 in the Appendix. A description of all the derived physical quantities is given in Table 3. To give an impression of the results we selected six representative objects from the sample, IRAS 03158+4227, IRAS 10378+1109, IRAS 16090-0139, IRAS 20100-4156, IRAS 20414-1651 and IRAS 23230-6926. We plot the SEDs of these six galaxies in Figures 1 to 6. The full suite of SED fits with the CYGNUS models are presented in Figures A1 to A7 in the Appendix.
It is clear from the SED fits shown in Figures 1 to 6, and also from the log-likelihood values listed in Table 1, that the CYGNUS combination of models provide good fits to the data including the IRS spectroscopy. The fits with the combination that includes the SKIRTOR and Fritz models are usually worse especially in the range covered by the IRS data. The SKIRTOR models generally do not produce deep enough silicate absorption features to fit the mid-infrared spectroscopy. The Siebenmorgen15 models give better fits than SKIRTOR and Fritz but usually worse than CYGNUS.
An important feature of the results from the SED fitting is that due to the anisotropy of the emission from the AGN torus, which is usually optically thick to its own radiation (Pier & Krolik, 1993; Efstathiou & Rowan-Robinson, 1995; Efstathiou et al., 2014), the AGN luminosity needs to be corrected by the anisotropy correction factor defined in Efstathiou (2006),
| (1) |
where is the bolometric emission over the relevant wavelength range. is generally different for the infrared and bolometric luminosities and is necessary and significant for all the AGN torus models considered in this paper. In Table 4 we give both the ‘observed’ or uncorrected AGN luminosities as well as their ‘corrected’ counterparts.
5.1 Star formation
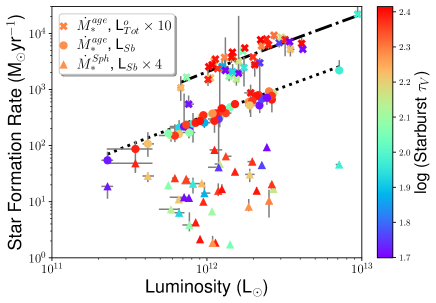
In this work we discuss two estimates of the star formation rate of the starburst episodes in the ULIRGs: the star formation rate averaged over the age of the starburst as determined from the fits and the star formation rate averaged over a flat timescale of 50Myr . We find that all objects harbor high rates of star formation, between 22 and 644 yr-1 when the SFR is averaged over 50Myr and between 59 and 2203 yr-1 when averaged over the age of the starburst. The starburst component always dominates the total SFR. Host star formation rates are in most cases at least an order of magnitude lower.
We plot SFR against and in Figure 7. There is a strong correlation between and (Kendall’s ), of which an acceptable linear parameterization is:
| (2) |
or:
| (3) |
with a zero intercept, with a scatter of about 0.1 dex555The starburst models assume a Salpeter IMF. With a Chabrier IMF the SFRs would be about a factor of 0.6 lower.. A power-law is not an appreciably better fit. The relation does not appear to depend on but there is a dependence on , with a flatter slope for more extincted starbursts. There is no correlation between and .
Since a more commonly measured value for luminous infrared galaxies are their observed (that is, uncorrected for anisotropic emission) total infrared luminosities, we also compare to . We see a correlation, albeit with a wider dispersion:
| (4) |
or:
| (5) |
with a zero intercept. More extincted starbursts are more likely to scatter below this relation.
Previous calibrations of the conversion between infrared luminosity and star formation rate generally derive
| (6) |
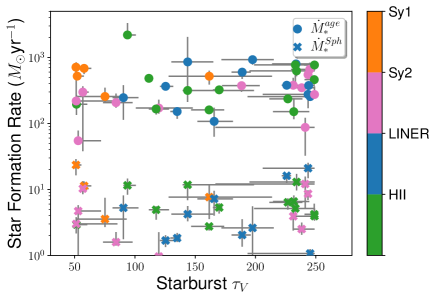
for 0.1-100, a Kroupa IMF, and SFR timescales of 10Gyr to 2Myr (Calzetti et al., 2007; Kennicutt & Evans, 2012). Our calibration for ULIRGs is consistent with this range, with a slope consistent with star formation timescales of Myr. This agrees with the ages we derive for the starburst episode. Previous values are closer to our as that is what is typically measured in other studies. We plot SFR against in Figure 8. There is a weak positive correlation between and (Kendall’s ) , consistent with more luminous starbursts being systematically more extincted. The correlation does not appear to depend on starburst age. This is reasonable as is a measure of the obscuration of the starburst episode over its whole duration. There is no dependence between and , suggesting that more extincted starbursts do not straightforwardly imply more extincted host galaxies.
5.2 AGN activity
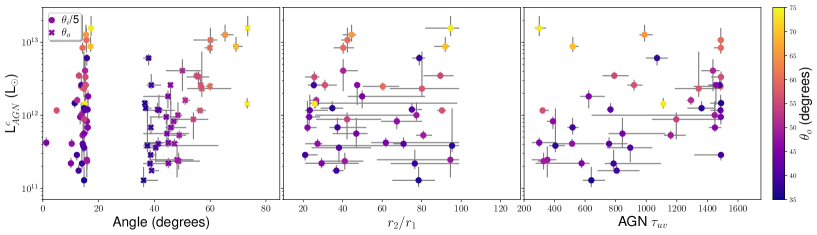
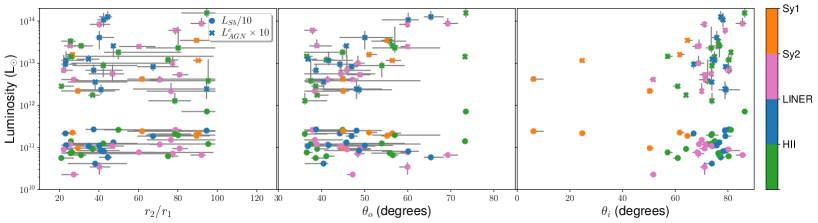
We find AGN in all objects, with anisotropy-corrected infrared luminosities spanning L⊙. There is a correlation between and , with more luminous AGN having larger values of (Figure 9). Conversely, there is no relation between and . Instead plotting the obscurer parameters against gives conceptually identical results. This is unlikely to be a selection effect unless there exists a population of low redshift ULIRGs with luminous AGN that have both high covering fractions and very cold SEDs. Thus, more infrared-luminous AGN in ULIRGs seem to be associated with smaller covering fractions. This is also consistent with the general class of ‘receding torus’ models (Lawrence, 1991) according to which the covering factor of the torus decreases with increasing luminosity due to dust sublimation.
Conversely, there is no relation between corrected AGN luminosity and either , or (Figure 9). There is also no dependence between and . It is notable that more than half of the objects have a relatively compact obscurer, with , but there does not appear to be anything unusual in the other properties of the systems with compact obscurers.
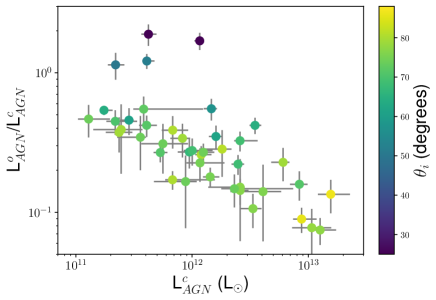
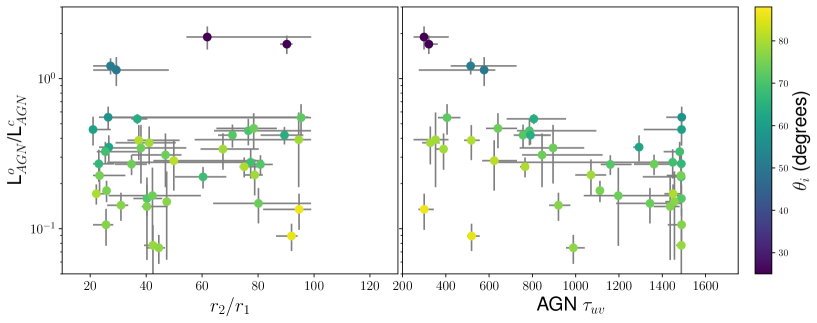
The obscurer geometry affects the observed AGN luminosity , obtained by integrating the observed SED over 4 steradians. The correction of the AGN luminosity depends on the intrinsic AGN luminosity, with more intrinsically luminous AGN having a larger correction (Figure 10). The mean / ratio of the sample is 0.40, but more luminous AGN have a greater difference between and , with / at L⊙ and / at L⊙. Moreover, the relation appears to depend on , with a clearer relation for objects viewed closer to edge-on, consistent with a higher optical depth in the equatorial plane. The observed to corrected luminosity ratio does not however seem to depend as strongly on the other torus parameters (Figure 11). Whether or not the viewing angle intersects the torus is the primary driver of the size of the anisotropy correction.
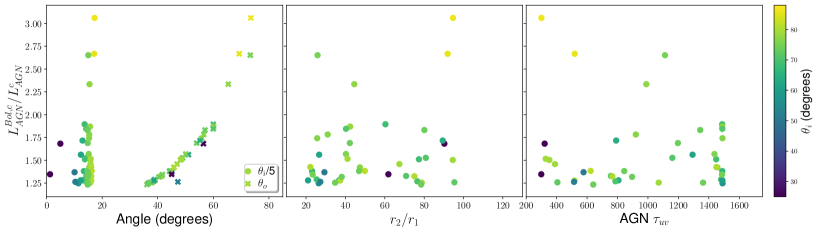
Finally, we examine the bolometric AGN luminosity correction as a function of obscurer geometry (Figure 12). The bolometric corrections range from factors of 1.25 to 3.10. As expected, there is a strong dependence on torus half-opening angle, especially when the line-of sight intersects the torus. There is however no significant dependence on the other AGN parameters. The magnitude of the bolometric correction also does not seem to depend on AGN luminosity.
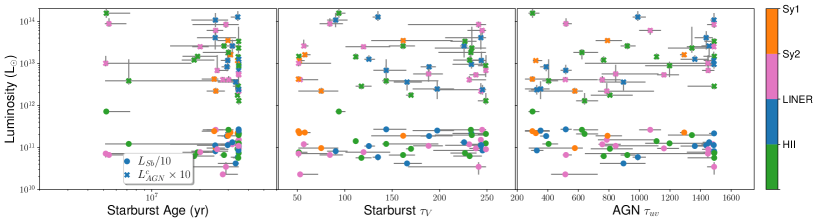
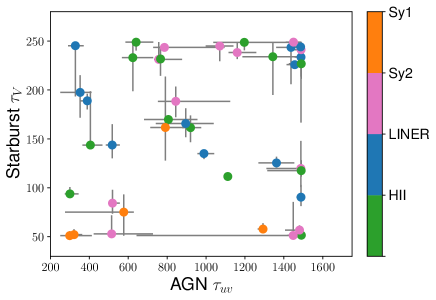
5.3 The Starburst-AGN Connection
Both star formation and AGN contribute significantly in most ULIRGs. The starburst usually contributes the majority of infrared emission except at L⊙ when AGN start to dominate. There is no observable relation between and or (Figure 13). Objects with high do not have low in absolute terms. Moreover, there is no observed relation between any of , , , or starburst fraction with starburst age. We also see no trends in any of , , with optical spectral classification. A conceptually similar disconnect between starburst and AGN luminosity has also recently been found in other classes of object, including Sloan Digital Sky Survey quasars (Ma & Yan, 2015; Pitchford et al., 2016), though see also Harris et al. (2016). Neither do we find evidence that , , or depend on luminosity (Figure 14), or evidence for a relation between and (Figure 15).
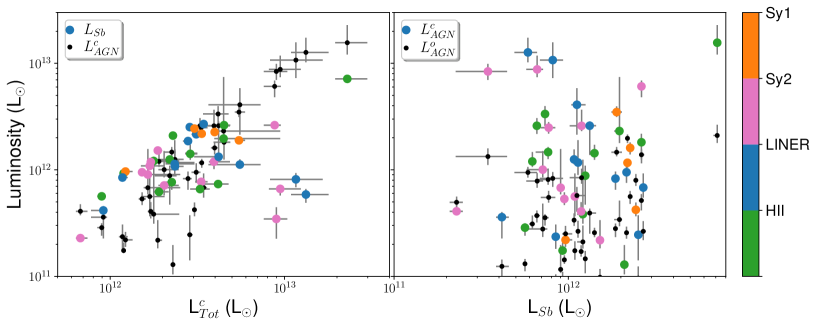
The overall impression is an at best weak direct connection between starburst and AGN activity. The lack of trends between starburst and AGN luminosities suggests that they do not strongly affect each other. The lack of trends with optical spectral class is also expected if optical spectral class is primarily a function of orientation. Moreover, there is no evidence that this (lack of) connection evolves over the lifetime of the starburst.
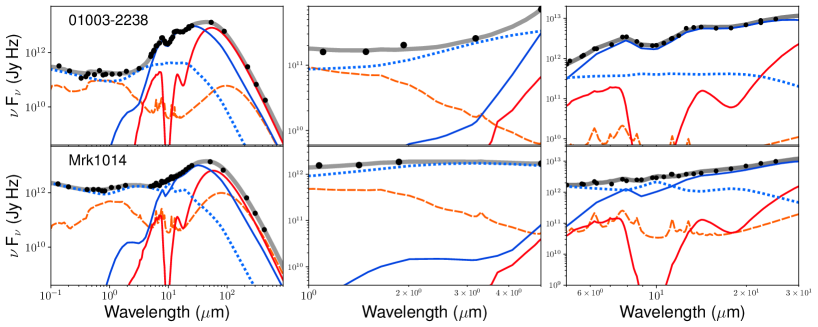
5.4 Dual AGN
Two ULIRGs in the sample - IRAS 01003-2238 and Mrk 1014 - show evidence for dual AGN in their SED fits (Figure 16 and Table 6). At face value, this implies a dual AGN fraction of about 5 percent in local ULIRGs, but this value is unlikely to be correct. There is independent corroborating evidence for at least two other objects, see below. Tadhunter et al. (2017) discovered a tidal disruption event (TDE) in IRAS 01003-2238 and conclude that TDEs are much more common in ULIRGs compared to the general galaxy population probably because of the presence of dual AGN in the process of merging. However, the fits are likely biased. The fits are only sensitive to dual AGN where the second AGN is sufficiently different in one or more physical parameters. We thus can not rule out the possibility that there may be other dual AGN with both AGN being broadly similar except, potentially, in luminosity. There is for example evidence for a triple AGN in NGC 6240 (Kollatschny et al., 2020) and a dual AGN in Mrk 231 (Yan et al., 2015). However, we do not see any evidence for more than one AGN from the SEDs of NGC 6240 and Mrk 231. So we interpret the 5 percent of ULIRGs harboring a dual AGN as a lower limit.
| ID | ||||||||||
|---|---|---|---|---|---|---|---|---|---|---|
| L⊙ | L⊙ | L⊙ | yr | M⊙ | ||||||
| 3 | ||||||||||
| 42 | ||||||||||
5.5 Polar Dust
For a few objects the emission from AGN polar dust is suggested from the SEDs. To model the emission of polar dust we use a library of spherical optically thick polar dust clouds for which we carry out a full radiative transfer calculation with the exception that we don’t solve for the temperature of the dust but we assume a constant temperature for all grain species. We also assume that the clouds have a uniform density. There is therefore only one parameter in this model, the temperature of the polar dust clouds which we assume to be 900K. In addition we have the scaling factor .
In a number of AGN there is clear evidence by high resolution imaging in the near- and mid-infrared that some of the nuclear emission is not coming from the torus but from the ionization cones. This has been observed in NGC 1068 since the early 1990s by Braatz et al. (1993) and Cameron et al. (1993), in Circinus by Tristram et al. (2007) and other AGN by Hönig et al. (2013) and more recently in Asmus (2019). The model of Efstathiou et al. (1995) for NGC 1068 explored the presence of polar dust in the nucleus. Efstathiou (2006) and Efstathiou et al. (2013) also discussed the idea that the mid-infrared emission of IRASF 10214+4724 is due to polar dust. Mattila et al. (2018) also interpreted the near-infrared emission arising from the dust-enshrouded TDE in Arp 299 as arising from polar dust which was illuminated by the TDE. A similar phenomenon was also observed in the LIRG IRAS 23436+5257 by Kool et al. (2020).
It is not clear how widespread polar dust is in ULIRGs. In the HERUS sample we do not find much evidence for it (three ULIRGs or about 8% of the sample) but this may be due to the large optical depths to the nuclear region or because the covering factor is too low to detect with SED fitting. We see evidence for polar dust in the following ULIRGs: IRAS 05189-2524, IRAS 07598+6508 and IRAS 13451+1232. IRAS 07598+6508 is the only unobscured quasar in the sample whereas IRAS 05189-2524 shows broad lines in polarized flux (Young et al., 1996) which also requires a relatively unobscured view to the nucleus. The fraction of AGN luminosity due to polar dust ranges from % which is also to a good approximation the covering factor of polar dust.
6 Comparison with other luminosities
In order to assess the robustness of our SED decomposition results and our estimate of the correction of the AGN luminosity due to anisotropic torus emission we compare our results to the following:
- •
-
•
AGN infrared luminosities from FR06, SKIRTOR and Siebenmorgen15.
- •
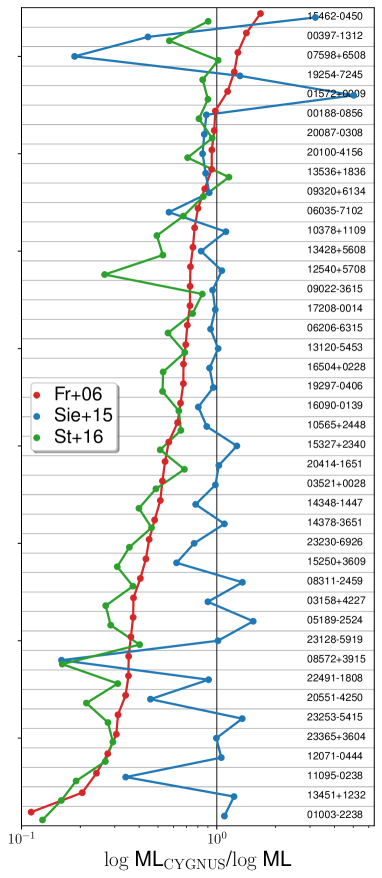
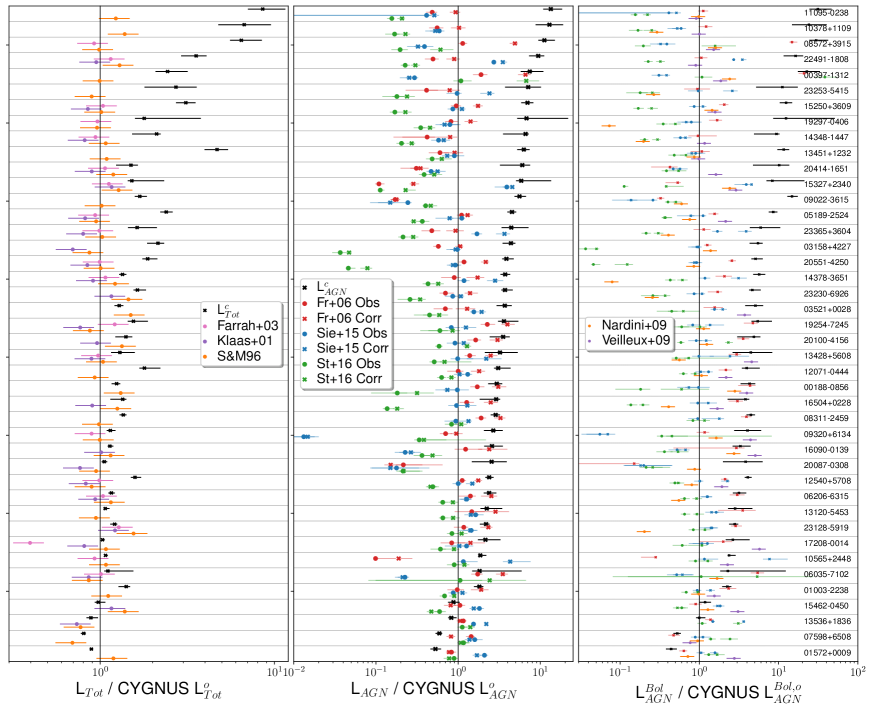
A comparison of the likelihoods from the fits with all four combinations of models is given in Figure 17, and of the luminosities in Figure 18. It is clear that the CYGNUS models nearly always give better fits than the FR06 and SKIRTOR models, and usually better fits than the Siebenmorgen15 models. We discuss possible reasons for this and their effect on the predicted AGN luminosities in section 8.
The uncorrected total infrared luminosities from CYGNUS are consistent with prior estimates (Sanders & Mirabel, 1996) though slightly higher that those based on pure modified blackbody dust models, likely due to lack of PAH emission in these models (Klaas et al., 2001).
The infrared AGN luminosities from CYGNUS and FR06 are in general consistent, though with significant dispersion. The infrared AGN luminosities from SKIRTOR and Siebenmorgen15 are however systematically lower than those from either FR06 or CYGNUS. As we also discuss in section 8 this may be related to the fact that the SKIRTOR fits are generally poorer than those with CYGNUS. As the same effect is also observed with the Siebenmorgen15 models, this is most probably also related to the two-phase geometry which is the common characteristic of SKIRTOR and Siebenmorgen15.
With all combinations of models significant correction of the AGN luminosities due to anisotropic AGN emission is needed. In the most extreme objects, IRAS 00397-1312 and IRAS 08572+3915 the corrected luminosities predicted by the CYGNUS, FR06 and SKIRTOR combinations agree very well. This is not the case for the Siebenmorgen15 models but the fits with this combination are not very good. The CYGNUS corrections are usually but not always the highest. The SKIRTOR and Siebenmorgen15 corrections do not bring their luminosities in line with either CYGNUS or FR06.
The bolometric AGN luminosities from CYGNUS and FR06 are also in general consistent, and usually higher than those from SKIRTOR and Siebenmorgen15. All are higher than the bolometric AGN luminosities from Nardini et al. (2009) though their bolometric luminosities are in reality infrared luminosities, so this is expected. The comparison with the Veilleux et al. (2009) bolometric luminosities is more interesting. The Veilleux et al. (2009) luminosities are not based on SED fits, but instead are averages of five different approaches. The CYGNUS uncorrected luminosities are systematically lower than those from Veilleux et al. (2009) but the corrected ones are often consistent. We conclude that empirical calibrations such as those in Veilleux et al. (2009) do capture some of the anisotropy correction.
7 Comparison with other inclination angles
The inclination angle of the AGN obscurer relative to the line of sight plays an important role in determining AGN luminosities. We therefore compare the inclination angles inferred from the CYGNUS models to those derived from other approaches.
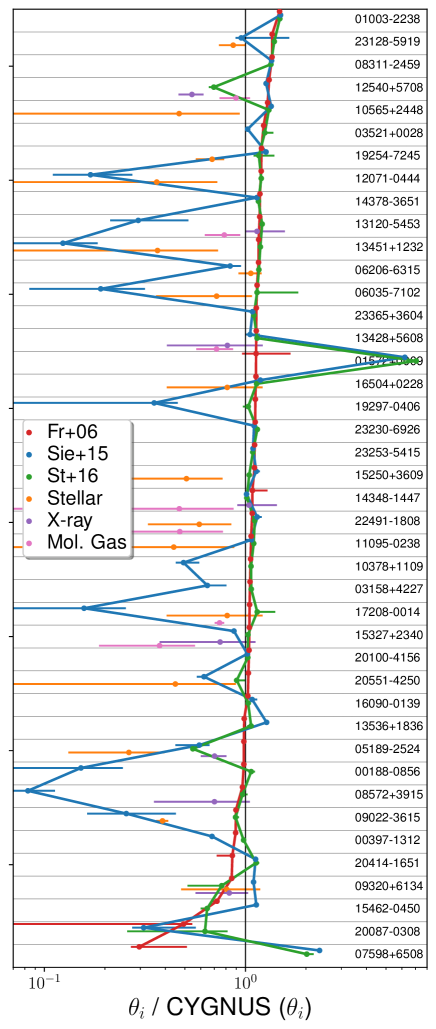
It is possible to observationally infer inclination angles of several galactic components - the molecular or atomic gas disk, the X-ray obscurer, the infrared obscurer, and the stellar disk. These estimates are challenging and usually carry large uncertainties. Few such measures are available, nevertheless, such comparisons can be illuminating, so we plot the values derived by all combinations of models with all available literature values in Figure 19.
There is no a priori reason to expect alignment of different components, but it is reasonable to expect some level of systematic consistency. In general however there is consistency between the CYGNUS-derived inclination angles and those obtained from other methods. The CYGNUS values may be slightly biased towards edge-on compared to the stellar disk derived values, but in most cases there is consistency well within . Moreover, as discussed by Dasyra et al. (2006), stellar disk inclination angles carry substantial uncertainty, so it is plausible that the bias is in these measures rather than the CYGNUS values. Compared to the molecular disk values there is consistency, except in one case: the molecular gas disk in the appropriate nucleus of Arp 220 (Scoville et al., 2017). It is inclined at while the CYGNUS value is (both from pole-on). Scoville et al. (2017) note however (their §5.2) that their inclination angle is inconsistent with the supernova remnant distribution in Lonsdale et al. (2006b). Moreover, the inclination angle inferred by Lonsdale et al. (2006b) is consistent with the CYGNUS value. Resolving this contradiction is beyond the scope of this paper, though it does suggest that the CYGNUS value is plausible. Finally, compared to the X-ray derived values there is consistency in one case but not in another. It is (perhaps) unreasonable to expect consistency here, though consistency between CYGNUS and X-ray derived inclination angles has been noted previously (Farrah et al., 2016). We here simply note the result as a starting point for further work.
8 Discussion
As we can see in Figure 17, the fits with SKIRTOR and FR06 are consistently worse than with CYGNUS or Siebenmorgen15. SKIRTOR is a two-phase torus model whereas CYGNUS and FR06 are both smooth models. There are also differences in the assumed ‘shape’ of the torus. Both SKIRTOR and FR06 assume a flared disc geometry whereas in CYGNUS the torus has the tapered disc geometry suggested by Efstathiou & Rowan-Robinson (1995). This may be the reason why CYGNUS is giving overall better fits than FR06. So overall the conclusion we can draw from our analysis is that a smooth tapered disc is the best approximation for the distribution of dust in the torus among the four distributions considered by the models.
The fundamental difference between a smooth and clumpy or two-phase geometry for the torus is that in the latter case we can see through gaps in the cloud distribution to the inner torus. This has the effect of making the emission from a clumpy torus be generally more isotropic and appear less obscured. A clumpy or two-phase torus also can not produce deep enough silicate absorption features in order to fit well most of the galaxies in our sample. In cases where the SKIRTOR fit is poor, such as for example in IRAS 11095-0238 or IRAS 03158+4227, this will usually manifest itself with a lower AGN luminosity as the model under predicts the emission at 20-30 where the torus emission peaks.
The conclusion that a smooth tapered disc is a better approximation than the SKIRTOR Siebenmorgen15 geometry is not necessarily at odds with the detections of compact tori in nearby Seyferts like NGC 1068 with ALMA (García-Burillo et al., 2016; Alonso-Herrero et al., 2018; Combes et al., 2019). It is important to note that even in NGC 1068 the compact torus of a few parsec diameter is surrounded by a circumnuclear disc of diameter of the order of 100 parsec which dominates the far-infrared and submillimetre emission. Lyu & Rieke (2021) also recently presented results from reverberation mapping of the nucleus of NGC 4151 at 1-40 which shows lack of variability at 20-40. This implies the 20-40 emitting region is more extended than that predicted by clumpy torus models and more consistent with smooth models. Because of the limited spatial resolution of the infrared data in this sample what we are modeling with the AGN torus models are structures similar to the circumnuclear disc in NGC 1068 or the extended structure in NGC 4151 inferred by Lyu & Rieke (2021). This may explain why the smooth torus models provide better fits to the SEDs of the ULIRGs in our sample.
It is also interesting to consider if the results presented here are consistent regarding the ratio of predicted type 1 and type 2 AGN. We have a total of 45 AGN in this sample (including the 2 type 1 AGN in the dual cases and 3C 273). Out of these, 5 are type 1 (IRAS 07598+6508, Mrk 231, 3C 273, and the 2 dual AGN). So we have a minimum type 1 fraction of 5/45=11.1%. Assuming all the tori in these AGN have then we should expect a type 1 fraction of 13%. So we conclude that our results are consistent.
With the more detailed analysis presented in this paper, which includes the addition of the emission of the host galaxy, we confirm the result obtained by Efstathiou et al. (2014) for IRAS 08572+3915 namely that it is intrinsically a hyperluminous infrared galaxy. The predicted higher luminosity is due to the anisotropic emission of the torus. The only way to avoid this conclusion is if the AGN torus were more ‘spherical’ than predicted in our model but more spherical models approaching a torus covering factor of 90% are included in our AGN torus libraries. There is also clear evidence for large outflows in this ULIRG which suggest a non-spherical geometry (Spoon et al., 2013; Rupke & Veilleux, 2013; González-Alfonso et al., 2017). Attempts to fit the SED of IRAS 08572+3915 with a foreground screen model have also not been successful (Levenson et al., 2007). IRAS 08572+3915 is one of the first ULIRGs which will be targets of JWST so we will be able to elucidate further the nature of this interesting system in the near future. We also find that there are three other ULIRGs which are predicted to be hyperluminous. These are IRAS 00397-1312, IRAS 10378+1109 and IRAS 11095-0238 which show very similar SEDs to IRAS 08572+3915. IRAS 00397-1312 belongs to class 3A of Spoon et al. (2007) which are associated with a deep silicate absorption feature and weak PAH emission. Another galaxy that belongs to class 3A of Spoon et al. (2007) is IRAS 00188-0856. This ULIRG is also fitted with a similar model as the other objects in this class but is not predicted to be hyperluminous.
In Arp 220 we find evidence for an AGN which may be consistent with the prediction of González-Alfonso & Sakamoto (2019) for the presence of a luminous AGN with an infrared luminosity of in the western nucleus. Scoville et al. (2017) also identified a compact Keplerian component in the western nucleus of Arp 220. We also note that three ULIRGs have significant contribution in the submillimetre from cold dust in the host galaxy component. In two of the cases, IRAS 19254-7245 (SuperAntena) and IRAS 23253-5415 cold dust dominates the submillimetre emission. These two galaxies are known to have prominent tidal tails extending for tens of kpc. IRAS 13451+123 is a radio galaxy so there may be contribution from synchrotron emission in the submillimetre, which is not included in our models. These three galaxies would be interesting to study with ALMA, NOEMA or SMA.
9 Conclusions
We have presented a detailed analysis of the SEDs of the HERUS local ULIRGs using radiative transfer models and an MCMC SED fitting code.
-
1.
We fit the SEDs of the ULIRGs in our sample with four combinations of radiative transfer models. Two of the combinations assume a smooth torus geometry (Efstathiou & Rowan-Robinson, 1995; Fritz et al., 2006) and two combinations a two-phase geometry (Siebenmorgen et al., 2015; Stalevski et al., 2016). We find the smooth CYGNUS models (Efstathiou & Rowan-Robinson, 1995) provide better fits than the other combinations of models.
-
2.
All objects harbor high rates of star formation. There is a strong correlation between and and more luminous starbursts are unlikely to be systematically different in either age or extinction to less luminous starbursts.
-
3.
We find bolometrically significant AGN in all objects. The obscurer geometry can substantially affect the observed AGN luminosity, by factors of up to in tori viewed nearly edge-on. This is due to the anisotropic nature of the emission of the torus which is to a large extent independent of the torus model. The correction may depend on luminosity; more infrared-luminous AGN in ULIRGs seem to be associated with both smaller covering fractions and viewing angles closer to equatorial. It is also consistent with the general class of ‘receding torus’ models.
-
4.
We see no relation between AGN luminosity and either , or . Moreover, neither or appear to depend on . This is consistent with only the covering fraction having a relation with , but other properties of the obscurer being independent of luminosity and covering fraction.
-
5.
We find an observed dual AGN fraction of about 5%. Due to observational biases this is likely a lower limit.
-
6.
We find evidence for significant amounts of polar dust in three ULIRGs or about 8% of the sample. This may be considered as a lower limit as in other objects polar dust emission may be obscured due to the large optical depths of ULIRGs.
Acknowledgements
We would like to thank the referee Ralf Siebenmorgen for his comments and suggestions which led to an improvement of the paper. The work leading to this paper has received funding from the European Union Seventh Framework Programme FP7/2007-2013/ under grant agreement no.607254. This publication reflects only the authors’ view and the European Union is not responsible for any use that may be made of the information contained therein. AE, DF and VPL acknowledge support from the project EXCELLENCE/1216/0207/ GRATOS funded by the Cyprus Research & Innovation Foundation. AE and VPL acknowledge support from the project CYGNUS funded by the European Space Agency. DR acknowledges support from STFC through grant ST/S000488/1. E.G-A is a Research Associate at the Harvard-Smithsonian Center for Astrophysics and thanks the Spanish Ministerio de Economía y Competitividad for support under projects ESP2017-86582-C4-1-R and PID2019-105552RB-C41.
Data Availability Statement
The data underlying this article are available in the article or are publicly available in databases like The Cornell Atlas of Spitzer/Infrared Spectrograph Sources (CASSIS) and the NASA Extragalactic Database (NED).
References
- Alexander et al. (1999) Alexander, D. M., Hough, J. H., Young, S., et al. 1999, MNRAS, 303, L17.
- Alonso-Herrero et al. (2001) Alonso-Herrero, A., Quillen, A. C., Simpson, C., et al. 2001, AJ, 121, 1369.
- Alonso-Herrero et al. (2003) Alonso-Herrero, A., Quillen, A. C., Rieke, G. H., et al. 2003, AJ, 126, 81.
- Alonso-Herrero et al. (2018) Alonso-Herrero, A., Pereira-Santaella, M., García-Burillo, S., et al. 2018, ApJ, 859, 144.
- Armus et al. (2009) Armus, L., Mazzarella, J. M., Evans, A. S., et al. 2009, PASP, 121, 559.
- Asmus (2019) Asmus, D. 2019, MNRAS, 489, 2177.
- Barger et al. (1998) Barger, A. J., Cowie, L. L., Sanders, D. B., et al. 1998, Nature, 394, 248.
- Bellocchi et al. (2013) Bellocchi, E., Arribas, S., Colina, L., et al. 2013, A&A, 557, A59.
- Boquien et al. (2019) Boquien, M., Burgarella, D., Roehlly, Y., et al. 2019, A&A, 622, A103.
- Braatz et al. (1993) Braatz, J. A., Wilson, A. S., Gezari, D. Y., et al. 1993, ApJ, 409, L5.
- Bridge et al. (2013) Bridge, C. R., Blain, A., Borys, C. J. K., et al. 2013, ApJ, 769, 91.
- Bruzual & Charlot (1993) Bruzual, G. & Charlot, S. 1993, ApJ, 405, 538.
- Bruzual & Charlot (2003) Bruzual, G. & Charlot, S. 2003, MNRAS, 344, 1000.
- Calzetti et al. (2007) Calzetti, D., Kennicutt, R. C., Engelbracht, C. W., et al. 2007, ApJ, 666, 870.
- Cameron et al. (1993) Cameron, M., Storey, J. W. V., Rotaciuc, V., et al. 1993, ApJ, 419, 136.
- Carilli et al. (1998) Carilli, C. L., Wrobel, J. M., & Ulvestad, J. S. 1998, AJ, 115, 928.
- Carilli & Taylor (2000) Carilli, C. L. & Taylor, G. B. 2000, ApJ, 532, L95.
- Casey et al. (2014) Casey, C. M., Narayanan, D., & Cooray, A. 2014, Phys. Rep., 541, 45.
- Clements et al. (2018) Clements, D. L., Pearson, C., Farrah, D., et al. 2018, MNRAS, 475, 2097.
- Combes et al. (2019) Combes, F., García-Burillo, S., Audibert, A., et al. 2019, A&A, 623, A79.
- da Cunha et al. (2008) da Cunha, E., Charlot, S., & Elbaz, D. 2008, MNRAS, 388, 1595.
- Dasyra et al. (2006) Dasyra, K. M., Tacconi, L. J., Davies, R. I., et al. 2006, ApJ, 651, 835.
- Dopita et al. (2005) Dopita, M. A., Groves, B. A., Fischera, J., et al. 2005, ApJ, 619, 755.
- Dullemond & van Bemmel (2005) Dullemond, C. P. & van Bemmel, I. M. 2005, A&A, 436, 47.
- Eales et al. (2010) Eales, S., Dunne, L., Clements, D., et al. 2010, PASP, 122, 499.
- Efstathiou & Rowan-Robinson (1994) Efstathiou, A. & Rowan-Robinson, M. 1994, MNRAS, 266, 212.
- Efstathiou & Rowan-Robinson (1995) Efstathiou A., Rowan-Robinson M. 1995, MNRAS, 273, 649.
- Efstathiou et al. (1995) Efstathiou A., Hough J. H., Young S. 1995, MNRAS, 277, 1134.
- Efstathiou et al. (2000) Efstathiou A., Rowan-Robinson M., Siebenmorgen R. 2000, MNRAS, 313, 734.
- Efstathiou & Rowan-Robinson (2003) Efstathiou, A. & Rowan-Robinson, M. 2003, MNRAS, 343, 322.
- Efstathiou & Siebenmorgen (2005) Efstathiou, A. & Siebenmorgen, R. 2005, A&A, 439, 85.
- Efstathiou (2006) Efstathiou A. 2006, MNRAS, 371, L70.
- Efstathiou & Siebenmorgen (2009) Efstathiou A., Siebenmorgen R. 2009, A&A, 502, 541.
- Efstathiou et al. (2013) Efstathiou A., Christopher N., Verma A., Siebenmorgen R. 2013, MNRAS, 436, 1873.
- Efstathiou et al. (2014) Efstathiou, A., Pearson, C., Farrah, D., et al. 2014, MNRAS, 437, L16.
- Efstathiou et al. (2021) Efstathiou, A., et al. 2021, MNRAS, 503, L11.
- Eisenhardt et al. (2012) Eisenhardt, P. R. M., Wu, J., Tsai, C.-W., et al. 2012, ApJ, 755, 173.
- Farrah et al. (2002) Farrah, D., Serjeant, S., Efstathiou, A., et al. 2002, MNRAS, 335, 1163.
- Farrah et al. (2003) Farrah, D., Afonso, J., Efstathiou, A., et al. 2003, MNRAS, 343, 585.
- Farrah et al. (2007) Farrah D., Lacy M., Priddey R., Borys C., Afonso J. 2007, ApJ, 662, 59.
- Farrah et al. (2010) Farrah D. et al. 2010, ApJ, 717, 868.
- Farrah et al. (2012) Farrah D. et al. 2012, ApJ, 745, 178.
- Farrah et al. (2013) Farrah, D., Lebouteiller, V., Spoon, H. W. W., et al. 2013, ApJ, 776, 38.
- Farrah et al. (2016) Farrah, D., Baloković, M., Stern, D., et al. 2016, ApJ, 831, 76.
- Farrah et al. (2017) Farrah, D., Petty, S., Connolly, B., et al. 2017, ApJ, 844, 106.
- Feruglio et al. (2015) Feruglio, C., Fiore, F., Carniani, S., et al. 2015, A&A, 583, A99.
- Fischer et al. (2010) Fischer, J., Sturm, E., González-Alfonso, E., et al. 2010, A&A, 518, L41.
- Fritz et al. (2006) Fritz, J., Franceschini, A., & Hatziminaoglou, E. 2006, MNRAS, 366, 767.
- García-Burillo et al. (2016) García-Burillo, S., Combes, F., Ramos Almeida, C., et al. 2016, ApJ, 823, L12.
- González-Alfonso et al. (2013) González-Alfonso, E., Fischer, J., Bruderer, S., et al. 2013, A&A, 550, A25.
- González-Alfonso et al. (2017) González-Alfonso, E., et al. 2017, ApJ, 836, 11.
- González-Alfonso & Sakamoto (2019) González-Alfonso, E. and Sakamoto, K., 2019, ApJ, 882, 153.
- Granato & Danese (1994) Granato, G. L. & Danese, L. 1994, MNRAS, 268, 235.
- Hailey-Dunsheath et al. (2012) Hailey-Dunsheath, S., Sturm, E., Fischer, J., et al. 2012, ApJ, 755, 57.
- Harris et al. (2016) Harris, K., Farrah, D., Schulz, B., et al. 2016, MNRAS, 457, 4179.
- Herrero-Illana et al. (2017) Herrero-Illana, R., Pérez-Torres, M. Á., Randriamanakoto, Z., et al. 2017, MNRAS, 471, 1634.
- Heymann & Siebenmorgen (2012) Heymann, F. & Siebenmorgen, R. 2012, ApJ, 751, 27.
- Hönig et al. (2006) Hönig, S. F., Beckert, T., Ohnaka, K., et al. 2006, A&A, 452, 459.
- Hönig et al. (2013) Hönig, S. F., Kishimoto, M., Tristram, K. R. W., et al. 2013, ApJ, 771, 87.
- Hönig & Kishimoto (2017) Hönig, S. F., & Kishimoto, M., 2017, ApJ, 838, L20.
- Houck et al. (1985) Houck, J. R., Schneider, D. P., Danielson, G. E., et al. 1985, ApJ, 290, L5.
- Houck et al. (2004) Houck, J. R., Roellig, T. L., van Cleve, J., et al. 2004, ApJS, 154, 18.
- Hughes et al. (1998) Hughes, D. H., Serjeant, S., Dunlop, J., et al. 1998, Nature, 394, 241.
- Johnson et al. (2013) Johnson, S. P., Wilson, G. W., Tang, Y., et al. 2013, MNRAS, 436, 2535.
- Kankare et al. (2021) Kankare, E.., et al. 2021, A&A, in press (astro-ph/2102.13512)
- Kennicutt & Evans (2012) Kennicutt, R. C. & Evans, N. J. 2012, ARA&A, 50, 531.
- Klaas et al. (2001) Klaas, U., Haas, M., Müller, S. A. H., et al. 2001, A&A, 379, 823.
- Kollatschny et al. (2020) Kollatschny, W., Weilbacher, P.M., Ochmann, M.W., Chelouche, D., Monreal-Ibero, A., Bacon, R., and Contini, T., 2020, å, 633, A79.
- Kool et al. (2018) Kool, E. C., Ryder, S., Kankare, E., et al. 2018, MNRAS, 473, 5641.
- Kool et al. (2020) Kool, E. C., Reynolds, T. M., Mattila, S., et al. 2020, MNRAS, 498, 2167.
- Krügel & Siebenmorgen (1994) Krügel, E. & Siebenmorgen, R. 1994, A&A, 282, 407.
- Lawrence (1991) Lawrence, A. 1991, MNRAS, 252, 586.
- Lebouteiller et al. (2011) Lebouteiller, V., Barry, D. J., Spoon, H. W. W., et al. 2011, ApJS, 196, 8.
- Levenson et al. (2007) Levenson, N.A., et al., 2007, ApJ, 654, L45.
- Lonsdale et al. (2006) Lonsdale, C. J., Farrah, D., & Smith, H. E. 2006, Astrophysics Update 2, 285.
- Lonsdale et al. (2006b) Lonsdale, C. J., Diamond, P. J., Thrall, H., Smith, H. E., & Lonsdale, C. J. 2006, ApJ, 647, 185.
- Lonsdale et al. (2015) Lonsdale, C. J., Lacy, M., Kimball, A. E., et al. 2015, ApJ, 813, 45.
- Lyu & Rieke (2021) Lyu, J., Rieke, G. H., 2021, ApJ, submitted (astro-ph/2011.07638)
- Ma & Yan (2015) Ma, Z., & Yan, H. 2015, ApJ, 811, 58.
- Mattila et al. (2012) Mattila, S., Dahlen, T., Efstathiou, A., et al. 2012, ApJ, 756, 111.
- Mattila et al. (2018) Mattila, S., Pérez-Torres, M., Efstathiou, A., et al. 2018, Science, 361, 482.
- Medling et al. (2014) Medling, A. M., U, V., Guedes, J., et al. 2014, ApJ, 784, 70.
- Nardini et al. (2009) Nardini, E., Risaliti, G., Salvati, M., et al. 2009, MNRAS, 399, 1373.
- Nenkova et al. (2002) Nenkova, M., Ivezić, Ž., & Elitzur, M. 2002, ApJ, 570, L9.
- Nenkova et al. (2008) Nenkova, M., Sirocky, M. M., Ivezić, Ž., et al. 2008, ApJ, 685, 147.
- Noll et al. (2009) Noll, S., Burgarella, D., Giovannoli, E., et al. 2009, A&A, 507, 1793.
- Oda et al. (2017) Oda, S., Tanimoto, A., Ueda, Y., et al. 2017, ApJ, 835, 179.
- Oliver et al. (2012) Oliver, S. J., Bock, J., Altieri, B., et al. 2012, MNRAS, 424, 1614.
- Pearson et al. (2016) Pearson, C., Rigopoulou, D., Hurley, P., et al. 2016, ApJS, 227, 9.
- Peeters et al. (2002) Peeters, E., Hony, S., Van Kerckhoven, C., et al. 2002, A&A, 390, 1089.
- Pereira-Santaella et al. (2018) Pereira-Santaella, M., Colina, L., García-Burillo, S., et al. 2018, A&A, 616, A171.
- Perez-Torres et al. (2021) Perez-Torres, M., Mattila, S., Alonso-Herrero, A., et al. 2021, The Astronomy & Astrophysics Review, 29, 2
- Pilbratt et al. (2010) Pilbratt, G. L., Riedinger, J. R., Passvogel, T., et al. 2010, A&A, 518, L1.
- Pier & Krolik (1993) Pier, E. A. & Krolik, J. H. 1993, ApJ, 418, 673.
- Pitchford et al. (2016) Pitchford, L. K., Hatziminaoglou, E., Feltre, A., et al. 2016, MNRAS, 462, 4067.
- Pitchford et al. (2019) Pitchford, L. K., Farrah, D., Alatalo, K., et al. 2019, MNRAS, 487, 3130.
- Privon et al. (2017) Privon, G. C., Aalto, S., Falstad, N., et al. 2017, ApJ, 835, 213.
- Rigopoulou et al. (1996) Rigopoulou, D., Lawrence, A., & Rowan-Robinson, M. 1996, MNRAS, 278, 1049.
- Reunanen et al. (2007) Reunanen, J., Tacconi-Garman, L. E., & Ivanov, V. D. 2007, MNRAS, 382, 951.
- Rowan-Robinson & Crawford (1989) Rowan-Robinson, M. & Crawford, J. 1989, MNRAS, 238, 523.
- Rowan-Robinson et al. (1993) Rowan-Robinson, M., Efstathiou, A., Lawrence, A., et al. 1993, MNRAS, 261, 513.
- Rowan-Robinson & Efstathiou (1993) Rowan-Robinson, M. & Efstathiou, A. 1993, MNRAS, 263, 675.
- Rowan-Robinson et al. (1997) Rowan-Robinson, M., Mann, R. G., Oliver, S. J., et al. 1997, MNRAS, 289, 490.
- Rowan-Robinson (2000) Rowan-Robinson, M. 2000, MNRAS, 316, 885.
- Rowan-Robinson et al. (2018) Rowan-Robinson, M., Wang, L., Farrah, D., et al. 2018, A&A, 619, A169.
- Ruiz et al. (2001) Ruiz, M., Efstathiou, A., Alexander, D. M., et al. 2001, MNRAS, 325, 995.
- Rupke & Veilleux (2013) Rupke, D. S. N. & Veilleux, S. 2013, ApJ, 775, L15.
- Sanders & Mirabel (1996) Sanders, D. B. & Mirabel, I. F. 1996, ARA&A, 34, 749.
- Sanders et al. (2003) Sanders, D. B., Mazzarella, J. M., Kim, D.-C., et al. 2003, AJ, 126, 1607.
- Saunders et al. (2000) Saunders, W., Sutherland, W. J., Maddox, S. J., et al. 2000, MNRAS, 317, 55.
- Schartmann et al. (2008) Schartmann, M., Meisenheimer, K., Camenzind, M., et al. 2008, A&A, 482, 67.
- Scoville et al. (2017) Scoville, N., Murchikova, L., Walter, F., et al. 2017, ApJ, 836, 66.
- Shirley et al. (2019) Shirley, R., Roehlly, Y., Hurley, P. D., et al. 2019, MNRAS, 490, 634.
- Siebenmorgen & Krügel (2007) Siebenmorgen, R. & Krügel, E. 2007, A&A, 461, 445.
- Siebenmorgen et al. (2015) Siebenmorgen, R., Heymann, F., & Efstathiou, A. 2015, A&A, 583, A120.
- Silva et al. (1998) Silva, L., Granato, G. L., Bressan, A., et al. 1998, ApJ, 509, 103.
- Soifer et al. (1986) Soifer, B. T., Sanders, D. B., Neugebauer, G., et al. 1986, ApJ, 303, L41.
- Spoon et al. (2007) Spoon, H. W. W., Marshall, J. A., Houck, J. R., et al. 2007, ApJ, 654, L49.
- Spoon et al. (2013) Spoon, H. W. W., Farrah, D., Lebouteiller, V., et al. 2013, ApJ, 775, 127.
- Stalevski et al. (2012) Stalevski, M., Fritz, J., Baes, M., et al. 2012, MNRAS, 420, 2756.
- Stalevski et al. (2016) Stalevski, M., Ricci, C., Ueda, Y., et al. 2016, MNRAS, 458, 2288.
- Sturm et al. (2011) Sturm, E., González-Alfonso, E., Veilleux, S., et al. 2011, ApJ, 733, L16.
- Tadhunter et al. (2017) Tadhunter, C., Spence, R., Rose, M., et al. 2017, Nature Astronomy, 1, 0061.
- Takagi et al. (2003) Takagi, T., Arimoto, N., & Hanami, H. 2003, MNRAS, 340, 813.
- Tristram et al. (2007) Tristram, K. R. W., Meisenheimer, K., Jaffe, W., et al. 2007, A&A, 474, 837.
- U et al. (2012) U, V., Sanders, D. B., Mazzarella, J. M., et al. 2012, ApJS, 203, 9.
- Vega et al. (2008) Vega, O., Clemens, M. S., Bressan, A., et al. 2008, A&A, 484, 631.
- Veilleux et al. (2009) Veilleux, S., Rupke, D. S. N., Kim, D.-C., et al. 2009, ApJS, 182, 628.
- Verma et al. (2002) Verma, A., Rowan-Robinson, M., McMahon, R., et al. 2002, MNRAS, 335, 574.
- Xu et al. (2017) Xu, Y., Baloković, M., Walton, D. J., et al. 2017, ApJ, 837, 21.
- Yamada et al. (2021) Yamada, S., et al. 2021, ApJS, in press
- Yan et al. (2015) Yan, C-S, Lu, Y., Dai, X., Yu, Q., 2015, ApJ, 809, 117.
- Young et al. (1996) Young, S., Hough, J. H., Efstathiou, A., et al. 1996, MNRAS, 281, 1206.
Appendix A: Individual SED fits with the CYGNUS models
The following figures present SED fits using the CYGNUS AGN torus models for all the objects in the sample.
![[Uncaptioned image]](/html/2205.00011/assets/x21.png)
Figure A1 SED fit plots of all objects, using the CYGNUS models: spheroidal host (orange), starburst (red), AGN torus (blue), polar dust (green) and total (grey). These fits assume a single AGN.
![[Uncaptioned image]](/html/2205.00011/assets/x22.png)
Figure A2 SED fit plots of all objects, using the CYGNUS models.
![[Uncaptioned image]](/html/2205.00011/assets/x23.png)
Figure A3 SED fit plots of all objects, using the CYGNUS models.
![[Uncaptioned image]](/html/2205.00011/assets/x24.png)
Figure A4 SED fit plots of all objects, using the CYGNUS models.
![[Uncaptioned image]](/html/2205.00011/assets/x25.png)
Figure A5 SED fit plots of all objects, using the CYGNUS models.
![[Uncaptioned image]](/html/2205.00011/assets/x26.png)
Figure A6 SED fit plots of all objects, using the CYGNUS models.
![[Uncaptioned image]](/html/2205.00011/assets/x27.png)
Figure A7 SED fit plots of all objects, using the CYGNUS models.
Appendix B: Ancillary Data
The following tables present the full suite of luminosities together with luminosities from the literature. Where appropriate the luminosities have been scaled to our adopted cosmology.
| Other Luminosities | CYGNUS Bolometric Luminosities | |||||||||
|---|---|---|---|---|---|---|---|---|---|---|
| ID | LTot | LTot | LAGN | L | L | L | LSb | Lhost | L | L |
| SM96 | K01 | N09 | V09 | |||||||
| L⊙ | L⊙ | L⊙ | L⊙ | |||||||
| 1 | — | |||||||||
| 2 | — | |||||||||
| 3 | — | |||||||||
| 4 | ||||||||||
| 5 | — | |||||||||
| 6 | ||||||||||
| 7 | ||||||||||
| 8 | ||||||||||
| 9 | — | |||||||||
| 10 | — | — | ||||||||
| 11 | — | |||||||||
| 12 | — | |||||||||
| 13 | — | |||||||||
| 14 | — | — | ||||||||
| 15 | — | |||||||||
| 16 | — | |||||||||
| 17 | — | |||||||||
| 18 | — | |||||||||
| 19 | ||||||||||
| 20 | ||||||||||
| 21 | ||||||||||
| 22 | ||||||||||
| 23 | ||||||||||
| 24 | ||||||||||
| 25 | ||||||||||
| 26 | — | |||||||||
| 27 | ||||||||||
| 28 | ||||||||||
| 29 | ||||||||||
| 30 | ||||||||||
| 31 | ||||||||||
| 32 | ||||||||||
| 33 | ||||||||||
| 34 | — | |||||||||
| 35 | ||||||||||
| 36 | — | |||||||||
| 37 | ||||||||||
| 38 | ||||||||||
| 39 | — | |||||||||
| 40 | ||||||||||
| 41 | ||||||||||
| 42 | — | |||||||||
Table B1 Comparison of luminosities from the literature. Also, the AGN, starburst, spheroid, and total bolometric luminosities, derived from the CYGNUS model fits. For the AGN and total luminosities both the observed and anisotropy-corrected luminosities are given.
| Infrared Luminosities | Bolometric Luminosities | |||||||||
|---|---|---|---|---|---|---|---|---|---|---|
| ID | LSb | L | L | Lhost | L | LSb | L | L | Lhost | L |
| L⊙ | L⊙ | L⊙ | L⊙ | L⊙ | L⊙ | |||||
| 1 | ||||||||||
| 2 | ||||||||||
| 3 | ||||||||||
| 4 | ||||||||||
| 5 | ||||||||||
| 6 | ||||||||||
| 7 | ||||||||||
| 8 | ||||||||||
| 9 | ||||||||||
| 10 | ||||||||||
| 11 | ||||||||||
| 12 | ||||||||||
| 13 | ||||||||||
| 14 | ||||||||||
| 15 | ||||||||||
| 16 | ||||||||||
| 17 | ||||||||||
| 18 | ||||||||||
| 19 | ||||||||||
| 20 | ||||||||||
| 21 | ||||||||||
| 22 | ||||||||||
| 23 | ||||||||||
| 24 | ||||||||||
| 25 | ||||||||||
| 26 | ||||||||||
| 27 | ||||||||||
| 28 | ||||||||||
| 29 | ||||||||||
| 30 | ||||||||||
| 31 | ||||||||||
| 32 | ||||||||||
| 33 | ||||||||||
| 34 | ||||||||||
| 35 | ||||||||||
| 36 | ||||||||||
| 37 | ||||||||||
| 38 | ||||||||||
| 39 | ||||||||||
| 40 | ||||||||||
| 41 | ||||||||||
| 42 | ||||||||||
Table B2 Infrared and bolometric luminosities from the FR06 model fits.
| Infrared Luminosities | Bolometric Luminosities | |||||||||
|---|---|---|---|---|---|---|---|---|---|---|
| ID | LSb | L | L | Lhost | L | LSb | L | L | Lhost | L |
| L⊙ | L⊙ | L⊙ | L⊙ | L⊙ | L⊙ | |||||
| 1 | ||||||||||
| 2 | ||||||||||
| 3 | ||||||||||
| 4 | ||||||||||
| 5 | ||||||||||
| 6 | ||||||||||
| 7 | ||||||||||
| 8 | ||||||||||
| 9 | ||||||||||
| 10 | ||||||||||
| 11 | ||||||||||
| 12 | ||||||||||
| 13 | ||||||||||
| 14 | ||||||||||
| 15 | ||||||||||
| 16 | ||||||||||
| 17 | ||||||||||
| 18 | ||||||||||
| 19 | ||||||||||
| 20 | ||||||||||
| 21 | ||||||||||
| 22 | ||||||||||
| 23 | ||||||||||
| 24 | ||||||||||
| 25 | ||||||||||
| 26 | ||||||||||
| 27 | ||||||||||
| 28 | ||||||||||
| 29 | ||||||||||
| 30 | ||||||||||
| 31 | ||||||||||
| 32 | ||||||||||
| 33 | ||||||||||
| 34 | ||||||||||
| 35 | ||||||||||
| 36 | ||||||||||
| 37 | ||||||||||
| 38 | ||||||||||
| 39 | ||||||||||
| 40 | ||||||||||
| 41 | ||||||||||
| 42 | ||||||||||
Table B3 Infrared and bolometric luminosities from the SKIRTOR model fits.
| Infrared Luminosities | Bolometric Luminosities | |||||||||
|---|---|---|---|---|---|---|---|---|---|---|
| ID | LSb | L | L | Lhost | L | LSb | L | L | Lhost | L |
| L⊙ | L⊙ | L⊙ | L⊙ | L⊙ | L⊙ | |||||
| 1 | ||||||||||
| 2 | ||||||||||
| 3 | ||||||||||
| 4 | ||||||||||
| 5 | ||||||||||
| 6 | ||||||||||
| 7 | ||||||||||
| 8 | ||||||||||
| 9 | ||||||||||
| 10 | ||||||||||
| 11 | ||||||||||
| 12 | ||||||||||
| 13 | ||||||||||
| 14 | ||||||||||
| 15 | ||||||||||
| 16 | ||||||||||
| 17 | ||||||||||
| 18 | ||||||||||
| 19 | ||||||||||
| 20 | ||||||||||
| 21 | ||||||||||
| 22 | ||||||||||
| 23 | ||||||||||
| 24 | ||||||||||
| 25 | ||||||||||
| 26 | ||||||||||
| 27 | ||||||||||
| 28 | ||||||||||
| 29 | ||||||||||
| 30 | ||||||||||
| 31 | ||||||||||
| 32 | ||||||||||
| 33 | ||||||||||
| 34 | ||||||||||
| 35 | ||||||||||
| 36 | ||||||||||
| 37 | ||||||||||
| 38 | ||||||||||
| 39 | ||||||||||
| 40 | ||||||||||
| 41 | ||||||||||
| 42 | ||||||||||
Table B4 Infrared and bolometric luminosities from the Siebenmorgen15 model fits.