Development of a fast simulator for GEM-based neutron detectors
Abstract
Gas Electron Multiplier (GEM)-based detectors using a layer of as a neutron converter is becoming popular for thermal neutron detection. A common strategy to simulate this kind of detector is based on two frameworks: Geant4 and Garfield++. The first one provides the simulation of the nuclear interaction between neutrons and the layer, while the second allows the simulation of the interaction of the reaction products with the detector gas leading to the ionization and excitation of the gas molecules. Given the high ionizing power of these nuclear reaction products, a full simulation is very time consuming and must be optimized to become viable. In this work, we present a strategy to develop a fast simulator based on these two frameworks that will allow us to generate enough data for a proper evaluation of the expected performance and optimization of this kind of detector. We will show the first results obtained with this tool concentrating on its validation and performance.
1 Introduction
Due to the shortage of helium-3, widely used in thermal neutron gaseous detectors, alternatives need to be studied to continue producing this kind of detector. Gas Electron Multipliers (GEM) [1] are a type of Micro-Pattern Gaseous Detectors (MPGD), widely used in particle tracking systems, as the Time Projection Chamber of the ALICE experiment in the LHC-CERN [2], and proposed for many other applications, including neutron detection. Neutrons can be detected indirectly through a nuclear reaction where the products are ionizing radiation. In our application, we are using as a neutron converter to induce the nuclear reaction:
| (1) |
2 Simulation Tools
A common strategy to simulate this kind of detector is based on the frameworks: GEANT4 [3] and Garfield++ [4]:
-
•
GEANT4 - Using the physics list QGSP_BERT_HP, which has high precision models for low energy neutrons [5], we simulate the nuclear interaction of thermal neutrons with the boron layer, producing charged particles, as well as the transport of these particles inside the detector.
- •
Given the high ionizing power of the nuclear reaction products from reaction, a full simulation is very time consuming, mainly due to Garfield++, and must be optimized to become viable. Thus, in the following, we present a strategy to develop a fast simulator based on these two frameworks.
3 Parametrization Strategies
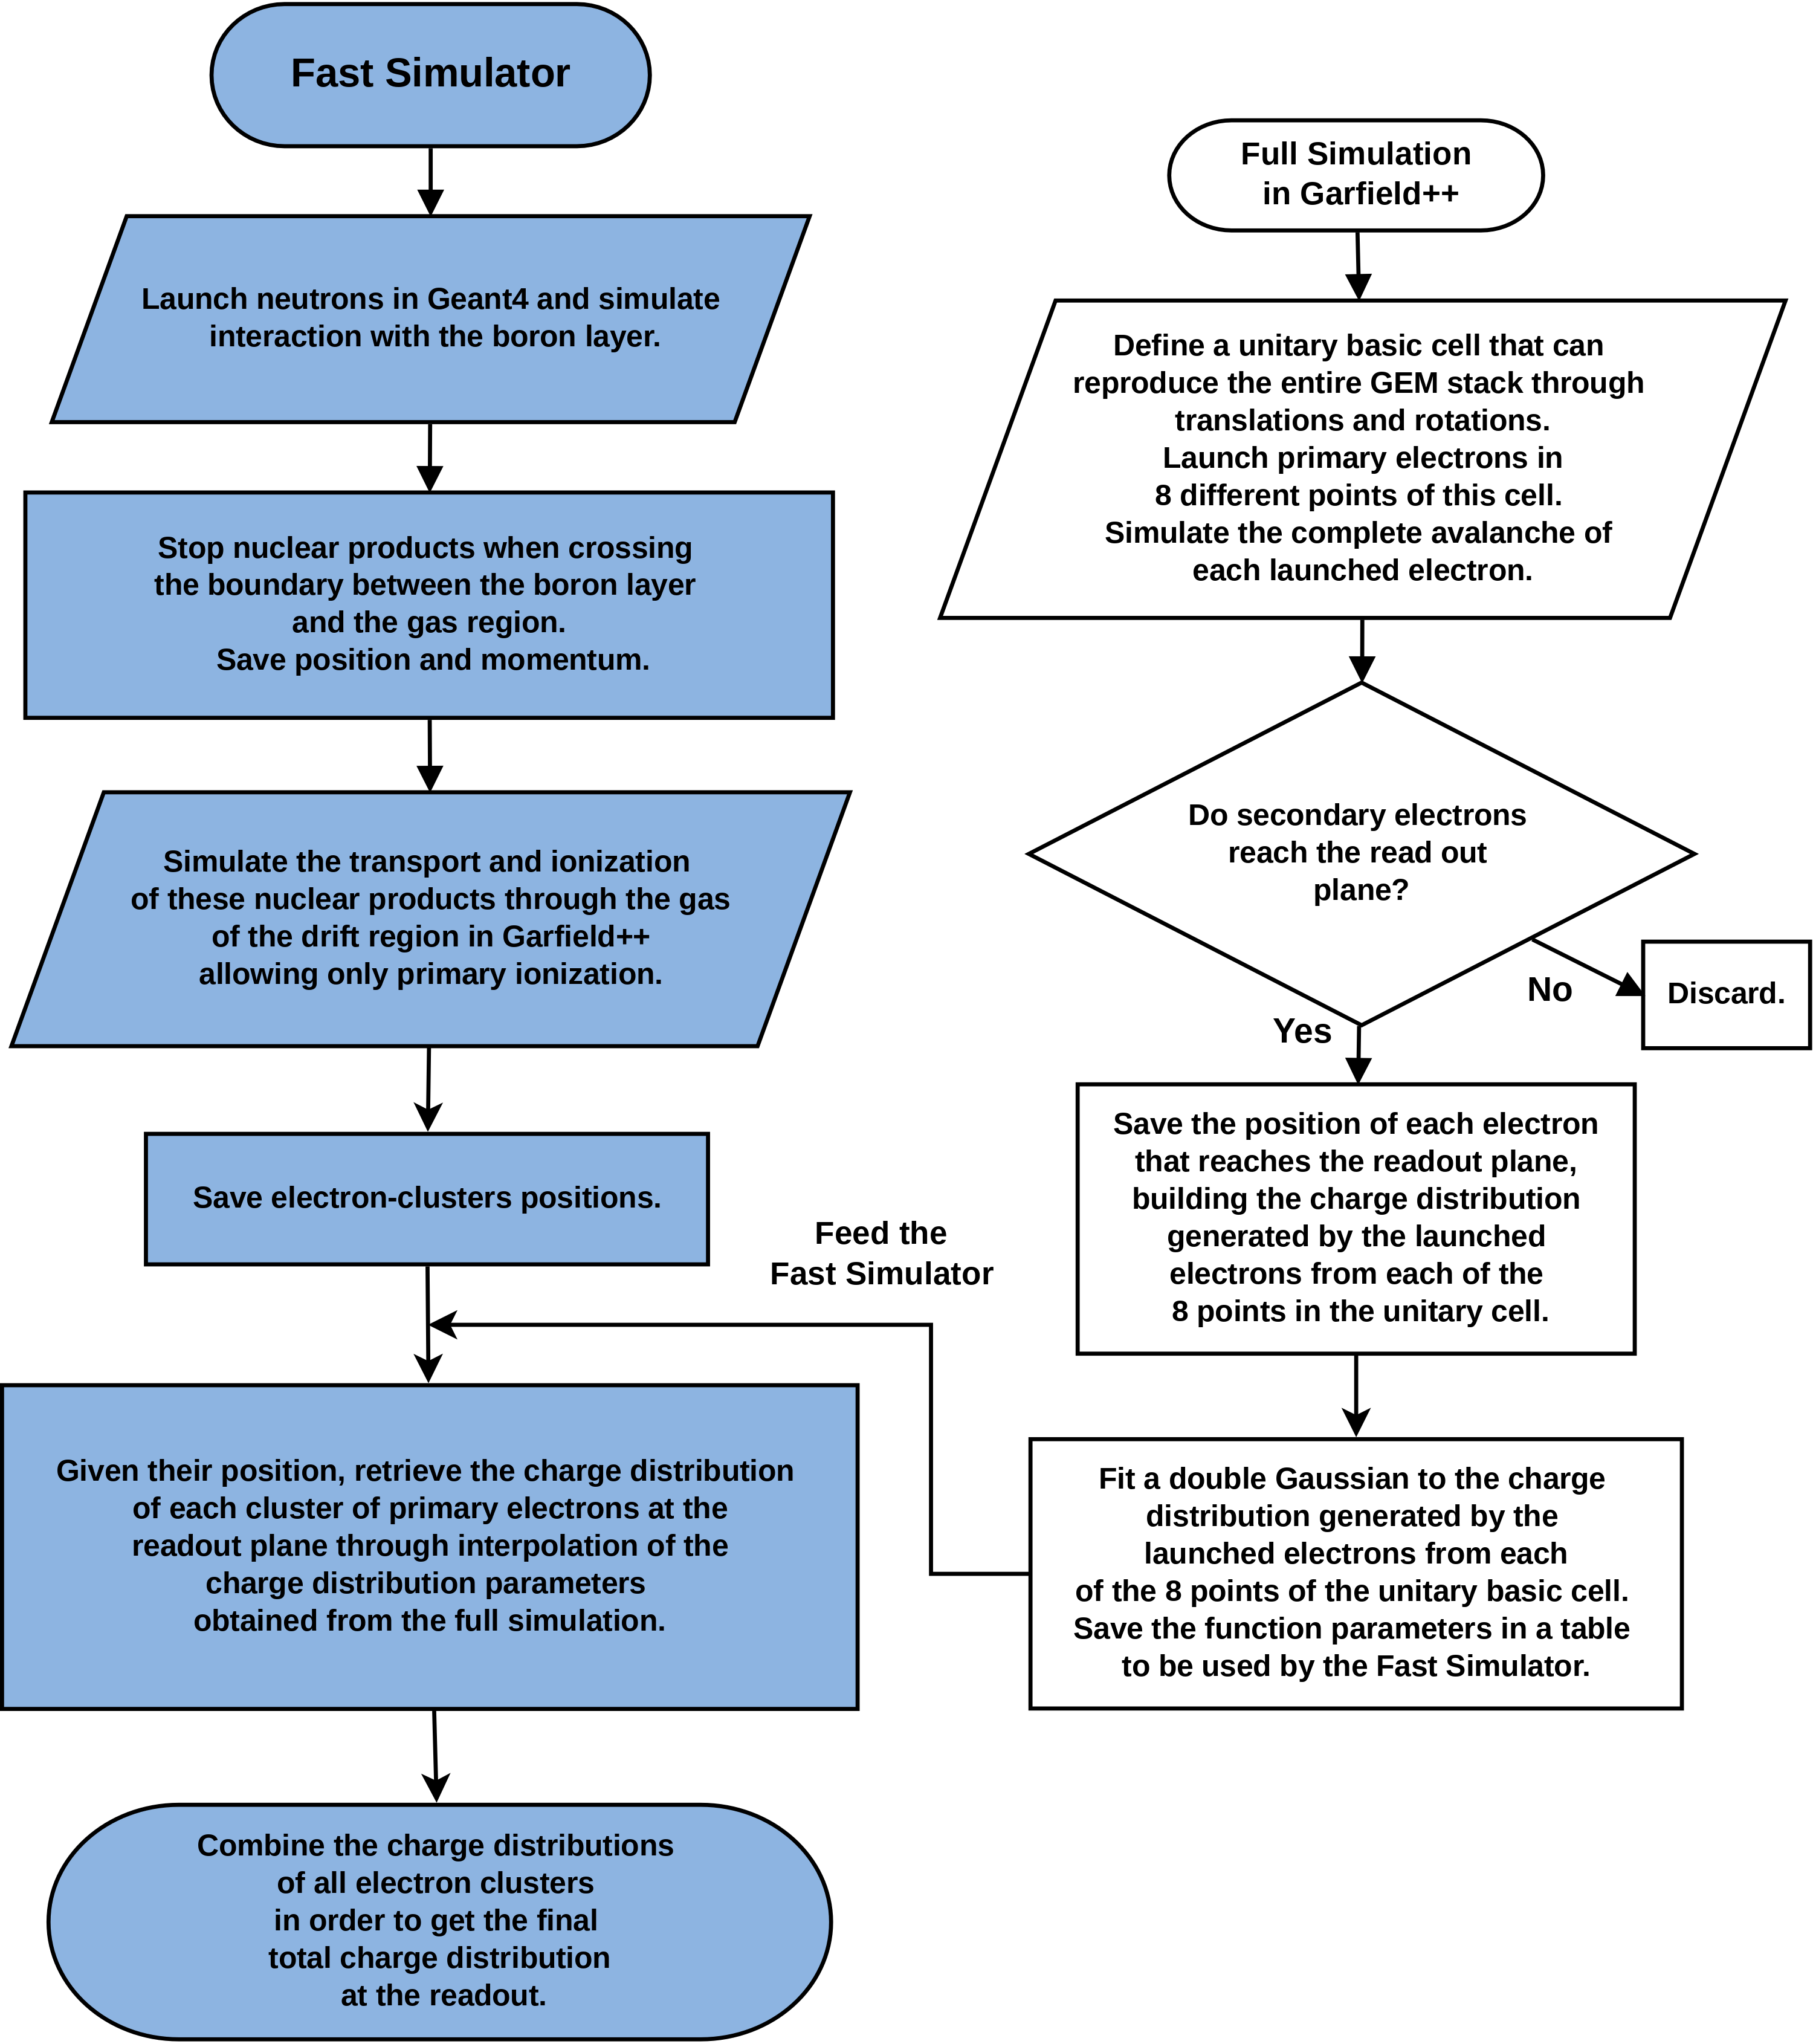
The fast simulator steps are represented in the diagram shown in Fig. 1.
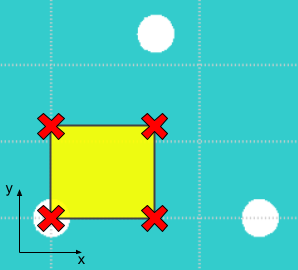
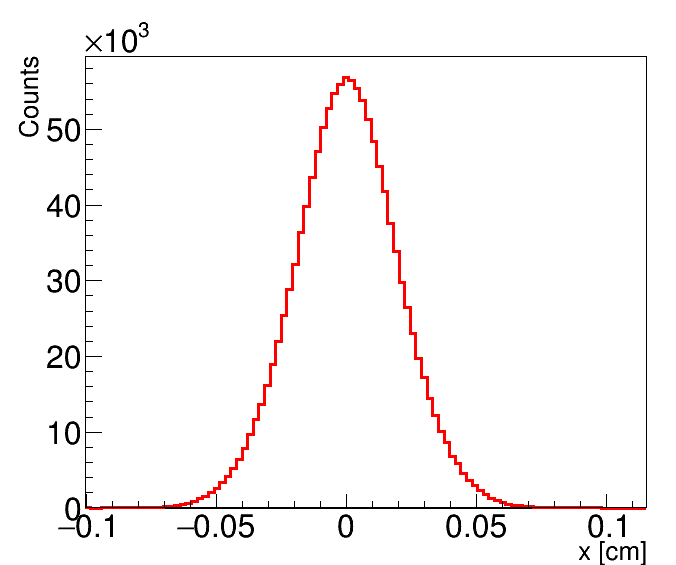
Given the symmetry of the GEM foil, the entire detector can be represented by translations and rotations of a unitary basic cell, as represented in Fig. 2(a), where there are 3 white circles representing the GEM holes. Four points are marked with a red X, corresponding to the positions in the transverse (readout) plane where the primary electrons are launched in the full simulation in two different positions in the longitudinal (drift) direction. The rectangular area in yellow can be translated and rotated to map the entire GEM. The charge distribution at the readout, as shown in Fig. 2(b), is better fitted with a double Gaussian. And the primary ionization is allowed only in the drift region.
4 Double-GEM Detector Prototype
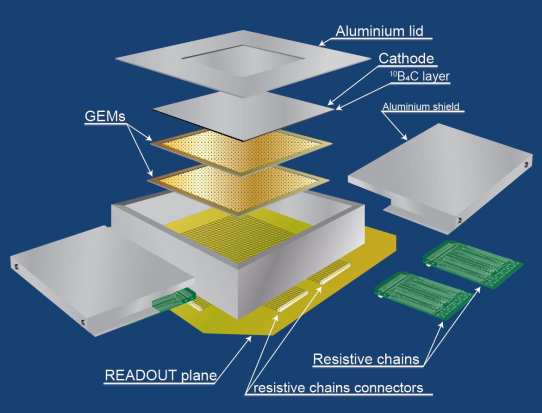
In order to validate the simulations, data from an experimental prototype, sketched in Fig. 3(a), was used. It is a double-GEM composed of a stack of thick aluminum cathode coated with enriched boron carbide and two GEM foils. The aluminum lid and the cathode are apart from each other. The drift, transfer and induction regions were set to , and thick and bias of , and , respectively. It is operated with (90/10) gas mixture.
5 Preliminary Results
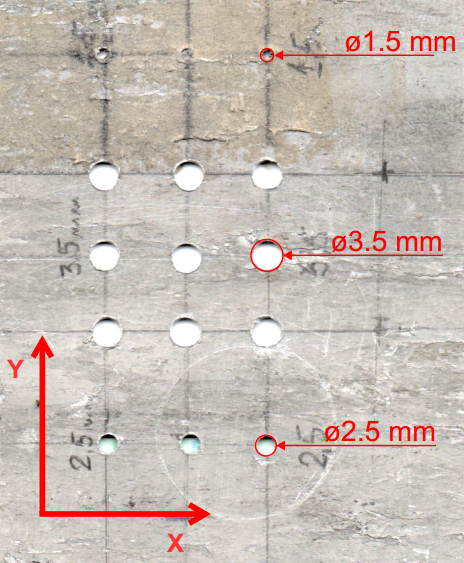
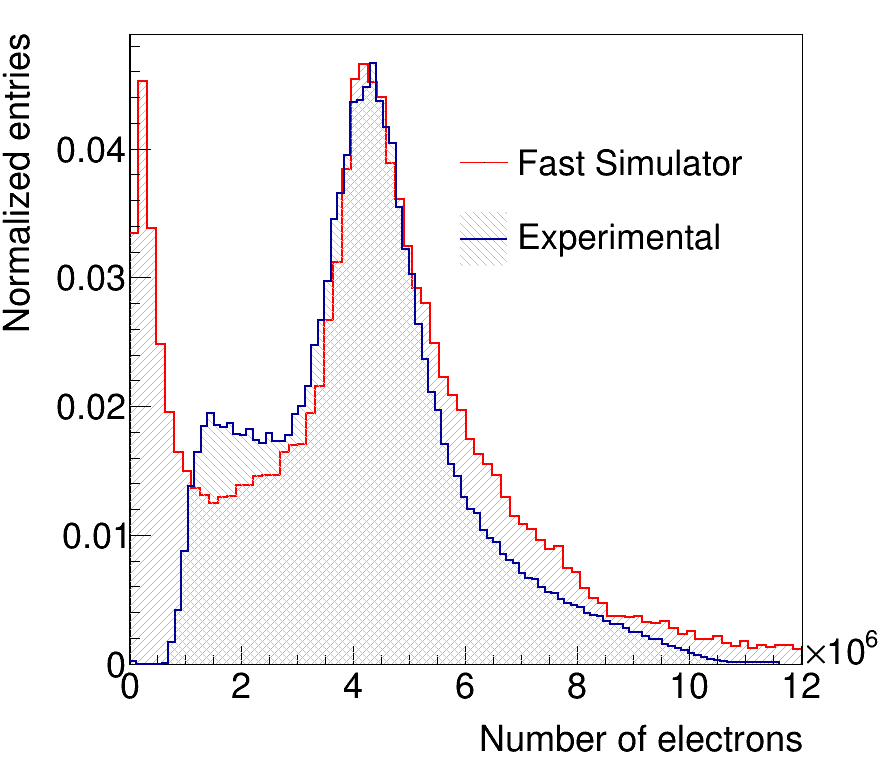
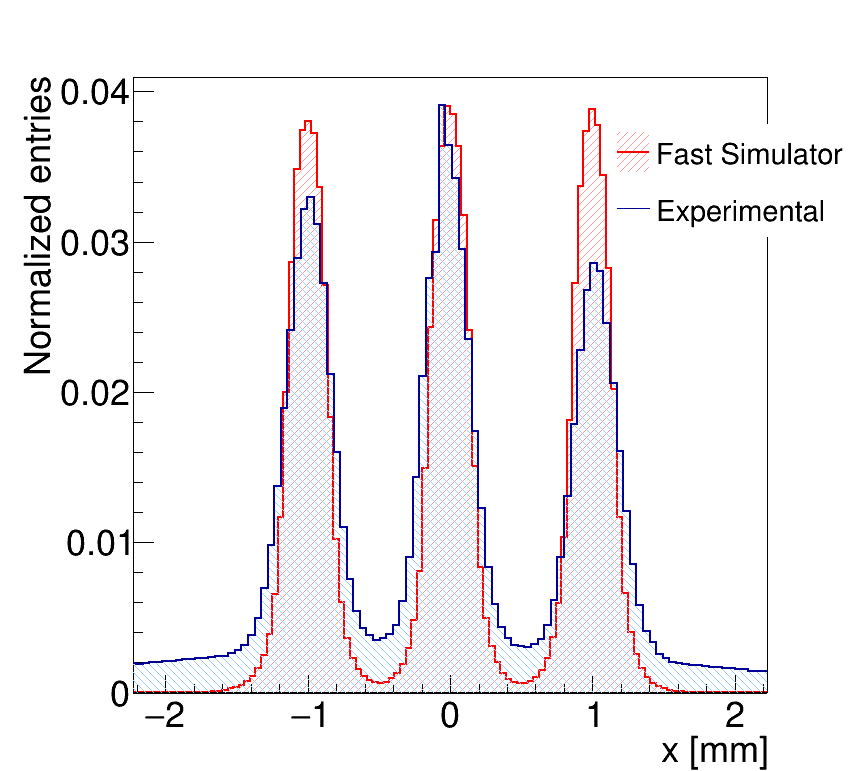
A cadmium mask, shown in Fig. 3(b), with , and hole diameters, was inserted just in front of the detector to obtain the position calibration and estimate the position resolution. We evaluate the fast simulator with these experimental results. In Fig. 4(a) we have the comparison of the charge distribution at the readout. An electronic threshold filters signals below, approximately . The projection to one of the axis due to the neutron hit position for the three central holes is shown in Fig. 4(b).
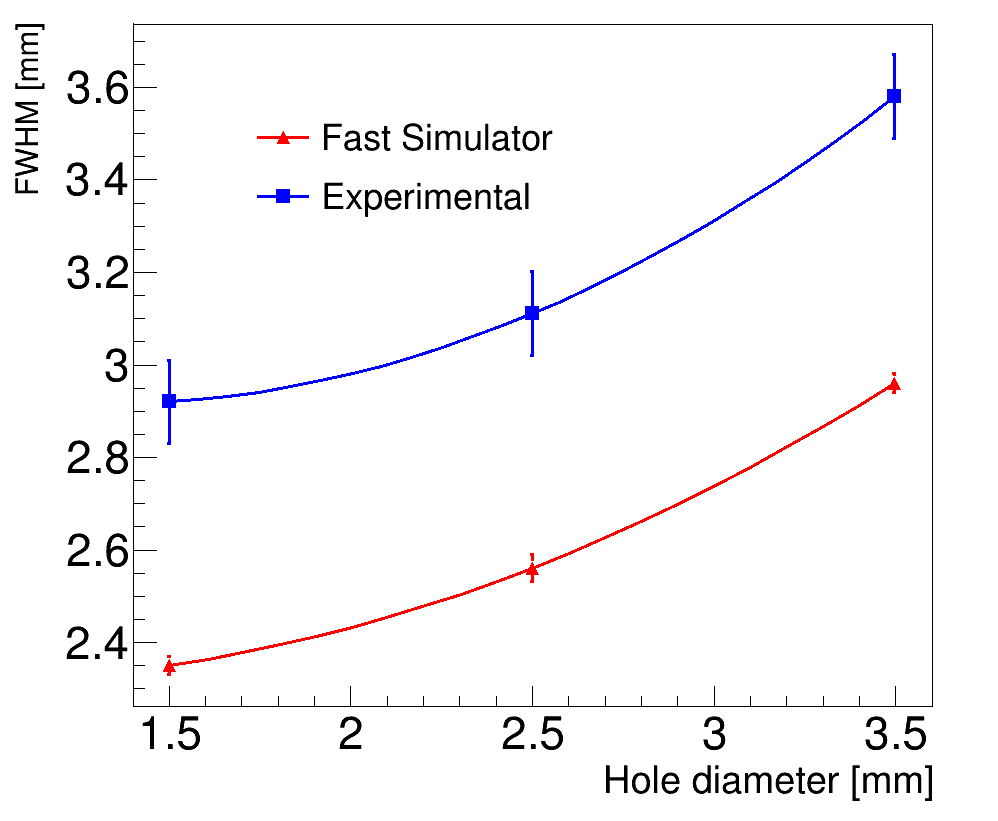
Given a set of holes with 3 different diameters we compared the FWHM of the simulated result with the one obtained in the experiment, given in Fig. 4(c). The differences between the experimental and fast simulator data can be due to noise, lack of homogeneity in the neutron beam and others effects that were not considered in the simulation and are under investigation.
A benchmark of a full and fast simulator shows that the fast simulator is orders of magnitude faster. Performing the test using an Intel Core i5-8265U CPU @1.60 GHz and 8GB of RAM, the full simulation spends an average of 42 hours while the fast simulator spends an average of 16 seconds for 1 event.
6 Perspectives
The next steps in this work consist in a better understanding of the experimental background and electronic noise in order to improve the simulation and to study possible optimization of the detector mainly in terms of position resolution.
References
References
- [1] Sauli F 1997 Nuclear Instruments and Methods in Physics Research Section A: Accelerators, Spectrometers, Detectors and Associated Equipment 386 531–534 ISSN 0168-9002
- [2] The ALICE Collaboration 2021 Journal of Instrumentation 16 P03022 ISSN 1748-0221 URL https://iopscience.iop.org/article/10.1088/1748-0221/16/03/P03022
- [3] Agostinelli S 2003 Nuclear Instruments and Methods in Physics Research Section A: Accelerators, Spectrometers, Detectors and Associated Equipment 506 250–303 ISSN 0168-9002
- [4] Schindler H and Veenhof R Garfield++ - Simulation of Tracking Detectors URL http://cern.ch/garfieldpp
- [5] Geant4 Collaboration Geant 4 - Physics Reference Manual. Release 10.7, Re5.0, https://geant4-userdoc.web.cern.ch/UsersGuides/PhysicsReferenceManual/fo/PhysicsReferenceManual.pdf (December 2020) URL https://geant4-userdoc.web.cern.ch/UsersGuides/PhysicsReferenceManual/fo/PhysicsReferenceManual.pdf
- [6] Ruokolainen J, Malinen M, Raback P, Zwinger T, Pursula A and Byckling M 2021 ElmerSolver Manual URL http://www.nic.funet.fi/index/elmer/doc/ElmerSolverManual.pdf
- [7] Ziegler J F, Ziegler M D and Biersack J P 2010 Nuclear Instruments and Methods in Physics Research, Section B: Beam Interactions with Materials and Atoms 268 1818–1823 ISSN 0168583X URL https://ui.adsabs.harvard.edu/abs/2010NIMPB.268.1818Z/abstract
- [8] Biagi S F 1999 Nuclear Instruments and Methods in Physics Research, Section A: Accelerators, Spectrometers, Detectors and Associated Equipment 421 234–240 ISSN 01689002