The Streaming Instability Cannot Form Planetesimals from mm-size Grains in Pressure Bumps
Abstract
We present evidence that it is unlikely that the streaming instability (SI) can form planetesimals from mm grains inside axisymmetric pressure bumps. We conducted the largest simulation of the SI so far (7 million CPU hours), consisting of a large slice of the disk with mm grains, a solar-like dust-to-gas ratio (), and the largest pressure bump that does not cause gravitational instability (GI) in the particle layer. We used a high resolution of to resolve as many SI unstable modes as possible. The simulation produced a long-lived particle over-density far exceeding the SI criteria (i.e., a critical solid abundance to headwind parameter ratio ) where strong clumping would occur if these conditions were present over an extended region of the disk; yet we observed none. The likely reason is that the time it takes particles to cross the high- region () is shorter than the growth timescale of the SI (). We propose an added criterion for planetesimal formation by the SI — that . We show that any bump larger than the one in this run would form planetesimals by the GI instead of the SI. Our results significantly restrict the pathways to planet formation: Either protoplanetary disks regularly form grains larger than 1 mm, or planetesimals do not form by the SI in axisymmetric pressure bumps. Since bumps large enough to induce the GI are likely Rossby-wave unstable, we propose that mm grains may only form planetesimals in vortices.
1 Introduction
Ever since its first iconic images of the circumstellar dust rings around HL Tau (ALMA Partnership et al., 2015), ALMA has revolutionized our understanding of planet formation. Before ALMA there had been plenty of speculation that gas pressure bumps might play a role in planet formation by concentrating dust grains (e.g., Johansen et al., 2009; Sándor et al., 2011; Pinilla et al., 2012; Simon & Armitage, 2014; Bai & Stone, 2014). However, ALMA has shown that axisymmetric dust rings, and the pressure bumps that likely form them, not only exist, but are ubiquitous in young protoplanetary disks (Huang et al., 2018).
These dust rings are a natural site for planetesimal formation. In Carrera et al. (2021a, b) we used 3D simulations (particles + gas) to show that even a fairly small pressure bump can accumulate cm-sized dust grains sufficiently to trigger planetesimal formation. However, it is notable that the particle sizes observed by ALMA are closer to the mm-size range (Huang et al., 2018). This observation might merely indicate that larger grains have been effectively converted into planetesimals, and there is indeed some tentative evidence that that might be the case, since planetesimal formation seems to explain the relatively uniform optical depths in dust rings (Stammler et al., 2019). Or the maximum grains size may truly be mm — observations of polarized and continuum dust emission from Ophiuchus IRS 48 are consistent with either an optically thin disk with both sub-mm and 5cm grains, or an optically thick disk with sub-mm grains only (Ohashi et al., 2020). Thus, it is critically important that we understand whether or how planetesimal formation can occur from dust grains no larger than mm. This paper serves that need.
1.1 Barriers to Planet Formation
Planet formation occurs in the circumstellar disks that surround young stars. It begins with the coagulation of micrometer-sized dust particles into larger grains. However, this growth is quickly impeded by numerous growth barriers. As particles grow larger, their collision speeds increase (Weidenschilling, 1984; Ormel & Cuzzi, 2007). At some point, at around mm-cm size, collisions between particles are more likely to lead to bouncing or fragmentation rather than growth (Blum & Wurm, 2008; Güttler et al., 2010; Zsom et al., 2010). In addition, particles also experience a headwind because the gas component of the disk orbits at a slightly sub-Keplerian speed thanks to its radial pressure support. The difference between the Keplerian speed of the particles and the azimuthal gas velocity is
| (1) | |||||
| (2) |
where is the sound speed and is the gas pressure (Nakagawa et al., 1986). This headwind induces radial drift on the particles due to aerodynamic drag. The rate of radial drift is
| (3) |
(Weidenschilling, 1977) where the is the Stokes number, or the particle stopping time in units of the Keplerian frequency
1.2 Overcoming Barriers: Streaming Instability
Perhaps the biggest open question in planet formation is how dust particles overcome the fragmentation, bouncing, and radial drift barriers to form planetesimals. Planetesimals are the km bodies that are thought to be the building blocks of planets. The most promising formation scenario is that planetesimals form through some form of gravitational instability (GI) of small mm-cm grains. For example, Goldreich & Ward (1973) suggested that solids might sediment into a very thin dust layer at the midplane that would then become gravitationally unstable. However, it was soon realized that the dust layer would be Kelvin-Helmholtz unstable and the turbulence induced by the Kelvin-Helmholtz instability would impede further sedimentation (Weidenschilling, 1980).
Today, most models of planetesimal formation rely on some aerodynamic process to concentrate particles in a small region until the local particle density exceeds the Roche density
| (5) |
so that the dust becomes gravitationally unstable. Some prominent examples include the accumulation of dust in axisymmetric pressure bumps in the disk (e.g., Taki et al., 2016; Dullemond et al., 2018; Stammler et al., 2019; Carrera et al., 2021a), MHD zonal flows (e.g., Dittrich et al., 2013; Xu & Bai, 2021), disk photo-evaporation (e.g., Throop & Bally, 2005; Carrera et al., 2017), and trapping dust inside vortices (e.g., Tanga et al., 1996; Cuzzi et al., 2001; Heng & Kenyon, 2010; Raettig et al., 2021). However, the most promising mechanism seems to be the runaway convergence of radial drift known as the streaming instability (SI; Youdin & Goodman, 2005; Johansen & Youdin, 2007). One important piece of evidence in favor of the SI is that the SI seems to reproduce the inclination distribution of binaries in the Kuiper Belt remarkably well (Nesvorný et al., 2019).
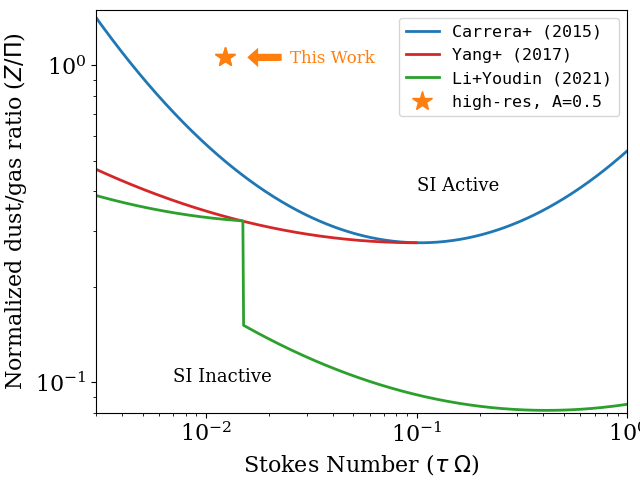
One of the most important things to know about the SI is that it only seems to be an efficient process when the dust-to-gas ratio has already reached some minimum threshold. The SI is most efficient for . For smaller , the critical needed to produce particle densities in excess of rapidly increases to (Carrera et al., 2015; Yang et al., 2017; Li & Youdin, 2021). The next thing to know about the SI is that it is more efficient when the headwind induced by the pressure gradient is lower (Bai & Stone, 2010; Carrera et al., 2015). In fact, Sekiya & Onishi (2018) showed that the overall structure of the particle filaments produced by the SI seems to scale with . This result allows us to re-scale the strong clumping criteria of Carrera et al. (2015); Yang et al. (2017); Li & Youdin (2021) for any pressure profile (see Section 3). Finally, there are theoretical predictions (Chen & Lin, 2020; Umurhan et al., 2020) and numerical models (Gole et al., 2020) that indicate that the SI may have trouble forming planetesimals in turbulent disks, though that seems to depend on the type of turbulence (Yang et al., 2018). A proper study of turbulence is beyond the scope of this work; our runs only have a small amount of turbulence generated by particle streaming at the midplane.
It is quite possible that two or more mechanisms (the SI, pressure bumps, zonal flows, etc.) work together in tandem. After Carrera et al. (2015) identified the dependence of the SI, several authors have sought to combine the SI with some other process that also concentrates particles, such as pressure bumps (Auffinger & Laibe, 2018; Stammler et al., 2019; Carrera et al., 2021a, b), snow lines (Drażkowska & Alibert, 2017), disk photo-evaporation (Carrera et al., 2017), vortices (Regály et al., 2021), and MHD zonal flows (Xu & Bai, 2021).
In this work we follow up on the results of Carrera et al. (2021a, b) who found that, for cm-size particles, pressure bumps reliably create the conditions necessary to trigger planetesimal formation by the SI. Importantly, the pressure bump does not need to be very large, and a particle trap (meaning that particle drift is halted) is not needed to form planetesimals. However, the results for smaller mm-size particles were inconclusive. This is an important limitation because the maximum particle sizes that we observe in ALMA rings may be mm (see discussion above). Thus, it is important to ascertain whether or not planetesimals can form with mm grains only. In this paper we extend the work of Carrera et al. (2021a, b) with a new high-resolution simulation with mm-size grains and a large pressure bump. Our single objective is to determine whether the SI can form planetesimals in a pressure bump out of mm-size grains.
This paper is organized as follows. In section §2 we describe our numerical methods, including our disk model (§2.3), pressure bump model (§2.4), and our simulation setup (§2.5). Our results are presented in section §3. In section §4 we propose a way to interpret our results and suggest a new planetesimal formation criterion. Finally, our summary and conclusions are found in section §5.
2 Numerical methods
We employ identical numerical methods as Carrera et al. (2021a), with different parameters. Readers who are familiar with our previous works may prefer to read the following short text, skip the rest of this section, and continue on to Section 2.5: We conducted local, shearing box simulations with the Athena code that include gas and particles but have no magnetic fields or externally driven turbulence. The gas is treated as a compressible, isothermal fluid, and the particles are Lagrangian super-particles. Particle self-gravity is implemented using a particle-mesh approach with shear-periodic radial boundary conditions. In the rest of this section we summarize our methods. We direct the reader to Carrera et al. (2021a) for additional details.
2.1 Hydrodynamic Solver
We use the Athena code (Stone et al., 2008) in pure hydrodynamic mode with particle feedback and no magnetic fields and an isothermal equation of state . We use the shearing local shearing box approximation, where a patch of the disk is treated as a local Cartesian frame , neglecting disk curvature. The local frame is defined in terms of the disk’s cylindrical coordinates as
where is the center of the box. Athena includes a super-particle approach in which each super-particle is a statistical representation of many smaller particles. All of our runs have the same number of super-particles as there are grid cells. Super-particle is governed by an equation of motion:
| (6) | |||||
The prime denotes a frame in which the background shear velocity has been subtracted. The term is responsible for inward radial drift due to aerodynamic drag. The term represents particle self-gravity. The size of the timestep is set by the Courant condition, and is typically for a resolution. We use the same methods as Simon et al. (2016) to solve the Poisson equation — we use a triangular shaped cloud (TSC) scheme to map the mass density of particles to grid cells and use a Fast Fourier Transform to solve the Poisson equation,
| (7) | |||||
| (8) |
We calculate by a central finite difference and then interpolate to the locations of the particles via TSC. For more details we refer the reader to Simon et al. (2016).
2.2 Boundary Conditions
The boundary conditions are the same for the gas and particle components: shearing-periodic in the radial dimension (Hawley et al., 1995), periodic in azimuth, and a modified outflow boundary in the vertical dimension in which gas density is extrapolated into the ghost zones using an exponential function (Simon et al., 2011; Li et al., 2018). The modified outflow boundary condition will not entirely prevent gas mass loss along the vertical boundary. To ensure that mass is globally conserved, we renormalize the gas density in every cell at every time step to keep the total gas mass constant. As for the particles, we verify that no particles escape the simulation box through the vertical boundaries. Li et al. (2018) tested the effect of different vertical boundary conditions (vBC), and found that the outflow vBC produced less stirring of the particle layer for small boxes (), but for a large box such as ours () all their choices of vBC produced essentially the same results.
The gravitational potential has the same boundary conditions in the radial and azimuthal directions as the gas and particles. However, the vertical boundary conditions are open with the potential in the ghost zones calculated via a third order extrapolation.
2.3 Disk Structure
The simulation box is centred at AU for a disk with surface density and temperature given by
| (9) | |||||
| (10) |
where and AU. The temperature corresponds to an optically thin disk. The stellar mass is set to . The disk is slightly flared, with aspect ratio
| (11) |
where is the isothermal sound speed and is the Keplerian orbital speed. We begin with a vertically stratified Gaussian gas density profile. The gas density is uniform along apart from small random initial perturbations. The initial concentration of solids is
| (12) |
with an initial particle scale height of . We fix the particle size to mm and compute the particle Stokes number dynamically (Equation 4). The background pressure gradient (i.e., not accounting for the pressure bump) is
| (13) |
where is the headwind experienced by solid particles. The strength of self-gravity is set by which corresponds to a Toomre (Toomre, 1964) value of .
2.4 Pressure Bump
Starting with the background gas profile described in the previous section, we gradually form a pressure bump with a Gaussian density profile centered on with width
| (14) |
Given , the azimuthal speed that maintains geostrophic balance is
| (15) |
In all our simulations the bump amplitude starts at zero and grows gradually. To develop and sustain the pressure bump we use the Newtonian relaxation scheme of Carrera et al. (2021a). At each timestep we adjust and by
| (16) | |||||
| (17) |
where is the reinforcement timescale. The Newtonian relaxation scheme is maintained for the duration of the simulation
2.5 Simulation Setup
Our experiment consists of only three simulations:
- high-res,A=0.5
-
Our main experiment is a high-resolution (1000 zones/H) simulation with mm-size particles and a Gaussian pressure bump with amplitude . This is just below the amplitude that would lead to a particle trap ().
- low-res,A=0.5 and low-res,A=0.6
-
Two much lower resolution runs (160 zones/H) with a pressure bump amplitudes of . The low resolution is intended to not resolve the fastest growing modes of the SI, and demonstrate that is just enough to form planetesimals by GI.
In practice, we conducted several low-res runs with different pressure bump amplitudes to find the critical value where low-res started to form planetesimals by the GI. That turned out to be . That became low-res,A=0.6. We then conducted a high-res for a pressure bump amplitude just a step below , and that became high-res,A=0.5. Note that a high-res run with would almost certainly show the GI as well because higher resolution allows for higher particle densities and better resolves the FFT-based gravitational potential.
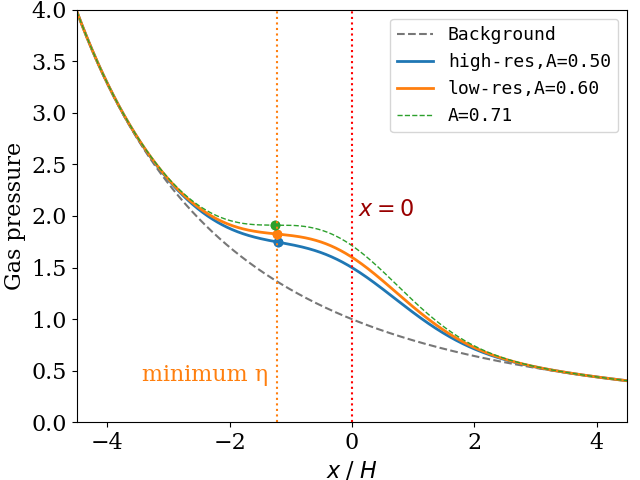
In all cases, the simulation domain is a shearing box with dimensions , where is the gas scale height. Figure 1 shows the pressure density profile for our three simulations ( and ), as well as the background pressure profile. For reference, we also show the profile for the smallest pressure bump that has a true particle trap. Notice also that neither of our three runs have a local pressure maximum, and thus neither have a particle trap. In addition, the point of minimum headwind, where the SI should be most effective, depends weakly on and is offset from the center of the box (at around ).
Lastly, the initial particle distribution is horizontally uniform but normally distributed along the vertical axis, with a particle scale height of . To seed the SI, the positions of the particles are given small random perturbations away from this distribution.
2.6 Resolution and the SI
Our key goal is to determine whether the SI can form planetesimals for mm-size particles. Proving that the SI is not active is challenging because the fastest growing modes of the SI are difficult to resolve. Our high-res run is intended to do just this to the greatest extent possible. The resolution needed to resolve the SI is notoriously difficult to estimate, especially in the non-linear regime. Our best guide is the numerical work of Yang et al. (2017), who saw SI filaments for and a resolution of 640/H. Compared to that work, our runs have higher resolution (1000/H) and larger particles (). Yang et al. (2017) found that higher resolution and larger particle sizes both cause filaments to form earlier. They also found that the largest voids in streaming turbulence scale with . This suggests that the modes of the non-linear regime (and hence, the grid size required) scale with , consistent with the linear regime. For these reasons, we feel confident that high-res,A=0.50 is sufficiently well resolved to capture the SI.
We adopt a higher resolution than Yang et al. (2017) in order to give our high-res run every opportunity to grow the SI as quickly as possible. Because there is no theoretical estimate of the fastest growing wavelength in the non-linear regime and a turbulent medium, we are limited to a back-of-the-envelop estimate based on linear theory in a laminar environment: Within the “resonant-drag instability” regime of the SI, the fastest growing modes are those that satisfy the epicyclic resonant condition (Squire & Hopkins, 2020)
| (18) |
where is the wavenumber, is the dust drift velocity with respect to the gas, and . Nakagawa et al. (1986) showed that . Therefore, the fastest growing mode has wavelength
| (19) |
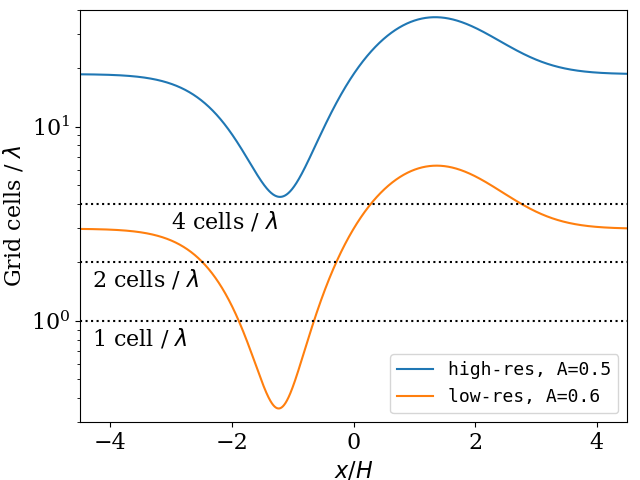
For the sake of simplicity let us assume that . Given our typical particle Stokes number of for mm-size particles and bump amplitude, we compute numerically across the simulation domain.
Figure 2 shows the number of grid cells per across the simulation for our high-res and low-res runs. The figure shows that our high-res run can resolve the fastest growing mode of the SI everywhere with at least four grid cells per . Conversely, the low-res run quite intentionally cannot resolve the fastest growing modes of the SI in the planetesimal formation region. Therefore, if this run forms planetesimals it would potentially be through a non-SI process (see Section 3).
3 Results
Our key results are quite simple:
-
•
The high-res,A=0.5 run never forms planetesimals, or even gets close to the Roche density, despite its high resolution and long runtime.
-
•
The low-res,A=0.6 run forms planetesimals and low-res,A=0.5 does not. Furthermore, we can show that the planetesimals in low-res,A=0.6 form exclusively by the GI.
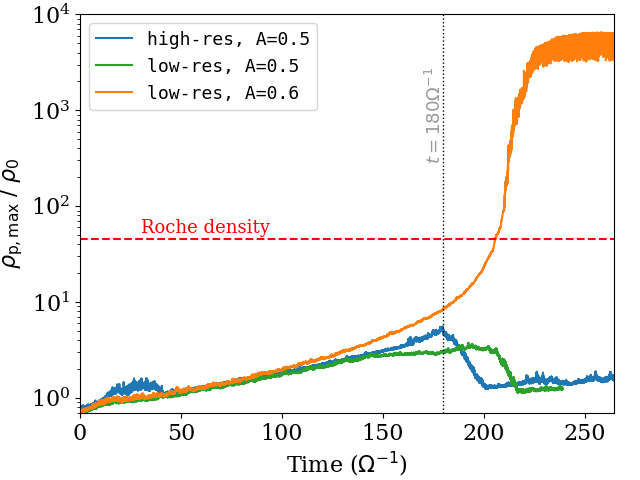
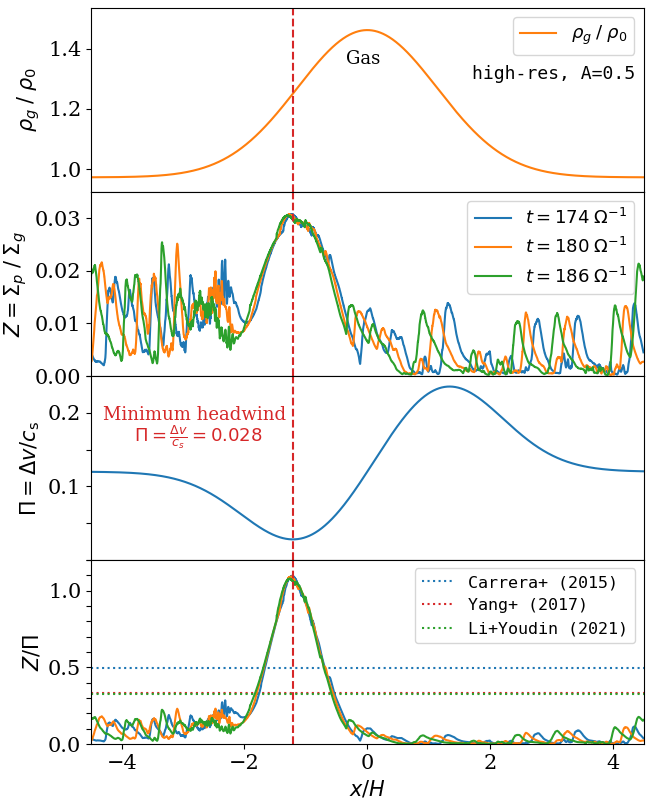
Figure 3 shows the maximum particle density for all of our runs as a function of time. For high-res, A=0.5 the density peaks at (vertical dotted line) at only 12% of the Roche density. Figures 4 and 6 show what is happening in the simulation at around this time. Figure 4 shows the dust-to-gas ratio for three snapshots centered around . Particle feedback forms large scale particle filaments across the entire domain, but we note that these are much wider and less dense structures than the “strong clumping” associated with the SI ( vs Yang et al., 2017).
While particle filaments drift across the simulation, Figure 4 also shows a large steady-state particle pileup around the point with minimum headwind . There, the dust-to-gas ratio reaches at its peak. Sekiya & Onishi (2018) showed that the clumping structure of the SI scales with . In the region within from the peak in has , which gives a normalized dust-to-gas ratio of . For comparison, we also show the strong clumping criteria obtained by Carrera et al. (2015); Yang et al. (2017); Li & Youdin (2021) for this particle size. In addition, Figure 5 shows these criteria in terms of vs . The key take-away is that our high-res simulation has a very prominent peak in that is deep inside the region where the SI would cause strong clumping if the conditions held over an extended radial region of the disk. Yet, our high-res simulation shows no sign of strong clumping. Furthermore, the simulation has run long enough () for filaments to develop (Figure 2 of Li & Youdin, 2021).
The difference in local conditions between our runs and those of Carrera et al. (2015); Yang et al. (2017); Li & Youdin (2021) reflects a limitation of all small-box simulations. They all effectively assume that the particular value of is maintained over an extended region of the disk, which may not translate well to pressure bumps where high is only attained in a small region. Only a high-res large-box simulation like ours can determine whether localized changes to lead to planetesimal formation.
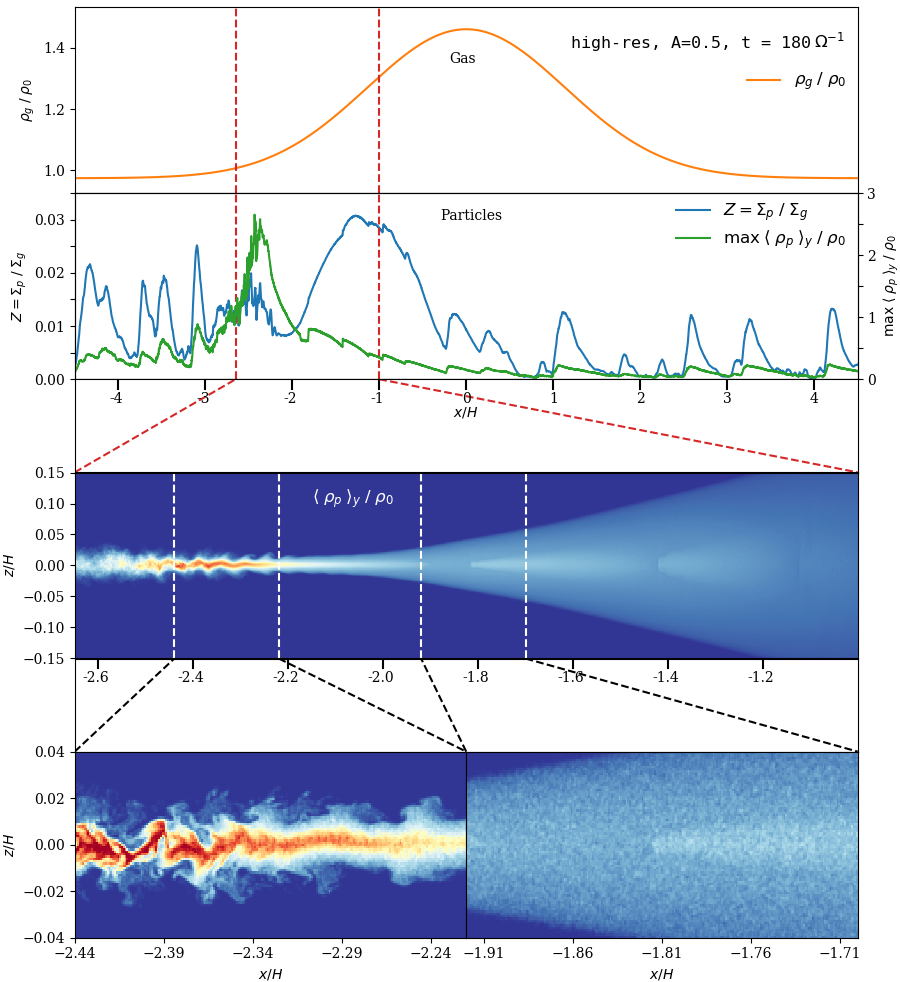
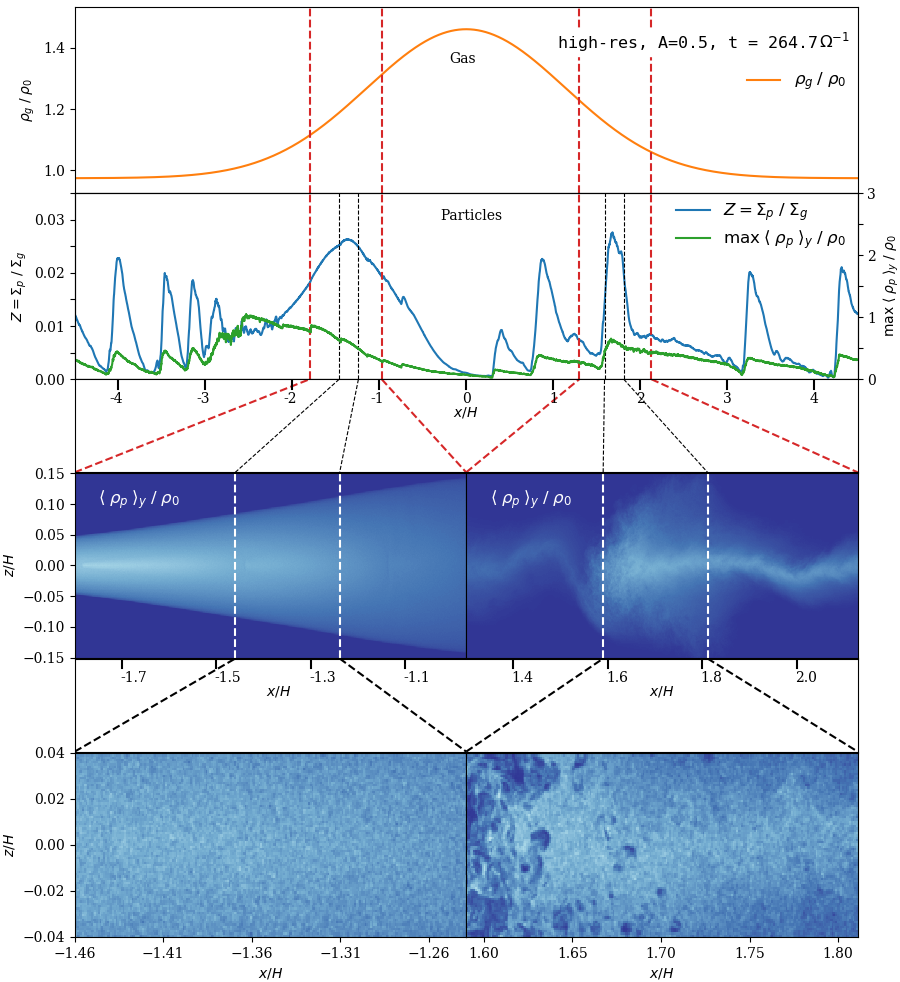
Figure 6 shows the snapshot at in greater detail. The density maximum is not inside the particle pileup; instead, it occurs about downstream, at , and it merely reflects a brief moment when the particles have sedimented to the midplane but turbulence has not fully developed. At one can see features of Kelvin-Helmholtz turbulence around . Using the convention employed by Gole et al. (2020), we calculate that in the active region and near the midplane (), compared to an average of across the entire domain. At later times we see similar features but with a higher particle scale height. After we seem to reach a steady state with no sign of strong clumping (see Fig. 3).
We estimated the total rate of mass loss through the vertical outflow boundaries. This simulation loses around of its total mass per timestep. Most of the outflow occurs in front of the particle filaments. For example, for the snapshot shown in Figure 6, the rate of outflow () occurs at . The active region () actually has one of the lowest rates of outflow (), as the turbulence is heavily concentrated at the midplane.
Figure 7 shows our final snapshot, at . This is later than the time when Li & Youdin (2021) saw clear evidence of filament formation for . At this point the simulation has had time to develop turbulence and seems to have reached something close to a steady state. The value of has decreased slightly to relative to the snapshots in Figure 4, but that value is still times larger than the value where Li & Youdin (2021) found strong clumping under the assumption that these conditions were held over an extended radial region of the disk. In other words, if those results were a predictor of the behavior of the SI in pressure bumps, the SI should be easily visible, yet there is none. This shows that it is difficult to trigger the SI for small particles when high is only attained in a small region. In section §4.1 we discuss the most likely reason why strong clumping failed.
For the sake of completeness, Figure 7 also shows the structure in the densest particle filament (at ), though in that case we do not expect strong clumping because the ratio is quite low.
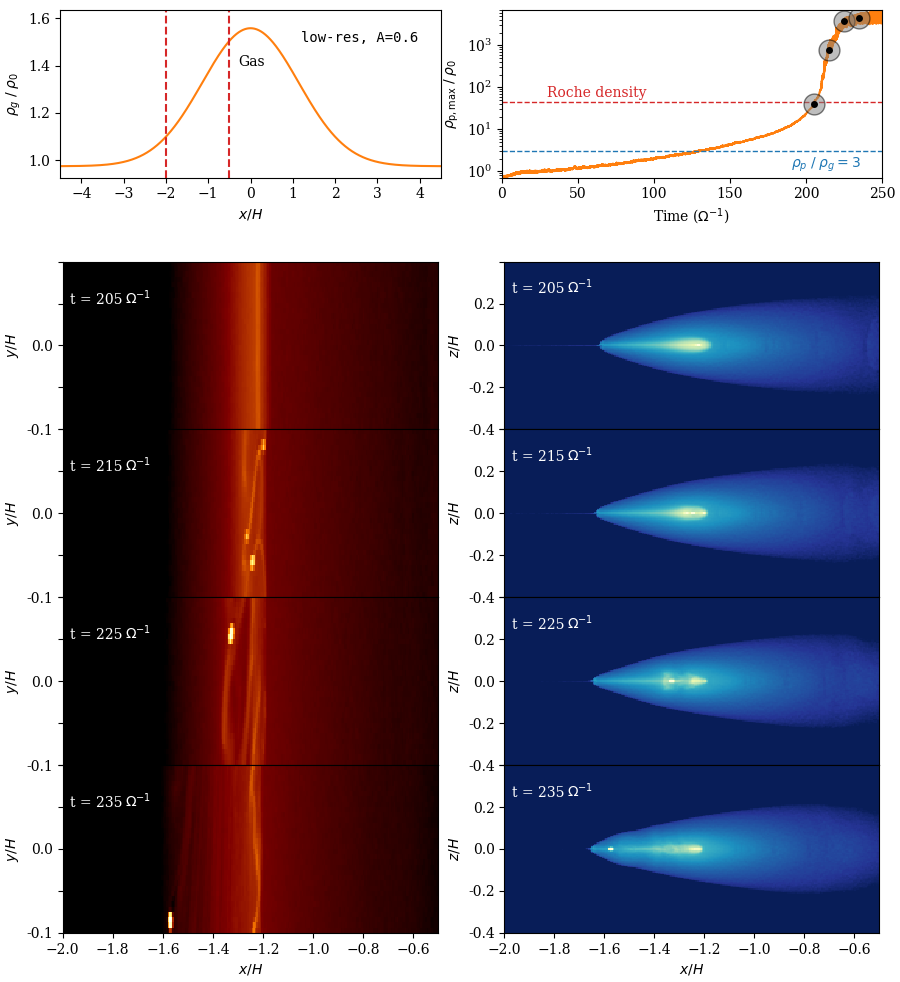
Before conducting the high-res run, we conducted several low-res runs at various amplitudes. We found that low-res,A=0.5 did not form any structures but low-res,A=0.6 did. The purpose of this experiment is to show that any pressure bump much larger than can form GI-unstable particle pileups without the need for the SI. Figure 8 shows four snapshots of low-res,A=0.6. The snapshots start at which is an instant before the maximum particle density reaches the Roche density (). The other snapshots are spaced in even intervals of . The snapshots show the azimuthally and vertically averaged particle density in the region . The top-left plot shows the gas density profile with dashed lines at for reference. The top-right plot shows the maximum particle density versus time, with black circles marking the times when the snapshots are taken.
The snapshots in Figure 8 show that the formation of non-axisymmetric structure exactly coincides with crossing the Roche density. This is a tell tale sign of gravitational instability. This run reaches at (blue dashed line of top-right plot). This is a useful reference point. Yang et al. (2017) conducted a simulation with the same particle size and resolution as low-res with that did not show any clumping after orbits. In contrast, low-res,A=0.6 reaches the Roche density after twelve more orbits (). All this is to show that the planetesimal formation in Figure 8 occurs purely through the GI: A particle trap concentrates solids until the particle density crosses the Roche density.
Is it possible that a higher resolution run with might have shown signs of the SI? Yes, of course. But our primary point is that the SI is not needed. Taken together, these runs prove one thing: for mm-size particles, any pressure bump large enough to form planetesimals by the SI is also large enough to form planetesimals without it.
4 Discussion
4.1 New SI criterion: Residence time
Considering that the high-res simulation reached high values, why did it fail to form planetesimals? The most plausible explanation is that each particle’s residence time inside the high region is shorter than the SI growth timescale. Once particles finish crossing the density peak, any progress toward SI filaments is essentially forgotten.
This suggests a new criterion for the SI: . Let be the width of a region in a protoplanetary disk with suitable for planetesimal formation. The particle crossing time is , where ,
| (20) |
is the particle drift rate (Weidenschilling, 1977). In the case of our high-res simulation we have , and the density peak is roughly wide with . That works out to a nominal crossing time of . This value is comparable to the time needed for SI filaments to become visible for this particle size (Yang et al., 2017; Li & Youdin, 2021). One additional complication is that in our simulations, and in any scenario where an external force applies a torque on the gas, the particle drift rate may be affected by that torque as well (Carrera et al., 2021b). In our high-res run the particle drift rate across the region is times higher than in the above estimate. Therefore, the particle residency time in the high region in high-res is significantly smaller than the growth time of the SI for this particle size.
4.2 Can the SI win against GI for ?
In other words, if low-res,A=0.6 had instead had a much higher resolution, would we have seen the SI form dense particle filaments before the GI took over? We can use our residence time criterion to make an educated guess. At its minimum, , and within we have a mean value of . That works out to about half of the drift rate as for and a crossing time of , before taking into account any acceleration due to the external torque on the bump. If we assume that the crossing time is not much shorter than , then our proposed SI criterion would be met — according to Li & Youdin (2021) the timescale of filaments is around . However, the SI might not outpace the GI. In low-res,A=0.6, the Roche density is reached at around the anyway. Considering that there is some delay between the beginning of the simulation and reaching the needed for the SI, there does not seem to be enough time for the SI to act before the GI forms planetesimals.
4.3 Are these pressure bumps Rossby-wave unstable?
Indeed, they very well might be. In Carrera et al. (2021a) we calculated that the largest Rossby-wave stable pressure bump is probably not much larger than . The ones in this paper are significantly larger than that. But this only serves to make the situation more precarious for the SI and mm-size grains. We pushed the bump past the RWI limit, right to the edge of the GI, and still the SI could not produce strong clumping for mm grains. A more realistic (i.e., smaller) pressure bump would have concentrated particles less and would have retained stronger headwind .
4.4 Should we run high-res,A=0.5 longer?
It is possible that if we were to prolong high-res, strong clumping might appear later. Indeed, Yang et al. (2017) showed that increasing resolution and increasing the runtime led to strong clumping for lower than was seen in Carrera et al. (2015). Comparing our total runtime of to past works we find that at that point filaments were clearly visible in Li & Youdin (2021) but barely visible for Yang et al. (2017). Considering that our particle size is slightly larger, our resolution is higher, our is much larger, and our is much smaller, we feel that evidence for strong clumping should have appeared by now.
Importantly, there is a strong argument against prolonging the simulation: It might create artefacts. More specifically, this simulation has already run long enough to allow particles to cross the entire box. Running a simulation for much longer than the box crossing time would allow particles to wrap around the simulation box multiple times. This might lead to artefacts and unphysical results. For example, allowing particles to wrap around the box multiple times would imply that particles go through a chain of large pressure bumps that cover most of the disk. While indeed observations show the presence of multiple bumps, as the particles drift inward toward regions of higher gas density, the Stokes number should decrease. This is not captured in our local setup.
Clearly, the next step is not to prolong high-res but to move the simulation out of the shearing frame and into a global disk model.
5 Summary and Conclusions
In this paper we have tested the limits of planetesimal formation. Our high-res,A=0.5 simulation is the highest-resolution 3D simulation of the SI performed to date. In it, we inserted a population of mm-size dust grains and the largest axisymmetric pressure bump that is just shy of the size that would lead to a gravitational instability in the dust. Our key result is simple:
- •
-
•
We did not observe any strong clumping nor planetesimal formation.
The likely reason is that the region with high- (i.e., the region conductive to the SI) is narrow and the particle crossing time across this region is shorter than the growth timescale of the SI . Whatever progress the particles make toward strong clumping is lost when they leave the high- particle pileup induced by the bump. This points to an additional criterion for planetesimals to form by the SI: — i.e., the residence time of particles within a high- region must be long enough to allow the SI to develop filaments.
This result significantly limits the possible pathways for planet formation:
-
•
Either protoplanetary disks routinely form grains larger than 1 mm,
-
•
The popular model in which planetesimals form when an axisymmetric pressure bump triggers the SI is incorrect.
For example, one possible alternative is that planetesimals form in vortices (e.g., Barge & Sommeria, 1995; Lyra et al., 2015; Raettig et al., 2021). Either way, our results call for taking a hard look at how we understand planet formation, and at the computer models we use to study it. Our results also highlight the importance of future instruments, such as the ngVLA, that can determine whether cm-size grains are abundant at large distances from the star. (Morbidelli & Nesvorný, 2020)
References
- ALMA Partnership et al. (2015) ALMA Partnership, Brogan, C. L., Pérez, L. M., et al. 2015, ApJ, 808, L3, doi: 10.1088/2041-8205/808/1/L3
- Auffinger & Laibe (2018) Auffinger, J., & Laibe, G. 2018, MNRAS, 473, 796, doi: 10.1093/mnras/stx2395
- Bai & Stone (2010) Bai, X.-N., & Stone, J. M. 2010, ApJ, 722, L220, doi: 10.1088/2041-8205/722/2/L220
- Bai & Stone (2014) —. 2014, ApJ, 796, 31, doi: 10.1088/0004-637X/796/1/31
- Barge & Sommeria (1995) Barge, P., & Sommeria, J. 1995, A&A, 295, L1. https://arxiv.org/abs/astro-ph/9501050
- Birnstiel et al. (2012) Birnstiel, T., Klahr, H., & Ercolano, B. 2012, A&A, 539, A148, doi: 10.1051/0004-6361/201118136
- Blum & Wurm (2008) Blum, J., & Wurm, G. 2008, ARA&A, 46, 21, doi: 10.1146/annurev.astro.46.060407.145152
- Carrera et al. (2017) Carrera, D., Gorti, U., Johansen, A., & Davies, M. B. 2017, ApJ, 839, 16, doi: 10.3847/1538-4357/aa6932
- Carrera et al. (2015) Carrera, D., Johansen, A., & Davies, M. B. 2015, A&A, 579, A43, doi: 10.1051/0004-6361/201425120
- Carrera et al. (2021a) Carrera, D., Simon, J. B., Li, R., Kretke, K. A., & Klahr, H. 2021a, AJ, 161, 96, doi: 10.3847/1538-3881/abd4d9
- Carrera et al. (2021b) Carrera, D., Thomas, A., Simon, J. B., et al. 2021b, arXiv e-prints, arXiv:2108.08315. https://arxiv.org/abs/2108.08315
- Chen & Lin (2020) Chen, K., & Lin, M.-K. 2020, The Astrophysical Journal, 891, 132, doi: 10.3847/1538-4357/ab76ca
- Cuzzi et al. (2001) Cuzzi, J. N., Hogan, R. C., Paque, J. M., & Dobrovolskis, A. R. 2001, ApJ, 546, 496, doi: 10.1086/318233
- Dittrich et al. (2013) Dittrich, K., Klahr, H., & Johansen, A. 2013, ApJ, 763, 117, doi: 10.1088/0004-637X/763/2/117
- Drażkowska & Alibert (2017) Drażkowska, J., & Alibert, Y. 2017, A&A, 608, A92, doi: 10.1051/0004-6361/201731491
- Dullemond et al. (2018) Dullemond, C. P., Birnstiel, T., Huang, J., et al. 2018, ApJ, 869, L46, doi: 10.3847/2041-8213/aaf742
- Goldreich & Ward (1973) Goldreich, P., & Ward, W. R. 1973, ApJ, 183, 1051, doi: 10.1086/152291
- Gole et al. (2020) Gole, D. A., Simon, J. B., Li, R., Youdin, A. N., & Armitage, P. J. 2020, The Astrophysical Journal, 904, 132, doi: 10.3847/1538-4357/abc334
- Güttler et al. (2010) Güttler, C., Blum, J., Zsom, A., Ormel, C. W., & Dullemond, C. P. 2010, A&A, 513, A56, doi: 10.1051/0004-6361/200912852
- Hawley et al. (1995) Hawley, J. F., Gammie, C. F., & Balbus, S. A. 1995, ApJ, 440, 742, doi: 10.1086/175311
- Heng & Kenyon (2010) Heng, K., & Kenyon, S. J. 2010, MNRAS, 408, 1476, doi: 10.1111/j.1365-2966.2010.17208.x
- Huang et al. (2018) Huang, J., Andrews, S. M., Dullemond, C. P., et al. 2018, ApJ, 869, L42, doi: 10.3847/2041-8213/aaf740
- Johansen & Youdin (2007) Johansen, A., & Youdin, A. 2007, The Astrophysical Journal, 662, 627
- Johansen et al. (2009) Johansen, A., Youdin, A., & Klahr, H. 2009, ApJ, 697, 1269, doi: 10.1088/0004-637X/697/2/1269
- Li & Youdin (2021) Li, R., & Youdin, A. 2021, arXiv e-prints, arXiv:2105.06042. https://arxiv.org/abs/2105.06042
- Li et al. (2018) Li, R., Youdin, A. N., & Simon, J. B. 2018, ApJ, 862, 14, doi: 10.3847/1538-4357/aaca99
- Lyra et al. (2015) Lyra, W., Turner, N. J., & McNally, C. P. 2015, A&A, 574, A10, doi: 10.1051/0004-6361/201424919
- Morbidelli & Nesvorný (2020) Morbidelli, A., & Nesvorný, D. 2020, in The Trans-Neptunian Solar System, ed. D. Prialnik, M. A. Barucci, & L. Young, 25–59, doi: 10.1016/B978-0-12-816490-7.00002-3
- Nakagawa et al. (1986) Nakagawa, Y., Sekiya, M., & Hayashi, C. 1986, Icarus, 67, 375, doi: 10.1016/0019-1035(86)90121-1
- Nesvorný et al. (2019) Nesvorný, D., Li, R., Youdin, A. N., Simon, J. B., & Grundy, W. M. 2019, Nature Astronomy, 3, 808, doi: 10.1038/s41550-019-0806-z
- Ohashi et al. (2020) Ohashi, S., Kataoka, A., van der Marel, N., et al. 2020, ApJ, 900, 81, doi: 10.3847/1538-4357/abaab4
- Ormel & Cuzzi (2007) Ormel, C. W., & Cuzzi, J. N. 2007, A&A, 466, 413, doi: 10.1051/0004-6361:20066899
- Pinilla et al. (2012) Pinilla, P., Birnstiel, T., Ricci, L., et al. 2012, A&A, 538, A114, doi: 10.1051/0004-6361/201118204
- Raettig et al. (2021) Raettig, N., Lyra, W., & Klahr, H. 2021, ApJ, 913, 92, doi: 10.3847/1538-4357/abf739
- Regály et al. (2021) Regály, Z., Kadam, K., & Dullemond, C. P. 2021, MNRAS, 506, 2685, doi: 10.1093/mnras/stab1846
- Sándor et al. (2011) Sándor, Z., Lyra, W., & Dullemond, C. P. 2011, ApJ, 728, L9, doi: 10.1088/2041-8205/728/1/L9
- Sekiya & Onishi (2018) Sekiya, M., & Onishi, I. K. 2018, ApJ, 860, 140, doi: 10.3847/1538-4357/aac4a7
- Simon & Armitage (2014) Simon, J. B., & Armitage, P. J. 2014, ApJ, 784, 15, doi: 10.1088/0004-637X/784/1/15
- Simon et al. (2016) Simon, J. B., Armitage, P. J., Li, R., & Youdin, A. N. 2016, ApJ, 822, 55, doi: 10.3847/0004-637X/822/1/55
- Simon et al. (2011) Simon, J. B., Hawley, J. F., & Beckwith, K. 2011, ApJ, 730, 94
- Squire & Hopkins (2020) Squire, J., & Hopkins, P. F. 2020, arXiv e-prints, arXiv:2003.01738. https://arxiv.org/abs/2003.01738
- Stammler et al. (2019) Stammler, S. M., Drażkowska, J., Birnstiel, T., et al. 2019, ApJ, 884, L5, doi: 10.3847/2041-8213/ab4423
- Stone et al. (2008) Stone, J. M., Gardiner, T. A., Teuben, P., Hawley, J. F., & Simon, J. B. 2008, ApJS, 178, 137, doi: 10.1086/588755
- Taki et al. (2016) Taki, T., Fujimoto, M., & Ida, S. 2016, A&A, 591, A86, doi: 10.1051/0004-6361/201527732
- Tanga et al. (1996) Tanga, P., Babiano, A., Dubrulle, B., & Provenzale, A. 1996, Icarus, 121, 158, doi: 10.1006/icar.1996.0076
- Throop & Bally (2005) Throop, H. B., & Bally, J. 2005, ApJ, 623, L149, doi: 10.1086/430272
- Toomre (1964) Toomre, A. 1964, ApJ, 139, 1217, doi: 10.1086/147861
- Umurhan et al. (2020) Umurhan, O. M., Estrada, P. R., & Cuzzi, J. N. 2020, The Astrophysical Journal, 895, 4, doi: 10.3847/1538-4357/ab899d
- Weidenschilling (1977) Weidenschilling, S. J. 1977, MNRAS, 180, 57, doi: 10.1093/mnras/180.1.57
- Weidenschilling (1980) —. 1980, Icarus, 44, 172, doi: 10.1016/0019-1035(80)90064-0
- Weidenschilling (1984) —. 1984, Icarus, 60, 553, doi: 10.1016/0019-1035(84)90164-7
- Xu & Bai (2021) Xu, Z., & Bai, X.-N. 2021, arXiv e-prints, arXiv:2108.10486. https://arxiv.org/abs/2108.10486
- Yang et al. (2017) Yang, C. C., Johansen, A., & Carrera, D. 2017, A&A, 606, A80, doi: 10.1051/0004-6361/201630106
- Yang et al. (2018) Yang, C.-C., Mac Low, M.-M., & Johansen, A. 2018, ApJ, 868, 27, doi: 10.3847/1538-4357/aae7d4
- Youdin & Goodman (2005) Youdin, A. N., & Goodman, J. 2005, The Astrophysical Journal, 620, 459–469, doi: 10.1086/426895
- Zsom et al. (2010) Zsom, A., Ormel, C. W., Güttler, C., Blum, J., & Dullemond, C. P. 2010, A&A, 513, A57, doi: 10.1051/0004-6361/200912976