The fast neutron induced fission of 240Pu and 242Pu
Abstract
We report the measurement of the TKE release in the fast neutron induced fission of 240Pu and 242Pu. The results are compared to the predictions of the GEF model, the CGMF model, and the model of Denisov and Sedykh as well as previous experimental work on these reactions. Our absolute measurements of the TKE release are in good agreement with the previous measurements of Nethaway et al. for the interaction of 14.8 MeV neutrons with 240Pu Nethaway et al. (1977) and of Winkelmann and Aumann for the interaction of 15 MeV neutrons with 242Pu Winkelmann and Aumann (1984). The general trends of the measured TKE values agree with phenomenological models but the variances of the TKE distributions are significantly less than predicted by various models. The mean post neutron emission TKE release decreases non- linearly with increasing neutron energy and can be represented as TKE(MeV) = 175.8 0.3 - (2. 4 0.8)log10En - (1.4 0.4)log10E for 240Pu and TKE(MeV) = 177.1 0.3 - (1.2 0.9)log10En - (1.8 0.5)log10E for 242Pu.
I Introduction
Nearly 80 of the total prompt energy release in fission occurs in the form of the total kinetic energy (TKE) of the fragments Unik and Gindler . Fission is a large scale collective motion of a few hundred nucleons and as such, represents a challenge to understand. The magnitude of the TKE release in fission depends on the Coulomb repulsion between the nascent fragments at scission and the conversion of the fragment motion at scission into kinetic energy. TKE is thus an important fundamental feature of the fission process that helps to describe the large scale collective motion of the nucleus. There are practical applications of these processes as the kinetic energies of the fragments are important in the design of nuclear weapons and fast-spectrum nuclear reactors.
I.1 Previous work on the TKE release in fission
The TKE release has been measured for various cases of spontaneous fission, thermal neutron induced fission, and energetic fission Younes and Loveland (2022). General information about the TKE release in the neutron induced fission of 235U, 238U and 239Pu for En 20 MeV is discussed in the work of Madland Madland (2006) and Lestone and Strother Lestone and Strother (2014). Additionally, TKE, fragment mass distributions, and other neutron induced fission observables for 232Th King et al. (2017); Maslov (2007) , 233U Higgins et al. (2020); Liu et al. (2021) , 238U Duke et al. (2016); Maslov et al. (2011), 237Np Pica et al. (2020), 239Pu Meierbachtol et al. (2016); Chemey et al. (2020); Liu et al. (2021); Maslov et al. (2011) have been reported. The number and scope of studies detailing the induced fission of 240Pu or 242Pu remains extremely limited; these studies are summarized in Table 1.
| Reaction | En[MeV] | Reference |
|---|---|---|
| 240Pu(n,f) | 1.3 | Vorobeva et al. (1974a) |
| 240Pu(n,f) | 14.8 | Nethaway et al. (1977) |
| 242Pu(n,f) | 1.10 | Vorobeva et al. (1974a) |
| 242Pu(n,f) | 15.1 | Winkelmann and Aumann (1984) |
| 242Pu(p,f) | 13, 20, 55 | Rubchenya et al. (2004) |
In Section II of this paper, we discuss the experimental methods used while in Section III we report the results of the measurements and discuss the implications of our data in comparison with current theoretical models of fission. We present our conclusions in Section IV.
II Experimental Details
II.1 Overview of Experiment
This experiment was carried out using the 15R beam line at the Los Alamos National Laboratory, Los Alamos Neutron Science Center at the Weapons Neutron Research (LANSCE-WNR) facility over a 19 day period in November-December 2021. The experimental arrangements were the same as that used in our previous studies Pica et al. (2020); Chemey et al. (2020) of the fast neutron induced fission of 237Np and 239Pu . “White spectrum” neutron beams were generated from an unmoderated tungsten spallation source using the 800 MeV proton beam from the LANSCE linear accelerator. The experiment was located on the 15R beam line (15o-right with respect to the proton beam). The fast neutron beam intensities were 105 - 106/s for En = 2 - 100 MeV. The proton beam is pulsed allowing one to measure the time of flight (energy) of the neutrons arriving at the experimental area. The proton beam consists of a 625 s macropulse containing about 340 micropulses of width 250 ps that are spaced 1.8 s apart. The macropulses had a repetition rate of 100 Hz. With neutron beam intensities 105-106 n/s, one must use large solid angles for the detectors or long observation times or both to obtain statistically meaningful data. The total times for the irradiation of 240Pu and 242Pu were 6.5 and 12.8 days, respectively.
II.2 Neutron beam/general setup
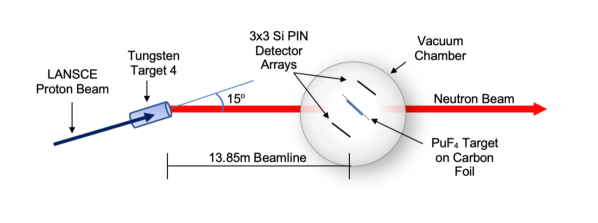
The spallation neutrons from the LANSCE tungsten target traversed a 13.85 m flight path to the target position of our scattering chamber. The neutron beam was collimated to a 1.0 cm diameter at the entrance to the experimental area. A fission ionization chamber Wender et al. (1993) was used to continuously monitor the absolute neutron beam intensities. The targets and the fission detectors were housed in an evacuated, thin- walled aluminum scattering chamber. The scattering chamber was located 84 cm from the collimator, and 14 m from the neutron beam dump. A rough sketch of the experimental setup is shown in Figure 1.
II.3 Targets
The 240Pu and 242Pu targets were prepared by vapor deposition using the method described in Silveira et al. (2020). The targets consisted of 2 cm diameter circular deposits of the Pu isotope on a thin C backing. The target thicknesses were 72.3 g/cm2 (240Pu) and 63.0 g/cm2 (242Pu) (as measured by alpha spectroscopy). The source material for the 240Pu target was 99.874 weight percent 240Pu and the 242Pu target was 99.964 weight percent 242Pu. The assumed chemical composition of the targets was that of PuF4. The C backing thickness was 100 g/cm2. The targets were at an angle of 45o with respect to the incident beam.
II.4 Fission detectors
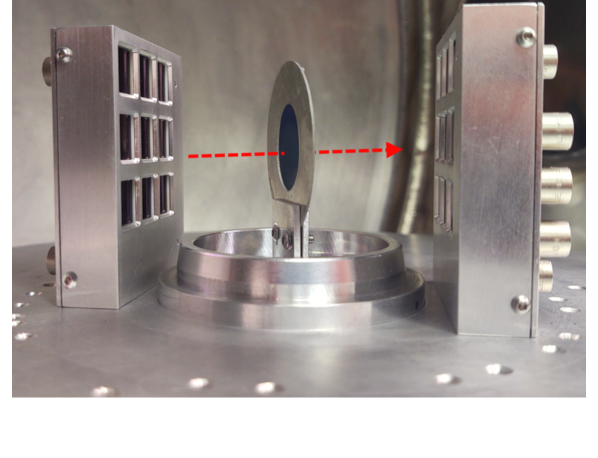
Fission fragments were detected by 9 pairs of 1 cm2 Si PIN diode detectors (Hamamatsu S3590-09) positioned 3.5 cm from the target as shown in Figure 2. The time of flight of each interacting neutron was measured using a timing pulse from a Si PIN diode and the accelerator RF signal. The distance from the spallation target to the Pu targets was measured to be 1384.9 1.1 cm. The position of the photo-fission peak in the time of flight spectrum was measured to have an uncertainty less than 2‘. The neutron energies were calculated using relativistic relationships from the distance traveled by the neutrons, the mid-point of the photo-fission peak in the fission time of flight spectrum and the observed time difference between the neutron timing signal and the accelerator RF signal. The uncertainties from each of the components of the neutron energy were added in quadrature as uncorrelated uncertainties to determine the final uncertainty in the measured neutron energy. The neutron energies were thus determined with an uncertainty of 2 . The neutron energies were generally binned logarithmically to give bins of equal associated uncertainty in the neutron energy. The width of these bins give the neutron energy resolution of our measurements.
II.5 The 2E Method
Determination of TKE and fission product masses must include considerations for the many complex phenomena occurring during the fission process such as multichance fission, pre-scission neutron emission, and prompt neutron evaporation. To account for these phenomena we use the 2E method to calculate fission product masses based on their kinetic energies within a momentum conserving framework. (We use the convention that the term ”fission fragments” refers to pre-neutron emission while the term “fission product” refers to post neutron emission Madland (2006).)
Due to the subfemtosecond timescale of neutron evaporation and the nanosecond flight times of fragments hitting detectors, we detect the kinetic energies of the post-evaporation products. An iterative procedure is employed to calculate pre-neutron evaporation fragment masses on an event-by-event basis. Conservation of momentum and nucleon number dictate:
| (1) |
| (2) |
| (3) |
where represents the heavy fragment, represents the light fragment, CN represents the compound nucleus, and “ “ indicates a quantity that pertains to pre-neutron emission. A is the mass of fragment i. A (E) and post neutron Ai (Ei) are related through
| (4) |
where is the post fission prompt neutron multiplicity calculated from the General Description of Fission Observables (GEF) model Schmidt and Jurado (2021); Schmidt et al. (2016a) or the Cascade Gamma Multiplicities from Fission (CGMF) model Talou et al. (2021). Assuming isotropic neutron emission (which leaves the average fragment velocities unaffected by neutron emission), the post-neutron energy is calculated by:
| (5) |
which, re-written using equation (4) is
| (6) |
Combining equations (1-5) we get the following relation between pre- and post-neutron masses:
| (7) |
| (8) |
If we assume no neutron emission, the provisional fragment mass , can be calculated by simplifying equation (7) to:
| (9) |
Once are calculated, they are compared to the pre-neutron evaporation fragment masses of the previous iteration. Corrections for PHD, the pulse-height defect, and energy loss of fragments in the target and backing foils are also applied to this iterative procedure. This continues until and have converged to the pre-neutron fragment masses, defined here as an iterative mass difference of less than 0.1 u.
As previously mentioned, the GEF and CGMF models were used to quantify the impact of multichance fission. Multichance fission occurs when the excitation energy of the compound nucleus is greater than the neutron separation energy. If this condition is met, the compound nucleus can emit pre-scission neutrons which lowers the available energy to transfer to the fragments at scission. Due to the phenomenon of multichance fission an ensemble of nuclides contributes to the overall fission observables. The contributions of each CN as predicted by GEF in the multichance fission chain for the 240,242Pu (n,f) reaction are given in Tables 2 and 3 Schmidt and Jurado (2021).
| En[MeV] | 241 | 240 | 239 | 238 | 237 | 236 | 235 | 234 |
|---|---|---|---|---|---|---|---|---|
| 0.8 | 100 | - | - | - | - | - | - | - |
| 1.2 | 100 | - | - | - | - | - | - | - |
| 1.8 | 100 | - | - | - | - | - | - | - |
| 2.6 | 100 | - | - | - | - | - | - | - |
| 3.8 | 100 | - | - | - | - | - | - | - |
| 6.0 | 78 | 22 | - | - | - | - | - | - |
| 9.5 | 53 | 47 | - | - | - | - | - | - |
| 17.9 | 21 | 44 | 33 | - | - | - | - | - |
| 36.3 | 7 | 21 | 26 | 30 | 16 | - | - | - |
| 73.4 | 1 | 6 | 9 | 14 | 17 | 21 | 21 | 11 |
| En[MeV] | 243 | 242 | 241 | 240 | 239 | 238 | 237 | 236 | 235 |
|---|---|---|---|---|---|---|---|---|---|
| 0.9 | 100 | - | - | - | - | - | - | - | - |
| 1.3 | 100 | - | - | - | - | - | - | - | - |
| 1.9 | 100 | - | - | - | - | - | - | - | - |
| 2.8 | 100 | - | - | - | - | - | - | - | - |
| 4.2 | 100 | - | - | - | - | - | - | - | - |
| 6.7 | 49 | 51 | - | - | - | - | - | - | - |
| 11.2 | 43 | 57 | - | - | - | - | - | - | - |
| 21.9 | 15 | 30 | 38 | 17 | - | - | - | - | - |
| 42.5 | 4 | 12 | 18 | 24 | 27 | 25 | - | - | - |
| 76.5 | 1 | 3 | 6 | 10 | 14 | 18 | 20 | 21 | 7 |
II.6 PHD and Fragment Energy Loss
We measured, on an event-by-event basis, the pulse heights of coincident fission fragments to determine their energies. However, incomplete charge collection, recombination, and non-ionizing collisions lead to unavoidable pulse height defects. Individual detectors were calibrated by the Schmitt method Schmitt et al. (1966) with a spontaneously-fissioning 252Cf source, using the updated Weissenberger calibration parameters Weissenberger et al. (1986). Pulse height defect varies with energy and mass of fission fragment, and must furthermore be inferred for each individual detector. For Si surface barrier detectors, the magnitude of the PHD generally ranges from 3-13 MeV Ogihara et al. (1986); Kitahara et al. (1982); Kaufman et al. (1974). PHD is mass- and energy-dependent, and is only implicitly known from detector energy calibration by the Schmitt method. The approximate PHD for our PIN diode array was 4.8-7.7 MeV, as obtained from the constant-offset term of the energy calibration Schmitt et al. (1966). This is consistent with analyses that resolve both energy and mass of implantations Knoll (2000). The energy loss of the fission products in the target deposit and the carbon foil were calculated using the Northcliffe-Schilling tables and assuming that the fission event took place in the middle of target Northcliffe and Schilling (1970). The linear momentum transfer (LMT) was parameterized using data from the 239Pu(n,f) reaction and fit from En = 7-120 MeV Hensle (2019); Hensle et al. (2020). For En 7 MeV, LMT was assumed to be 100 .
II.7 Neutron Multiplicity
The compound nucleus is cooled considerably by the emission of pre-equilibrium and pre-scission neutrons. Our experimental apparatus measures the kinetic energies of coincident fission products. To deduce the mass and energy of the fission fragments we must account for prompt neutron emission. To a good approximation, the total excitation energy of a given fission fragment is the sum of the total available intrinsic excitation energy at scission, and the distortion energy of the fragment at scission. The sum of these two contributions determines the energy available for neutron evaporation. Experimental data outlining the behavior of prompt neutron emission, , is extremely scarce for many isotopes at any . Accordingly, most studies of this nature utilize Monte-Carlo simulations of fission fragment de-excitation after scission to determine average neutron multiplicity.
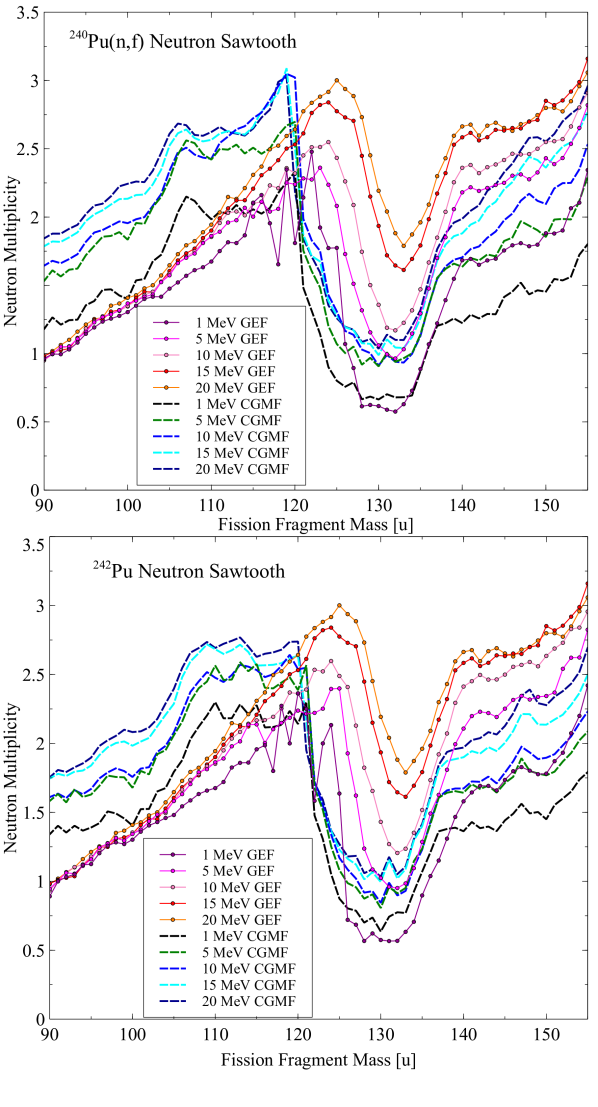
For the present analysis, neutron multiplicities for En = 1 - 20 MeV from two fission models, GEF Schmidt and Jurado (2021) and CGMF Talou et al. (2021), were used to find the pre and post neutron evaporation masses from the measured fission product energies. For E 20 MeV, only the GEF neutron multiplicities were used in the 2E analysis as neutron induced fission of E 20 MeV is not yet modeled by CGMF. The neutron multiplicities for 240 Pu(n,f) and 242 Pu(n,f) obtained by GEF and CGMF are shown in Figure 3. It is apparent that the GEF and CGMF codes divide the energy of the incident neutron quite differently.
Several theories exist Schmidt et al. (2016b),Becker et al. (2013),Litaize et al. (2015),Morariu et al. (2012) to describe the partitioning of energy between two fission fragments. The physics behind the GEF model v(A) values is described in Schmidt et al. (2016b). Within this framework the initial excitation of the compound nucleus is shared by the protofragments according to the ratio of their masses. However, when pairing correlations are added to the regime, energy sorting takes place, resulting in a total transfer of excitation energy from the light fragment to the heavy fragment Schmidt and Jurado (2010)Schmidt and Jurado (2011). At higher energies, pairing correlations get washed out and there is a transition back to an energy distribution closer to the ratio of the fragment masses. This phenomenon of energy sorting dictates that the additional energy brought by the incident particle is given to the heavy fragment and thus raises the neutron multiplicities of the heavy fragments only Schmidt et al. (2016b).
The CGMF model, on the other hand, uses the approach of Becker et al. (2013) to predict v(A). Within this framework it is the ratio of the initial fragment temperatures, RT, that determines the partitioning of the excitation energy. The ratio of nuclear temperatures is correlated to the degree of fragment deformation. The heavy fragments formed near the closed shell of Z = 50 and N = 82 are expected to be more spherical than their lighter counterparts. As such, the light fragment is expected to acquire more of the bombarding particles excitation resulting in higher neutron multiplicities of the light fragment. Despite the different approaches to modeling v(A) between GEF and CGMF there is virtually no difference between the predicted total neutron multiplicity (Table 4).
III Results
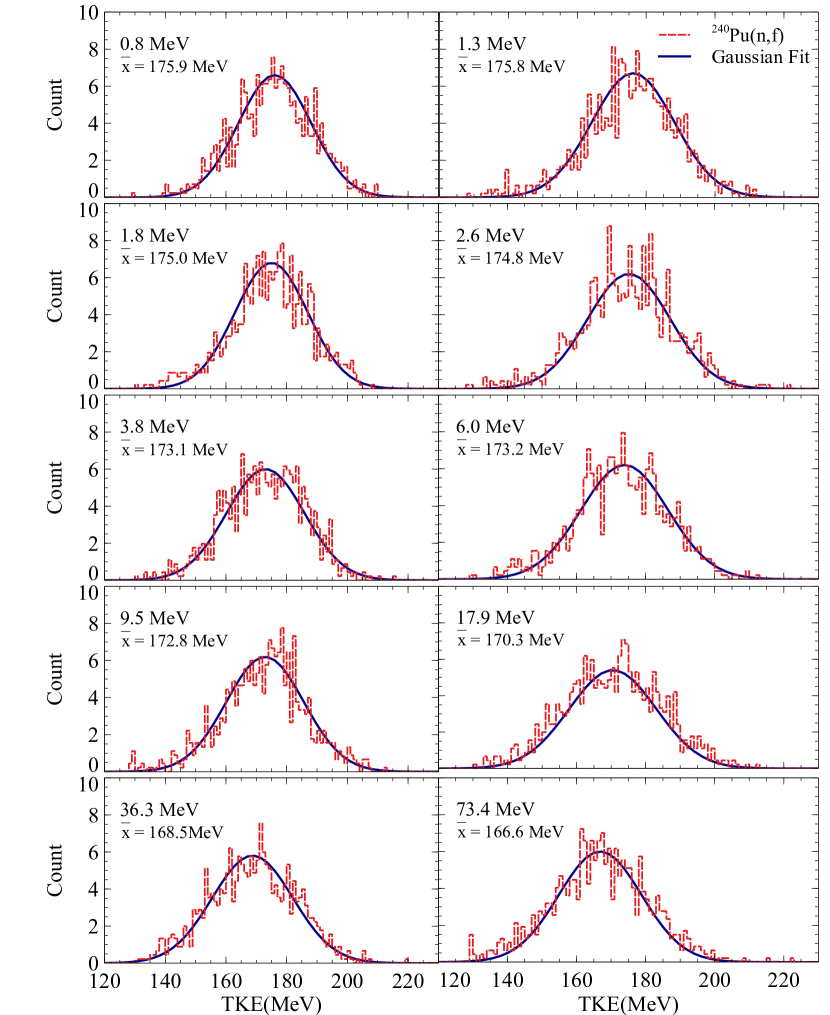
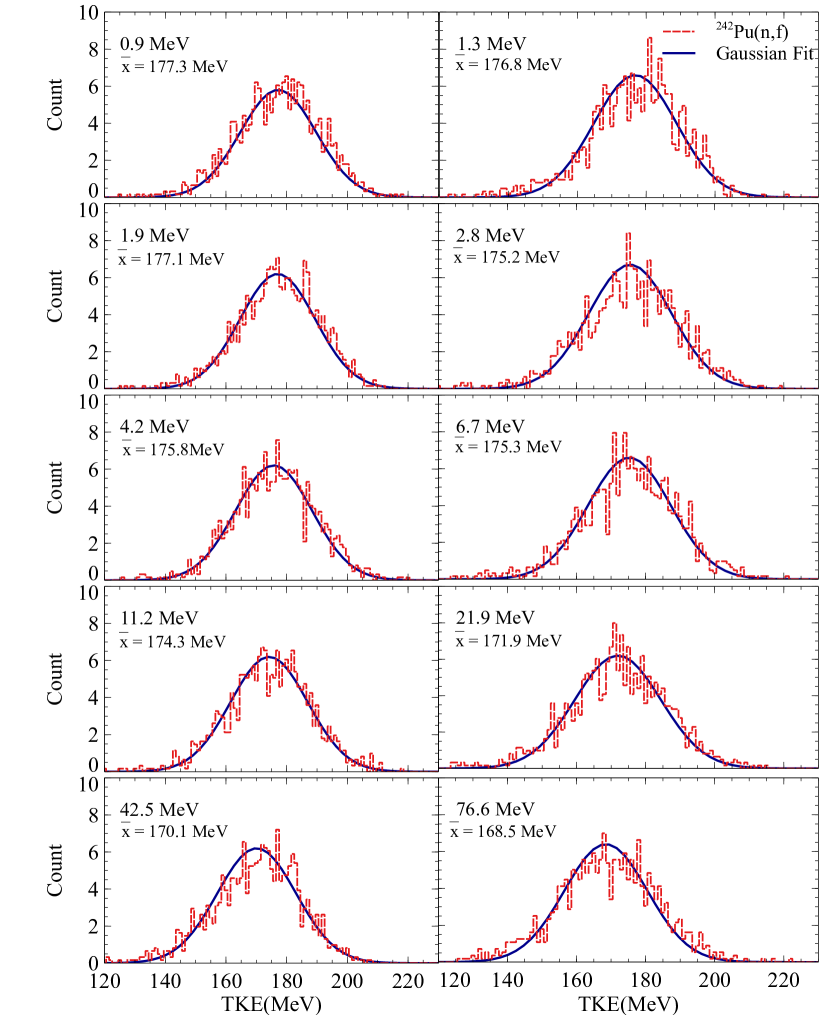
9,099 coincident fission events for 240Pu(n,f) and 12,250 coincident fission events for 242Pu(n,f) were recorded over their one and two week irradiation periods respectively. In Table 5 and Table 6 we report the pre- and post-neutron TKE and its variance as a function of incident neutron energy for the 240Pu(n,f) and 242Pu(n,f) reactions. In Figures 4 and 5, we present the post neutron evaporation TKE distributions sorted by neutron energy bin. The data were binned as to have a similar number of events per neutron energy bin. The solid lines in each plot represent the results of fitting the data (dotted line) with Gaussian distributions. The variances of these Gaussian distributions () are sensitive indicators of multichance fission, broadening when a new fission channel opens up.
III.1 TKE vs En
| En Range(MeV) | En (MeV) | preTKE (MeV) | postTKE (MeV) | TKE | Events |
|---|---|---|---|---|---|
| [0.55-1.01] | 0.78 | 177.9 0.5 | 175.9 0.5 | 161.5 0.4 | 847 |
| [1.01-1.47] | 1.25 | 178.0 0.4 | 175.8 0.4 | 147.6 0.4 | 936 |
| [1.47-2.17] | 1.82 | 177.1 0.5 | 175.0 0.5 | 170.6 0.5 | 918 |
| [2.17-3.04] | 2.61 | 177.2 0.5 | 174.8 0.5 | 157.8 0.4 | 933 |
| [3.04-4.64] | 3.84 | 175.1 0.5 | 173.1 0.5 | 155.0 0.4 | 910 |
| [4.64-7.35] | 6.00 | 175.7 0.5 | 173.2 0.5 | 156.3 0.4 | 906 |
| [7.35-11.68] | 9.51 | 175.2 0.5 | 172.8 0.5 | 172.7 0.5 | 901 |
| [11.68-24.21] | 17.94 | 173.2 0.5 | 170.3 0.4 | 192.9 0.4 | 905 |
| [24.21-48.34] | 36.27 | 171.5 0.5 | 168.5 0.4 | 200.2 0.4 | 902 |
| [48.34-100] | 73.36 | 170.0 0.5 | 166.6 0.5 | 193.7 0.4 | 941 |
| En Range(MeV) | En (MeV) | preTKE (MeV) | postTKE (MeV) | TKE | Events |
|---|---|---|---|---|---|
| [0.62-1.09] | 0.85 | 179.5 0.4 | 177.3 0.4 | 174.2 0.3 | 1223 |
| [1.09-1.55] | 1.32 | 178.7 0.4 | 176.8 0.4 | 149.8 0.3 | 1254 |
| [1.55-2.26] | 1.91 | 179.4 0.4 | 177.1 0.4 | 157.3 0.3 | 1272 |
| [2.26-3.28] | 2.77 | 177.7 0.4 | 175.2 0.4 | 188.5 0.3 | 1239 |
| [3.38-5.10] | 4.19 | 178.0 0.4 | 175.8 0.4 | 164.1 0.3 | 1242 |
| [5.10-8.36] | 6.73 | 177.8 0.4 | 175.3 0.4 | 157.5 0.3 | 1233 |
| [8.36-13.97] | 11.16 | 176.5 0.4 | 174.3 0.4 | 144.7 0.3 | 1223 |
| [13.97-29.86] | 21.92 | 174.7 0.4 | 171.9 0.4 | 184.7 0.3 | 1227 |
| [29.86-42.50] | 42.50 | 173.1 0.4 | 170.1 0.4 | 185.0 0.3 | 1221 |
| [42.50-100] | 76.55 | 171.8 0.4 | 168.5 0.4 | 190.4 0.4 | 1116 |
III.1.1 Comparison with GEF and CGMF
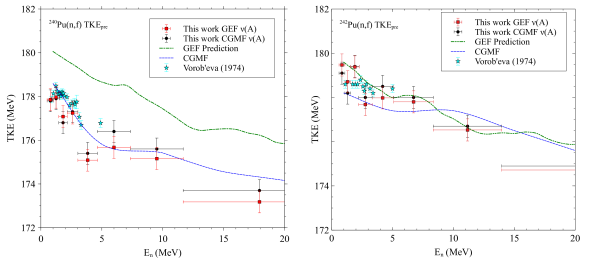
Pre-neutron evaporation (TKEpre) results for incident neutron energies of E 20 MeV are shown in Figure 6. In doing so, we restrict our attention to incident energies where both GEF and CGMF neutron multiplicities were implemented in the analysis regime. In 1974 Vorob’eva et al. measured the kinetic energy release for 240,242Pu(n,f) for E 3.5 MeV and reported the mean kinetic energy of fragments for 240Pu (n,f) and 242Pu(n,f) to be 178.2 0.5 MeV and 178.6 0.5 MeV, at En = 1.3 and 1.1 MeV respectively, relative to the mean kinetic energy release of 235U by thermal neutrons Vorobeva et al. (1974a). These data are presented in Figure 6. Notwithstanding the measurements of Vorob’eva et al., data characterizing the 240,242Pu(n,f) reactions remains extremely scarce. As such, parameterizations in CGMF for 240,242Pu(n,f) were extrapolated from the well studied 239,241Pu(n,f) reactions. There is no statistical difference between the TKE calculated using GEF v(A) v. CGMF v(A).
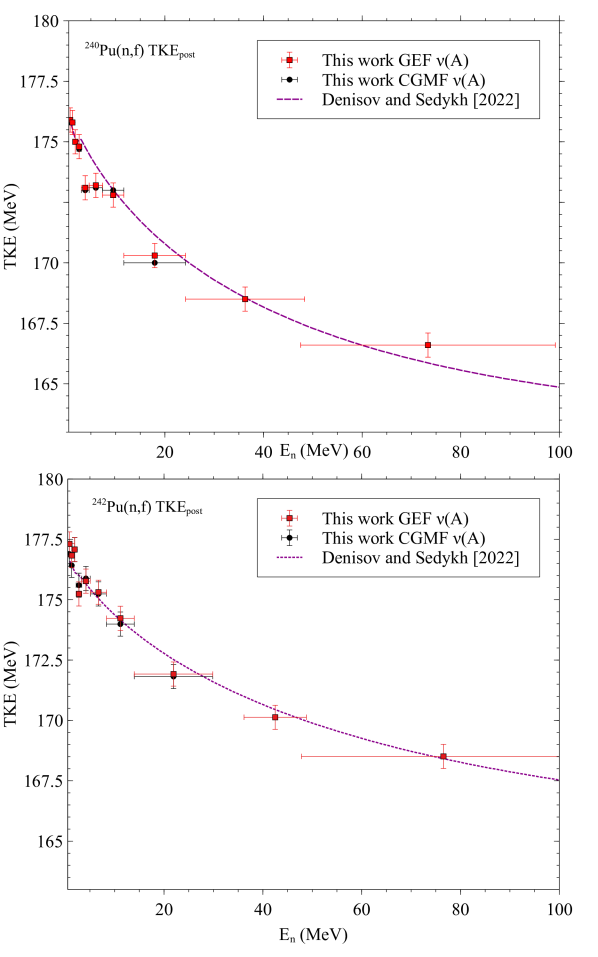
The TKEpost release for the fast neutron-induced fission of the Pu isotopes over the entire measured energy range is given in Figure 7. In this figure we show our data, the GEF modelSchmidt and Jurado (2021), and the 240,242Pu(n,f) data measured by Vorob’eva et al. Vorobeva et al. (1974a, b). The overall trend of decreasing TKE with increasing excitation is consistent with other fast neutron TKE studies of actinides Pica et al. (2020); Yanez et al. (2018); Higgins et al. (2020); Meierbachtol et al. (2016); Chemey et al. (2020); King et al. (2017). A second order log10 polynomial fit best describes the TKE vs. En relationship. The fit to the 240Pu data (Figure 7 left) is given by the equation TKE(MeV) = 175.8 0.3 - (2. 4 0.8)log10En - (1.4 0.4)log10E and the fit to the 242Pu data (Figure 7 right) is given by the equation TKE(MeV) = 177.1 0.3 - (1.2 0.9)log10En - (1.8 0.5)log10E at the 95 confidence interval. The TKE release for 242Pu (n,f) is higher than for 240Pu (n,f) across the entire energy range. This stands in contradiction with the general expectation of a linear TKE decrease with increasing A Viola and Sikkeland (1963), however measurements of spontaneous fission of these two Pu isotopes also find a greater TKE release for 242Pu (sf) than for 240Pu (sf) Schillebeeckx et al. (1992); Allaert et al. (1982); Demattè et al. (1997). The discrepancy between the spontaneous and induced fission measurements and the expected Z2/A1/3 dependence suggests microscopic effects are predominating over macroscopic behavior Demattè et al. (1997).
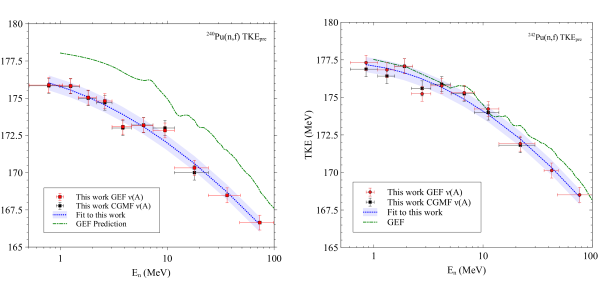
The GEF model overestimates the TKE release for 240Pu (n,f) by 1.5 MeV) which is consistent with the accuracy of GEF TKE predictions reported in Schmidt et al. (2016b) for other, more well characterized, fission systems.
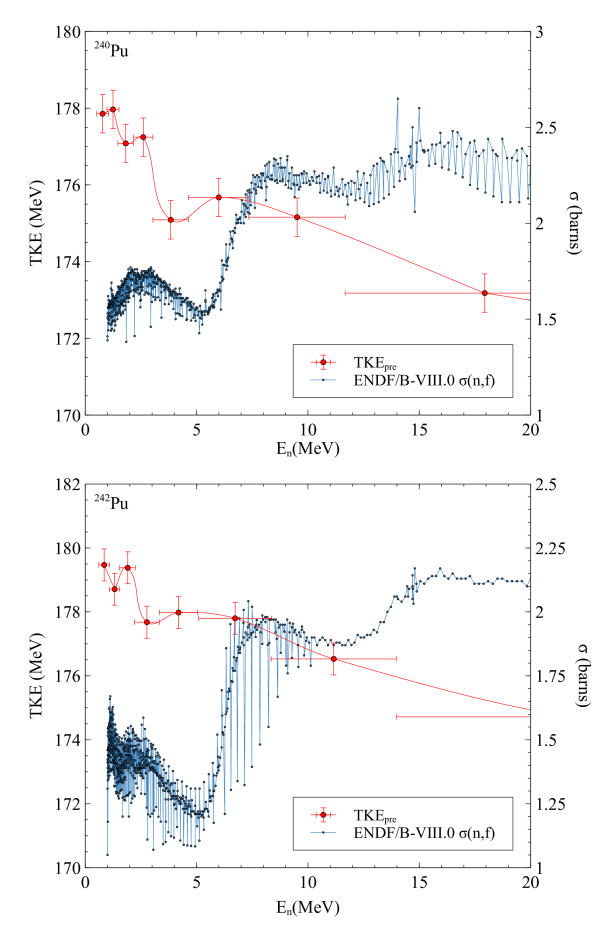
Multichance fission in the 240,242Pu(n,f) systems is possible when the incident neutron energy is greater than 5 MeV Chadwick et al. (2006). In Figure 8 we show the TKEpre v. En relationship compared to the neutron induced fission cross section (n,f) from ENDF/B-VIII.0 Chadwick et al. (2006). In this figure we see an initial rise in TKEpre at the onset of second chance fission. We attribute the initial rise in TKEpre to the pre-scission neutrons carrying away some energy resulting in less excitation at scission of the compound nucleus. If the energy of the bombarding neutron is increased further, past 5 MeV, but not high enough to overcome the third chance fission threshold, the TKEpre drops. We attribute this behavior to a greater population of energy states for the compound nucleus, the excess energy of which is carried away by prompt gammas and neutrons. While this phenomenon is apparent in our data, it is damped by the large energy bin widths.
III.1.2 Comparison to the Denisov and Sedykh model
Denisov and Sedykh developed a simple model within the average total kinetic energy TKE framework to highlight the energy dependence of the average kinetic energies of the fission fragments Denisov and Sedykh (2022a, b). The two key dependencies in the fissioning system upon which the Denisov and Sedykh model is based are:
-
1.
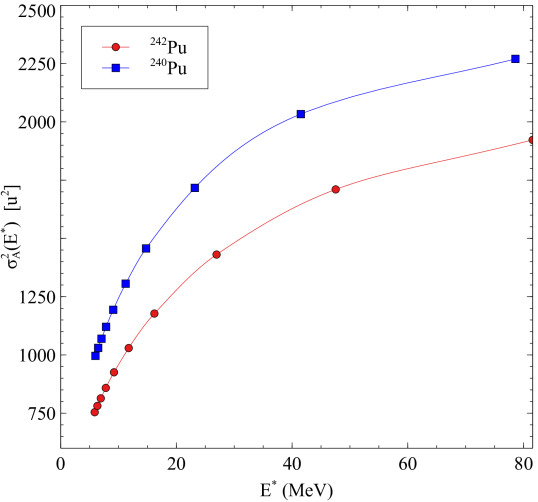
The width of the fission fragment mass distribution is correlated to the excitation energy E∗ of the two nascent fragments at the saddle point.
-
2.
The average total kinetic energy TKE depends directly on the width of mass distribution of the fission fragments,
The following equations explore these two dependencies and describe how we used the model derived by Denisov and Sedykh to fit our 240,242 Pu(n,f) measurements.(The complete derivation for the expression for the dependence of the average total kinetic energy TKE of fission fragments on the excitation energy of the compound nucleus can be found in Denisov and Sedykh (2022a, b).)
The excitation energy of the fissioning system at the saddle point, E∗ is assumed to be
| (10) |
where ECN is the excitation energy of the compound nucleus, En is the energy of the incident neutron and Bn is the binding energy of the neutron. The value of Bn for each Pu nuclide was taken from Wang et al. (2017).
The width of mass distribution , of fission fragments is calculated by,
| (11) |
| (12) |
where A is the mass of the fissioning nucleus. The values of the volume and surface level density parameters = 0.0722396 MeV-1 and = 0.195267 MeV-1, respectively, were fixed for the calculation and taken from Capote et al. (2009). The value for the stiffness parameter C, was obtained by fitting the post-neutron emission TKE data. The values of the stiffness parameter C for the fragment asymmetry in the compound nuclei 241,243Pu were 37.1 and 49.7 MeV respectively.
Finally, the average total kinetic energy TKE is given by Denisov and Sedykh (2022b)
| (13) |
where , parameter , the distance between the mass center of the fragments at the saddle point, is 1.780 fm Denisov and Sedykh (2022a) and is the fission fragment mass distribution width for a given excitation found by Eq. 12.
In Figure 9 we show fission fragment mass width as a function of A for compound nuclei 241,243Pu calculated using Eq. 12. The width of the fission fragment mass yield rises with higher excitation E∗. Consequently, the influence of asymmetric fission events become progressively more significant at the highest excitations E∗. We will explore this further in the section on fission channel symmetry.
In Figure 10 we compare the dependence of the average total kinetic energy TKE on incident neutron energy derived from the Denisov and Sedykh model Denisov and Sedykh (2022a, b) to our experimental data for 240,242Pu (n,f). The Denisov and Sedykh model well describes our data at energies where E. For both the Pu isotopes the calculated average kinetic energy TKE decreases smoothly with increasing excitation. Denisov and Sedykh attribute this TKE decrease to the following two factors; the width of the mass distribution of the fission fragments increases with higher excitation E∗, and a wider mass distribution indicates asymmetric fission is playing a more dominant role.
III.2 Mass yield distributions
Conservation of momentum and nucleon number dictates that the kinetic energies of the fission fragments are inversely proportional to their masses. Therefore, although not directly measured, mass distributions can be deduced from the kinetic energy of the coincident fragment pairs.
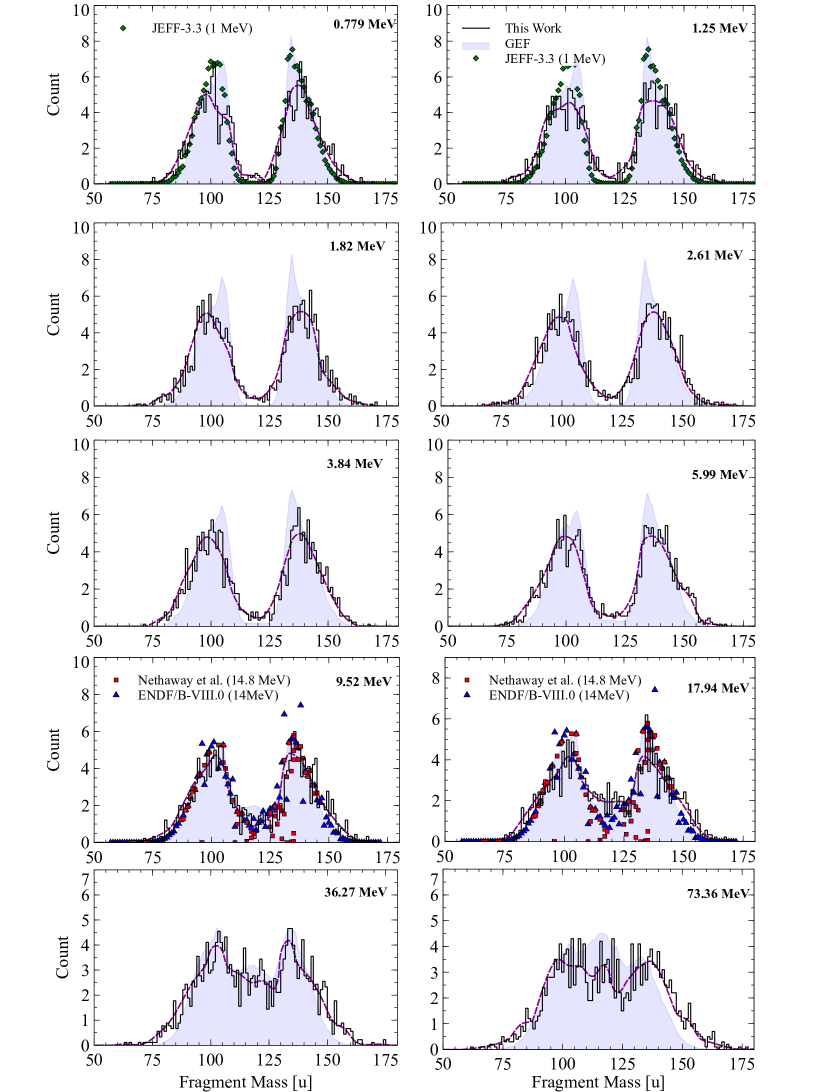
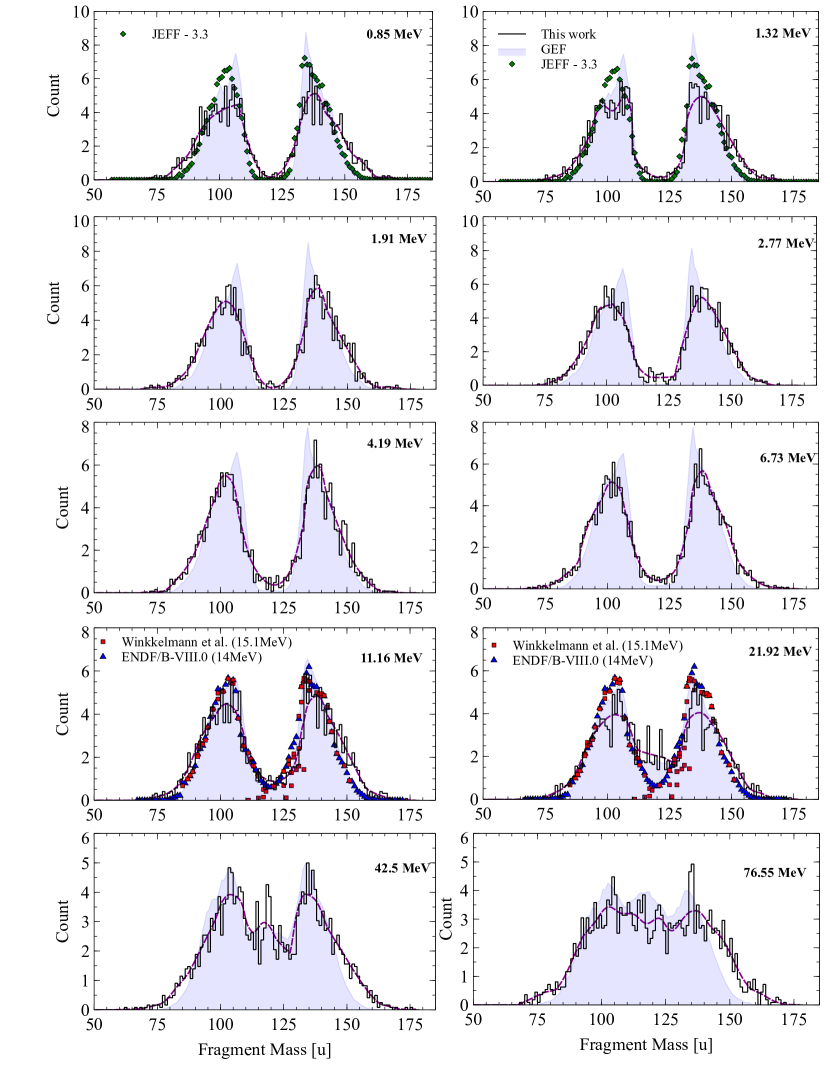
In Figures 11 and 12 we plot the post-neutron evaporation mass distributions calculated in this work using the GEF neutron multiplicities (the smoothed average ( 5 u) experimental mass yields are shown by the dashed line), as well as the distribution predicted by the GEF model Schmidt and Jurado (2021). We also show the evaluated data from England and Rider (1995) and Mills at energies where data is available, as well as the experimental data of Nethaway et al. (1977) at 14.8 MeV for 240Pu(n,f) and Winkelmann and Aumann (1984) at 15.1 MeV for 242Pu(n,f). The resolution of our measurement is 5 u. In both figures it is evident that as the excitation energy of the fissioning system increases, the valley between the asymmetric mass peaks begins to fill in, reflecting the emergence of symmetric fission. We also see that as the excitation energy is increased, YA and YA decrease due to higher symmetric fission yield. Additionally, the rate of symmetric in growth and its relative proportion to the total number of events are consistent with that predicted by GEF Schmidt and Jurado (2021). That said, while the light fragment mass peak is well described by the GEF model for both Pu systems, our measurements consistently reflect a broader heavy fragment mass peak at the highest energies.
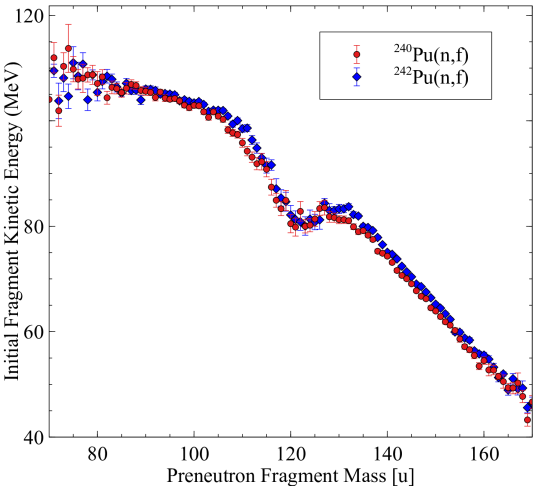
Figure 13 gives the fragment KE v. single fragment mass [u] for the two fissioning systems studied. The curves show that the light fragment KE is almost constant while the heavy fragment KE decreases dramatically with increasing mass. The dip around 120 u is characteristic of symmetric fission.
III.3 Fission Channel Symmetry
The fission process is dependent on the delicate interplay of microscopic shell effects, and macroscopic nuclear properties. As En increases, it is the dynamics between diminishing shell effects and energy sorting that dictate the fission exit channel. For actinide fission, asymmetric fission dominates at low energies due to the influence of strong shell effects.However, as En increases the intrinsic energy of the system also rises, giving the fissioning system a wider variety of shapes to embody during its evolution towards fission Albertsson et al. (2021). The potential energy landscape at the moment of scission determines the fission exit channel. In Figure 14 we plot only the TKE associated with asymmetric fission (TKEasym) events for 240,242Pu (n,f). For an event to fall into the asymmetric bin it had to meet the following condition:
| (14) |
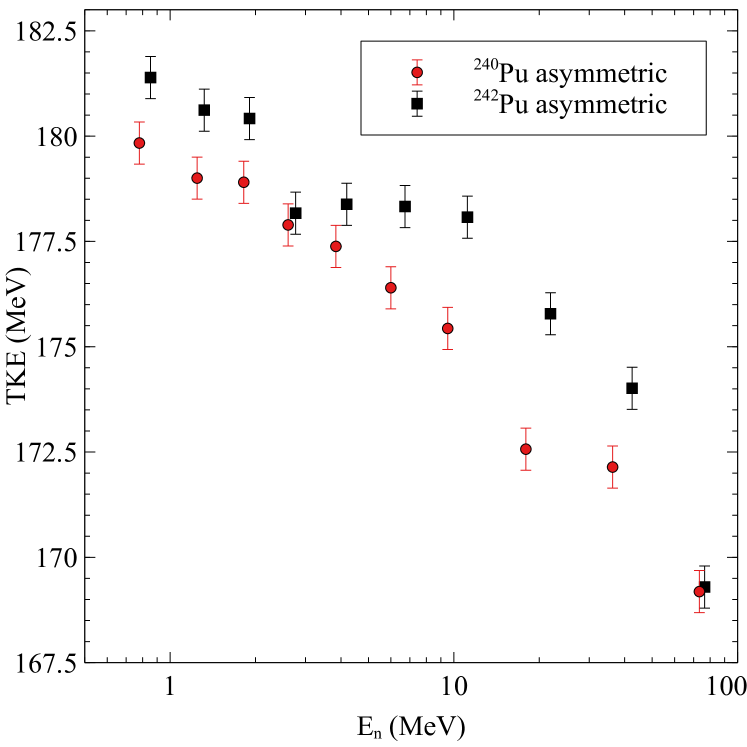
TKEasym drops off rather steeply, particularly above 5.5 MeV for both 240,242Pu (n,f) reactions. The asymmetric fission events in the highest energy bins originate from the multichance fission chain when lighter, less excited CN fission (See Tables 2 and 3). The sharp descent in TKEasym has been attributed to the fragments taking on more drastic deformation shapes at higher excitations, particularly for 130 145 u Hambsch et al. (2000); Chemey et al. (2020).
III.3.1 Fission fragment distortion and TKE
| Isotope | A 130, A 135 (MeV) | 130 A 135 (MeV) | Total (MeV) |
|---|---|---|---|
| 240 | 175.0(2) | 180.5(5) | 174.8(3) |
| 242 | 176.4(2) | 184.9(5) | 176.6(3) |
Fission is driven by Coulomb repulsion where the magnitude of the energy released is dictated by the distance between the nascent fragments. We can thus approximate TKE by:
| (15) |
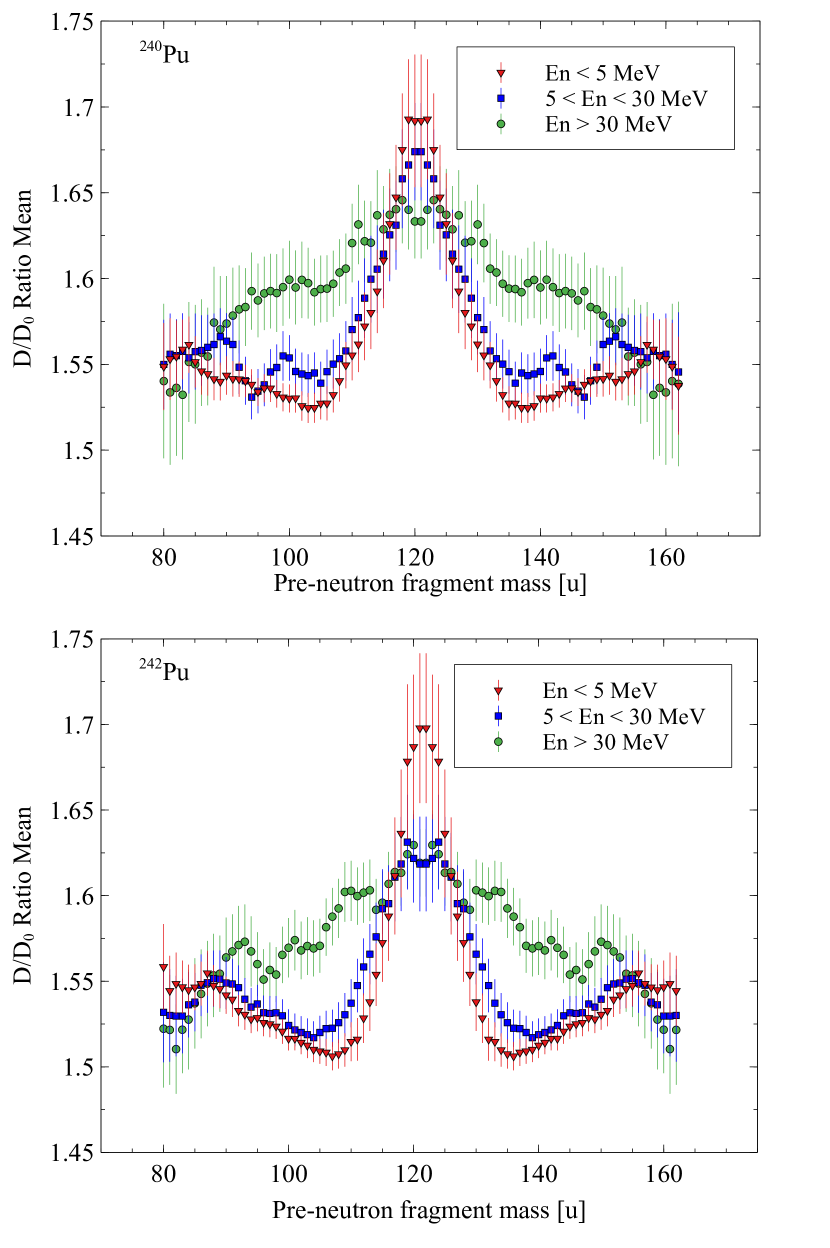
where e2 is the squared elementary charge (1.44 MeV-fm) and D is the distance between the proto-fragments Viola et al. (1985). Using the relationship described by Eq. 15 and the Unchanged-Charge-Density (UCD) assumption we can make a reasonable determination of the inter-nuclear distance. The ratio of the distance between charge centers (D) and the nominal contact distance between touching spherical nuclei (D0) is typically represented as D/D0 where the higher the D/D0 ratio, the greater the fragment deformation Caamaño et al. (2015). In Figure 15 we plot the mean D/D0 ratio as a function of pre-neutron emission fragment mass [u] at various energy ranges. The fragment mass is plotted as a rolling average of 5 u to correspond with the uncertainty of our measurement. The most compact shapes, i.e. the least deformed fragments, have D/D0 1.5 Caamaño et al. (2015). For both Pu systems this D/D0 ratio is found in the asymmetric 105 AL 110 u and 130 AH 135 u mass regions. Furthermore, we see a clear distinction between asymmetric and symmetric fission modes at low En with symmetric fragments experiencing a higher degree of deformation. In the intermediate energy range, the gap between the asymmetric and symmetric modes fills in slightly indicating a marginal increase in asymmetric deformation. At the highest En, the separation between these fission modes is less distinct with the middle masses having only a slightly higher D/D0 ratio than the mass extremes. Notably, it is the asymmetric mode that becomes progressively more distorted as En increases while there is little variation in the magnitude of symmetric distortion.
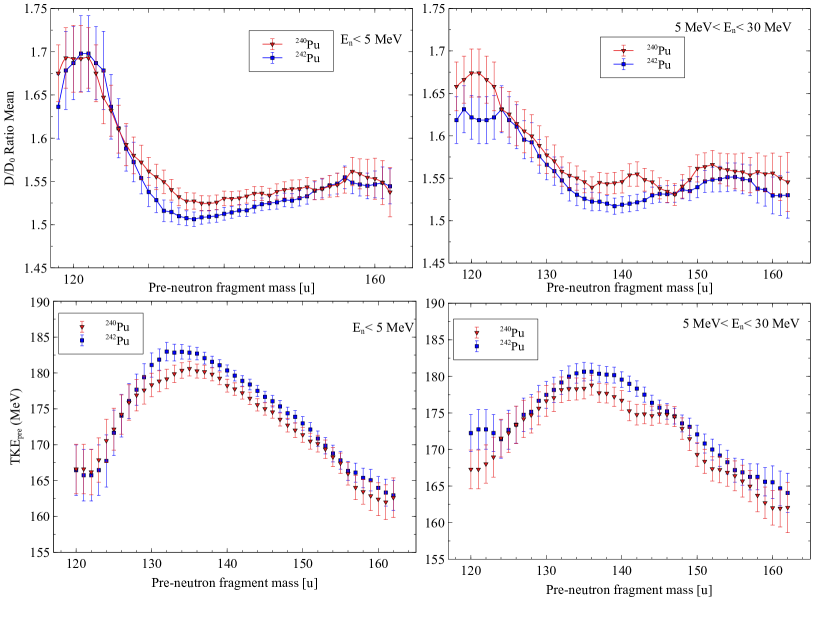
In Figure 16 we compare the relationship between the D/D0 ratio and pre-neutron emission fragment mass for 240,242Pu at E MeV and 5 30 MeV. Below that we make the comparison to the corresponding TKEpre value. There is a strong anti-correlation between D/D0 and TKEpre. The lowest degree of distortion and highest TKE release is associated with the heavy fragment mass range 130 135 u for E MeV.These fragments are predicted to have a compact spherical shape at scission and therefore experience the most Coulomb repulsion.Contrarily, the highest degree of distortion is associated with the (symmetric) 118 123 u mass region. Greater deformation increases the fragment intrinsic energy and lowers the available energy to transfer to the fragments at scission, resulting in lower TKE. In the higher 5 30 MeV energy bin, symmetric fragments experience less deformation and higher TKE than at lower energy, while we see the reverse trend for the asymmetric fragments. This observation is evidence that the sharp decrease in TKEasym(shown in Figure 14) is the result of asymmetric fragments experiencing enhanced deformation at higher energies.
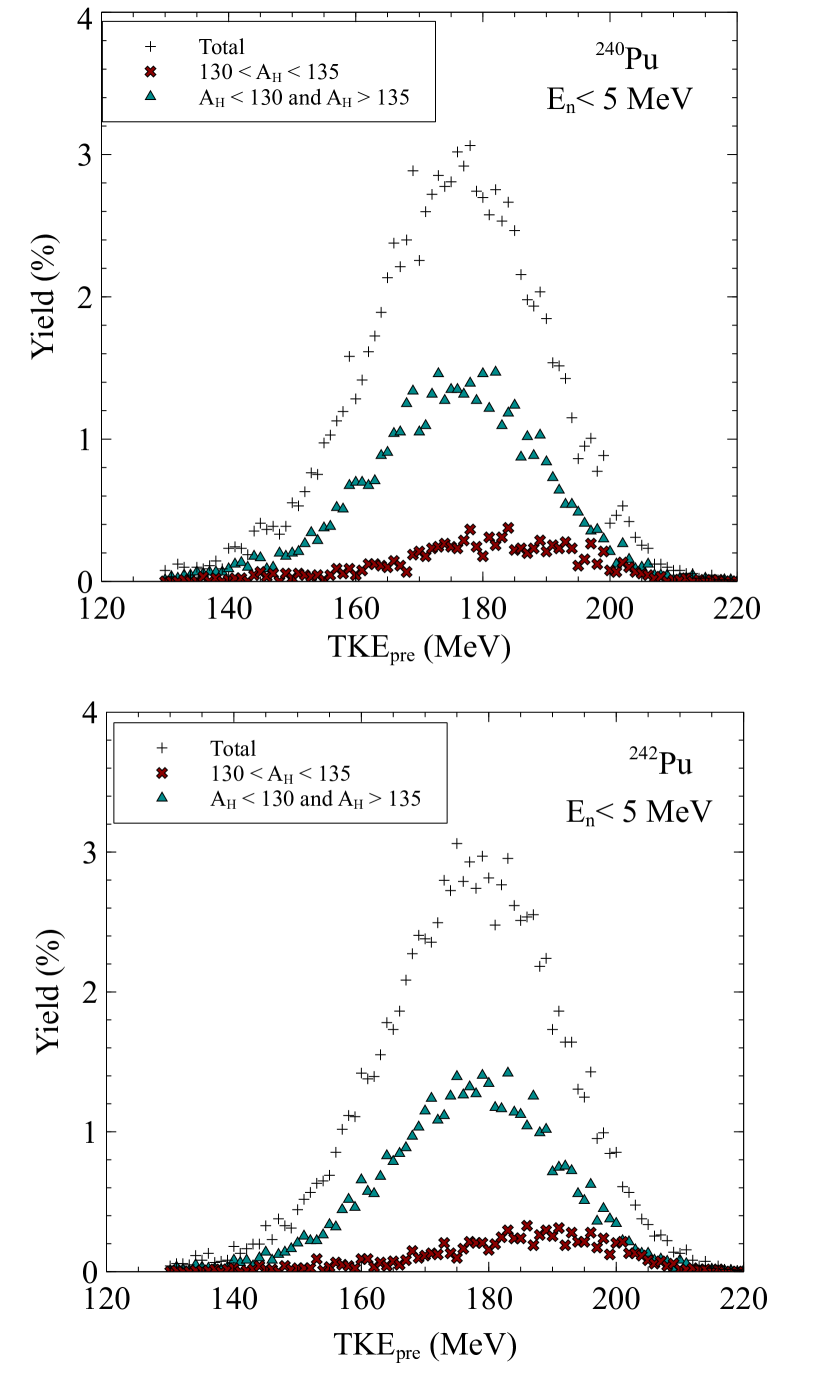
In Figure 17 the TKEpre distributions are decomposed into two mass regions; 130 plus 135 u, and 130 135 u. The average TKEpre values are given in Table 7. For both 240Pu and 242Pu in the interval 130-135 u, the average TKEpre is significantly higher, 180.5 and 184.9 MeV respectively, compared to 175.0 and 176.4 MeV in the other interval. This is because the spherical N = 82 shell will have its maximum influence in the 130 135 u mass region where stabilization is enhanced by the Z = 50 shell Wagemans et al. (1984). As the incident neutron energy is increased this stabilizing shell structure is washed out and the yield of 130 135 u diminishes as symmetric fission becomes more prevalent.
IV Conclusions
In this work we investigate the fast neutron induced fission of 240,242Pu for which experimental data is extremely scarce. Thin, highly uniform, vapor deposited 240,242PuF4 targets were irradiated at LANSCE-WNR to study the dependence of TKE release on incident neutron energies from 1-100 MeV. In addition to TKEpre and TKEpost measurements, mass yield distributions were deduced using the 2E method. We gained additional detail about the 240,242Pu(n,f) fissioning systems by separating events by symmetry regime to look at the fission exit channel and degree of fragment deformation. Our analysis indicates that the observed TKE decrease with increasing En is a consequence of two factors: shell effects fade out at high excitation energies, resulting in the increasing occurrences of symmetric fission, and TKEasym decreases rapidly at high En due to more dramatic fragment deformation shapes.
V Acknowledgements
We thank the Fission TPC Collaboration for their support of the dual glove box system used to manufacture the 240,242Pu targets. We thank S. Kuvin and H.Y. Lee for their assistance in making the measurements and M. Silveira for his assistance in preparing the 240,242Pu targets. We also thank Amy Lovell for her help running CGMF. This material is based upon work supported in part by the U.S. Department of Energy, Office of Science, Office of Nuclear Physics under award number DE-FG06-97ER41026 (OSU) and contract number 89233218CNA000001 (LANL). The nuclide(s) used in this research were supplied by the United States Department of Energy Office of Science by the Isotope Program in the Office of Nuclear Physics.
References
- Nethaway et al. (1977) D. R. Nethaway, A. L. Prindle, W. A. Myers, W. C. Fuqua, and M. V. Kantelo, Phys. Rev. C 16, 1907 (1977).
- Winkelmann and Aumann (1984) I. Winkelmann and D. C. Aumann, Phys. Rev. C 30, 934 (1984).
- (3) J. P. Unik and J. E. Gindler, Tech. Rep., accessed at https://www.osti.gov/biblio/4010075.
- Younes and Loveland (2022) W. Younes and W. Loveland, An Introduction to Nuclear Fission (Springer, Switzerland, 2022).
- Madland (2006) D. Madland, Nuclear Physics A 772, 113 (2006).
- Lestone and Strother (2014) J. Lestone and T. Strother, Nuclear Data Sheets 118, 208 (2014).
- King et al. (2017) J. King, R. Yanez, W. Loveland, B. Barrett, J. S.and Oscar, N. Fotiades, F. Tovesson, and H. Young Lee, Eur. Phys. J. A 53, 238 (2017).
- Maslov (2007) V. Maslov, in International Conference on Nuclear Data for Science and Technology (EDP Sciences, 2007) pp. 1143–1146.
- Higgins et al. (2020) D. Higgins, U. Greife, F. Tovesson, B. Manning, D. Mayorov, S. Mosby, and K. Schmitt, Phys. Rev. C 101, 014601 (2020).
- Liu et al. (2021) L.-L. Liu, Y.-J. Chen, X.-Z. Wu, Z.-X. Li, Z.-G. Ge, and K. Pomorski, Phys. Rev. C 103, 044601 (2021).
- Duke et al. (2016) D. L. Duke, F. Tovesson, A. B. Laptev, S. Mosby, F.-J. Hambsch, T. Bryś, and M. Vidali, Phys. Rev. C 94, 054604 (2016).
- Maslov et al. (2011) V. Maslov, N. Tetereva, V. Pronyaev, A. Kagalenko, K. Zolotarev, R. Capote, T. Granier, B. Morillon, F.-J. Hambsch, and J.-C. Sublet, Journal- Korean Physical Society 59, 1337 (2011).
- Pica et al. (2020) A. Pica, A. T. Chemey, L. Yao, W. Loveland, H. Y. Lee, and S. A. Kuvin, Phys. Rev. C 102, 064612 (2020).
- Meierbachtol et al. (2016) K. Meierbachtol, F. Tovesson, D. L. Duke, V. Geppert-Kleinrath, B. Manning, R. Meharchand, S. Mosby, and D. Shields, Phys. Rev. C 94, 034611 (2016).
- Chemey et al. (2020) A. Chemey, A. Pica, L. Yao, W. Loveland, H. Y. Lee, and S. A. Kuvin, Eur. Phys. J. A 56, 297 (2020).
- Vorobeva et al. (1974a) V. G. Vorobeva, N. P. Dyachenko, N. P. Kolosov, B. D. Kuzminov, and A. I. Sergachev, Soviet Journal of Nuclear Physics 19, 489 (1974a), EXFOR.40281:Ref.1:x4ref.J,SNP,19,489,1974.
- Rubchenya et al. (2004) V. Rubchenya, W. Trzaska, I. Itkis, M. Itkis, J. Kliman, G. Kniajeva, N. Kondratiev, E. Kozulin, L. Krupa, I. Pokrovski, V. Voskressenski, F. Hanappe, T. Materna, O. Dorvaux, L. Stuttge, G. Chubarian, S. Khlebnikov, D. Vakhtin, and V. Lyapin, Nuclear Physics A 734, 253 (2004).
- Wender et al. (1993) S. Wender, S. Balestrini, A. Brown, R. Haight, C. Laymon, T. Lee, P. Lisowski, W. McCorkle, R. Nelson, W. Parker, and N. Hill, Nuclear Instruments and Methods in Physics Research Section A: Accelerators, Spectrometers, Detectors and Associated Equipment 336, 226 (1993).
- Silveira et al. (2020) M. J. Silveira, A. Pica, and W. Loveland, Nuclear Instruments and Methods in Physics Research Section A: Accelerators, Spectrometers, Detectors and Associated Equipment 982, 164570 (2020).
- Schmidt and Jurado (2021) K. H. Schmidt and B. Jurado, http://www.khschmidts-nuclear-web.eu/GEF.html (version of model used GEF 2021.1.1 downloaded May 2021).
- Schmidt et al. (2016a) K. H. Schmidt, B. Jurado, C. Amouroux, and C. Schmitt, Nucl. Data Sheets 131, 107 (2016a).
- Talou et al. (2021) P. Talou, I. Stetcu, P. Jaffke, M. Rising, A. Lovell, and T. Kawano, Computer Physics Communications 269, 108087 (2021).
- Schmitt et al. (1966) H. W. Schmitt, J. H. Neiler, and F. J. Walter, Phys. Rev. 141, 1146 (1966).
- Weissenberger et al. (1986) E. Weissenberger, P. Geltenbort, A. Oed, F. Gönnenwein, and H. Faust, Nuclear Instruments and Methods in Physics Research Section A: Accelerators, Spectrometers, Detectors and Associated Equipment 248, 506 (1986).
- Ogihara et al. (1986) M. Ogihara, Y. Nagashima, W. Galster, and T. Mikumo, Nuclear Instruments and Methods in Physics Research Section A: Accelerators, Spectrometers, Detectors and Associated Equipment 251, 313 (1986).
- Kitahara et al. (1982) T. Kitahara, H. Geissel, Y. Laichter, and P. Armbruster, Nuclear Instruments and Methods in Physics Research 196, 153 (1982).
- Kaufman et al. (1974) S. Kaufman, E. Steinberg, B. Wilkins, J. Unik, A. Gorski, and M. Fluss, Nuclear Instruments and Methods 115, 47 (1974).
- Knoll (2000) G. F. Knoll, Radiation Detection and Measurement, 3rd ed. (John Wiley and Sons, New York, 2000).
- Northcliffe and Schilling (1970) L. Northcliffe and R. Schilling, At. Data Nucl. Data Tables 7, 233 (1970).
- Hensle (2019) D. Hensle, Ph.D. thesis, Colorado School of Mines (2019).
- Hensle et al. (2020) D. Hensle, J. T. Barker, J. S. Barrett, N. S. Bowden, K. J. Brewster, J. Bundgaard, Z. Q. Case, R. J. Casperson, D. A. Cebra, T. Classen, D. L. Duke, N. Fotiadis, J. Gearhart, V. Geppert-Kleinrath, U. Greife, E. Guardincerri, C. Hagmann, M. Heffner, C. R. Hicks, D. Higgins, L. D. Isenhower, K. Kazkaz, A. Kemnitz, K. J. Kiesling, J. King, J. L. Klay, J. Latta, E. Leal, W. Loveland, M. Lynch, J. A. Magee, B. Manning, M. P. Mendenhall, M. Monterial, S. Mosby, G. Oman, C. Prokop, S. Sangiorgio, K. T. Schmitt, B. Seilhan, L. Snyder, F. Tovesson, C. L. Towell, R. S. Towell, T. R. Towell, N. Walsh, T. S. Watson, L. Yao, and W. Younes (NIFFTE Collaboration), Phys. Rev. C 102, 014605 (2020).
- Schmidt et al. (2016b) K.-H. Schmidt, B. Jurado, C. Amouroux, and C. Schmitt, Nuclear Data Sheets 131, 107 (2016b), special Issue on Nuclear Reaction Data.
- Becker et al. (2013) B. Becker, P. Talou, T. Kawano, Y. Danon, and I. Stetcu, Phys. Rev. C 87, 014617 (2013).
- Litaize et al. (2015) O. Litaize, O. Serot, and L. Berge, The European Physical Journal A 51, 1 (2015).
- Morariu et al. (2012) C. Morariu, A. Tudora, F.-J. Hambsch, S. Oberstedt, and C. Manailescu, Journal of Physics G: Nuclear and Particle Physics 39, 055103 (2012).
- Schmidt and Jurado (2010) K.-H. Schmidt and B. Jurado, Phys. Rev. Lett. 104, 212501 (2010).
- Schmidt and Jurado (2011) K.-H. Schmidt and B. Jurado, Phys. Rev. C 83, 061601 (2011).
- Vorobeva et al. (1974b) V. G. Vorobeva, N. P. Dyachenko, B. D. Kuzminov, and A. I. Sergachev, Tech. Rep. 15 (1974) EXFOR.40342:Ref.1:x4ref.R,YK-15,3,1974.
- Yanez et al. (2018) R. Yanez, J. King, J. Barrett, W. Loveland, N. Fotiades, and H. Lee, Nuclear Physics A 970, 65 (2018).
- Viola and Sikkeland (1963) V. E. Viola and T. Sikkeland, Phys. Rev. 130, 2044 (1963).
- Schillebeeckx et al. (1992) P. Schillebeeckx, C. Wagemans, A. Deruytter, and R. Barthélémy, Nuclear Physics A 545, 623 (1992).
- Allaert et al. (1982) E. Allaert, C. Wagemans, G. Wegener-Penning, A. Deruytter, and R. Barthélémy, Nuclear Physics A 380, 61 (1982).
- Demattè et al. (1997) L. Demattè, C. Wagemans, R. Barthélémy, P. D’hondt, and A. Deruytter, Nuclear Physics A 617, 331 (1997).
- Chadwick et al. (2006) M. Chadwick, P. Obložinský, M. Herman, N. Greene, R. McKnight, D. Smith, P. Young, R. MacFarlane, G. Hale, S. Frankle, A. Kahler, T. Kawano, R. Little, D. Madland, P. Moller, R. Mosteller, P. Page, P. Talou, H. Trellue, M. White, W. Wilson, R. Arcilla, C. Dunford, S. Mughabghab, B. Pritychenko, D. Rochman, A. Sonzogni, C. Lubitz, T. Trumbull, J. Weinman, D. Brown, D. Cullen, D. Heinrichs, D. McNabb, H. Derrien, M. Dunn, N. Larson, L. Leal, A. Carlson, R. Block, J. Briggs, E. Cheng, H. Huria, M. Zerkle, K. Kozier, A. Courcelle, V. Pronyaev, and S. van der Marck, Nuclear Data Sheets 107, 2931 (2006), evaluated Nuclear Data File ENDF/B-VII.0.
- Denisov and Sedykh (2022a) V. Denisov and I. Sedykh, Physics Letters B 824, 136814 (2022a).
- Denisov and Sedykh (2022b) V. Y. Denisov and I. Y. Sedykh, Phys. Rev. C 105, 014616 (2022b).
- Wang et al. (2017) M. Wang, G. Audi, F. G. Kondev, W. Huang, S. Naimi, and X. Xu, Chinese Physics C 41, 030003 (2017).
- Capote et al. (2009) R. Capote, M. Herman, P. Obložinský, P. Young, S. Goriely, T. Belgya, A. Ignatyuk, A. Koning, S. Hilaire, V. Plujko, M. Avrigeanu, O. Bersillon, M. Chadwick, T. Fukahori, Z. Ge, Y. Han, S. Kailas, J. Kopecky, V. Maslov, G. Reffo, M. Sin, E. Soukhovitskii, and P. Talou, Nuclear Data Sheets 110, 3107 (2009).
- (49) R. Mills, Ph.D. thesis, The University of Birmingham, UK .
- England and Rider (1995) T. England and B. Rider, Evaluation and compilation of fission product yields 1993, Tech. Rep. (Los Alamos National Lab., 1995).
- Albertsson et al. (2021) M. Albertsson, B. G. Carlsson, T. Døssing, P. Möller, J. Randrup, and S. Åberg, Phys. Rev. C 103, 014609 (2021).
- Hambsch et al. (2000) F.-J. Hambsch, F. Vivès, P. Siegler, and S. Oberstedt, Nuclear Physics A 679, 3 (2000).
- Viola et al. (1985) V. E. Viola, K. Kwiatkowski, and M. Walker, Phys. Rev. C 31, 1550 (1985).
- Caamaño et al. (2015) M. Caamaño, F. Farget, O. Delaune, K.-H. Schmidt, C. Schmitt, L. Audouin, C.-O. Bacri, J. Benlliure, E. Casarejos, X. Derkx, B. Fernández-Domínguez, L. Gaudefroy, C. Golabek, B. Jurado, A. Lemasson, D. Ramos, C. Rodríguez-Tajes, T. Roger, and A. Shrivastava, Phys. Rev. C 92, 034606 (2015).
- Wagemans et al. (1984) C. Wagemans, E. Allaert, A. Deruytter, R. Barthélémy, and P. Schillebeeckx, Phys. Rev. C 30, 218 (1984).