Dust masses for a large sample of core-collapse supernovae from optical emission line asymmetries: dust formation on 30-year timescales
Abstract
Modelling the red-blue asymmetries seen in the broad emission lines of core-collapse supernovae (CCSNe) is a powerful technique to quantify total dust mass formed in the ejecta at late times ( years after outburst) when ejecta dust temperatures become too low to be detected by mid-IR instruments. Following our success in using the Monte Carlo radiative transfer code damocles to measure the dust mass evolution in SN 1987A and other CCSNe, we present the most comprehensive sample of dust mass measurements yet made with damocles, for CCSNe aged between four and sixty years after outburst. Our sample comprises of multi-epoch late-time optical spectra taken with the Gemini GMOS and VLT X-Shooter spectrographs, supplemented by archival spectra. For the fourteen CCSNe that we have modelled, we confirm a dust mass growth with time that can be fit by a sigmoid curve which is found to saturate beyond an age of years, at a mass of 0.23 M⊙. An expanded sample including dust masses found in the literature for a further eleven CCSNe and six CCSN remnants, the dust mass at saturation is found to be 0.42 M⊙. Uncertainty limits for our dust masses were determined from a Bayesian analysis using the affine invariant Markov Chain Monte Carlo ensemble sampler emcee with damocles. The best-fitting line profile models for our sample all required grain radii between 0.1 and 0.5 m. Our results are consistent with CCSNe forming enough dust in their ejecta to significantly contribute to the dust budget of the Universe.
I Introduction
Since the discovery of large amounts of dust in highly redshifted young galaxies [e.g. Bertoldi et al., 2003, Watson et al., 2015, Laporte et al., 2017], the origin of the bulk of the cosmic dust in the Universe has been debated. It has been proposed that a significant fraction of cosmic dust, particularly at high redshifts, is formed in the ejecta of core-collapse supernovae (CCSNe), with Morgan & Edmunds [2003] and Dwek et al. [2007] estimating that each CCSN would need to produce 0.1 M⊙ of dust for this to be the case. Theoretical models predict that CCSNe can form M⊙ of dust [Nozawa et al., 2003, Sarangi & Cherchneff, 2015]. However, in theoretical simulations the amount of ejecta-formed dust found to be destroyed by the reverse shock has varied between 0-100 per cent depending on the details of the simulation [Nath et al., 2008, Silvia et al., 2010, Bocchio et al., 2014, Micelotta et al., 2016, Kirchschlager et al., 2019, Slavin et al., 2020, Priestley et al., 2021]. A more comprehensive knowledge of dust masses, grain sizes and radial locations is needed for a range of different types of CCSNe of different ages in order to inform dust destruction simulations.
Over the last few decades, the capability of CCSNe to form large amounts of dust has been well established. Model fits to the SEDs of warm dust emitting at mid-IR wavelengths as measured with the Spitzer Space Telescope found dust masses of only around M⊙ to be present in CCSNe and SNRs, less than the theoretical predictions [Sugerman et al., 2006, Rho et al., 2009, Fabbri et al., 2011]. This changed with the work of Matsuura et al. [2011], who used Herschel Space Observatory observations of SN 1987A taken 23 years after outburst to probe previously undetectable cold dust emitting at far-IR wavelengths and found a cold dust mass of 0.5 M⊙. Follow-up ALMA observations of SN 1987A [Indebetouw et al., 2014], resolved this dust component to be in the centre of the remnant. Since then, far-IR data has been utilised to detect cold dust masses of 0.04 - 1.0 M⊙ in several supernovae remnants, including Cas A, with ages ranging from several hundred to several thousand years old [Gomez et al., 2012, De Looze et al., 2017, Temim et al., 2017, Chawner et al., 2019, Priestley et al., 2019, De Looze et al., 2019, Niculescu-Duvaz et al., 2021].
There is a current lack of far-IR or submillimetre telescopes with sensitivities sufficient to detect supernovae beyond the Local Group, and existing observations have only been able to detect cold dust in nearby Galactic and Magellanic Cloud CC-SNRs. However, Lucy et al. [1989] showed for SN 1987A that dust located within the emitting gas can produce a red-blue line asymmetry in the broad line profiles. This effect is caused by light from the receding red-shifted side of a CCSNe being attenuated by more dust than light from the approaching blue-shifted side. Since then, many authors have noted the presence of red-blue asymmetries in the line profiles of CCSNe (e.g. Smith et al. [2008] for SN 2006jc, Mauerhan & Smith [2012] for SN 1998S, Gall et al. [2014] for SN 2010jl), while Milisavljevic et al. [2012] presented a sample of 10 late-time CCSN spectra that all displayed varying degrees of blue-shifted emission peaks in their optical line profiles.
We note that Anderson et al. [2014] discussed the observed blue-shifting of H emission peaks during the very early post-explosion phases of Type II CCSNe and attributed this to the H emission line formation radius during such early phases being at or within the effective photospheric radius of the expanding ejecta, with much of the red-shifted H emission consequently occulted by the photospheric disk. However, they showed from theoretical modelling that by epochs greater than 150 days post-explosion the effective photospheric radius should have moved within the formation zone for H emission line photons, with no blue-shifting of H emission peaks by this mechanism predicted beyond this epoch, in agreement with observations. Any subsequent blue-shifting of emission line peaks can therefore be attributed to the effects of newly formed dust within the ejecta.
To increase the number of CCSNe with known dust mass determinations, Bevan & Barlow [2016] presented the Monte Carlo radiative transfer code damocles which quantifies the amount of newly formed dust causing absorption and scattering of SN ejecta line emission. It is able to treat arbitrary dust/gas geometries, a range of velocity and density distributions and dust and gas clumping configurations, as well as handling a wide range of grain species and radii. Bevan & Barlow [2016] used damocles to model the line profiles in the optical spectra of SN 1987A between 714 and 3604 days, allowing them to determine the ejecta-condensed dust mass. Their results were in agreement with the work of Wesson et al. [2015] for epochs in common, showing a steady increase in dust mass with time and that by day 3604 the dust mass in SN 1987A was 0.1 M⊙. Since the dust mass on days 8500-9200 had reached 0.6-0.8 M⊙ [Matsuura et al., 2011, Wesson et al., 2015], most of the dust in this CCSN must have formed after day 3604. Bevan et al. [2017] also applied damocles to model the line profiles of three other objects: SN 1980K, SN 1993J and Cas A, finding ejecta dust masses ranging from 0.1 M⊙ for SN 1993J to 1.1 M⊙ for Cas A.
Wesson et al. [2015] tracked the dust mass evolution in SN 1987A over its first 25 years by modelling its optical to far-IR SEDs, where they found the dust mass grew from M⊙ at 615 days to 0.8 M⊙ at 9200 days. Wesson et al. [2015] noted that large grains m in radius were required to fit the SED of SN 1987A at late epochs. Wesson et al. [2015] were able to fit a sigmoid curve to SN 1987A’s slow dust mass evolution with time. The dust mass evolution over a period of ten years in SN 2005ip, quantified from red-blue line asymmetry fits by Bevan et al. [2019], confirmed the dust-growth trend seen for SN 1987A by Wesson et al. [2015]. A similar trend for SN 2010jl at early epochs is also seen [Gall et al., 2014, Bevan et al., 2020]. Theoretical predictions of dust mass growth in CCSNe do not agree with these trends, with e.g. Sarangi & Cherchneff [2015] and Sluder et al. [2018] predicting that most of the dust should form quite rapidly, within the first three years post-explosion.
Dwek et al. [2019] have argued that this dichotomy can be resolved if ejecta dust masses actually grow to their final values within two to three years, with most of the dust initially hidden in optically thick clumps - with the continued expansion of the ejecta these clumps would eventually become optically thin, revealing the full dust mass. However, by combining damocles optical line profile modelling with mocassin optical-IR SED modelling, Wesson & Bevan [2021] have shown that SN 1987A cannot have formed a dust mass larger than 0.01 M⊙ by day 1000, even with optically thick clumps. Dust masses larger than this value that can fit the observed SED cannot match the observed optical line profiles and dust masses larger than 0.01 M⊙ that can fit the observed line profiles cannot fit the observed SED.
Independent evidence for the slow growth of supernova dust with time has come from the work of Liu et al. [2018], whose study of pre-solar SiC dust grains from supernovae used the radio-active 49V-49Ti chronometer to show that the dust grains formed at least two years, and most likely ten years, after the parent star had exploded. This timescale is consistent with the work of Ott et al. [2019], who measured barium isotope ratios in supernova-condensed dust grains found in primitive meteorites, and inferred that the dust grains had condensed about 20 years after explosion.
The time at which CCSN observational dust mass growth plateaus or saturates is still unclear, as the dust-mass growth curve is still sparsely sampled in the evolutionary stage between a supernova and a supernova remnant, at ages between 20-100 years. It is around this stage where the effect of the reverse shock on the ejecta dust also starts to become significant, so it is particularly important to determine the dust masses in CCSNe of a similar age to and older than SN 1987A. It can also be argued that even for earlier times there are not yet enough CCSN dust mass estimates available to be able to discern correlations between dust mass, grain radius and CCSN properties such as progenitor mass and SN sub-type. In this work, we aim to increase the sample of CCSNe that have derived dust masses with robustly quantified uncertainties across a range of ages. We also try, where possible, to constrain the dust grain radius and composition.
The spectra that are modelled in this paper are drawn from a Gemini GMOS and VLT X-Shooter late-time survey of CCSN spectra (Wesson et al. 2022, in preparation). For their sample they selected CCSNe that had been discovered before 2013 and which, with a few exceptions, had occurred in host galaxies at distances 30 Mpc. From the 306 initially selected CCSNe, they retained the CCSNe covered by Hubble Space Telescope (HST) optical images taken after the explosion date. In addition, in order to avoid confusion by dense star fields, they only selected CCSNe which were located in more isolated galaxy parts. The final X-Shooter plus GMOS sample consisted of fifty-five CCSNe that had exploded between 1957 and 2012. Broad emission lines were detected from fourteen of these supernovae. The modelling of the line profiles of twelve of these objects using damocles is reported in the current paper. damocles models for a thirteenth, SN 2005ip, have already been published by Bevan et al. [2019], while damocles models for the fourteenth, SN 1995N, are reported by Wesson et al. (2022, MNRAS submitted). For eight of the CCSNe that had X-Shooter or GMOS spectral detections, we were able to supplement those data with archival spectra, which also provided us with late-time spectra of two further CCSNe, SN 1993J and SN 1998S, that have broad-line detections.
As discussed by Wesson et al. (2022), a key characteristic that appears to be required for very late time emission from CCSNe to be detectable is the presence of strong interactions between the supernova ejecta and circumstellar material [Fesen et al., 1999, Milisavljevic et al., 2012]. Such interactions may make broad-line emission from the ejecta detectable through one or all of these mechanisms: (a) irradiation of ejecta material by X-ray and UV photons emitted from shocked interaction regions (Wesson et al. 2022); (b) emission from a reverse shock propagating back into the ejecta [Fesen & Weil, 2020]; or (c) ejecta emission from heating by a pulsar wind nebula [e.g. the Crab Nebula or SN 1957D, Owen & Barlow, 2015, Long et al., 2012]. The dust responsible for blue-shifting the emission line peaks must be located either in, or interior to, the line-emitting material.
II Observations
Most of the optical spectra we model in this work are from the Gemini GMOS and VLT X-Shooter late-time spectroscopic survey of CCSNe presented by Wesson et al. (2022, in preparation), where fuller details of the observations can be found. A summary of the GMOS and X-Shooter spectra modelled in this work can be found in Tables 1 and 2. For some objects we also model archival data or unpublished spectra, which are summarised in Table LABEL:table:archiv-obs-sum.
The Gemini GMOS-S and GMOS-N spectra generally cover the range 4400-7500 Å. All spectra were obtained in long-slit mode using the B600 grating, with a slit width of 0.75 arcsec. The spectra were taken at two or three central wavelength settings and co-added to prevent important spectral features from falling in detector gaps. The spectra have a resolution of 3.5 Å at a wavelength of 6000 Å. The 2D spectra were bias-corrected, flat-fielded and wavelength calibrated using the iraf gemini package, and corrected for cosmic rays using the lacos package of Van Dokkum [2001]. The sky subtraction regions were determined by visual inspection and the spectra were extracted using 15 rows centered on the supernova’s position.
| Name | Date | Epoch (d) | Program | Exp.Time (s) | Central (Å) | Galaxy | D(Mpc) | SN Type |
|---|---|---|---|---|---|---|---|---|
| SN 1957D | 24 Apr 2015 | 20,949 | GS-2015A-Q-53 | 3900 | 5970 | NGC 5236 | 4.6 | II |
| ” | 7 Mar 2018 | 22,010 | GS-2018A-Q-311 | 61200 | ” | ” | ||
| SN 1970G | 22 May 2016 | 16,733 | GN-2016A-Q-85 | 4900 | 5225 | NGC 5457 | 6.7 | II-L |
| SN 1979C | 16 Apr 2015 | 13,150 | GN-2015A-Q-56 | 3600 | 5970 | NGC 4321 | 15.0 | II-L |
| ” | 12 May 2017 | 13,907 | GN-2017A-Q-72 | 12600 | ” | |||
| SN 1980K | 23;24 Apr 2016 | 12,988 | GN-2016A-Q-85 | 4900 | 5225 | NGC 6946 | 7.7 | II-L |
| ” | 8;12 May 2018 | 13,734 | GN-2018A-Q-313 | 61200 | 5970 | |||
| SN 1986E | 9 Apr 2015 | 10,588 | GN-2015A-Q-56 | 3900 | 5970 | NGC 4302 | 17.0 | II-L |
| ” | 17 Apr 2018 | 11,692 | GN-2018A-Q-313 | 6900 | ” | ” | ||
| SN 2004et | 28 Apr 2015 | 3849 | GN-2015A-Q-56 | 3900 | 5225 | NGC 6946 | 7.7 | II-P |
| ” | 25 Apr 2017 | 4577 | GN-2017A-Q-72 | 12600 | 5970 | ” | ||
| SN 2007it | 19 Apr 2015 | 2775 | GS-2015A-Q-53 | 3900 | 5970 | NGC 5530 | 12.0 | II |
| ” | 1 Mar 2018 | 3822 | GS-2018A-Q-311 | 61200 | 5970 | ” | ||
| SN 2010jl | 22 Jan 2016 | 1906 | GN-2016A-Q-85 | 4900 | 5225 | UGC 5189A | 49 | IIn |
| SN 2011ja | 26 Feb 2014 | 807 | GS-2014A-Q-70 | 6900.48 | 5970 | NGC 4945 | 3.6 | II |
| ” | 9 Jun 2015 | 1275 | GS-2015A-Q-53 | 3900 | 5970 | ” | ||
| ” | 17 Feb 2018 | 2259 | GS-2018A-Q-311 | 61200 | 5970 | ” |
| Name | Date | Epoch (d) | OB ID | UVB (s) | VIS (s) | NIR (s) | Galaxy | D(Mpc) | SN Type |
|---|---|---|---|---|---|---|---|---|---|
| Programme 097.D-0525(A) | |||||||||
| SN 1957D | 08 Jun 2016 | 21,360 | 1342702 | 1145.76 | 1051.76 | 6200 | NGC 5236 | 4.6 | II |
| ” | 26 Jan 2017 | 21,592 | 1342707 | ” | ” | ” | ” | ||
| ” | 27 Jan 2017 | 21,593 | 1342710 | ” | ” | ” | ” | ||
| ” | 28 Jan 2017 | 21,598 | 1342713 | ” | ” | ” | ” | ||
| SN 1996cr | 10 May 2016 | 7360 | 1343004 | 1145.76 | 1051.76 | 6200 | ESO 097-13 | 4.2 | IIn: |
| ” | 12 May 2016 | 7362 | 1343009 | ” | ” | ” | ” | ||
| ” | 08 Jun 2016 | 7389 | 1343012 | ” | ” | ” | ” | ||
| SN 2011ja | 10 May 2016 | 1611 | 1342667 | 1145.76 | 1051.76 | 6200 | NGC 4945 | 3.6 | II |
| ” | 10 May 2016 | 1611 | 1342671 | ” | ” | ” | ” | ||
| ” | 10 May 2016 | 1611 | 1342674 | ” | ” | ” | ” | ||
| Programme 0103.D-0281(A) | |||||||||
| SN 1996cr | 01 May 2019 | 8446 | 2292225 | 1522.00 | 1500.00 | 5300 | ESO 097-13 | 4.2 | IIn: |
| ” | 29 May 2019 | 8474 | 2291103 | ” | ” | ” | ” |
| SN | Epoch (d) | Type | Host Galaxy | D(Mpc) | Reference |
|---|---|---|---|---|---|
| 1957D | 11371 | II | NGC 5236 | 4.0 | Long et al. [1989] |
| 19459 | Long et al. [2012] | ||||
| 1970G | 16693 | II-L | NGC 5457 | 6.7 | This paper |
| 1979C | 5146 | II-L | NGC 4321 | 15.0 | Fesen et al. [1999] |
| 10575 | Milisavljevic et al. [2009] | ||||
| 1980K | 12977 | II-L | NGC 6946 | 7.7 | This paper |
| 1986E | 3712 | II-L | NGC 4302 | 17.0 | Cappellaro et al. [1995] |
| 1993J | 8417 | IIn | M81 | 3.6 | This paper |
| 1996cr | 3603 | IIn | ESO 097-13 | 4.2 | Bauer et al. [2008] |
| 1998S | 258 | IIn | NGC 3877 | 17.0 | Fransson et al. [2005] |
| 440 | Fransson et al. [2005] | ||||
| 1170 | Pozzo et al. [2004] | ||||
| 2148 | Fransson et al. [2005] | ||||
| 6574 | Smith et al. [2017] | ||||
| 2004et | 646 | II-P | NGC 6946 | 7.7 | Fabbri et al. [2011] |
| 2012au | 2277 | Ib/c | NGC 4790 | 24.0 | Milisavljevic et al. [2018] |
The X-Shooter spectra were taken in IFU mode, with a field of view of 41.8 arcsec, using an effective slit width of 0.6 arcsec. The spectral resolving powers were 8600 for the 3000-5600 Å UVB region and 13500 for the 5500-10200 Å VIS region. Objects were acquired using blind offsets from nearby stars, and extracted from a circular aperture with a radius of 1 arcsec, and sky-subtracted using an annulus with inner-outer radii of 1-2 arcsec. The data were reduced using the software package Reflex [Freudling et al., 2013], which is implemented in the Kepler workflow engine and automated the data reduction process.
For each spectrum the continuum was normalised to unity throughout, using the interactive Starlink package dipso [Howarth et al., 2014].
III Modelling red-blue line profile asymmetries using damocles
III.1 Methodology
This work is motivated by the overwhelming presence of blue-shifted asymmetries in the emission line profiles of CCSNe. Out of a sample of 10 supernovae, Milisavljevic et al. [2012] noted that all the SN emission lines showed some degree of blue-shifting, which they suggested was due to internal dust obscuration. Similarly, upon a visual inspection of our sample of 14 CCSNe, all SNe either exhibited a red scattering wing and/or a blue-shifted peak, which can both be caused by dust absorption and scattering. If dust formation in supernovae was less prevalent, and if emission line asymmetries were instead due to physical asymmetries in the ejecta, then for CCSNe older than approximately 300 days we would expect to observe roughly equal numbers having red-shifted or blue-shifted emission line peaks. This is not the case. Given the statistical significance of this finding, we assume that if the emission line peaks of a supernova are blue-shifted, or an extended red scattering wing is present, this is caused by dust internal to the supernova, which we then quantify with the Monte Carlo radiative transfer code damocles.
damocles is written in Fortran 95, and parallelised with openmp. It models line photons subjected to scattering and absorption by dust in expanding ejecta. Total energy conservation is not a requirement, as it is assumed that any packet absorbed by dust would be re-emitted outside the wavelength range of interest and thus no longer contributes to the resulting line profile. In addition to this, the absorption and scattering of radiation by dust is assumed to be independent of the dust temperature. It has been benchmarked [Bevan & Barlow, 2016] against analytic models of theoretical line profiles based on work by Gerasimovic [1933], and also against numerical models of SN 1987A produced by Lucy et al. [1989]. damocles is able to treat any arbitrary dust/gas geometry, a range of velocity and density distributions and dust and gas clumping configurations, as well as handling a wide range of grain species and radii. Our approach to modelling the line profiles follows the same principles as described for SN 1987A by Bevan & Barlow [2016], where a more detailed description of damocles can also be found. In all cases, the parameter space was examined manually to find the best fitting model. The free parameters of the models were the dust mass Md, grain radius , outer expansion velocity Vmax, emitting shell radius ratio Rin/Rout, and the density profile index , such that the density profile r-β.
The manual fitting process can be briefly described as follows: Vmax is determined from the point at which the observed profile vanishes on the blue side, while Vmin is constrained by the width of the “flat-top” region of the emission line profile, i.e. the region between the velocity of the blue-shifted peak found at -Vmin and an inflection point in the profile found at +Vmin. Thus the Rin/Rout value is set so that the model line profile matches various inflection points of the observed profile, and the density profile is identified from the gradient of the observed line profile wings. Having fixed these values, we then iterate over the grain radius and dust mass to fit the observed profile (in the case of the Bayesian fitting process described below, the above procedures are done automatically).
We assume that at these late epochs the line-emitting gas is optically thin, with the emissivity distribution proportional to the square of the local gas density. The gas was kept smoothly distributed throughout. We assume that the supernova ejecta is in free expansion, such that V = Rout, where is the age of the supernova. However, this assumption does not hold for the Intermediate Width Components (IWCs) or for some hydrogen-emitting shells in some CCSNe models, and the Rout of the components is a free parameter in such cases. Unless otherwise specified, we keep the dust and the gas coupled in our simulations (so the smoothly distributed dust and the gas have the same Vmax, and values). We adopted intrinsic line flux ratios for the [O iii] 4959,5007, [O ii] 7319,7330 and [O i] 6300,6363 doublets fitted by the damocles models of 2.98, 1.23 and 3.13, respectively [Storey & Zeippen, 2000, Zeippen, 1987, Baluja & Zeippen, 1988].
We modelled the line profiles using smooth or clumped dust distributions. Clumps were adopted to have radii equal to Rout/40. The clumped dust models used the same Vmax and parameters as the coupled gas distribution, although distributed by a parameter, the clump distribution power law index, instead of the value used for the gas as well as for smoothly distributed dust models. From a 10D Bayesian model of SN 1987A 714 days past explosion [Bevan, 2018], values of 3 were found to be preferred for the clump distribution power law index as well as filling factors of ¡0.25. We fixed the clump distribution power law index to 3 and set the filling factor to 0.10 in order to reduce the number of free parameters required in our models. Varying the clump number density distribution power law index over values of 1-5 was found to change the dust mass needed to provide a good fit by a factor of 3.
We modelled a few SNe where instead of smoothly distributed gas, we used clumped gas coupled to the clumped dust, in order to determine the degree to which gas clumping would affect the derived dust mass. The amount by which the dust mass required to fit the line profiles changed was dependent on the difference between the best-fitting index, derived from the smoothly distributed dust gas model, and the fixed dust clump number density distribution index of 3. SN 1996cr, for which models required the highest value of out of the SNe in our sample, was found to require a dust mass 3.5 smaller in order to fit the line profiles when the gas and dust were co-located in clumps. SN 1970G, on the other hand, which was best fitted with a smoothly distributed gas value of -0.1, required a factor of two larger dust mass to fit the H line profile when the gas and dust were co-located in clumps.
A clumped dust model will present less of a scattering wing and attenuate the red wing of the line profile less than for a smooth dust model, given no change in other model parameters between the two cases. This is because when the dust is located in clumps, radiation is subject to less scattering as well as to less absorption. Therefore, for a clumped dust model to match the line profile generated by a smooth dust model, both a small modification to the grain radius to produce a larger albedo and a dust mass larger than for the smooth case by a factor of 1.5-3 are required. Several authors found that dust needed to be present in optically thick clumps in order to reproduce early observations of SN 1987A [Lucy et al., 1989, 1991, Bouchet et al., 1996, Kozma & Fransson, 1998]. So, for all objects in this work, the final dust masses we report are those found from clumped models, on the grounds that dust is more likely to exist in clumps for the CCSNe in our sample, rather than in a smoothly distributed medium.
Most line profiles can be fit using either 100 per cent amorphous carbon (AmC) or 100 per cent silicate dust with grain sizes with matching albedos, apart from cases where a large red scattering wing requires the dust species to have an albedo greater than 0.7, which could only be achieved by using silicate dust with grain radii in the range 0.1-1.0 m. For CCSNe where we cannot confirm the grain species but can roughly constrain the grain radius for each species, we present our final dust mass for the object using a 50:50 AmC to astronomical silicate dust species mixture, as some proportion of both carbon grains and silicates are often found to be needed from SED modelling of SN dust, e.g. for Cas A see Rho et al. [2008], Arendt et al. [2014], De Looze et al. [2017], while for 1E0102-7912 see Rho et al. [2009], Sandstrom et al. [2009].
All models were convolved to the spectral resolution of the optical data. For all figures showing line profile fits to optical data, ”dust-free” and dusty model line profiles are shown. These model line profiles have the same gas distribution, but the dusty model couples this gas distribution to a dust distribution and the dust-free model does not. This is to aid the reader to visualise how adding dust to the simulation affects the shape of the model line profile. The parameters for smooth and clumped AmC and silicate dust species are included in the tables listing model parameters. As was demonstrated in Niculescu-Duvaz et al. [2021], the choice of silicate grain species barely affects the dust optical depth in the optical regime, hence we use astronomical silicate species with the optical constants of Draine & Lee [1984] in our models. Our AmC models use the BE amorphous carbon optical constants of Zubko et al. [1996]. For some CCSNe in our sample, the grain radius of the species could not be constrained, often due to insufficient signal-to-noise in the observed line profiles, which also meant an upper limit could not be established on the dust mass. In these cases, we present results using conservative grain sizes for both the smoothly distributed and clumped 100 per cent AmC and 100 per cent silicate dust models to provide a rough estimate of possible dust mass values. For these CCSNe, we provide lower limits to the dust masses, given by the dust mass required to attenuate the line profiles using the grain radius that required the lowest dust masses, which was 0.1 m for a 50:50 AmC to silicate ratio.
In order to quantify errors on the model parameters, we also conducted a Bayesian analysis on all supernova spectra, with the exception of those that exhibited multiple emission components. The Bayesian approach to modelling line profiles with damocles is described by Bevan [2018]. It combines an affine invariant Markov Chain Monte Carlo (MCMC) ensemble sampler, emcee [Goodman & Weare, 2010, Foreman-Mackey et al., 2013] with damocles to sample the posterior probability distribution of the input parameters, which is defined by Bayes’ Theorem:
| (1) |
In this equation, D is the data, is the set of parameters of the model, P() is our prior understanding of the probability of the parameters, and P(D—) is the likelihood, which is the probability of obtaining the data for a given set of parameters. The likelihood function is proportional to , where =/, and is the number of degrees of freedom and is expressed in equation (2):
| (2) |
In this equation, fmod,i is the modelled flux in bin i, fobs,i is the observed flux in frequency bin i, and is the combined Monte Carlo and observational uncertainty in bin i. The modelled line profile from which fmod,i is sampled has its peak normalised to the peak flux of the observed line profile. The priors for each model are given in uniform space, apart from the dust mass and grain radius which span several magnitudes, so they are given in log-uniform space.
The final posterior probability distributions are presented as a series of 2D contour plots, where each pair of parameters are marginalised over the other parameters. A 1-D marginalised posterior probability distribution for each parameter is also presented. The ”best fitting” parameter value from the Bayesian analysis is given as the median of the marginalised 1-D probability distribution, as many deviated from a Gaussian distribution. The lower and upper limits represent the 16th and 84th quartiles for the same 1-D probability distribution. The Bayesian model fits presented in this work usually use either a 100 per cent AmC or 100 per cent silicate dust composition, and in cases where we present a final dust mass using a 50:50 AmC to silicate dust ratio, which is determined manually, we find the percentage errors on the dust mass from the limits found by the Bayesian analysis and scale them to that value. As we had to run many models, we restricted our parameter space to 5 dimensions, explored by 250 walkers. For each parameter, the number of iteration steps for the autocorrelation function to initially decay down towards zero can be estimated to be one autocorrelation time. This value was checked for every parameter in every Bayesian model. We checked that each model was run for 5 or more autocorrelation times to ensure convergence. We also checked the acceptance fraction for each simulation, which averaged at around 0.3.
For emission line profiles where intermediate width components took up a large part of the profile, we could not use a Bayesian analysis to evaluate the errors, as the Bayesian version of damocles can only model single component emission lines. In these cases we used estimates to evaluate the goodness of fit, and compared the values of dusty and dust-free models. We present a value for every dusty model. The uncertainty limits on our final dust mass are then given by a 35 per cent variation in when varying only the dust mass and fixing all other parameters, as this value leads to uncertainties on the dust mass that are of a similar magnitude to the uncertainties found from Bayesian inference.
III.2 Application to CCSNe
III.2.1 SN 1957D
SN 1957D is the oldest supernova modelled in this work. It was first discovered by H. Gates on 28/12/1957 in M 83, when it was well past maximum light, so its exact explosion date is unknown. We adopt an M 83 redshift of 0.00115 for SN 1957D (Meyer et al. [2004]).
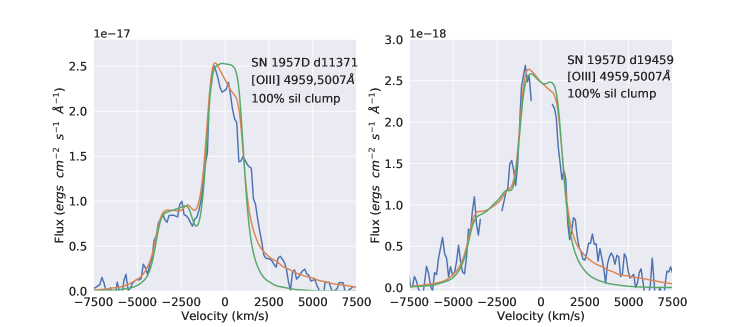
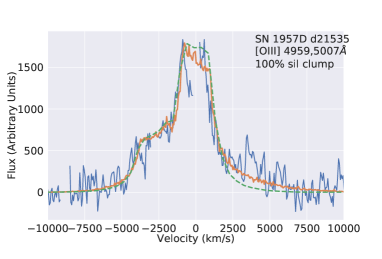
We modelled the [O iii] 4959,5007- emission from SN 1957D at 11371, 19459 and 21535 days past explosion. Observational data for the first two epochs are summarised in Table LABEL:table:archiv-obs-sum. We combined all the GMOS and X-Shooter spectra of SN 1957D (Tables 1 and 2) to make the nominal day 21535 spectrum. As we could not constrain the dust species, smooth and clumped AmC and silicate dust models for all epochs can be found in Table LABEL:table:4sn-params. Our clumped silicate dust-affected [O iii] 4959,5007- line profile models can be found in Figures 1 and 2 for all epochs. From a manual investigation of the parameter space, we found the best fitting models to the line profile shapes required similar Vmax, and Rin/Rout for the three epochs, where there appeared to be a possible small increase of dust mass over time. Due to the presence of a persistent red scattering wing, we found that our clumped dusty models required a grain radius of 0.4 m for 100 per cent AmC grains, 100 per cent silicate dust grains, or a 50:50 carbon to silicate mixture in order to provide the best model fits to the [O iii] doublet at all epochs. The derived dust masses at all epochs in SN 1957D were found to be low compared to the dust masses that we find for SN 1979C and SN 1980K at similar epochs. Table LABEL:table:4sn-params lists the derived dust parameters for 100 per cent AmC or 100 per cent silicate compositions. For a 50:50 carbon to silicate mixture the best-fitting dust masses were 0.012, 0.035 and 0.05 M⊙ for days 11371, 19459 and 21535.
In order to constrain the uncertainties on the model parameters, we ran a Bayesian MCMC analysis for days 11371 and 21535 of SN 1957D using 100 per cent carbon dust. The resulting corner plot for the day 11371 model can be found in Figure A1. We were able to constrain the AmC grain radius at 11371 days to be m, where the median value of the grain radius 1-D posterior probability distribution was 0.3 m, very similar to our previously estimated grain radius of 0.4 m. As this was the epoch with the best signal to noise, we fixed the grain radius derived at this epoch to be the value adopted for our manual models at the other epochs. The dust mass that we had derived for an AmC carbon grain species, from a manual examination of parameter space, was a factor of 2.5 smaller than the median value derived from the 1-D posterior probability distribution for the dust mass. We applied the percentage errors taken from the Bayesian analysis to our best fit dust mass derived from a manual fit for 50:50 AmC to silicate dust using a grain radius of 0.4 m, to derive absolute upper and lower limits. The parameters were less well constrained at day 21535 due to a lower signal-to-noise [O iii] profile, and the median dust mass was 5 less than our best fitting model for clumped carbon grains, but our manually estimated value was well within the error uncertainties on the dust mass from the Bayesian analysis.
We considered the signal-to-noise of the day 19459 spectrum to be too low to conduct a Bayesian analysis, and instead derived a dust mass of 0.035 M⊙ for a 50:50 AmC to silicate mixture with a grain radius of 0.3 m, where a dust-free model gave a of 1.4, while the dusty models returned an average of 0.8.
| SN | Line | Epoch | Clumped? | % Sil | a | Vmax | Vmin | Rout | Rin | Mdust | |||
|---|---|---|---|---|---|---|---|---|---|---|---|---|---|
| days | m | km s-1 | km s-1 | 1015 cm | 1015 cm | M⊙ | |||||||
| 1957D | [O iii] | 11371 | no | 0 | 0.4 | 5800 | 870 | 2.5 | 1079 | 140.3 | 0.5 | 0.17 | |
| 1957D | [O iii] | 11371 | yes | 0 | 0.4 | 5800 | 870 | 2.7 | 1079 | 140.3 | 1.0 | 0.31 | |
| 1957D | [O iii] | 11371 | no | 100 | 0.2 | 5800 | 870 | 2.5 | 1079 | 140.3 | 0.4 | 0.32 | |
| 1957D | [O iii] | 11371 | yes | 100 | 0.4 | 5800 | 870 | 2.5 | 1079 | 140.3 | 1.4 | 0.18 | |
| 1957D | [O iii] | 19459 | no | 0 | 0.4 | 6800 | 1020 | 2.4 | 1265 | 164.5 | 1.5 | 0.16 | 0.89 |
| 1957D | [O iii] | 19459 | yes | 0 | 0.4 | 6800 | 1020 | 2.4 | 1265 | 164.5 | 2.5 | 0.41 | 0.76 |
| 1957D | [O iii] | 19459 | no | 100 | 0.2 | 6800 | 1020 | 2.4 | 1265 | 164.5 | 0.8 | 0.11 | 0.84 |
| 1957D | [O iii] | 19459 | yes | 100 | 0.4 | 6800 | 1020 | 2.4 | 1265 | 164.5 | 3.5 | 0.14 | 0.83 |
| 1957D | [O iii] | 21535 | no | 0 | 0.4 | 7500 | 962 | 2.5 | 1377 | 179.0 | 3.0 | 0.15 | |
| 1957D | [O iii] | 21535 | yes | 0 | 0.4 | 7500 | 962 | 2.5 | 1377 | 179.0 | 5.0 | 0.27 | |
| 1957D | [O iii] | 21535 | no | 100 | 0.2 | 7500 | 962 | 2.5 | 1377 | 179.0 | 2.0 | 0.22 | |
| 1957D | [O iii] | 21535 | yes | 100 | 0.4 | 7500 | 962 | 2.5 | 1377 | 179.0 | 7.0 | 0.19 | |
| 1970G | H | 16713 | no | AmC | 0.20 | 6700 | 2546 | -0.3 | 968.6 | 290.6 | 1.5 | 0.34 | |
| 1970G | H | 16713 | yes | AmC | 0.25 | 6700 | 2546 | -0.3 | 968.6 | 290.6 | 1.5 | 0.34 | |
| 1970G | H | 16713 | no | sil | 0.20 | 6600 | 3960 | -0.3 | 954.2 | 572.5 | 7.0 | 0.61 | |
| 1970G | H | 16713 | yes | sil | 0.20 | 6600 | 3960 | -0.1 | 954.2 | 572.5 | 10.0 | 1.12 | |
| 1980K | H | 13169 | no | 0 | 3.50 | 5300 | 4505 | 1.5 | 593.1 | 504.0 | 40.0 | 0.53 | |
| 1980K | H | 13169 | yes | 0 | 3.50 | 5300 | 4505 | 1.5 | 593.1 | 504.0 | 60.0 | 0.81 | |
| 1980K | H | 13169 | no | 100 | 0.10 | 5300 | 4505 | 1.5 | 593.1 | 504.0 | 20.0 | 0.92 | |
| 1980K | H | 13169 | yes | 100 | 0.10 | 5300 | 4505 | 1.5 | 593.1 | 504.0 | 60.0 | 2.91 | |
| 1980K | [O i] | 13169 | no | 0 | 3.50 | 5300 | 3445 | 1.5 | 593.1 | 385.5 | 40.0 | 0.67 | |
| 1980K | [O i] | 13169 | yes | 0 | 3.50 | 5300 | 3445 | 1.5 | 593.1 | 385.5 | 60.0 | 0.97 | |
| 1980K | [O i] | 13169 | no | 100 | 0.10 | 5300 | 3445 | 1.5 | 593.1 | 385.5 | 20.0 | 1.43 | |
| 1980K | [O i] | 13169 | yes | 100 | 0.10 | 5300 | 3445 | 1.5 | 593.1 | 385.5 | 60.0 | 4.13 | |
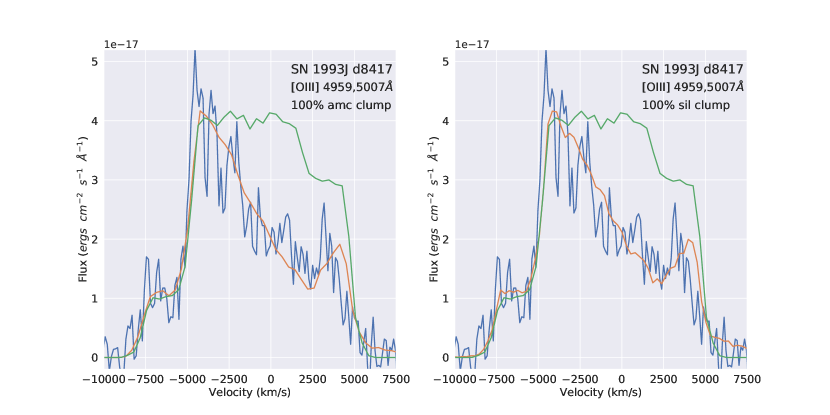
| 1993J | [O iii] | 8417 | no | 0 | 0.20 | 5800 | 4408 | 5 | 421.8 | 320.6 | 1.3 | 0.86 | |
| 1993J | [O iii] | 8417 | yes | 0 | 0.20 | 5800 | 4408 | 5 | 421.8 | 320.6 | 2.5 | 1.66 | |
| 1993J | [O iii] | 8417 | no | 100 | 0.04 | 5800 | 4408 | 5 | 421.8 | 320.6 | 25.0 | 0.82 | |
| 1993J | [O iii] | 8417 | yes | 100 | 0.04 | 5800 | 4408 | 5 | 421.8 | 320.6 | 50.0 | 1.64 |
III.2.2 SN 1970G
SN 1970G was discovered on July 30th 1970 [Detre & Lovas, 1970]. It is located in the galaxy M 101, [for which we adopted a redshift of z=0.000811 from Sabater et al., 2012]. It was classified as a type II-L supernova from its light curve [Young & Branch, 1989a] although Barbon et al. [1979] considered that it could be a transitional object between II-P and II-L,
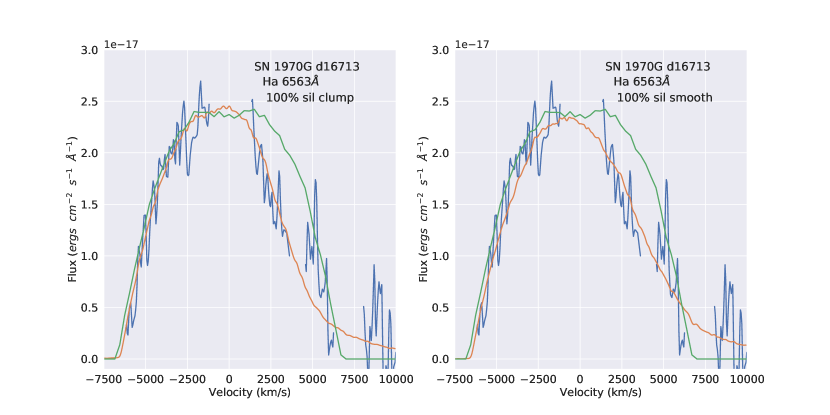
As the red wing of the H profile was cut off in our GMOS-N spectrum of SN 1970G taken at 16733 days post-explosion, we combined it with an MMT spectrum taken 16693 days post-explosion, averaging to an epoch of 16713 days, Both spectra had detections of broad H 6563 and [O i] 6300,6363 , with a weaker detection of [O iii] 4959,5007 . The GMOS spectrum was convolved to the resolution of the MMT spectrum of 7. Unfortunately, part of the red wing in the MMT spectrum was tainted by what appears to be an absorption feature and by nebular [S ii] 6717, 6731- emission. These were removed from the H line before modelling with damocles. We omit models of the [O i] 6300,6363 line due to low signal to noise and the blending of its red wing with the H line.
Our damocles models for SN 1970G were constructed for an age of 16713 days, with the best fitting clumped silicate dust models for the H profile shown in Figure 3. The parameters for the smooth and for the clumped AmC and silicate dust models are listed in Table LABEL:table:4sn-params. The grain radius or grain species cannot be well constrained from the H line, due to gaps in the line profile in the red wing. We thus present conservative grain radius estimates for both smoothly distributed and clumped 100 per cent AmC and 100 per cent silicate dust models. The clumped dust mass derived from the best fits to the H profile ranges from 0.02 M⊙ for a 100 per cent AmC dust distribution to 0.1 M⊙ for a 100 per cent silicate distribution. All the dusty models had a lower value than for the dust free case (=1.58). We found a marginal improvement of the value for a 100 per cent silicate dust model over a 100 per cent amorphous carbon model. Therefore, our preferred dust mass for SN 1970G is M⊙, where the limits are taken from a Bayesian inference.
A similar value can be obtained by decoupling the H emitting gas from the dust, which is distributed using the parameters found for the freely expanding [O i]-emitting ejecta model. No additional dust component coupled to the H emitting region is required. The value is minimized when there is a small overlap between the radii of the H shell and the ejecta dust shell, so as to induce some dust absorption on the red wing of the H line.
The H and [O i] emission line models require different Vmax, Rin/Rout and values, indicating that the two emitting species are not co-located. The assumption of an H distribution that is expanding freely and coupled with the dust can create a model which fits the profile well, but leads to derived dust masses that are of a factor of 5 less than the dust masses derived from the [O i] modelling.
III.2.3 SN 1979C
SN 1979C was discovered on April 19th 1979 in M 100 [Mattei et al., 1979]. It was thought to be a Type II-L supernova from the fast decline of its light curve and absence of a plateau [Panagia et al., 1980]. The explosion was considered unusually bright when compared to other Type II-Ls, with a peak MB of –20 mag [Young & Branch, 1989b].
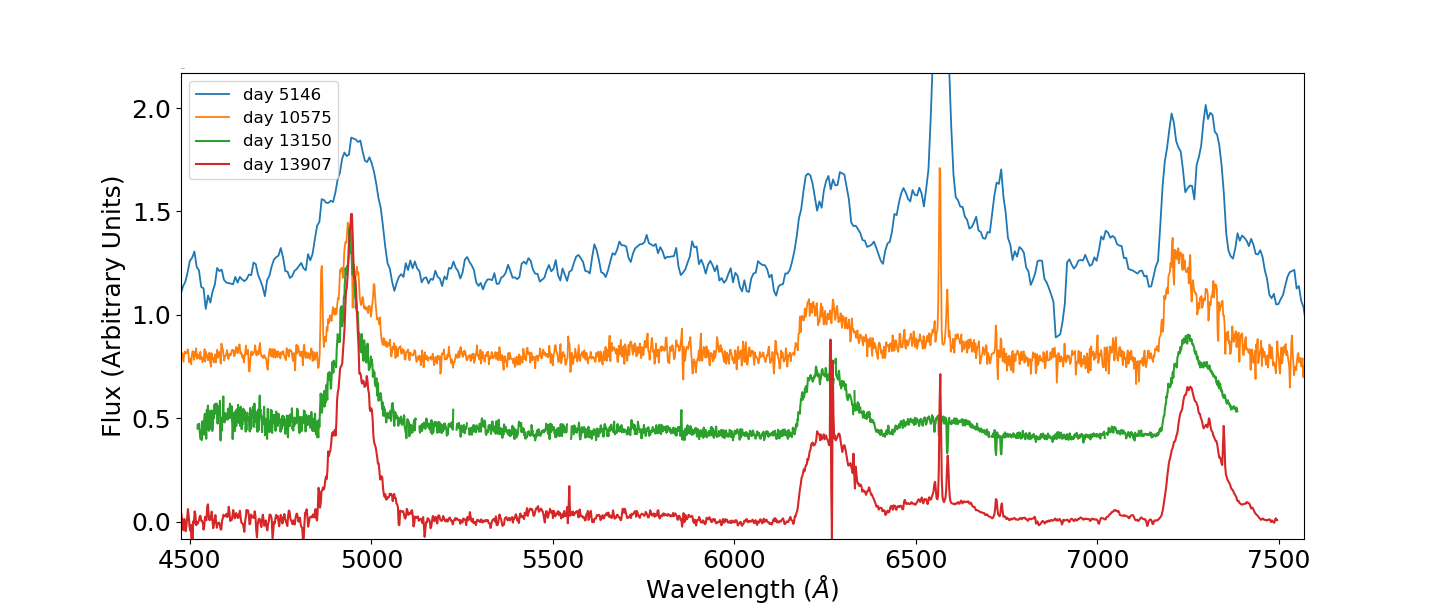
Figure 4 shows the evolution of the spectra through 5146, 10575, 13150 and 13907 days. The spectra have been corrected for the redshift of the host galaxy of z = 0.00525 [Van Driel et al., 2016]. At the earliest epoch, the oxygen doublets are double peaked, most noticeably the [O ii] 7319,7330- profile, with a weaker peak centred at 0 km s-1. The central peak declines in brightness over 10,000 days until it is barely visible at 13907 days. The H profiles at day 10575 and beyond notably lack this central peak, and are far more symmetric than the forbidden oxygen emission lines. We interpreted the central peak to be an intermediate width component (IWC), possibly formed by an ejecta-CSM interaction, while we term the broader underlying profile to be the broad component (BC), which represents the fast-expanding ejecta. We assumed a simple model setup for the oxygen lines at days 5146 and 13150 and for the [O iii] doublet at day 13907, in which the dust has formed in the ejecta, and is therefore coupled with the BC, and the separate component emitting the IWC is located where Rin,IWC Rout,BC, and whose red-shifted emission is affected by absorption by the ejecta dust. We found that no separate dust component co-located with the IWC was necessary, but note that the shape of the IWC on day 5146 is unclear due to the lower resolution, while at later epochs the IWC is faint, so we cannot rule out this possibility.
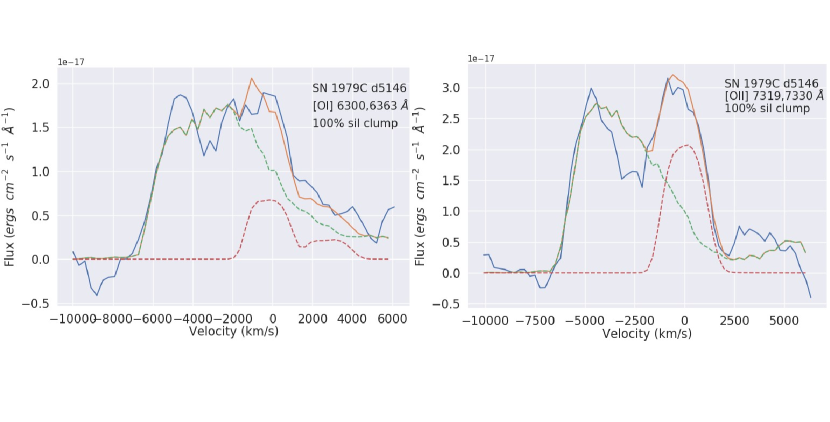
Models of the [O i] 6300,6363- and [O ii] 7319,7330- doublets at an epoch of 5146 days are shown in Figure 5. We did not model the [O iii] 4959,5007- doublet at 5146 days as there were several poorly subtracted narrower nebular lines present which, given the low resolution, obscured the line profile shape. The dust was optically thick at this epoch. We found that for a dust clump of 100% astronomical silicate at a line wavelength of 7319 Å.
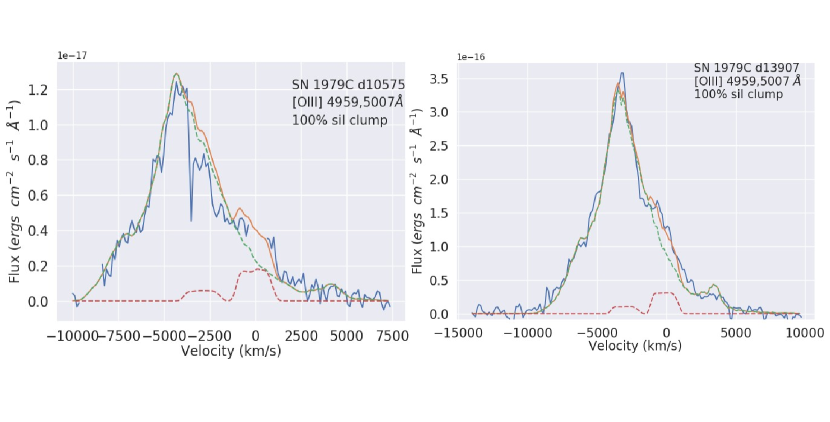
We modelled the [O i] 6300,6363-, [O ii] 7319,7330- and [O iii] 4959,5007- doublets at days 10575 and 13907 post-explosion. The best-fitting clumped silicate dust models are shown in Figures 6 and 7.
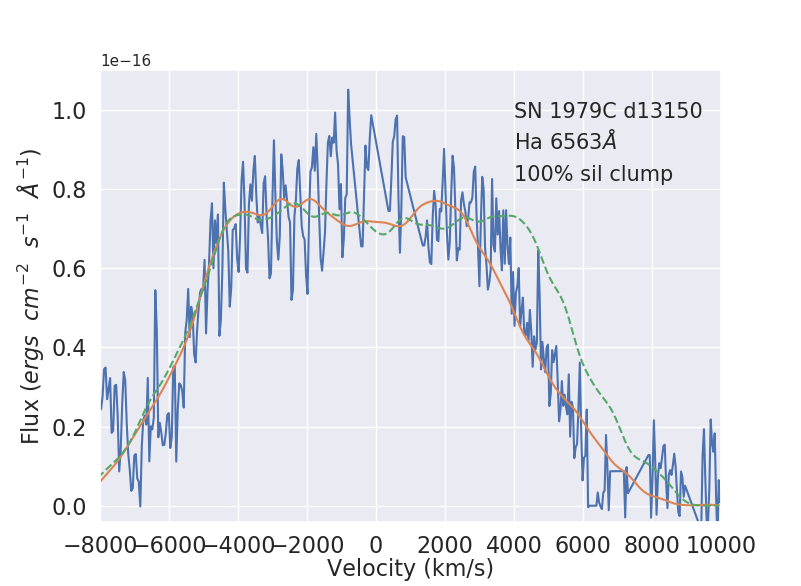
We modelled the H line profile at day 13150, as it was slightly less blended with the [O i] profile at this epoch than at day 13907, which can be seen in Figure 8. We used a dust clumping mass fraction of 0.95 for all our clumped models at all epochs. A diagram showing the adopted distributions of the H and oxygen emitting regions for SN 1979C can be seen in Figure A7.
| Epoch | Line | Comp. | Clumped? | Species | a | Vmax | Vmin | Rout | Rin | Mdust | |||
|---|---|---|---|---|---|---|---|---|---|---|---|---|---|
| days | m | km s-1 | km s-1 | 1015 cm | 1015 cm | M⊙ | |||||||
| 5146 | [O ii] | BC | Yes | AmC | 0.20 | 6700 | 5360 | 4.5 | 302.0 | 241.0 | 22.0 | 0.15 | 3.43 |
| 5146 | [O ii] | BC | No | AmC | 0.13 | 6700 | 5360 | 4.5 | 297.0 | 237.0 | 6.2 | 0.03 | 4.32 |
| 5146 | [O ii] | BC | Yes | sil | 0.06 | 6800 | 5440 | 4.5 | 297.0 | 237.0 | 10.6 | 2.40 | 3.38 |
| 5146 | [O ii] | BC | No | sil | 0.05 | 6800 | 5440 | 4.5 | 297.0 | 237.0 | 2.8 | 1.00 | 4.00 |
| 5146 | [O ii] | IWC | 1800 | 1260 | 0.1 | 430.0 | 301.0 | ||||||
| 5146 | [O i] | BC | Yes | AmC | 0.20 | 7000 | 5320 | 4.5 | 311.2 | 236.5 | 12.9 | 0.10 | 1.72 |
| 5146 | [O i] | BC | No | AmC | 0.13 | 7000 | 5320 | 4.5 | 311.2 | 236.5 | 4.1 | 0.02 | 2.33 |
| 5146 | [O i] | BC | Yes | sil | 0.06 | 7000 | 5320 | 4.5 | 311.2 | 236.5 | 17.3 | 2.40 | 1.70 |
| 5146 | [O i] | BC | No | sil | 0.05 | 7000 | 5320 | 4.5 | 311.2 | 236.5 | 3.8 | 0.70 | 2.15 |
| 5146 | [O i] | IWC | 1800 | 1260 | 0.1 | 430.0 | 301.0 | ||||||
| 10575 | [O iii] | BC | Yes | AmC | 0.15 | 6900 | 4485 | 6.0 | 630.4 | 409.8 | 16.2 | 0.35 | 1.96 |
| 10575 | [O iii] | BC | No | AmC | 0.13 | 6900 | 4485 | 6.0 | 630.4 | 409.8 | 4.2 | 0.08 | 1.96 |
| 10575 | [O iii] | BC | Yes | sil | 0.04 | 6900 | 4485 | 6.0 | 630.4 | 409.8 | 16.5 | 12.0 | 1.94 |
| 10575 | [O iii] | BC | No | sil | 0.04 | 6900 | 4485 | 6.0 | 630.4 | 409.8 | 3.4 | 2.50 | 1.92 |
| 10575 | [O iii] | IWC | 1300 | 910 | 0.1 | 1000 | 700.0 | ||||||
| 10575 | [O ii] | BC | Yes | AmC | 0.20 | 7000 | 4410 | 4.5 | 639.6 | 402.9 | 16.0 | 0.45 | |
| 10575 | [O ii] | BC | No | AmC | 0.13 | 6800 | 4080 | 4.5 | 621.3 | 372.8 | 5.4 | 0.09 | |
| 10575 | [O ii] | BC | Yes | sil | 0.06 | 6600 | 4950 | 5.5 | 603.0 | 452.3 | 11.7 | 10.0 | |
| 10575 | [O ii] | BC | No | sil | 0.05 | 6600 | 4950 | 5.5 | 603.0 | 452.3 | 7.0 | 3.00 | |
| 10575 | [O ii] | IWC | 1400 | 980 | 0.1 | 1000 | 700.0 | ||||||
| 10575 | [O i] | BC | Yes | AmC | 0.20 | 6800 | 4760 | 4.0 | 621.3 | 434.9 | 6.9 | 0.45 | 0.46 |
| 10575 | [O i] | BC | No | AmC | 0.13 | 6800 | 4760 | 4.0 | 621.3 | 434.9 | 2.9 | 0.06 | 0.47 |
| 10575 | [O i] | BC | Yes | sil | 0.06 | 6800 | 4964 | 5.5 | 621.3 | 453.6 | 19.2 | 10.0 | 0.47 |
| 10575 | [O i] | BC | No | sil | 0.05 | 6800 | 4964 | 5.5 | 621.3 | 453.6 | 2.7 | 2.00 | 0.48 |
| 10575 | [O i] | IWC | 1400 | 980 | 0.1 | 1000 | 700.0 | ||||||
| 13150 | H | BC | Yes | AmC | 0.20 | 8900 | 4005 | 1.5 | 1710 | 855.0 | 3.6 | 0.16 | 0.90 |
| 13150 | H | BC | No | AmC | 0.13 | 8900 | 4005 | 1.5 | 1710 | 855.0 | 3.8 | 0.08 | 0.87 |
| 13150 | H | BC | Yes | sil | 0.06 | 8900 | 4005 | 1.5 | 1610 | 805.0 | 4.9 | 3.40 | 0.95 |
| 13150 | H | BC | No | sil | 0.05 | 8900 | 4005 | 1.5 | 1610 | 805.0 | 1.8 | 2.45 | 0.88 |
| 13907 | [O iii] | BC | Yes | AmC | 0.15 | 6700 | 3618 | 4.6 | 805.0 | 434.7 | 10.2 | 0.30 | 2.50 |
| 13907 | [O iii] | BC | No | AmC | 0.13 | 6700 | 3618 | 4.6 | 805.0 | 434.7 | 3.1 | 0.08 | 2.90 |
| 13907 | [O iii] | BC | Yes | sil | 0.04 | 6700 | 3618 | 4.9 | 805.0 | 434.7 | 8.1 | 8.50 | 2.90 |
| 13907 | [O iii] | BC | No | sil | 0.04 | 6700 | 3618 | 4.9 | 805.0 | 434.7 | 2.6 | 2.70 | 3.08 |
| 13907 | [O iii] | IWC | 1400 | 980 | 0.1 | 1190 | 833.0 | ||||||
| 13907 | [O ii] | BC | Yes | AmC | 0.20 | 6600 | 3696 | 2.2 | 793.0 | 444.1 | 3.0 | 0.16 | |
| 13907 | [O ii] | BC | No | AmC | 0.13 | 6600 | 3696 | 2.2 | 793.0 | 444.1 | 1.9 | 0.08 | |
| 13907 | [O ii] | BC | Yes | sil | 0.06 | 6600 | 3696 | 2.2 | 793.0 | 444.1 | 3.6 | 4.40 | |
| 13907 | [O ii] | BC | No | sil | 0.05 | 6600 | 3696 | 2.2 | 793.0 | 444.1 | 1.6 | 2.45 | |
| 13907 | [O i] | BC | Yes | AmC | 0.20 | 6800 | 3808 | 2.2 | 817.1 | 457.6 | 3.7 | 0.16 | 0.37 |
| 13907 | [O i] | BC | No | AmC | 0.13 | 6800 | 3808 | 2.2 | 817.1 | 457.6 | 1.9 | 0.06 | 0.44 |
| 13907 | [O i] | BC | Yes | sil | 0.06 | 6800 | 3808 | 2.2 | 817.1 | 457.6 | 5.7 | 4.40 | 0.43 |
| 13907 | [O i] | BC | No | sil | 0.05 | 6800 | 3808 | 2.2 | 817.1 | 457.6 | 2.0 | 2.00 | 0.43 |
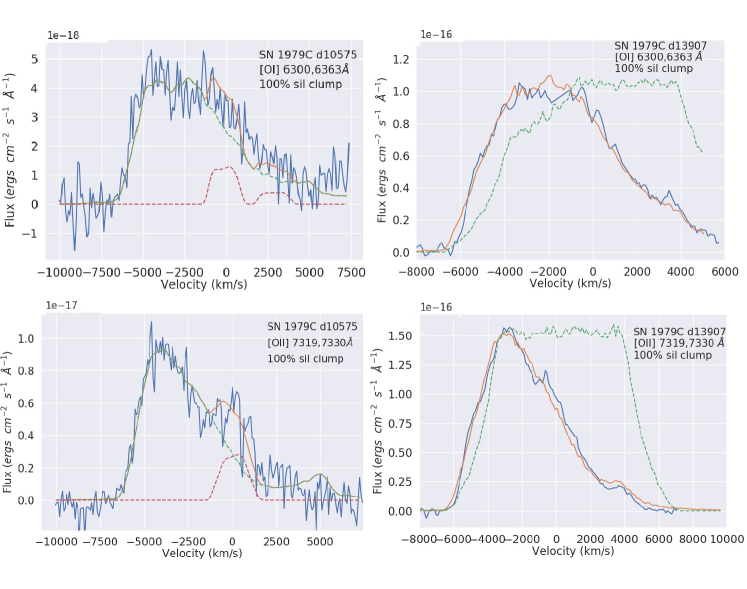
The grain radius was originally constrained for a smooth AmC dust model from the scattering wing of the [O ii] 7319,7330- line profile at day 13907, which had the best signal to noise of all the line profiles for any epoch. The albedo for this dust grain radius was 0.48. For a clumped amorphous carbon dust composition, as well as for a smooth and clumped silicate dust composition, we found dust grain radii that best matched this albedo. These grain sizes, along with the rest of the model parameters, are listed for all the modelled lines in Table 5. The grain radius derived at this epoch was fixed for the other epochs.The dust masses derived using 100 per cent silicate compositions are much higher than for the 100 per cent AmC models, leading us to favour dust models for SN 1979C that have a silicate proportion of 50 per cent or less. For consistency with the other CCSNe modelled in our sample, we use a 50:50 AmC to silicate dust composition with a single grain radius, for which in this case the best fitting grain radius was 0.1 m, to report our final preferred dust masses.
From a manual parameter space examination, the [O i], [O ii] and [O iii] lines at day 10575 all required similarly large dust masses, where the [O i] and [O ii] doublets could be well fit with models of matching parameters. We note that the [O iii] distribution differs from that of [O i] and [O ii] in requiring a higher value, which implies the [O iii] gas is more densely distributed than the other oxygen ion species. A higher value requires more dust to provide the same amount of absorption as a model with a lower , which has led to slightly higher dust masses derived from modelling the [O iii] doublet in comparison to the other oxygen ion lines. These trends also apply to the spectral lines at day 13907 past explosion.
Using a Bayesian analysis, we evaluated the errors on the ejecta dust masses at day 10575 and 13907 that were derived from the [O ii] doublet, where the resulting corner plots can be found in Figures A2 and A3. We removed the IWC component to the [O ii] line at both epochs prior to modelling. The oxygen line profiles appear significantly red-shifted between days 10575 and 13907, so quantifying the errors on the derived dust masses is particularly important. Simulations for both epochs were run with 100 per cent clumped AmC dust, where the median dust mass at both epochs agreed very well with our initial estimates for the 100 per cent AmC dust masses shown in Table 5. We therefore extrapolated the dust mass uncertainties to our 50:50 AmC to silicate dust masses for a 0.1 m single-size grain radius, leading to dust masses of 0.65 and 0.30 M⊙ at days 10575 and 13907. Whilst the median values would indicate dust destruction between the two epochs, the large error bars on the dust mass at day 10575 mean we cannot definitely conclude that dust destruction is happening. However, this possibility makes SN 1979C a particularly interesting target for continuing observations. We also note that both Bayesian runs favoured grain radii of 0.03-0.63 m for 100 per cent AmC grains, where the 1-D probability distribution at day 13907 peaked at the same grain radii found with the manual fitting process, namely 0.2 m.
To model the H line at day 13150, we decoupled the dust and gas distributions, where the dust distribution shared that of the [O ii] and [O i] models for day 13907, and the gas was located such that Rin,Ha = Rout,O. We found a good fit to the H line with this simple model, seen in Figure 8. The for the dusty models averaged 0.9, while it was 1.5 for the dust-free model.
III.2.4 SN 1980K
SN 1980K was discovered by P. Wild on 1980 October 28 in NGC 6946, and reached a peak brightness of V = 11.4 mag a few days later [Buta, 1982]. Montes et al. [2000] estimated an explosion date for SN 1980K of 2nd October 1980, which we use in this work. The detection of a broad H line in early spectra and a linearly decaying light curve after peak brightness resulted in its classification as a Type II-L SN [Barbon et al., 1979]. The emergence of a near-IR flux excess in 1981 led Dwek [1983] to surmise that there could be dust in 1980K, but they could not resolve whether the dust was newly formed in the ejecta or pre-existing grains in a CSM. Milisavljevic et al. [2012] presented a spectrum of SN 1980K obtained 30 years after explosion (on day 10964) and postulated that there could be dust present in the ejecta based on the observed blue-shifting of their H and [O i] line profiles. The profiles of the day 10964 lines were modelled using damocles by Bevan et al. [2017] (B17), who derived a dust mass of 0.2 M⊙ for a dust composition that was deduced to be dominated by silicate grains, from the presence of extended red scattering wings.
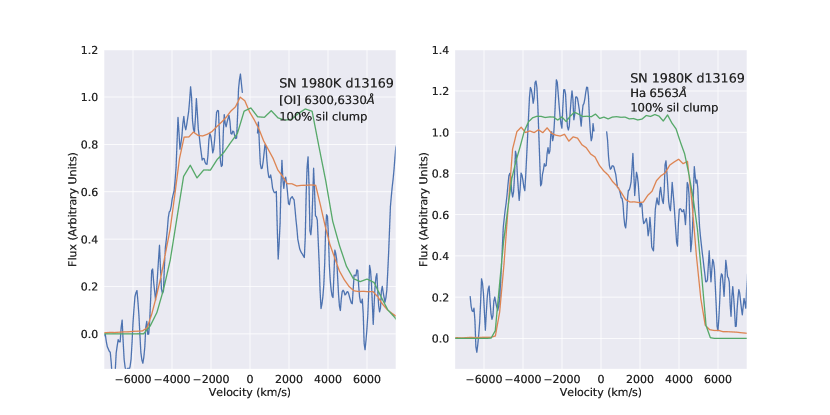
We have summed the day 12977 MMT spectrum of SN 1980K (Table LABEL:table:archiv-obs-sum) with our GMOS spectra taken at a mean epoch of 13361 days after explosion (Table 1), correcting for the small recessional velocity of the host galaxy (40 km s-1). The resulting ‘day 13169’ spectrum of SN 1980K has a slightly higher S/N than the day 10964 spectrum taken six years earlier by Milisavljevic et al. [2012] and modelled by B17, but not a high enough S/N to conduct a Bayesian analysis. We have modelled the [O i] 6300,6363- and H lines using the same species and grain radius values as B17. Our best fit clumped silicate dust models are shown in Figure 9, with the parameters listed in Table LABEL:table:4sn-params. The model parameters for the [O i] line we found were similar to those of B17, although the density exponent of required for our best-fitting models was lower than their day 10964 best-fitting value of . The best-fitting dust mass required to attenuate the [O i] line profile, for a 100 per cent clumped silicate model with a grain radius of 0.1 m, was 0.60 M⊙. It was possible to fit the H line profile with similar parameters as those used to model the [O i] line. Therefore, we ran a Bayesian analysis of the H and [O i] line simultaneously using a silicate dust grain species, which provided the dust mass uncertainty limits on the value referenced above. The day 10964 dust mass of 0.3 M⊙ derived by B17 using the same grain parameters is within our calculated uncertainties.
Setting the Rin value for the H-emitting gas to be equal to the Rout value of the [O i] distribution, as in the case of SN 1979C, could not replicate the observed H line profile, as then the absorption induced by the dust that is coupled with the [O i]-emitting ejecta produced an over-absorption of the red wing of the H line. The adopted distributions of the H and oxygen emitting regions in SN 1980K can be seen in Figure A7.
III.2.5 SN 1993J
SN 1993J is located in the nearby M 81 galaxy and was discovered on 28/03/1993 [Ripero et al., 1993]. Baron et al. [1993] established an explosion date of 27/03/1993. The asymmetries in the broad oxygen lines in the late-time spectra led Fransson et al. [2005] and Milisavljevic et al. [2012] to speculate on the presence of dust in the SN, and modelling by B17 of the red-blue asymmetries in the latter’s day 6101 spectrum using damocles yielded an ejecta silicate dust mass of 0.1 M⊙. Zsíros et al. [2022] modelled archival 3.6-24-m Spitzer SEDs of SN 1993J, obtained between 3875 and 5359 days post-explosion, and found there could be either M⊙ of silicate dust or M⊙ of amorphous carbon dust, emitting at T200 K, significantly less than the 0.1 M⊙ found by B17, which we attribute to the insensitivity of the Spitzer measurements to colder dust emitting longwards of 24 m.
For SN 1993J we modelled the [O iii] 4959,5007 Å doublet profile from an MMT spectrum taken 8417 days past explosion (Table LABEL:table:archiv-obs-sum). This spectrum had a lower S/N than the day 6101 spectrum of Milisavljevic et al. [2012] which was modelled by B17, enabling only the [O iii] doublet to be modelled by us. We corrected the spectrum for a recessional velocity for M 81 of 140 km s-1 and used the same dust compositions as B17 in our models. Our best-fit clumped silicate and AmC dust models are shown in Figure 10, with parameters listed in Table LABEL:table:4sn-params.
For a 100 per cent clumped silicate dust distribution with a grain radius of 0.04 m, as in B17, we found a best-fit day 8417 dust mass of 0.50 M⊙, from manually fitting the [O iii] doublet, versus B17’s day 6101 dust mass of 0.15 M⊙. Like B17, we were not quite able to fit the red wing of the [O iii] doublet, which could be due to the over-simplification of assuming that all of the emitting oxygen is distributed with a uniform density power-law, as discussed by B17 in their Section 4.3.
A Bayesian model of the [O iii] doublet using a 100 per cent silicate dust composition returned a median dust mass of 0.21 M⊙. However, as the grain species or radius could not be determined for SN 1993J, we adopt the dust mass of M⊙ obtained for a 50:50 AmC to silicate dust mass ratio with a grain radius of 0.1 m, where the error limits are scaled from the percentage errors of the Bayesian best-fitting 100 per cent silicate dust mass of 0.21 M⊙ reported above.
| SN | Epoch | Line | Clumped? | Comp. | Species | a | Vmax | Vmin | Rout | Rin | Mdust | |||
|---|---|---|---|---|---|---|---|---|---|---|---|---|---|---|
| days | m | km s-1 | km s-1 | 1015 cm | 1015 cm | M⊙ | ||||||||
| 1986E | 3712 | H | yes | BC | AmC | 0.20 | 7100 | 3337 | 2.3 | 225.8 | 106.1 | 1.7 | 6.55 | 1.14 |
| 1986E | 3712 | H | no | BC | AmC | 0.20 | 7100 | 3337 | 3.0 | 225.8 | 106.1 | 0.7 | 2.34 | 1.04 |
| 1986E | 3712 | H | yes | BC | sil | 0.55 | 7100 | 3337 | 2.3 | 225.8 | 106.1 | 25 | 12.2 | 1.11 |
| 1986E | 3712 | H | no | BC | sil | 0.55 | 7100 | 3337 | 3.0 | 225.8 | 106.1 | 7.1 | 3 | 1.06 |
| 1986E | 3712 | H | yes | IWC | sil | 0.20 | 2300 | 575 | -0.5 | 948.0 | 237.0 | 5 | 1.75 | |
| 1986E | 10619 | [O i] | yes | BC | AmC | 0.20 | 6600 | 3102 | 3.0 | 603.8 | 241.5 | 3.5 | 1.39 | 1.02 |
| 1986E | 10619 | [O i] | no | BC | AmC | 0.20 | 6600 | 3102 | 3.0 | 603.8 | 241.5 | 2.5 | 0.97 | 0.99 |
| 1986E | 10619 | [O i] | yes | BC | sil | 0.55 | 6600 | 3102 | 3.0 | 603.8 | 241.5 | 25 | 1.33 | 1.05 |
| 1986E | 10619 | [O i] | no | BC | sil | 0.55 | 6600 | 3102 | 3.0 | 603.8 | 241.5 | 15 | 0.78 | 1.04 |
| 1986E | 10619 | [O i] | yes | IWC | sil | 0.20 | 2300 | 1725 | 2.0 | 1000 | 650.0 | 5 | 0.34 | |
| 1986E | 10619 | H | yes | BC | AmC | 0.20 | 6600 | 3102 | 3.0 | 603.8 | 283.8 | 2.5 | 1.13 | 1.07 |
| 1986E | 10619 | H | no | BC | AmC | 0.20 | 6600 | 3102 | 3.0 | 603.8 | 283.8 | 2 | 0.86 | 1.03 |
| 1986E | 10619 | H | yes | BC | sil | 0.55 | 6600 | 3102 | 3.3 | 603.8 | 283.8 | 25 | 1.51 | 1.16 |
| 1986E | 10619 | H | no | BC | sil | 0.55 | 6600 | 3102 | 3.3 | 603.8 | 283.8 | 15 | 0.86 | 1.09 |
| 1986E | 10619 | H | yes | IWC | sil | 0.20 | 2100 | 1365 | 1.0 | 1000.0 | 650.0 | 5 | 0.35 | |
| 1986E | 11723 | H | yes | BC | AmC | 0.20 | 6600 | 2640 | 3.0 | 668.3 | 314.1 | 3.5 | 1.39 | 0.92 |
| 1986E | 11723 | H | no | BC | AmC | 0.20 | 6600 | 2640 | 3.0 | 668.3 | 314.1 | 2.5 | 1.04 | 0.93 |
| 1986E | 11723 | H | yes | BC | sil | 0.55 | 6600 | 2640 | 3.0 | 668.3 | 314.1 | 35 | 1.77 | 0.91 |
| 1986E | 11723 | H | no | BC | sil | 0.55 | 6600 | 2640 | 3.0 | 668.3 | 314.1 | 25 | 1.34 | 0.93 |
| 1986E | 11723 | H | yes | IWC | sil | 0.20 | 1900 | 1330 | 2.0 | 1100.0 | 770.0 | 5 | 0.23 | |
| 2004et | 646 | H | no | BC | sil | 0.2 | 9500 | 7410 | 1.7 | 53.02 | 39.24 | 0.03 | 0.5 | |
| 2004et | 646 | H | no | IWC | sil | 0.2 | 3000 | 450 | 1.6 | 170.0 | 51.00 | 0.12 | 0.39 | |
| 2004et | 646 | H | yes | BC | sil | 0.2 | 9500 | 7410 | 1.7 | 53.02 | 39.24 | 0.05 | 0.57 | |
| 2004et | 646 | H | yes | IWC | sil | 0.2 | 3000 | 450 | 1.6 | 170.0 | 51.00 | 0.2 | 0.73 | |
| 2004et | 3849 | H | no | BC | sil | 0.2 | 6000 | 5400 | 2 | 200.5 | 180.5 | 0.6 | 0.81 | 1.22 |
| 2004et | 3849 | H | yes | BC | sil | 0.2 | 6000 | 5400 | 2 | 200.5 | 180.5 | 1.0 | 1.31 | 1.25 |
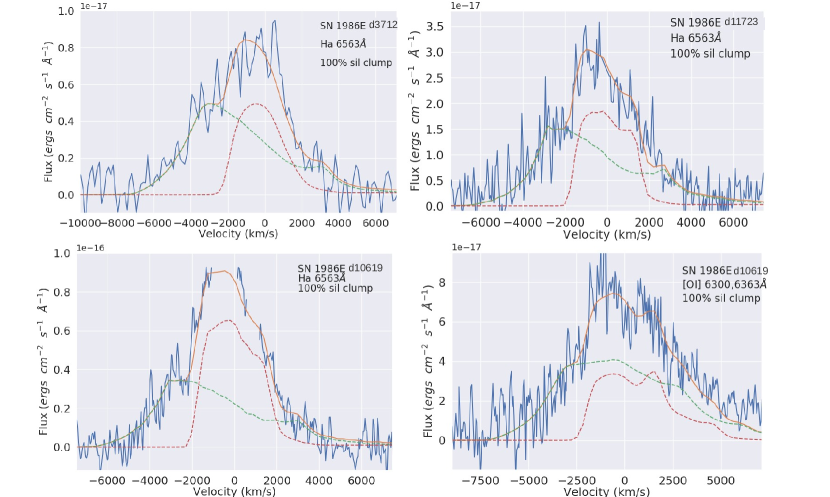
III.2.6 SN 1986E
SN 1986E was discovered on April 13th 1986 in NGC 4302, by G. Candeo at the Asiago Observatory [Rosino, 1986]. An optical spectrum taken a month later of SN 1986E led Pennypacker et al. [1986] to infer that it was around 2 months past maximum brightness, and they classified SN 1986E as a Type II supernova from the presence of strong, broad H and [O i] 6300,6363 lines with P-Cygni profiles in the spectra. We adopt an explosion date of 13/03/1986 for our models. Cappellaro et al. [1990] fitted photometric measurements of SN 1986E, taken over the course of 2 years, with the light curve of the typical Type II-L SN 1979C.
Our optical spectra were corrected for a recessional velocity of NGC 4302 of 1148 km s-1. We have modelled the evolving optical emission H line profile of SN 1986E at ages of 3712, 10619 and 11723 days, and also modelled the [O i] 6300,6363- doublet at day 10619, as the shape of the doublet at the other epochs is too unclear. Our best-fitting models can be found in Figure 11. The day 3712 spectrum was taken from the WISeREP archive111https://wiserep.weizmann.ac.il/ and appears to be unpublished: it has a spectral resolution of 12 .
There is a strong contribution to both the H and [O i] 6300,6363-Å line profiles from an IWC and a BC, where the brightness of the IWC relative to that of the BC increases between days 3712 and 10619 past-explosion, and decreases between days 10619 to 11723. The IWC of SN 1986E is a much more prominent component to the profiles than for the emission lines of SN 2004et and SN 1979C at similar epochs, and it also varies much less in relative brightness over a longer period of time than for either SN 2004et or SN 1979C. The evolving spectra suggest there could be an interaction between the SN ejecta and an extended, smooth CSM. We assume the broad component (BC) in both the H and [O i] profiles represents the freely expanding ejecta, whereas the IWC represents a collision-region between CSM and the ejecta, where the outer radius of the IWC is a free parameter.
The spectrum at day 10619 has the highest S/N and we consider the model parameters derived for this epoch the most reliable. As much of the BC shape is not visible due to the overlapping IWC and the presence of a scattering wing cannot be determined due to low S/N, we could not accurately constrain the grain species or grain radius of the dust inducing the red-blue asymmetry in the BC. Model parameters using conservative grain sizes for either a 100 per cent AmC or a 100 per cent silicate dust composition in the BC are listed in Table LABEL:table:1986e-params. We derived clumped dust masses which minimized the values between the model and observed H BC profiles of SN 1986E for the three epochs for a 50:50 carbon to silicate composition with a single grain radius of 0.1 m. These dust masses were 0.03-0.024 M⊙ at day 3712 and 0.07-0.065 M⊙ at 10619 and 11723 days, where the lower limits were determined by a 35 per cent variation to the best-fitting value. We could not determine accurate upper limits for these epochs due to optically thick conditions for dust masses higher than the best fitting value but the above values indicate some dust mass growth in the ejecta of SN 1986E between days 3712-11723.
It is difficult to independently determine a dust mass from the BC of the [O i] doublet profile at day 10619 due to low S/N. However, we find we can fit the [O i] BC and IWC components with the same dust mass as that used for the H model, implying that the oxygen- and hydrogen-emitting gas could be co-located in SN 1986E, differing from the cases of SN 1980K, 1979C and 1970G.
We tried a model for the H line profile at all 3 epochs where the dust was coupled to the freely expanding ejecta represented by the BC, and the IWC outer radius was set so that Rin,IWC = Rout,BC, as in the case for our models for SN 2004et at day 646. However, this setup led to over-absorption of the red wing of the IWC by the dust in the BC. Therefore, the inner radius of the IWC needs to be slightly larger than the outer radius of the BC. A diagram of the distributions adopted for the SN 1986E H and oxygen-line emitting regions can be found in Figure A7. The IWC showed a red scattering wing, most noticeably in the H profile at day 10619 which could be best fit using a mass of 0.05 M⊙ for 0.2-m silicate dust grains coupled to the IWC gas. As this dust would be located outside the BC-emitting shell, it would not induce a red-blue asymmetry in the broad component.
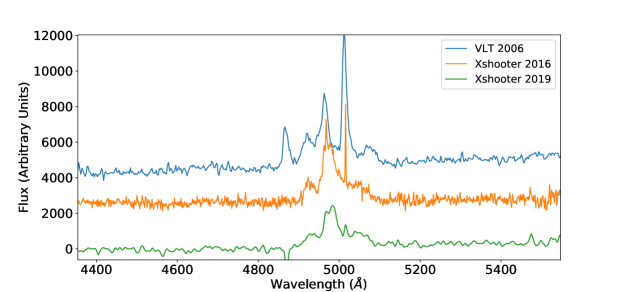
III.2.7 SN 1996cr
SN 1996cr in the Circinus galaxy was first identified as an ultra-luminous X-ray source by Bauer et al. [2001]. VLT optical spectra of the source taken by Bauer et al. [2008] revealed broad oxygen emission lines, and strong narrow H emission which allowed them to classify the source as a supernova remnant created by a Type IIn supernova explosion. Multi-wavelength archival observations helped them constrain the explosion date to between 28/02/1995 and 16/03/1996. We have adopted the latter date in order to calculate the post-explosion ages corresponding to our X-Shooter spectra of SN 1996cr.
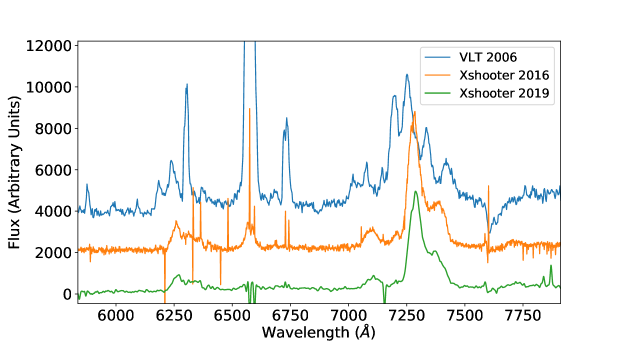
The evolution of the optical spectrum of SN 1996cr from 2006-2019 is shown in Figure 12. The oxygen doublets display red-blue asymmetries at every epoch. The 2006 VLT FORS I spectrum was first presented by Bauer et al. [2008]. The oxygen doublets at this epoch have multiple peaks, indicative of ejecta interactions with a complex, likely asymmetric CSM. Ten years later, some of the peaks had disappeared from both the blue and red-shifted parts of the oxygen doublets, and the strength of the H line has decreased substantially between 2006 and 2016, disappearing almost entirely by 2019. We assume that the spectrum of SN 1996cr in 2006 is dominated by the complicated ejecta-CSM interactions, whereas by 2016 the spectrum is dominated by ejecta emission, hence making it an ideal epoch to model with damocles.
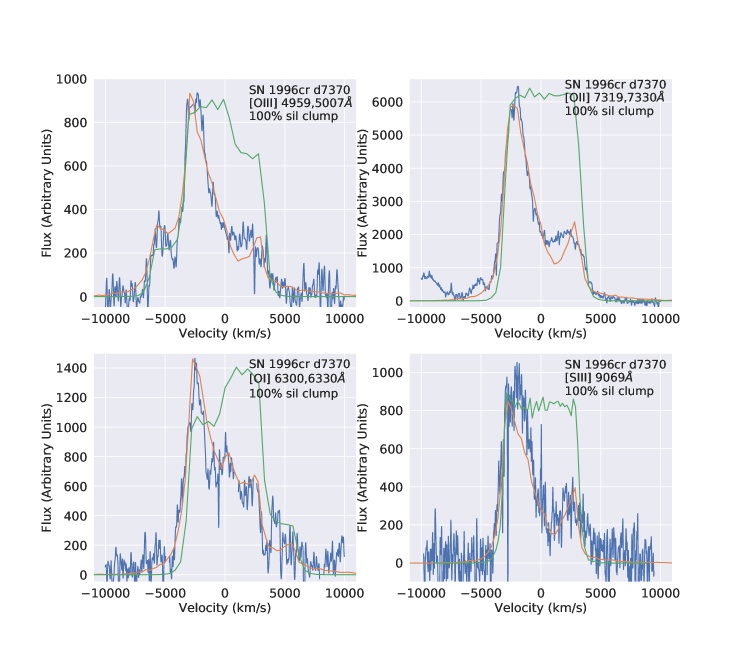
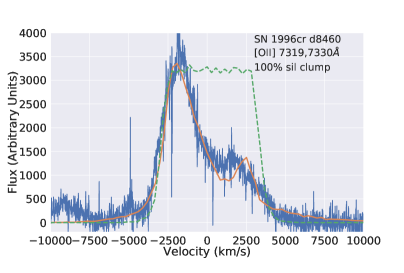
We merged our day 7360, 7362 and 7389 X-Shooter spectra to form a ‘day 7370’ spectrum. Similarly, we merged our day 8446 and 8474 X-Shooter spectra to form a ‘day 8460’ spectrum. Our best fitting damocles models to the [O i] 6300,6363-Å, [O ii] 7319,7330-Å, [O iii] 4959,5007-Å and [S iii] 9069-Å lines at 7370 days are shown in Figure 13, and for the [O ii] doublet 8460 days after explosion in Figure 14. A recessional velocity of 510 km/s was adopted for the Circinus galaxy. Model parameters for both epochs are listed in Table 8. We were able to fit all the lines at day 7370 with similar values for Vmax, and Rin/Rout, implying a mixing of ionisation states in the remnant. Since dust absorption has a grain-radius to wavelength dependence, we were able to find a single dust grain radius which required a matching dust mass that fit all the doublets simultaneously. However, due to the lack of a red scattering wing, which if present could have ruled out high AmC dust proportions, we were not able to constrain the dust species. Therefore, we present model fits for smooth and clumped 100 per cent AmC and 100 per cent silicate dust, where in both cases we were able to constrain the dust grain radius for a clumped distribution to 0.12m and 0.05m. Due to the strength of the oxygen lines from the ejecta of SN 1996cr, a high proportion of silicates, from 50-100 per cent, seems likely.
To try and rigorously constrain the error limits on the grain radius and dust mass, we ran a Bayesian simulation fitting the day 7370 [O iii] and [O ii] lines simultaneously using 100 per cent silicate dust. The distributions of the [O iii]- and [O ii]-emitting ions were assumed to be co-located, and coupled to the dust. The resulting corner plot can be seen in Figure A4. Small silicate grains (m) are seen to be marginally preferable over larger ones. The median grain radius is 0.07 m, very close to our initial estimate of 0.05 m. The silicate dust mass probability distribution is strongly peaked at 0.47 M ⊙, and the error limits are well defined. For a 50:50 ratio of carbon to silicate dust with a single grain radius of 0.11 m, we obtain a dust mass of 0.10 M⊙. The quoted uncertainties on this value are derived from the Bayesian errors, which are taken as percentage errors on the median value and then used for the dust mass derived for the 50:50 carbon to silicate dust mix in order to obtain absolute uncertainties.
We only modelled the [O ii] 7319,7330-Å doublet in the day 8460 spectrum, as all the other lines had a low signal to noise. For a 50:50 ratio of AmC to silicate dust, using a single grain radius of 0.11 m, 0.15 M⊙ of dust was required to fit the profile, where error limits were determined by a Bayesian analysis. The formal uncertainties on the dust masses are too high to infer anything about the evolution of the dust mass of SN 1996cr between 2016 and 2019.
III.2.8 SN 1998S
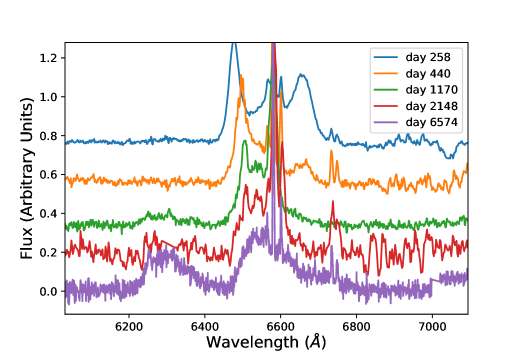
SN 1998S was a Type IIn object discovered in NGC 3877 on March 2nd 1998 [Li et al., 1998]. Its optical spectrum has changed extensively over the first 6000 days post-explosion. The spectrum was dominated by a CSM interaction at very early times. After 100 days the fairly symmetric line profiles changed drastically, and the H and He i 10830-Å lines showed a highly asymmetrical triple-peaked structure [Gerardy et al., 2000]. Fransson et al. [2005] attributed the multi-peaked H line profile to a geometrically thin cool dense shell (CDS) behind the reverse shock, at large optical depths. Between days 258-440 (see Figure 15) this multi-peaked structure can be seen to exhibit a pronounced red-blue asymmetry which could be attributable to newly formed dust.
Mauerhan & Smith [2012] noted that after ten years the optical spectrum had become more dominated by ejecta emission, with the oxygen forbidden lines brightening relative to H (Fig. 15), although the high H luminosity indicated that SN 1998S was still interacting with dense circumstellar material.
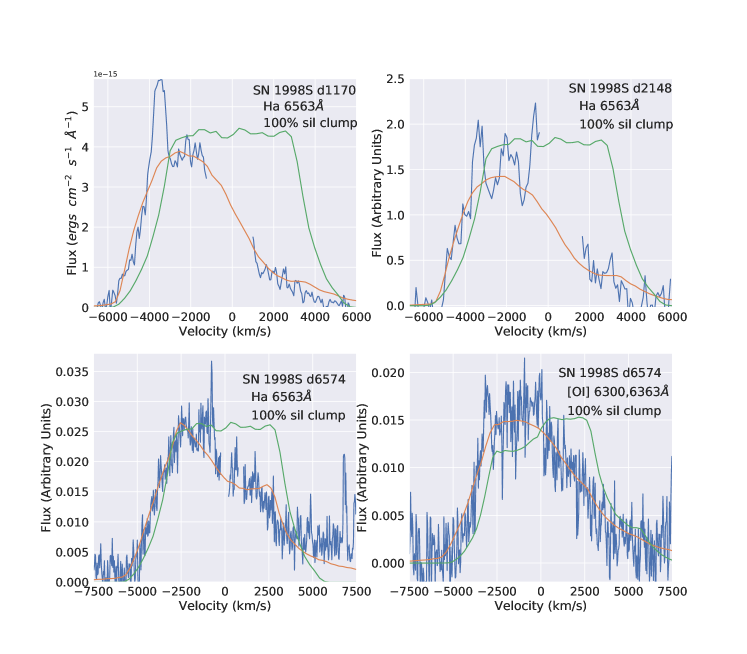
There is potential evidence for dust formation in SN 1998S. NIR photometry and spectra between days 305–1242 (Gerardy et al. [2000] and Pozzo et al. [2004]) showed CO emission and a significant IR excess in the spectral energy distribution, although it was unclear how much this could be due to IR echoes reflecting off pre-existing dust clouds in the outer CSM [Sugerman et al., 2012]. However, Mauerhan & Smith [2012] also noted blue-shifted peaks to the H and oxygen line profiles and the disappearance of a red-shifted peak in the H spectral line between days 1093 and 2900, which could indicate dust formation. It is unclear as to what quantities of dust were being formed in the ejecta or in a CDS around SN 1998S.
We model the H line from archival spectra at days 1170, 2148 and 6574 days past explosion; [O i] 6300,6363 is bright enough at day 6574 to model as well. The sources of these published archival data are listed in Table LABEL:table:archiv-obs-sum. The spectra were corrected for a recessional velocity of NGC 3877 of 847 km s-1 [Fassia et al., 2000]. The day 1170 and 2148 H lines show a sharp blue-shifted emission spike around -4000 km s-1, in the same location as that seen on day 440. We do not try to fit this feature in our models, as it is likely a feature leftover from the CSM-ejecta collision. The spectra at these epochs have fairly low resolution, so much of the profile is also taken up by narrow H emission features. We try and fit our ejecta models to the underlying shape similar to that seen at day 6574 in the more ejecta-dominated era, where the narrower peaks have disappeared.
At day 6574 the H, and to a lesser extent the [O i] profile, exhibited a red scattering wing, and we found that a 100 per cent silicate dust model improved the value by a factor of 1.5 compared to the best fitting 100 per cent AmC dust model. Hence we only show models consisting of a 100 per cent silicate dust distribution for all epochs in Fig 16, with parameters listed in Table 8. We note, however, that it is possible for the earlier epochs to be tracing dust in a CDS region. We cannot determine the degree of similarity of the underlying H profile between earlier and later epochs due to the earlier line profiles being affected by narrow components between -2000 and 1000 km s-1, but it is clear that a red scattering wing is much more evident at day 6574 than at days 1170 and 2148. Due to S/N limitations, for the day 1170 and 2148 line profiles the value is the same for a 100 per cent carbon or 100 per cent silicate dust species.
We cannot determine whether SN 1998S’s dust mass grew between days 1170 and 2148, as the dust required to attenuate the line profiles is optically thick at both epochs (see values in Table 8), and the line profiles have significant ”gaps” as discussed above. Due to this, our clumped models use a clump mass fraction of 0.85, with the rest of the dust being smoothly distributed. The optical depth of a single dust clump at day 1170 was calculated to be 28. We find a dust mass of roughly 2.5 M⊙ at day 1170 and 4.0 M⊙ at day 2148, with uncertainties at day 2148 given by a 35 per cent variation about the best fitting value, and those at day 1170 taken from the 1D posterior distribution of the dust mass found from a Bayesian model of the H line for a 100 per cent silicate dust species.
At day 6574 we found that the H and [O i] lines could be well fit with matching parameters, implying a co-location of the emitting species. We found that a grain radius of 0.08 m for clumped silicate dust fitted both profiles best, and this grain radius and dust species was fixed for the other two epochs. It was close to the median grain radius of 0.20 m found from a Bayesian analysis run with 100 per cent silicate dust for H and [O i] simultaneously. We can fit both lines with a clumped silicate dust mass of around 0.15 M⊙, with the uncertainties also taken from the Bayesian model referenced previously. This represents a significant increase in dust mass from the earlier epochs (a factor of ten).
III.2.9 SN 2004et
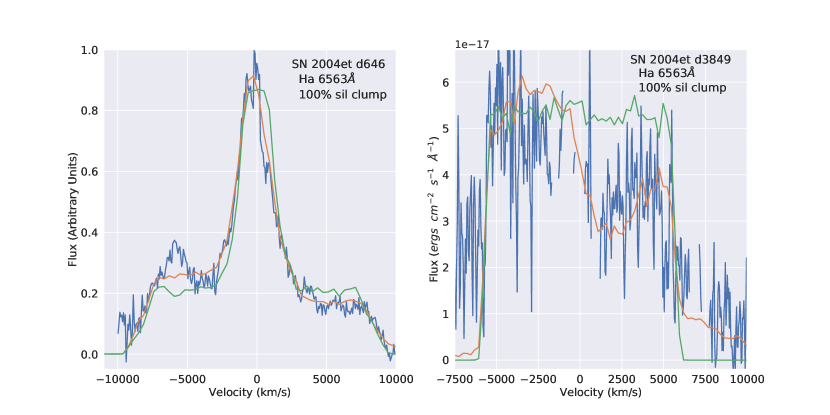
SN 2004et was a Type II-P supernova discovered on 2004 September 22 [Zwitter et al., 2004] in NGC 6946, the same galaxy that hosts SN 1980K. We adopt the discovery date as the explosion date. The optical spectrum was monitored from day 8-451 by Sahu et al. [2006], who noted that the emission peaks became blue-shifted at around day 300, suggesting early dust-formation.
Kotak et al. [2009] and Fabbri et al. [2011] continued to monitor the late-time optical spectra, where the H line became box-like around 2 years past explosion, perhaps indicative of an ejecta collision with a CSM, forming a cool dense shell (CDS). Kotak et al. [2009] presented Spitzer observations between days 64-1406, where they inferred from modelling the SED that M⊙ of newly formed radioactively heated silicate dust was present in the ejecta. Fabbri et al. [2011] also modelled the optical and mid-IR SED of SN 2004et, and found dust masses, made from 80 per cent silicate and 20 per cent AmC, that increased from M⊙ at day 300 to M⊙ at day 690.
We have modelled the H line profile of SN 2004et at days 646 and 3686 post-explosion (information on the spectra can be found in Tables 1 and LABEL:table:archiv-obs-sum.) The spectra were corrected for a recessional velocity of NGC 6946 of 40 km s-1. As both the work of Kotak et al. [2009] and Fabbri et al. [2011] found that a high proportion of silicates was required to fit the IR SED of SN 2004et, we only use 100 per cent silicate dust grains for our damocles models. From a visual inspection, the H line appears very different between the two epochs. The spectrum at day 646 also has a clear IWC not present at day 3686, possibly due to a cool dense shell (CDS) formed by ejecta-CSM interaction, or else due to flash-ionized CSM gas, as well as a broad component (BC) representing the fast-expanding ejecta.
We assumed a simple model setup where the ejecta emits the BC, and a separate component emits the IWC, where Rin,IWC = Rout,BC. The dust required for a good fit to the day 646 H BC, around M⊙, barely introduced an asymmetry in the IWC profile and we found that a separate dust mass component of around M⊙ was required to fit the IWC. Parameters for our models can be found in Table LABEL:table:1986e-params, with the line profile fits shown in Figure 17.
Due to the presence of a scattering wing in the day 646 intermediate width component, we were able to constrain the silicate grain radius to around 0.2 m. From a Bayesian analysis of the BC component (Figure A5), we were able to quantify the uncertainties on the dust mass that had formed in the ejecta, the lower and upper limits being 4 M⊙ and 2.9 M⊙, but we were not able to constrain the grain radius due to uncertainties in the continuum level. We have therefore adopted the same grain radius for the BC dust component as was required to fit the IWC. The dust mass derived for this grain radius functions roughly as a lower limit, as smaller or larger silicate grains require more dust to produce the same optical depth.
By day 3849, the H line-emission from the IWC had faded, and the H emission is dominated by the ejecta. The signal to noise in this spectrum is low (Fig 17), but there does appear to be a red scattering wing in the profile, which limits the silicate dust grains to 0.1 m in radius, and rules out larger grain radii 0.5m. A grain radius of 0.2 m and a dust mass of around 0.01 M⊙ gave a value of 1.2 when comparing the observed spectra and the model, with a lower limit of M⊙ and an upper limit of 0.9 M⊙ taken from a varying the best-fitting of 35 per cent when all other parameters were fixed. This indicates a likely growth by a factor of 20 of the dust mass in the ejecta of SN 2004et between days 646 and 3849.
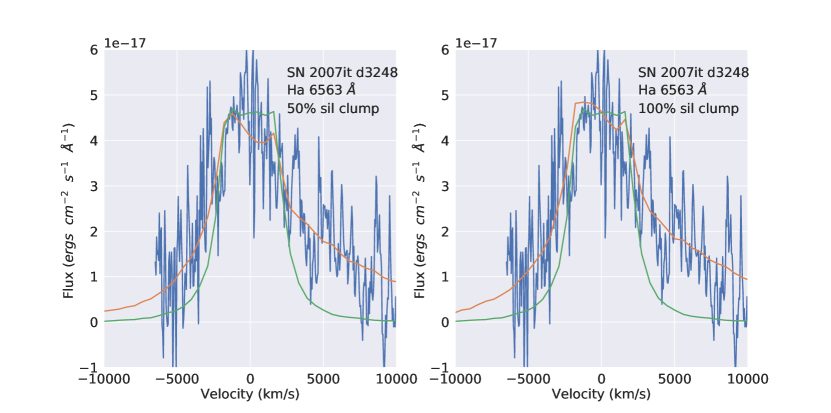
III.2.10 SN 2007it
SN 2007it was discovered in NGC 5530 by R. Evans on 13/09/2007 at V=13.5 mag [Evans et al., 2007, Itagaki et al., 2007]. Pre-discovery images taken with the All Sky Automated Survey (ASAS-3) constrained the explosion date to be between September 4 and 6 2007 [Pojmanski et al., 2007]. We adopt an explosion date of 5/09/2007. Andrews et al. [2011b] studied SN 2007it in the optical and IR regime between 10-944 days after explosion. They classified it as a Type II-P supernova based on the plateau in its optical lightcurve between days 20-107.
At day 540 the optical lines of SN 2007it showed an intermediate width component in the [O i] and H profiles. Andrews et al. [2011b] also analysed the IR SEDs at four epochs between days 351-944. Day 351 showed the presence of an IR excess, well before the estimated time of new dust formation from the optical lightcurves, which they attributed to scattering dust in a CSM producing a light echo. They also found that the IR flux doubled in intensity at 5m between days 351-561, and at the same time saw a dimming in the visible light curve, which they attributed to dust formation in the ejecta. They modelled the 0.1-10-m SED with Mocassin between days 351 and 944 and found that up to M⊙ of dust had formed in the ejecta by day 944.
We combined our day 3136 X-Shooter spectrum with our day 2780 and 3830 GMOS spectra, as all 3 spectra initially had fairly low S/N ratios and overplotting the 3 spectra did not show significant differences in line profile shape over time. The spectra were corrected for a recessional velocity of NGC 5530 of 1170 km s-1. damocles models were made for ‘day 3248’ post-explosion, the average of the three epochs. The presence of a red scattering wing implies a silicate dust proportion larger than 50 per cent. The best fitting models for a 50:50 AmC to silicate dust mixture and for 100 per cent silicate dust are plotted in Figure 18, with model parameters listed in Table 8. A model using 50:50 AmC to silicate dust species with a grain radius of 0.3 m and a dust mass of M⊙, minimized the value. The uncertainties on this value are taken from a Bayesian model of the H line of SN 2007it. It should be noted that it is difficult to accurately delineate the shape of the H profile, due to the low S/N of the combined spectra and the fact that the blue edge of the H profile is blended with the [O i] 6300,6363-Å profile. Therefore, there is a large degree of uncertainty in the values of the model parameters.
III.2.11 SN 2010jl
SN 2010jl was discovered in UGC 5189A on November 3rd 2010. Stoll et al. [2011] established an explosion date for SN 2010jl of 09/10/10, from its detection in pre-discovery images, and noted that SN 2010jl was very luminous with a peak absolute magnitude of . It was classified as a Type IIn near maximum light, from the presence of narrow lines emitted by flash-ionized CSM [Benetti et al., 2010, Yamanaka et al., 2010]. It has been well studied at optical and infrared wavelengths, with many authors estimating dust masses present in SN 2010jl. Several authors have modelled the optical and NIR line profiles first noted by Smith et al. [2012] after 30 days, and others have modelled the IR excess, also commencing 30 days after maximum light. Andrews et al. [2011a], Fransson et al. [2014], Sarangi et al. [2018] and Bevan et al. [2020] all concluded that a light echo from pre-existing CSM dust was responsible for the IR excess before day 400, while Bevan et al. [2020] found that ejecta/CSM dust dominated the IR SED after this time. Estimates of the newly formed dust mass, likely present in the CDS/ejecta, range from M⊙ at day 500, to ( M⊙ at day 800 [Maeda et al., 2013, Gall et al., 2014, Chugai, 2018, Sarangi et al., 2018, Bevan et al., 2020].
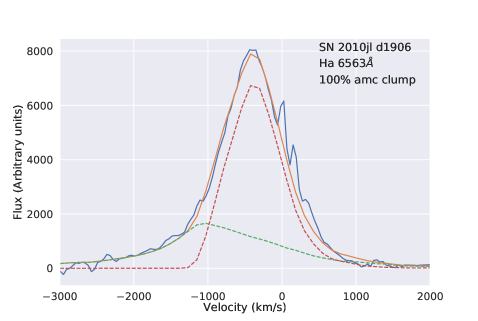
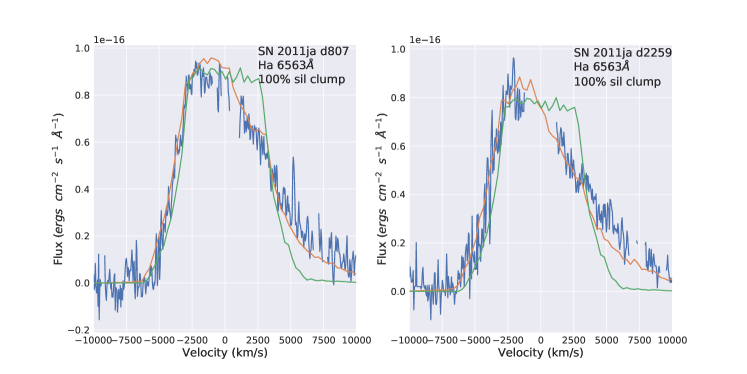
| Vmax,IWC (km s-1) | 1150 |
|---|---|
| Vmin,IWC (km s-1) | 370 |
| Vmax,BC (km s-1) | 15000 |
| Vmin,BC (km s-1) | 1150 |
| 0.8 | |
| -2.5 | |
| a (m) | 0.15 |
| Mdust ( M⊙) | 1.8 |
| 12.6 | |
| Rout (1015 cm) | 230 |
| Rin (1015 cm) | 26.4 |
We obtained a good S/N detection of the H emission profile in our day 1906 Gemini GMOS spectrum. Narrow nebular lines of H and [N ii] 6584,6548 were removed using the dipso ELF routine. The spectrum was corrected for a recessional velocity of UGC 5189A of 3167 km s-1. We extrapolated the Bevan et al. [2020] day 1286 H model parameters for SN 2010jl to model our day 1906 H profile. We summarise their model below, which is described in more detail in Section 4.2 of their paper. Their model consists of 3 components: a smooth slowly expanding CSM gas region emitting an IWC, a rapidly expanding smooth ejecta gas component producing a BC, and a clumped dust component. The bounds of the model were set by Rout, representing the location of the forward shock, and Rin, the location of the reverse shock. Instead of assuming free expansion, the velocity of emitting packets in the CSM were sampled from a power law velocity distribution p(v) vα, between the limits Vmax,IWC and Vmin,IWC. The BC used a radius-independent power-law velocity distribution, p(v) vβ, between the limits Vmax,BC and Vmin,BC where for continuity Vmin,BC=Vmax,IWC. A gas emissivity law r-4 was used for both the ejecta and CSM components. The AmC dust was clumped with a filling factor of 0.1.
| SN | Epoch | Line | Clumped? | % Sil | a | Vmax | Vmin | Rout | Rin | Mdust | |||
|---|---|---|---|---|---|---|---|---|---|---|---|---|---|
| days | m | km s-1 | km s-1 | 1015 cm | 1015 cm | M⊙ | |||||||
| 1996cr | 7370 | [O iii] | no | 0 | 0.15 | 7000 | 2940 | 6.0 | 442.8 | 186.0 | 0.80 | 1.46 | |
| 1996cr | 7370 | [O iii] | yes | 0 | 0.12 | 7000 | 2940 | 6.0 | 442.8 | 186.0 | 3.5 | 5.18 | |
| 1996cr | 7370 | [O iii] | no | 100 | 0.04 | 7000 | 2940 | 6.0 | 442.8 | 186.0 | 20 | 0.89 | |
| 1996cr | 7370 | [O iii] | yes | 100 | 0.05 | 7000 | 2940 | 6.0 | 442.8 | 186.0 | 120 | 7.97 | |
| 1996cr | 7370 | [O ii] | no | 0 | 0.15 | 6900 | 2898 | 6.0 | 436.5 | 183.3 | 0.80 | 0.97 | |
| 1996cr | 7370 | [O ii] | yes | 0 | 0.12 | 6900 | 2898 | 6.0 | 436.5 | 183.3 | 3.5 | 5.33 | |
| 1996cr | 7370 | [O ii] | no | 100 | 0.04 | 6900 | 2898 | 6.0 | 436.5 | 183.3 | 40 | 0.66 | |
| 1996cr | 7370 | [O ii] | yes | 100 | 0.05 | 6900 | 2898 | 6.0 | 436.5 | 183.3 | 120 | 2.89 | |
| 1996cr | 7370 | [O i] | no | 0 | 0.15 | 6900 | 2760 | 5.6 | 436.5 | 174.6 | 0.80 | 1.13 | |
| 1996cr | 7370 | [O i] | yes | 0 | 0.12 | 6900 | 2760 | 5.6 | 436.5 | 174.6 | 3.5 | 5.52 | |
| 1996cr | 7370 | [O i] | no | 100 | 0.04 | 6900 | 2760 | 5.6 | 436.5 | 174.6 | 20 | 0.99 | |
| 1996cr | 7370 | [O i] | yes | 100 | 0.05 | 6900 | 2760 | 5.6 | 436.5 | 174.6 | 120 | 4.58 | |
| 1996cr | 7370 | [S iii] | no | 0 | 0.15 | 7000 | 2940 | 6.0 | 442.8 | 186.0 | 0.80 | 1.03 | |
| 1996cr | 7370 | [S iii] | yes | 0 | 0.12 | 7000 | 2940 | 6.0 | 442.8 | 186.0 | 3.5 | 4.21 | |
| 1996cr | 7370 | [S iii] | no | 100 | 0.04 | 7000 | 2940 | 6.0 | 442.8 | 186.0 | 40 | 0.50 | |
| 1996cr | 7370 | [S iii] | yes | 100 | 0.05 | 7000 | 2940 | 6.0 | 442.8 | 186.0 | 120 | 3.10 | |
| 1996cr | 8460 | [O ii] | no | 0 | 0.15 | 6600 | 2640 | 5.5 | 482.48 | 192.97 | 1.0 | 1.10 | |
| 1996cr | 8460 | [O ii] | yes | 0 | 0.15 | 6600 | 2640 | 5.5 | 482.48 | 192.97 | 3.5 | 2.80 | |
| 1996cr | 8460 | [O ii] | no | 100 | 0.06 | 6800 | 2380 | 5.0 | 497.04 | 173.96 | 50 | 1.30 | |
| 1996cr | 8460 | [O ii] | yes | 100 | 0.06 | 6800 | 2380 | 5.0 | 497.04 | 173.96 | 80 | 2.40 | |
| 1998S | 1170 | H | no | 100 | 0.08 | 5500 | 3410 | 0.5 | 55.60 | 34.47 | 1.00 | 2.45 | 1.26 |
| 1998S | 1170 | H | yes | 100 | 0.08 | 5500 | 3410 | 0.5 | 55.60 | 34.47 | 2.50 | 10.6 | 1.28 |
| 1998S | 2148 | H | no | 100 | 0.08 | 5300 | 3339 | 0.5 | 97.63 | 61.51 | 1.00 | 1.51 | 1.91 |
| 1998S | 2148 | H | yes | 100 | 0.08 | 5300 | 3339 | 0.5 | 97.63 | 61.51 | 4.00 | 5.44 | 1.88 |
| 1998S | 6574 | H | no | 100 | 0.08 | 5600 | 2688 | 2.3 | 260.0 | 124.0 | 14.0 | 2.32 | 1.37 |
| 1998S | 6574 | H | yes | 100 | 0.10 | 5600 | 2688 | 2.3 | 260.0 | 124.0 | 15.0 | 4.99 | 1.29 |
| 1998S | 6574 | [O i] | no | 100 | 0.08 | 5600 | 2688 | 2.3 | 260.0 | 124.0 | 14.0 | 2.47 | 1.24 |
| 1998S | 6574 | [O i] | yes | 100 | 0.10 | 5600 | 2688 | 2.3 | 260.0 | 124.0 | 15.0 | 4.46 | 1.24 |
| 2007it | 3248 | H | no | 100 | 0.40 | 14000 | 6860 | 2.4 | 39.29 | 5.11 | 0.700 | 0.36 | |
| 2007it | 3248 | H | yes | 100 | 0.40 | 14000 | 6860 | 2.4 | 39.29 | 5.11 | 0.900 | 0.46 | |
| 2007it | 3248 | H | no | 50 | 0.25 | 14000 | 6860 | 2.4 | 39.29 | 5.11 | 0.600 | 0.56 | |
| 2007it | 3248 | H | yes | 50 | 0.30 | 14000 | 6860 | 2.7 | 39.29 | 5.11 | 0.800 | 0.61 | |
| 2011ja | 807 | H | no | 100 | 0.15 | 6200 | 3038 | 2.00 | 42.91 | 21.02 | 0.021 | 0.72 | |
| 2011ja | 807 | H | yes | 100 | 0.15 | 6200 | 3038 | 2.00 | 42.91 | 21.02 | 0.023 | 0.96 | |
| 2011ja | 1275 | H | no | 100 | 0.15 | 6100 | 2928 | 2.00 | 66.88 | 32.10 | 0.060 | 0.81 | |
| 2011ja | 1275 | H | yes | 100 | 0.15 | 6100 | 2928 | 2.00 | 66.88 | 32.10 | 0.060 | 0.81 | |
| 2011ja | 1611 | H | no | 100 | 0.15 | 6100 | 2745 | 2.00 | 84.91 | 38.21 | 0.070 | 0.52 | |
| 2011ja | 1611 | H | yes | 100 | 0.15 | 6300 | 2835 | 2.00 | 87.69 | 39.46 | 0.080 | 0.70 | |
| 2011ja | 2259 | H | no | 100 | 0.15 | 6100 | 2928 | 2.00 | 113.5 | 54.47 | 0.300 | 1.51 | |
| 2011ja | 2259 | H | yes | 100 | 0.20 | 6100 | 2928 | 2.00 | 113.5 | 54.47 | 0.250 | 1.40 | |
| 2012au | 2277 | [O iii] | no | 0 | 0.20 | 4900 | 1274 | 3.10 | 96.40 | 25.06 | 0.025 | 0.57 | |
| 2012au | 2277 | [O iii] | yes | 0 | 0.35 | 4900 | 1274 | 3.10 | 96.40 | 25.06 | 0.040 | 0.49 | |
| 2012au | 2277 | [O iii] | no | 100 | 1.50 | 4700 | 1222 | 3.10 | 92.46 | 24.04 | 0.500 | 0.66 | |
| 2012au | 2277 | [O iii] | yes | 100 | 1.00 | 4900 | 1274 | 3.30 | 96.40 | 25.06 | 1.200 | 1.03 | |
| 2012au | 2277 | [O ii] | no | 0 | 0.20 | 5000 | 1150 | 3.10 | 98.37 | 22.62 | 0.025 | 0.48 | |
| 2012au | 2277 | [O ii] | yes | 0 | 0.35 | 5000 | 1150 | 3.10 | 98.37 | 22.62 | 0.040 | 0.41 | |
| 2012au | 2277 | [O ii] | no | 100 | 1.50 | 5000 | 1150 | 3.30 | 98.37 | 22.62 | 0.400 | 0.48 | |
| 2012au | 2277 | [O ii] | yes | 100 | 1.10 | 5000 | 1150 | 3.30 | 98.37 | 22.62 | 0.500 | 0.75 | |
| 2012au | 2277 | [O i] | no | 0 | 0.20 | 5100 | 1224 | 3.50 | 100.3 | 24.08 | 0.023 | 0.51 | |
| 2012au | 2277 | [O i] | yes | 0 | 0.35 | 5100 | 1224 | 3.50 | 100.3 | 24.08 | 0.046 | 0.53 | |
| 2012au | 2277 | [O i] | no | 100 | 1.50 | 5100 | 1224 | 3.50 | 100.3 | 24.08 | 0.450 | 0.60 | |
| 2012au | 2277 | [O i] | yes | 100 | 1.10 | 5100 | 1224 | 3.50 | 100.3 | 24.08 | 0.500 | 0.75 |
The best fitting H model is shown in Figure 19, with the model parameters listed in Table 7. We derive a day 1906 dust mass of 0.018 M⊙, corresponding to a large optical depth of =12.6. This dust mass is larger than the dust mass of 0.005 M⊙ derived by Bevan et al. [2020] for day 1286. As we could not quantify the uncertainty on the parameters using Bayesian inference due to the complex nature of the line profile, the uncertainties on the dust mass were found by fixing the other parameters and varying the dust mass until the best-fitting value changed by 35 per cent. We also determined an uncertainty on the grain radius using the same method. The grain radius and its error limits were found to be 0.15m, which is in agreement with the grain radius of 0.2m used by Bevan et al. [2020] in their damocles models.
III.2.12 SN 2011ja
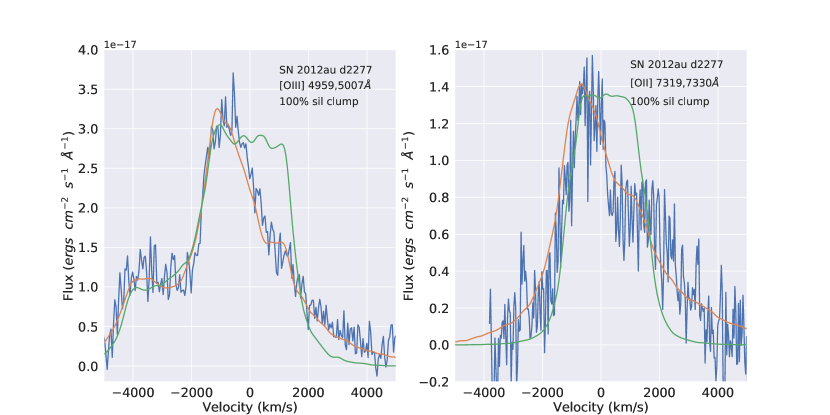
SN 2011ja was discovered on 18/12/2011 in the galaxy NGC 4945, and was determined to be a Type II-P supernova with an explosion date of 12/12/2011 after a spectrum taken on 19/12/2011 bore a strong resemblance to the spectrum of SN 2004et at an age of 7 days (Monard et al. [2011].
Andrews et al. [2016] studied the optical emission from SN 2011ja between days 84-807, from Gemini GMOS photometry and spectroscopy, and the near- and mid-IR emission using Spitzer IRAC and NTT/SOFI data for days 8-857. They also noted signs of an early interaction with CS material, from the emergence of a double peak in the broad H line in the optical spectrum, around the same time as noted by Chakraborti et al. [2013]. They compared it to several Type IIn supernovae, stating it could belong in between Type II-P and IIn. Andrews et al. [2016] also noticed several indicators of dust formation starting around the same time as the CSM interaction. The optical line profiles started becoming visibly more blueshifted between days 84-112, and a near-IR excess was observed. To quantify the newly-formed dust mass they modelled the dust emission SEDs from days 100-857 using the radiative transfer code mocassin, finding M⊙ of clumpy AmC dust at the latest epoch. They surmised this dust to have been formed in a CDS, similar to SN 1998S [Pozzo et al., 2005] and SN 2010jl [Gall et al., 2014]. Tinyanont et al. [2016a] also modelled the Spitzer SED of SN 2011ja over several epochs, including at day 1382, as part of their large mid-IR survey SPIRITS. They estimated the presence of M⊙ of graphite dust at day 807 and M⊙ of graphite dust at day 1382 post explosion.
From a manual parameter investigation, we found best fitting models to the H line in the GMOS spectra of SN 2011ja over four epochs: 807, 1275, 1611 and 2259 days past explosion. All spectra were corrected for a recessional velocity of NGC 4945 of 560 km s-1 [Crook et al., 2007]. We found the presence of a persistent red scattering wing in the H line at all 4 epochs, which became more pronounced with time, and the best fitting models required a silicate dust composition with a grain radius of 0.15 m. This disagrees with Tinyanont et al. [2016b] and Andrews et al. [2016], who did not detect a 9-10-m silicate emission feature in their IR SEDs of SN 2011ja. Our best fitting models for the day 807 and 2259 H spectra using a 100 per cent silicate dust composition can be found in Figure 20 while parameters for the models for all four epochs are listed in Table 8).
We ran a Bayesian simulation of the H line at 2259 days using 100 per cent silicate dust, the corner plot for which can be seen in Figure A6. The median values for the dust mass and grain radius in the 1-D posterior probability distributions closely matched our manually found best fitting model values. Due to this, and the fact all line profiles had a similar S/N, we extrapolated the errors calculated from the Bayesian MCMC model on the dust mass to all other epochs. There is a steady increase of dust mass with time in SN 2011ja, with the mass increasing by a factor of 10 between day 807 (2.3 x10⁻⁴ M⊙) and day 2259 (2.5 x10⁻³ M⊙). Despite the difference in dust composition used, our dust masses at days 807 and 1275 agree well with those derived by Andrews et al. [2016] and by Tinyanont et al. [2016a] at similar epochs, when taking into account our upper and lower limits.
III.2.13 SN 2012au
SN 2012au in NGC 4790 was discovered in on 14/03/2012 by the SNHunt project [Howerton et al., 2012] and shortly after was classified as a Type Ib supernova [Soderberg et al., 2012, Silverman et al., 2012]. Milisavljevic et al. [2013] and Takaki et al. [2013] noted its similarity to a Type Ic. Milisavljevic et al. [2018] presented optical spectra of SN 2012au taken 2277 days after explosion, and noted the appearance of strong [O iii] 4959,5007-Å and [O ii] 7319,7330-Å emission, and a stark difference in the [O i] 6300,6363-Å profile when compared to day 321 spectra. They attributed this to the turn-on of a pulsar wind nebula exciting oxygen-rich ejecta.
Our best fitting damocles models for the day 2277 [O ii] 7319,7330-Å and [O iii] 4959,5007 Å spectra published by Milisavljevic et al. [2018] for SN 2012au are shown in Figure 21 and the parameters can be found in Table 8. The [O iii] and [O ii] features required similar model parameters for the best fitting models, implying a co-location of ionisation species similar to that found for SN 1996cr. We found that large silicate grains of 1.0-m radius; carbon grains of 0.4-m radius; or a 50:50 carbon to silicate mixture of 0.5-m radius grains, fitted the oxygen line profiles best. The observed [O i] 6300,6363-Å profile on day 2277 contained what we assumed to be a contaminating emission feature located between -300 and -800 km s-1, of uncertain origin. When it was removed the resulting [O i] profile was well fit with similar parameters to those required to fit the [O ii] and [O iii] profiles (Table 8).
We ran a Bayesian model assuming 100 per cent AmC dust, which fit the [O iii] and [O ii] lines in SN 2012au simultaneously. The median grain radius was 0.3-m, whose large uncertainty limits comfortably included our initially derived grain radius. Scaling the uncertainties found from the Bayesian analysis to our best fitting 50:50 AmC to silicate dust mass, gives a dust mass at day 2277 in SN 2012au of ( M⊙, which is similar to the dust mass derived for SN 2011ja at a similar epoch.
IV Dust masses and dust properties
| SN | Type | Epoch | % Sil | Vmax | Vmin | Rout | Rin | Mdust | ||||
|---|---|---|---|---|---|---|---|---|---|---|---|---|
| (days) | (Å) | (m) | km s-1 | km s-1 | 1015cm | 1015cm | (M⊙) | |||||
| 1957D | II | 11371 | 5007 | 0.40 | 50 | 5800 | 870 | 2.5 | 1079.00 | 140.30 | 0.42 | |
| - | - | 19459 | 5007 | 0.40 | 50 | 6800 | 1020 | 2.4 | 1265.00 | 140.30 | 0.13 | |
| - | - | 21535 | 5007 | 0.40 | 50 | 7500 | 962 | 2.5 | 1377.00 | 140.30 | 0.29 | |
| 1970G | II-L | 16733 | 6563 | 0.10 | 100 | 6600 | 3960 | -0.1 | 954.20 | 572.50 | 1.12 | 0.10 |
| 1979C | II-L | 5146 | 7319 | 0.10 | 50 | 6800 | 5440 | 4.5 | 297.00 | 237.00 | 15.00 | 0.10 |
| - | - | 10575 | 7319 | 0.15 | 50 | 6600 | 4950 | 5.5 | 603.00 | 452.30 | 11.00 | 0.65 |
| - | - | 13903 | 7319 | 0.15 | 50 | 6600 | 3696 | 2.2 | 793.00 | 444.10 | 4.58 | 0.30 |
| 1980K | II-L | 13706 | 6563 | 0.10 | 100 | 5300 | 4505 | 1.5 | 593.10 | 504.00 | 2.91 | 0.60 |
| 1986E | II-L | 3712 | 6563 | 0.10 | 50 | 7100 | 3337 | 3.0 | 225.80 | 106.10 | 2.15 | |
| - | - | 10619 | 6563 | 0.10 | 50 | 6600 | 3102 | 3.0 | 603.80 | 283.80 | 1.07 | |
| - | - | 11723 | 6563 | 0.10 | 50 | 6600 | 2640 | 3.0 | 668.30 | 314.10 | 1.02 | |
| 1993J | IIn | 8417 | 5007 | 0.10 | 50 | 5800 | 4408 | 5.0 | 421.80 | 320.60 | 2.17 | |
| 1996cr | IIn | 7370 | 7319 | 0.11 | 50 | 6900 | 2898 | 6.0 | 436.50 | 183.30 | 5.47 | 0.10 |
| - | - | 8460 | 7319 | 0.11 | 50 | 6900 | 2380 | 5.0 | 497.04 | 173.96 | 4.11 | 0.15 |
| 1998S | IIn | 1170 | 6563 | 0.08 | 100 | 5500 | 3410 | 0.5 | 55.60 | 34.47 | 10.60 | |
| - | - | 2132 | 6563 | 0.08 | 100 | 5300 | 3339 | 0.5 | 97.63 | 61.51 | 5.44 | |
| - | - | 6574 | 6563 | 0.10 | 100 | 5600 | 2688 | 2.3 | 260.00 | 124.00 | 4.99 | 0.15 |
| 2004et | II-P | 646 | 6563 | 0.20 | 100 | 9500 | 7410 | 1.7 | 53.02 | 39.24 | 0.57 | |
| - | - | 3868 | 6563 | 0.20 | 100 | 6000 | 5400 | 2.0 | 200.50 | 180.50 | 1.31 | |
| 2007it | II | 3248 | 6563 | 0.30 | 50 | 14000 | 6860 | 2.7 | 39.29 | 5.11 | 0.61 | |
| 2010jl | IIn | 1906 | 6563 | 0.15 | 0 | 1150 | 370 | 2.0 | 230.00 | 26.40 | 12.60 | |
| 2011ja | II | 801 | 6563 | 0.15 | 100 | 6200 | 3038 | 2.0 | 42.91 | 21.02 | 0.72 | |
| - | - | 1269 | 6563 | 0.15 | 100 | 6100 | 2928 | 2.0 | 66.88 | 32.10 | 0.81 | |
| - | - | 1611 | 6563 | 0.15 | 100 | 6300 | 2835 | 2.0 | 87.69 | 39.46 | 0.70 | |
| - | - | 2153 | 6563 | 0.20 | 100 | 6100 | 2928 | 2.0 | 113.50 | 54.47 | 1.40 | |
| 2012au | Ib/c | 2277 | 5007 | 0.50 | 50 | 5000 | 1150 | 3.3 | 98.37 | 22.62 | 0.75 | |
| 2012aw | II-P | 1158 | 6563 | 0.30 | 100 | 5500 | 1100 | 1.3 | 55.03 | 11.01 | 0.70 | |
| - | - | 1863 | 6563 | 0.30 | 100 | 5100 | 663 | 1.5 | 82.09 | 10.67 | 1.02 |
IV.1 CCSN dust masses as a function of ejecta age
The ejecta dust masses derived for the CCSNe in our sample from their best fitting models are summarised in Table LABEL:table:final-dm. The values plotted for SN 2012aw, which were derived as part of the ORBYTS outreach programme, are presented in more detail by Niculescu-Duvaz et al. 2022, in prep. The dust mass derived for the IWC component of SN 2004et is not included, as there is the possibility that this dust could have formed before the supernova explosion. We plot these ejecta dust masses against age since explosion in Figure 22. As discussed in the individual sections, for epochs where we could not determine the dust species, we use a dust mass for a 50:50 carbon to silicate mass ratio, and where we cannot determine the grain radius, we have plotted the dust mass for a 50:50 carbon to silicate mass ratio using a grain radius of 0.10 m in order to constrain a lower limit to the dust mass. Some error bars are taken as percentage errors of the 16th and 84th quartiles on the median dust mass value in the marginalised 1-D dust mass probability distributions derived from the Bayesian modelling process. As our Bayesian models were generally run for 100 per cent AmC or 100 per cent silicate dust, for supernovae where we could not determine the dust species we then scaled these percentage errors to the best-fitting dust mass derived from a manual fit using a 50:50 AmC to silicate dust ratio, in order to derive upper and lower limits. We justify this approach by the fact that when we ran Bayesian models for 100 per cent AmC or 100 per cent silicate for the [O ii] feature of SN 1979C at day 13903, the error bars from the 1D posterior distribution of the dust mass in both cases only varied by a factor of 1.3. Other error limits are taken from a 35 per cent variation in when changing the dust mass whilst keeping all other parameters fixed. These values in general tend to have tighter error limits, but this does not mean that the dust mass determined is more accurate. We consider the size of the uncertainties determined from the Bayesian analyses to be a more accurate representation of the dust mass uncertainties.
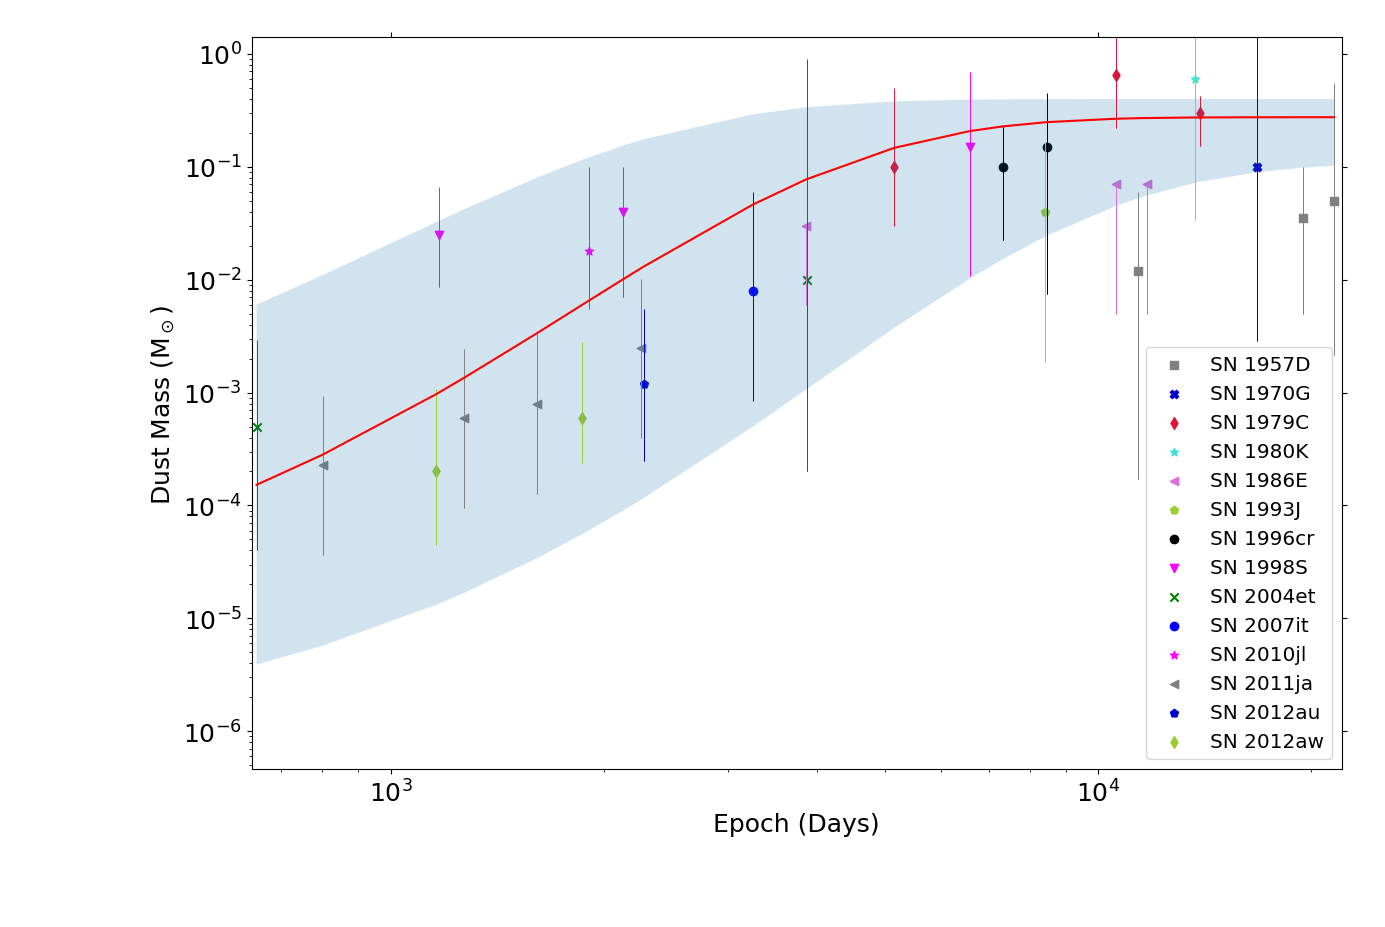
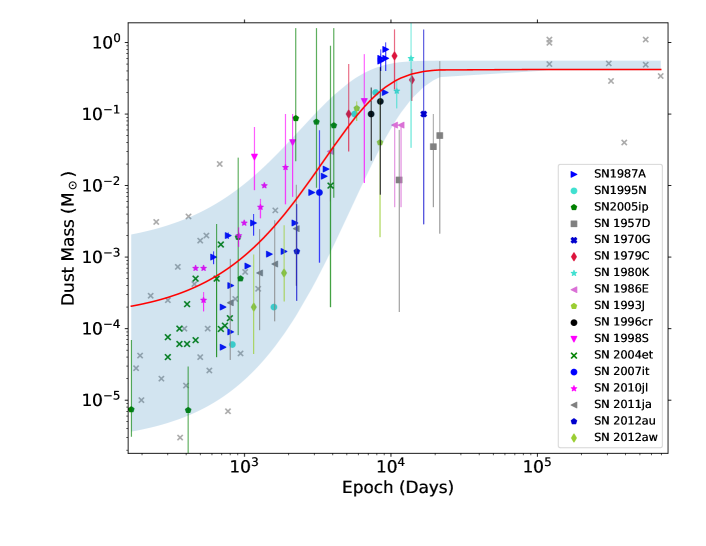
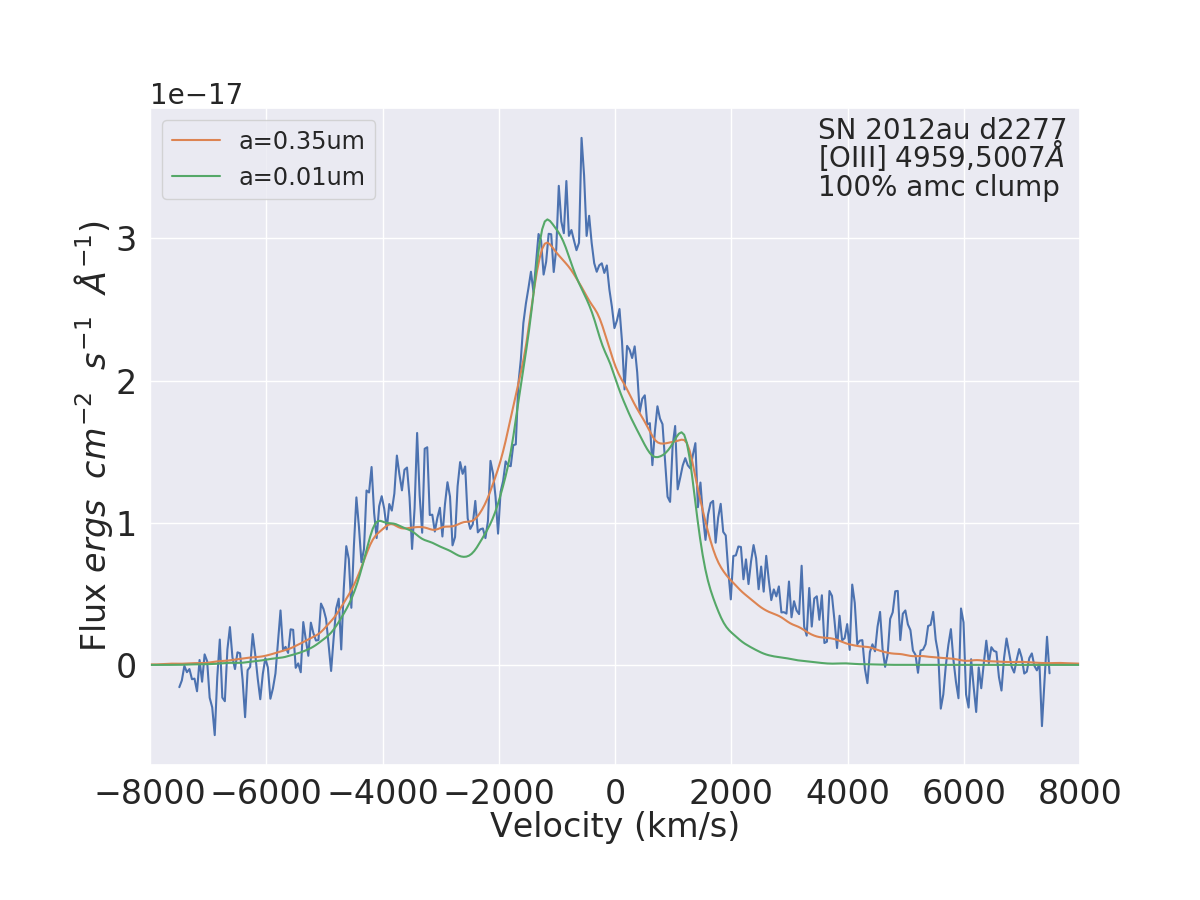
We used the leastsquares function found in the python scipy.optimize package to fit our data points in Figure 22 with a sigmoid curve similar to that used by Wesson et al. [2015], to fit the time evolution of SN 1987A’s dust mass, defined by the equation
| (3) |
Such a curve provides a natural limit to the growth of the parameter being fitted, which might correspond in this case to the exhaustion of condensable heavy elements. can be interpreted as the dust mass at saturation, in M⊙, that is formed by CCSNe, describes when the peak dust formation epoch occurs such that a more negative leads to a later onset of dust formation, and describes the rate of peak dust formation, such that a more negative value of corresponds to faster dust formation. We used a Monte Carlo simulation to bootstrap our data plotted in Figure 22. We generated 1000 datasets randomly drawn from a normal distribution to quantify the best fitting curve parameters and their associated uncertainties. We derived curve fit parameters of =0.23 M⊙, = -10.51 and =(-4.73 days-1, where the best-fitting parameter values for a and c were taken as the median of the resulting parameter distributions of the bootstrapped samples, and all uncertainties are taken as the 16th and 84th quartiles of this distribution. The mean for the b value was taken, as the least squares fitting algorithm bimodally preferred values between the upper and lower quartiles. The median and quartiles were preferred to the mean and standard deviation as the parameter distributions were non-gaussian.
Figure 23 supplements our damocles-derived dust masses with dust masses from various sources in the literature, as listed with references in Table A1. As discussed in Section 1, for supernovae observed during their photospheric phase (up to 150 days post-explosion) we discount dust mass measurements made via line profile fitting, as blue-shifted emission line peaks before these times can be created by occultation of red-shifted emission by the optically thick, steeply distributed ejecta gas [see Anderson et al., 2014].
Although some of the dust masses taken from the literature were determined using damocles, many were determined from optical-infrared SED fitting. For the latter cases we excluded dust masses based on ‘warm’ Spitzer photometry that only extended to 4.5-m or less, potentially missing cooler dust emitting at longer wavelengths. Overall, the data points that we took from the literature consisted of dust masses at additional epochs for six of our Figure 22 sample, together with multi-epoch dust mass determinations for eleven further CCSNe and dust mass estimates for six CC-SNRs older than 300 years. Since a large number of the literature dust masses plotted in Figure 23 did not have any uncertainty limits associated with them, the fit to Figure 23 did not take individual error limits into account.
A sigmoid curve using equation (3) was fit to the data-points in Figure 23, using the same method as described for the curve fit procedure on the data in Figure 22 , yielding =0.42 M ⊙, = -8.0 and =(-2.88 days-1. The sigmoid curve fits plotted in Figures 22 and 23 require very similar values for and . At 0.42 M ⊙, the value of , the dust mass at saturation, is derived to be larger for the Figure 23 sample than the value of = 0.23 M⊙ found for our damocles dataset plotted in Figure 22. For the sigmoid curve plotted in Figure 23, the dust mass reaches 75 per cent of its saturation value within 30 years.
The uncertainties on the value of are large for the sigmoid curve plotted in Figure 22 due to the relative lack of dust mass samples at early times (1000 days past explosion), such that it is difficult to determine the floor of the sigmoid curve: this explains why the error band on the best fitting sigmoid curve at early times is so broad. However, the value of the dust mass parameter is well constrained in both cases (as is the value of in the case of the larger sample).
There appears to be a real dispersion in some of the SNR dust masses plotted in Figure 23. Cas A has three dust mass determinations from independent methods that all lie between 0.5 and 1.1 M⊙ [De Looze et al., 2017, Bevan et al., 2017, Niculescu-Duvaz et al., 2021], while the dust mass determined for the Crab Nebula by De Looze et al. [2019] was M. The sigmoid curve fits plotted in Figures 22 and 23 have similar slopes to that found by Wesson et al. [2015] for SN 1987A alone, but have a lower value for the saturation dust mass parameter compared to the Wesson et al. [2015] value of M⊙ derived from a range of observations of SN 1987A at multiple epochs. It is therefore possible that SN 1987A has formed a larger dust mass than other SNe of similar ages. The curve plotted by Bevan et al. [2019] in their Figure 10, which was a fit to the dust mass evolution for just SN 1987A and SN 2005ip, does not fit most of the datapoints in our Figure 22. Their curve exhibits larger dust masses at early times, a less steep dust mass growth with time, a later dust mass growth plateau as well as a larger dust mass saturation than that found by our best-fitting sigmoid curve. However, their curve well fit our Type IIn dust mass datapoints for SN 2010jl and SN 1998S. Their curve would also fit the dust masses found here for SN 1996cr assuming a 100 per cent silicate dust composition.
The dust mass growth plot in Figure 1 of Gall & Hjorth [2018] has a plateau value of M⊙, similar to the saturation value of 0.42 M⊙ for the curve in Figure 23. The latter curve predicts that SNe produce less dust on average at ages years than that plotted by Gall & Hjorth [2018], which has a steeper dust growth rate before this time, and plateaus sooner at an age of 20 years rather than at 40 years.
Of the fourteen CCSNe in our sample, four were Type II-L supernovae, namely SN 1970G, SN 1979C, SN 1980K and SN 1986E. All had spectra taken beyond 30 years after outburst, so from the sigmoid curve fit to the dust mass versus ejecta age distribution in Fig 23, we should expect dust masses of 0.42 M⊙, while the average dust mass from the latest observed epochs for these four Type II-L SNe was 0.35 M⊙. We found that there was a large spread in the radial gas/dust distributions of these Type II-L supernovae, perhaps indicating a diversity in the evolutionary history of their progenitor stars. SN 1970G and SN 1980K both exhibit similar optical spectra and required similar [O i] and H emitting gas distributions, however SN 1970G was found to have a lower dust mass than SN 1980K by a factor of 6. The dust mass found for SN 1979C is the highest of the four Type II-L objects and its optical spectrum exhibits the highest degree of ionization of the four. It has been suggested to have a black hole at its centre [Patnaude et al., 2011], which would imply a large progenitor mass and this could possibly account for its larger dust mass when compared to other CCSNe of a similar age.
Four of the CCSNe in our sample were of Type IIn (SN 1993J, SN 1996cr, SN 1998S and SN 2010jl), a classification indicating the presence of circumstellar material that produces a narrow emission line, usually superposed on a broader profile from the supernova ejecta. Of the four, SN 1998S and SN 2010jl are outliers to the sigmoid dust growth curve, presenting high dust masses at early epochs of up to 2000 days in comparison to other Type IIL/IIP supernovae. Their data points are well fit by the SN 2005ip dust growth curve seen in Figure 11 of Bevan et al. [2019]. The increased dust mass could be due to the fact that there is an additional Cool Dense Shell component at early times which produces extra dust. For SN 1998S, at the late epoch of 6500 days the dust mass derived is comparable to those of SN 1979C, SN 1987A and SN 1996cr, the latter another Type IIn.
The use of the nucleosynthetic yields of Woosley & Heger [2007], as extracted by Temim et al. [2017], predicts that a star with an initial mass of 15 M⊙ can produce 0.13 M⊙ of carbon and 0.23 M⊙ of silicate constituents, while an 18 M⊙ star can produce 0.20 M⊙ of carbon and 0.35 M⊙ of silicates. Comparing these limits with the carbon and silicate dust masses that can be found in Table LABEL:table:final-dm indicates that the only values that may exceed these constraints are the day 10575 dust mass for SN 1979C ( M⊙ split equally between amorphous carbon and silicates) and the day 13706 silicate dust mass for SN 1980K ( M⊙).
IV.2 CCSN dust grain properties
We were able to put some constraints on the dust grain albedo for most of the CCSNe in our sample, either from the presence of an extended red scattering wing in the line profiles, or from exploiting the wavelength dependence of dust absorption. For some objects, such as SN 1979C, we also obtained 1-D probability density distribution curves for the grain radii from a Bayesian analysis. Six of the CCSNe in our sample (SN 1970G, SN 1980K, SN 1998S, SN 2004et, SN 2007it and SN 2011ja) showed large red scattering wings in their line profiles, which required close to 100 per cent silicate dust to fit. For all these SNe, silicate grain radii of the order of 0.1-0.3 m were required, which yield an optical albedo of . For the SNe where we were able to constrain the dust grain albedo but not the species, we could constrain the grain size for the cases of either 100 per cent AmC, 100 per cent silicate or 50:50 carbon to silicate mixes. From their 1-D probability distributions values derived from a Bayesian analysis, SN 2012au and SN 1957D require median grain radii of 0.2 m and 0.3 m respectively for 100 per cent AmC grains, where the probability distributions plateau at large grain radii of m.
Figure 24 demonstrates how the grain radius affects the presence of a scattering wing in a model of the [O iii] 4959,5007 Å profile of SN 2012au at 2277 days past explosion. The orange line shows the best fitting model of SN 2012au for a 100 per cent amorphous carbon dust species using a grain radius of 0.35 m and a dust mass of M⊙, whereas the green line is the best fitting model using a smaller grain radius of 0.01 m, a dust mass of 110-4 M⊙ and otherwise matching parameters as those generating the orange line. It is clear that in this case, as was the case for other SNe modelled in this work, a visual inspection can rule out small dust grain radii based on goodness-of-fit to the red scattering wing in emission line profiles.
SN 1979C and SN 1996cr are the two objects in our sample that are most likely to have grain radii ¡0.2 m. In the case of SN 1996cr, for dust grain radii m there should be a wavelength dependence of dust extinction for wavelengths = 0.63 m, while its spectra had broad emission lines ranging between 6300 and 9069 Å. This, and the fact that in our models multiple emitting ionic species were found to be co-located, allowed us to constrain the 100 per cent clumped AmC grain radius to be 0.12 m, and 0.05 m for SN 1996cr for clumped 100 per cent silicate dust. The high signal to noise of the line profiles in our spectra of SN 1979C allowed us to use a Bayesian analysis to constrain the median 100 per cent AmC grain radius to be 0.1 m, with an upper limit of 0.3 m. This translates for a 50:50 AmC to silicate mix to a single grain radius of 0.2 m. For SN 1970G, SN 1993J and SN 1986E we were unable to constrain the dust grain species or radius, while for our model of SN 2010jl at day 1906, we utilised previous grain radius information from Bevan et al. [2020] for our models. Therefore, we find that the majority of the objects in our sample require ”medium-sized” dust grains with radii from 0.1-0.5 m, regardless of composition. The large grain radii that we find are in agreement with other works [e.g. Gall et al., 2014, Owen & Barlow, 2015, Wesson et al., 2015, Bevan et al., 2017, Priestley et al., 2020].
From hydrodynamic grain destruction modelling, Slavin et al. [2020] found that, considering grain sputtering only, 30 per cent of carbonaceous grains with radius of m and 10 per cent of silicates with a radius of 0.2 m, increasing up to 20 per cent for larger silicate grains, can survive processing through a typical supernova reverse shock. From their hydrodynamic grain destruction models Kirchschlager et al. [2019] and Kirchschlager et al. [2020] found that for initial log-normal grain size distributions peaking at 0.1 m, between 15 and 50 per cent of silicate grains would survive an encounter with the reverse shock, for a range of clump density contrasts, where their simulations treated sputtering, grain-grain collisions and ion impact trapping. Currently it is difficult to predict theoretically what fraction of CCSNe will have surviving dust masses M⊙, the minimum dust mass needed per CCSN, according to Morgan & Edmunds [2003] and Dwek et al. [2007], in order for them to be candidates as the main stellar dust producers in the Universe.
V Conclusions
We have modelled the red-blue asymmetries in the optical line profiles of thirteen supernovae, using damocles to determine dust masses and other ejecta parameters. Prior to this work, many dust mass measurements existed for CCSNe aged years, corresponding to when infrared dust emission may have been detectable by Spitzer, but relatively few dust mass measurements existed for CCSNe older than this. We have greatly increased the sample of dust mass measurements available for CCSNe with ages between five and sixty years, Our measurements, combined with literature values, are plotted in Figure 23 to generate the most well-sampled and informative supernova dust mass growth curve to date.
A striking aspect of our results is that apart from SN 1998S, which had a dust mass of 2.5 M⊙ at day 1170, at epochs earlier than 2200 days none of the derived dust masses listed in Table LABEL:table:final-dm exceeds 2.5 M⊙. This stands in contrast with predictions from a range of recent theoretical studies of dust formation in CCSN ejecta, which have typically predicted that M⊙ of dust should have formed within 1000 days after outburst [e.g. Sarangi & Cherchneff, 2013, Biscaro & Cherchneff, 2014, Sarangi & Cherchneff, 2015, Sarangi et al., 2018, Mauney & Lazzati, 2018, Sluder et al., 2018, Brooker et al., 2021]. Our results indicate that CCSNe can indeed form dust masses M⊙, but over much longer timescales.
The dust mass growth with time for all the CCSN epochs modelled in this work is well described by a sigmoid curve similar to that fitted to SN 1987A’s dust mass evolution by Wesson et al. [2015]. The sigmoid curve plotted in Figure 22 implies that 90 per cent of the saturation dust mass of 0.23 M⊙ is reached after about 104 days (30 years) post-outburst. For the expanded sample that includes supplementary dust mass estimates from the literature, we find a similar period to reach 75 per cent of the saturation dust mass of 0.42 M⊙ (Figure 23).
For most of the CCSNe modelled we have put constraints on the dust grain radii for dust species consisting of either 100 per cent AmC; 100 percent astronomical silicates; or a 50:50 mixture of the two species. Inferred grain radii m for either carbon or silicate dust species are common in our models. For SN 1970G, SN 1986E and SN 1993J, where we could not constrain the grain radii or dust species, we have provided a lower limit for the dust mass, assuming the dust is made from a 50:50 AmC to silicate dust grain mixture with a grain radius of 0.1 m. For SNe 1980K, 1998S, 2007it and 2011ja we constrained the grain species to have a high silicate proportion. Slavin et al. [2020] and Kirchschlager et al. [2020] predicted a dust destruction rate for grain radii m of 20-50 per cent for a silicate composition, and Slavin et al. [2020] predicted a dust destruction rate of 30 per cent for an amorphous carbon composition. Given our value of 0.42 M⊙ produced by an average CCSN and given these dust destruction rates, 0.1-0.2 M⊙ would survive the passage of the reverse shock. This suggests that CCSNe can contribute a large proportion of the dust formed in high-redshift galaxies. The model parameters found for the CCSNe studied here, particularly their dust masses, compositions and grain radii, will hopefully help contextualise further calculations of dust destruction rates, which are crucial to determining the overall contribution of CCSNe to the dust budget of the Universe.
Out of the eight SNe in our damocles sample that are over 20 years old, six have formed dust masses M⊙. Amongst the four Type II-L SNe studied here (SNe 1970G, 1979C, 1980K and 1986E), there is a large range in the dust masses that have formed 30 years or more after outburst (0.07-0.60 M; see Table LABEL:table:final-dm) and in their deduced geometries (see Figure 31). For SN 1979C we find that the oxygen- and hydrogen-emitting regions are not co-located. We find a best-fitting model in each case where the dust must be coupled to the freely-expanding oxygen ejecta, and where the H emitting shell is outside the dusty oxygen-emitting regions. For the other Type II-L’s, the hydrogen- and oxygen-emitting regions were found to be co-located, although SN 1986E exhibited an intermediate width component in both its hydrogen and oxygen emission line profiles, which was not the case for SN 1980K or SN 1970G.
Our work indicates that at similar epochs the four Type IIn objects may have formed more dust than the five Type II and II-P objects (see Table LABEL:table:final-dm). More dust masses are needed for each CCSN sub-type at a range of ages, while tighter progenitor mass limits are required if we are to establish clear links between CCSN sub-types, progenitor masses and ejecta dust properties.
Many of the objects modelled in this work warrant follow-up observations over an extended period of time, since for many their dust masses are inferred to have not finished increasing.
Acknowledgements
We thank Nathan Smith and Franz Bauer for providing us with spectra of SN 1998S and SN 1996cr, respectively. We also thank Knox Long for permission to use spectra of SN 1957D for this work. MND thanks Haley Gomez and Amelie Saintonge for suggestions that have improved this work. MND, MJB, AB and RW acknowledge support from European Research Council (ERC) Advanced Grant 694520 SNDUST. DM acknowledges National Science Foundation support from grants PHY-1914448 and AST-2037297. IDL acknowledges support from European Research Council (ERC) Starting Grant 851622 DustOrigin. We thank the anonymous referee for constructive comments on the paper.
VI Data Availability
The damocles code, with Bayesian implementation, is available at https://github.com/damocles-code/damocles. Wavelength-calibrated copies of our Gemini GMOS and VLT X-Shooter spectra for the SNe listed in Tables 1 and 2 are available in the WISeREP archive (https://wiserep.weizmann.ac.il/).
References
- Anderson et al. [2014] Anderson J. P., et al., 2014, MNRAS, 441, 671
- Andrews et al. [2010] Andrews J. E., et al., 2010, ApJ, 715, 541
- Andrews et al. [2011a] Andrews J. E., et al., 2011a, Astronomical Journal, 142, 45
- Andrews et al. [2011b] Andrews J. E., et al., 2011b, Astrophysical Journal, 731, 47
- Andrews et al. [2016] Andrews J. E., et al., 2016, Monthly Notices of the Royal Astronomical Society, 457, 3241
- Arendt et al. [2014] Arendt R. G., Dwek E., Kober G., Rho J., Hwang U., 2014, The Astrophysical Journal, 786, 55
- Baluja & Zeippen [1988] Baluja K. L., Zeippen C. J., 1988, Journal of Physics B: Atomic, Molecular and Optical Physics, 21, 1455
- Barbon et al. [1979] Barbon R., Ciatti F., Rosino L., 1979, A&A, 72, 287
- Baron et al. [1993] Baron E., Hauschildt P. H., Branch D., Wagner R. M., Austin S. J., Filippenko A. V., Matheson T., 1993, The Astrophysical Journal Letters, 416, L21
- Bauer et al. [2001] Bauer F. E., Brandt W. N., Sambruna R. M., Chartas G., Garmire G. P., Kaspi S., Netzer H., 2001, The Astronomical Journal, 122, 182
- Bauer et al. [2008] Bauer F. E., Dwarkadas V. V., Brandt W. N., Immler S., Smartt S., Bartel N., Bietenholz M. F., 2008, The Astrophysical Journal, 688, 1210
- Benetti et al. [2010] Benetti S., Bufano F., Vinko J., Marion G., Pritchard T., Wheeler J., Chatzopoulos E., Shetrone M., 2010, Central Bureau Electronic Telegrams, 2536, 1
- Bertoldi et al. [2003] Bertoldi F., Carilli C. L., Cox P., Fan X., Strauss M. A., Beelen A., Omont A., Zylka R., 2003, Astronomy and Astrophysics, 406, L55
- Bevan [2018] Bevan A., 2018, Monthly Notices of the Royal Astronomical Society, 480, 4659
- Bevan & Barlow [2016] Bevan A., Barlow M. J., 2016, MNRAS, 456, 1269
- Bevan et al. [2017] Bevan A., Barlow M. J., Milisavljevic D., 2017, Monthly Notices of the Royal Astronomical Society, 465, 4044
- Bevan et al. [2019] Bevan A., et al., 2019, Monthly Notices of the Royal Astronomical Society, 485, 5192
- Bevan et al. [2020] Bevan A. M., et al., 2020, The Astrophysical Journal, 894, 111
- Biscaro & Cherchneff [2014] Biscaro C., Cherchneff I., 2014, A&A, 564, A25
- Bocchio et al. [2014] Bocchio M., Jones A. P., Slavin J. D., 2014, Astronomy and Astrophysics, 570, 32
- Bouchet et al. [1996] Bouchet P., Danziger I. J., Gouiffes C., della Valle M., Moneti A., 1996, in Kuhn T. S., ed., IAU Colloq. 145: Supernovae and Supernova Remnants. p. 201
- Brooker et al. [2021] Brooker E. S., Stangl S. M., Mauney C. M., Fryer C. L., 2021, arXiv e-prints, p. arXiv:2103.12781
- Buta [1982] Buta R. J., 1982, Publications of the Astronomical Society of the Pacific, 94, 578
- Cappellaro et al. [1990] Cappellaro E., della Valle M., Iijima T., Turatto M., 1990, A&A, 228, 61
- Cappellaro et al. [1995] Cappellaro E., Danziger I. J., Turatto M., 1995, Monthly Notices of the Royal Astronomical Society, 277, 106
- Chakraborti et al. [2013] Chakraborti S., et al., 2013, Astrophysical Journal, 774, 30
- Chawner et al. [2019] Chawner H., et al., 2019, MNRAS, 483, 70
- Chugai [2018] Chugai N. N., 2018, Monthly Notices of the Royal Astronomical Society, 481, 3643
- Crook et al. [2007] Crook A. C., Huchra J. P., Martimbeau N., Masters K. L., Jarrett T., Macri L. M., 2007, The Astrophysical Journal, 655, 790
- De Looze et al. [2017] De Looze I., Barlow M. J., Swinyard B. M., Rho J., Gomez H. L., Matsuura M., Wesson R., 2017, Monthly Notices of the Royal Astronomical Society, 465, 3309 (DL2017)
- De Looze et al. [2019] De Looze I., et al., 2019, Monthly Notices of the Royal Astronomical Society, 488, 164
- Detre & Lovas [1970] Detre L., Lovas M., 1970, IAU circ, 2269, 1
- Draine & Lee [1984] Draine B. T., Lee H. M., 1984, The Astrophysical Journal, 285, 89
- Dwek [1983] Dwek E., 1983, The Astrophysical Journal, 274, 175
- Dwek et al. [2007] Dwek E., Galliano F., Jones A. P., 2007, The Astrophysical Journal, 662, 927
- Dwek et al. [2019] Dwek E., Sarangi A., Arendt R. G., 2019, ApJl, 871, L33
- Evans et al. [2007] Evans R. O., Nitschki D., Quirk S., 2007, Central Bureau Electronic Telegrams, 1065, 1
- Fabbri et al. [2011] Fabbri J., et al., 2011, Monthly Notices of the Royal Astronomical Society, 418, 1285
- Fassia et al. [2000] Fassia A., et al., 2000, Monthly Notices of the Royal Astronomical Society, 318, 1093
- Fesen & Weil [2020] Fesen R. A., Weil K. E., 2020, The Astrophysical Journal, 890, 15
- Fesen et al. [1999] Fesen R. A., et al., 1999, The Astronomical Journal, 117, 725
- Foreman-Mackey et al. [2013] Foreman-Mackey D., Hogg D. W., Lang D., Goodman J., 2013, Publications of the Astronomical Society of the Pacific, 125, 306
- Fox et al. [2010] Fox O. D., Chevalier R. A., Dwek E., Skrutskie M. F., Sugerman B. E. K., Leisenring J. M., 2010, ApJ, 725, 1768
- Fransson et al. [2005] Fransson C., et al., 2005, The Astrophysical Journal, 622, 991
- Fransson et al. [2014] Fransson C., et al., 2014, Astrophysical Journal, 797
- Freudling et al. [2013] Freudling W., Romaniello M., Bramich D. M., Ballester P., Forchi V., García-Dabló C. E., Moehler S., Neeser M. J., 2013, A&A, 559, A96
- Gall & Hjorth [2018] Gall C., Hjorth J., 2018, ApJ, 868, 62
- Gall et al. [2014] Gall C., et al., 2014, Nature, 511, 326
- Gallagher et al. [2012] Gallagher J. S., et al., 2012, ApJ, 753, 109
- Gerardy et al. [2000] Gerardy C. L., Fesen R. A., Höflich P., Wheeler J. C., 2000, The Astronomical Journal, 119, 2968
- Gerasimovic [1933] Gerasimovic B., 1933, Zeitschrift für Astrophysik, 7, 335
- Gomez et al. [2012] Gomez H. L., et al., 2012, Astrophysical Journal, 760, 96
- Goodman & Weare [2010] Goodman J., Weare J., 2010, Communications in Applied Mathematics and Computational Science, 5, 65
- Howarth et al. [2014] Howarth I. D., Murray J., Mills D., Berry D. S., 2014, DIPSO: Spectrum analysis code (ascl:1405.016)
- Howerton et al. [2012] Howerton S., et al., 2012, Central Bureau Electronic Telegrams, 3052, 1
- Indebetouw et al. [2014] Indebetouw R., et al., 2014, Astrophysical Journal Letters, 782, 11
- Itagaki et al. [2007] Itagaki K., et al., 2007, IAUC, 8874, 3
- Kirchschlager et al. [2019] Kirchschlager F., Schmidt F. D., Barlow M. J., Fogerty E. L., Bevan A., Priestley F. D., 2019, Monthly Notices of the Royal Astronomical Society, 489, 4465
- Kirchschlager et al. [2020] Kirchschlager F., Barlow M. J., Schmidt F. D., 2020, ApJ, 893, 70
- Kotak et al. [2009] Kotak R., et al., 2009, Astrophysical Journal, 704, 306
- Kozma & Fransson [1998] Kozma C., Fransson C., 1998, ApJ, 497, 431
- Laporte et al. [2017] Laporte N., et al., 2017, The Astrophysical Journal Letters, 837, L21
- Li et al. [1998] Li W. D., Li C., Filippenko A. V., Moran E. C., 1998, IAU circ, 6829, 1
- Liu et al. [2018] Liu N., Nittler L. R., Alexander C. M. O. D., Wang J., 2018, Science Advances, 4, eaao1054
- Long et al. [1989] Long K. S., Blair W. P., Krzeminski W., 1989, The Astrophysical Journal, 340, L25
- Long et al. [2012] Long K. S., et al., 2012, The Astrophysical Journal, 756, 18
- Lucy et al. [1989] Lucy L. B., Danziger I. J., Gouiffes C., Bouchet P., 1989, Dust Condensation in the Ejecta of SN 1987A. Springer-Verlag, p. 164, doi:10.1007/BFb0114861
- Lucy et al. [1991] Lucy L. B., Danziger I. J., Gouiffes C., Bouchet P., 1991, in Woosley S. E., ed., Supernovae. p. 82
- Maeda et al. [2013] Maeda K., et al., 2013, Astrophysical Journal, 776
- Matsuura et al. [2011] Matsuura M., et al., 2011, Science, 333, 1258
- Matsuura et al. [2015] Matsuura M., et al., 2015, ApJ, 800, 50
- Mattei et al. [1979] Mattei J., Johnson G. E., Rosino L., Rafanelli P., Kirshner R., 1979, The International Astronomical Union Circular, 3348, 1
- Mauerhan & Smith [2012] Mauerhan J., Smith N., 2012, Monthly Notices of the Royal Astronomical Society, 424, 2659
- Mauney & Lazzati [2018] Mauney C. M., Lazzati D., 2018, Molecular Astrophysics, 12, 1
- Meikle et al. [2007] Meikle W. P. S., et al., 2007, ApJ, 665, 608
- Meyer et al. [2004] Meyer M. J., et al., 2004, Monthly Notices of the Royal Astronomy, 350, 1195
- Micelotta et al. [2016] Micelotta E. R., Dwek E., Slavin J. D., 2016, Astronomy and Astrophysics, 590, 65
- Milisavljevic et al. [2009] Milisavljevic D., Fesen R. A., Kirshner R. P., Challis P., 2009, ApJ, 692, 839
- Milisavljevic et al. [2012] Milisavljevic D., Fesen R. A., Chevalier R. A., Kirshner R. P., Challis P., Turatto M., 2012, Astrophysical Journal, 751, 25
- Milisavljevic et al. [2013] Milisavljevic D., et al., 2013, Astrophysical Journal Letters, 770, L38
- Milisavljevic et al. [2018] Milisavljevic D., Patnaude D. J., Chevalier R. A., Raymond J. C., Fesen R. A., Margutti R., Conner B., Banovetz J., 2018, The Astrophysical Journal Letters, 864, L36
- Monard et al. [2011] Monard L. A. G., et al., 2011, Central Bureau Electronic Telegrams, 2946, 1
- Montes et al. [2000] Montes M. J., Weiler K. W., Van Dyk S. D., Panagia N., Lacey C. K., Sramek R. A., Park R., 2000, The Astrophysical Journal, 532, 1124
- Morgan & Edmunds [2003] Morgan H. L., Edmunds M. G., 2003, Monthly Notices of the Royal Astronomical Society, 343, 427
- Nath et al. [2008] Nath B. B., Laskar T., Shull J. M., 2008, The Astrophysical Journal, 682, 1055
- Niculescu-Duvaz et al. [2021] Niculescu-Duvaz M., Barlow M. J., Bevan A., Milisavljevic D., De Looze I., 2021, Monthly Notices of the Royal Astronomical Society
- Nozawa et al. [2003] Nozawa T., Kozasa T., Umeda H., Maeda K., Nomoto K., 2003, The Astrophysical Journal, 598, 785
- Nozawa et al. [2008] Nozawa T., et al., 2008, ApJ, 684, 1343
- Ott et al. [2019] Ott U., Stephan T., Hoppe P., Savina M. R., 2019, ApJ, 885, 128
- Owen & Barlow [2015] Owen P. J., Barlow M. J., 2015, ApJ, 801, 141
- Panagia et al. [1980] Panagia N., et al., 1980, Monthly Notices of the Royal Astronomical Society, 192, 861
- Patnaude et al. [2011] Patnaude D. J., Loeb A., Jones C., 2011, New Astronomy, 16, 187
- Pennypacker et al. [1986] Pennypacker C., et al., 1986, IAU circ, 4219, 1
- Pojmanski et al. [2007] Pojmanski G., Pojmanski G. 2007, IAUC, 8875, 1
- Pozzo et al. [2004] Pozzo M., Meikle W. P. S., Fassia A., Geballe T., Lundqvist P., Chugai N. N., Sollerman J., 2004, Mon. Not. R. Astron. Soc, 352, 457
- Pozzo et al. [2005] Pozzo M., Meikle W. P. S., Fassia A., Geballe T., Lundqvist P., Chugai N. N., Sollerman J., 2005, in Turatto M., Benetti S., Zampieri L., Shea W., eds, Astronomical Society of the Pacific Conference Series Vol. 342, 1604-2004: Supernovae as Cosmological Lighthouses. p. 337
- Priestley et al. [2019] Priestley F. D., Barlow M. J., De Looze I., 2019, Monthly Notices of the Royal Astronomical Society, 485, 440
- Priestley et al. [2020] Priestley F. D., Barlow M. J., De Looze I., Chawner H., 2020, MNRAS, 491, 6020
- Priestley et al. [2021] Priestley F. D., Chawner H., Matsuura M., De Looze I., Barlow M. J., Gomez H. L., 2021, Monthly Notices of the Royal Astronomical Society, 500, 2543
- Rho et al. [2008] Rho J., et al., 2008, The Astrophysical Journal, 673, 271
- Rho et al. [2009] Rho J., Reach W. T., Tappe A., Hwang U., Slavin J. D., Kozasa T., Dunne L., 2009, The Astrophysical Journal, 700, 579
- Rho et al. [2018] Rho J., et al., 2018, Monthly Notices of the Royal Astronomical Society, 479, 5101
- Ripero et al. [1993] Ripero J., et al., 1993, IAU circ, 5731, 1
- Rosino [1986] Rosino L., 1986, IAU circ, 4202, 1
- Sabater et al. [2012] Sabater J., Verdes-Montenegro L., Leon S., Best P., Sulentic J., 2012, Astronomy and Astrophysics, 545, 15
- Sahu et al. [2006] Sahu D. K., Anupama G. C., Srividya S., Muneer S., 2006, Monthly Notices of the Royal Astronomical Society, 372, 1315
- Sandstrom et al. [2009] Sandstrom K. M., Bolatto A. D., Stanimirović S., van Loon J. T., Smith J. D. T., 2009, The Astrophysical Journal, 696, 2138
- Sarangi & Cherchneff [2013] Sarangi A., Cherchneff I., 2013, ApJ, 776, 107
- Sarangi & Cherchneff [2015] Sarangi A., Cherchneff I., 2015, Astronomy and Astrophysics, 575, 95
- Sarangi et al. [2018] Sarangi A., Dwek E., Arendt R. G., 2018, The Astrophysical Journal, 859, 66
- Silverman et al. [2012] Silverman J. M., Cenko S. B., Miller A. A., Nugent P. E., Filippenko A. V., 2012, Central Bureau Electronic Telegrams, 3052, 2
- Silvia et al. [2010] Silvia D. W., Smith B. D., Michael Shull J., 2010, Astrophysical Journal, 715, 1575
- Slavin et al. [2020] Slavin J. D., Dwek E., Mac Low M.-M., Hill A. S., 2020, The Astrophysical Journal, 902, 135
- Sluder et al. [2018] Sluder A., Milosavljević M., Montgomery M. H., 2018, Monthly Notices of the Royal Astronomical Society, 480, 5580
- Smith et al. [2008] Smith N., Foley R. J., Filippenko A. V., 2008, The Astrophysical Journal, 680, 568
- Smith et al. [2012] Smith N., Silverman J. M., Filippenko A. V., Cooper M. C., Matheson T., Bian F., Weiner B. J., Comerford J. M., 2012, Astronomical Journal, 143
- Smith et al. [2017] Smith N., et al., 2017, Monthly Notices of the Royal Astronomical Society, 466, 3021
- Soderberg et al. [2012] Soderberg A., et al., 2012, The Astronomer’s Telegram, 3968, 1
- Stoll et al. [2011] Stoll R., Prieto J. L., Stanek K. Z., Pogge R. W., Szczygieł D. M., Pojmański G., Antognini J., Yan H., 2011, Astrophysical Journal, 730, 34
- Storey & Zeippen [2000] Storey P. J., Zeippen C. J., 2000, Monthly Notices of the Royal Astronomical Society, 312, 813
- Sugerman et al. [2006] Sugerman B. E., et al., 2006, Science, 313, 196
- Sugerman et al. [2012] Sugerman B. E., et al., 2012, Astrophysical Journal, 749, 170
- Szalai & Vinkó [2013] Szalai T., Vinkó J., 2013, A&A, 549, A79
- Szalai et al. [2011] Szalai T., Vinkó J., Balog Z., Gáspár A., Block M., Kiss L. L., 2011, A&A, 527, A61
- Takaki et al. [2013] Takaki K., et al., 2013, Astrophysical Journal Letters, 772, 17
- Temim et al. [2017] Temim T., Dwek E., Arendt R. G., Borkowski K. J., Reynolds S. P., Slane P., Gelfand J. D., Raymond J. C., 2017, The Astrophysical Journal, 836, 129
- Tinyanont et al. [2016a] Tinyanont S., et al., 2016a, The Astrophysical Journal, 833, 231
- Tinyanont et al. [2016b] Tinyanont S., et al., 2016b, The Astrophysical Journal, 833, 231
- Tinyanont et al. [2019] Tinyanont S., et al., 2019, ApJ, 887, 75
- Van Dokkum [2001] Van Dokkum P. G., 2001, PASP, 113, 1420
- Van Driel et al. [2016] Van Driel W., et al., 2016, A&A, 595, A118
- Watson et al. [2015] Watson D., Christensen L., Knudsen K. K., Richard J., Gallazzi A., Michałowski M. J., 2015, Nature, 519, 327
- Wesson & Bevan [2021] Wesson R., Bevan A., 2021, arXiv e-prints, p. arXiv:2111.06896
- Wesson et al. [2015] Wesson R., Barlow M. J., Matsuura M., Ercolano B., 2015, Monthly Notices of the Royal Astronomical Society, 446, 2089
- Woosley & Heger [2007] Woosley S. E., Heger A., 2007, Phys rep, 442, 269
- Yamanaka et al. [2010] Yamanaka M., Okushima T., Arai A., Sasada M., Sato H., 2010, Central Bureau Electronic Telegrams, 2539, 1
- Young & Branch [1989a] Young T. R., Branch D., 1989a, The Astrophysical Journal Letters, 342, L79
- Young & Branch [1989b] Young T. R., Branch D., 1989b, The Astrophysical Journal Letters, 342, L79
- Zeippen [1987] Zeippen C., 1987, Astronomy and astrophysics (Berlin. Print), 173, 410
- Zhang et al. [2022] Zhang X., et al., 2022, MNRAS, 509, 2013
- Zsíros et al. [2022] Zsíros S., Nagy A. P., Szalai T., 2022, MNRAS, 509, 3235
- Zubko et al. [1996] Zubko V. G., Mennella V., Colangeli L., Bussoletti E., 1996, Monthly Notices of the Royal Astronomical Society, 282, 1321
- Zwitter et al. [2004] Zwitter T., Munari U., Moretti S., 2004, IAU circ, 8413, 1
*
Appendix A
In addition to the discussion below of some of the limitations of our damocles modelling, this Appendix contains Table A1, which summarises those supplementary dust mass data-points taken from the literature and plotted in Figure 23. Bayesian corner plots for six of the simulations run for this work are also included. The CCSNe modelled with a Bayesian inference and plotted in Figures A1-A6 are SN 1957D, SN 1979C at two epochs, SN 1996cr, SN 2004et and SN 2011ja. We also include a schematic, in Figure A7, of the oxygen and hydrogen spatial distributions deduced for three of the Type II-L CCSNe that were modelled, SN 1979C, SN 1986E and SN 1980K. Finally, we include plots in Figures A8 and A9 that compare the best-fitting damocles model parameters derived by the manual-fitting process and by the Bayesian process.
A.1 Limitations to our damocles modelling
Firstly, our method is only sensitive to dust distributed co-spatially or internally to the emitting gas. For those CCSNe where we only modelled oxygen lines (SN 1957D, SN 1993J, SN 1996cr and SN 2012au) it is possible our modelling has missed some dust present in any cool dense shell (CDS) outside of the oxygen shell, a region which would typically be traced by hydrogen gas. However, in our spectra of SN 1979C at 13150 and 13907 days, presented in Section III.2.3, where we have high signal-to-noise line profiles of H and the forbidden oxygen line doublets, we find that the hydrogen shell is external to the oxygen ejecta and that it is not coupled to any dust, and that red-wing attenuation of the H line is caused by dust co-located with the ejecta. It is difficult to say how applicable this scenario is to the other CCSNe for which we have only modelled the oxygen lines.
Secondly, our models are simplified by the fact that they only use amorphous carbon and astronomical silicate dust. Niculescu-Duvaz et al. [2021] showed that varying the type of silicate species does not change optically derived dust masses significantly. Grains such as Al2O3, which has been detected in Cas A [Rho et al., 2008], are unlikely to make up a large part of the dust species, due to aluminium being a trace element. Therefore, we do not include Al2O3 dust in our models. The observed line profiles could also be fit with iron grains, which behave similarly to amorphous carbon. Due to its higher mass density, 100 per cent iron grain dust would require a much larger dust mass to fit the line profiles of our sample CCSNe than 100 per cent amorphous carbon.
Degeneracies exist between some of the damocles model parameters. The clearest way to visualise these is in the corner plots in the Appendix. One of the main degeneracies is between the dust mass, Md, and grain radius, . This is because the radius of a dust grain affects its absorption and scattering efficiencies, which changes the cross-sectional area available for interaction and hence its opacity. The degeneracy between Md and is particularly clear in the bottom left panel in the corner plot for the [O ii] 7319,7330 Å doublet in SN 1979C at day 13903 (Figure A3), where it can be seen that larger amorphous carbon dust grains require a higher dust mass to fit the line profile. In this case, as there is no scattering wing in the observed profile, it is difficult to constrain the grain size for a single line. However, from manually fitting the [O i], [O ii] and [O iii] lines simultaneously we were able to constrain the grain radius, which was well within the uncertainties of the 1D posterior for . This then allowed us to constrain the dust mass. This was also the case for SN 1996cr. In some cases where the grain radius could be well constrained from the scattering wing, this degeneracy is far less prominent (e.g. bottom left panel in Figure A6, the Bayesian model for SN 2011ja at day 2259).
If the posterior curve is above zero for all possible values of a given parameter, this means that the model is unable to fully exclude any of these values, and that parameter cannot be considered to be well constrained. In some cases, the grain radius cannot be constrained well at all, such as for the case of SN 2004et at day 646, for which the corner plot can be found in Figure A5. In cases like this, the minimum dust mass can still be determined for the grain radius at which a dust grain is at its most absorbing, but the maximum value of the dust mass cannot be quantified.
For more complex multi-component profiles we were not able to run a Bayesian model for every CCSN in our sample. We also did not run Bayesian models for every SN epoch due to time restrictions. In these cases, we derived uncertainties on our dust masses from manual fits by varying the dust mass until the value increased by 35 per cent, whilst fixing all other parameters. We did not quantify uncertainties in these cases on the other parameters, and the uncertainty on the dust mass is likely to be smaller using this method than for a Bayesian method, where the dust mass posterior distribution is marginalised over other parameters with which it can be degenerate. Figure A8 compares the Vmax, Rin/Rout, and grain radius parameters derived from a manual fit (black arrowheads), with the median values (circles) of the parameters taken from the 1D posterior distribution from Bayesian models, for a range of CCSNe studied in this work. The 16th and 84th quartiles of the 1D distribution for each parameter are plotted as the error bars. Figure A9 is the same but for the dust mass. For all observations, the manually selected parameters were generally well within the uncertainties determined from the Bayesian models.
| Object | Epoch (Days) | Md (M⊙) | Reference |
|---|---|---|---|
| G11.2-0.3 | 693500 | 0.34 | Chawner et al. [2019] |
| G54.1+0.3 | 547900 | 1.1 | Temim et al. [2017] |
| 547900 | 0.49 | Rho et al. [2018] | |
| Crab | 348955 | (4.0) | De Looze et al. [2019] |
| G21.5-0.9 | 317550 | 0.29 | Chawner et al. [2019] |
| G29.7-0.3 | 306600 | 0.51 | Chawner et al. [2019] |
| Cas A | 120300 | 0.5 | De Looze et al. [2017] |
| 119700 | 1.1 | Bevan et al. [2017] | |
| 117600 | 0.99 | Niculescu-Duvaz et al. [2021] | |
| SN 1980K | 10958 | 0.21 | Bevan et al. [2017] |
| SN 1987A | 615 | (1.0 | Wesson et al. [2015] |
| 714 | 2.0 | Bevan & Barlow [2016] | |
| 714 | 5.5 | Bevan & Barlow [2016] | |
| 775 | (2.0 | Wesson et al. [2015] | |
| 806 | 4.0 | Bevan & Barlow [2016] | |
| 806 | 9.0 | Bevan & Barlow [2016] | |
| 1054 | 7.5 | Bevan & Barlow [2016] | |
| 1153 | (3.0 | Wesson et al. [2015] | |
| 1478 | 1.1 | Bevan & Barlow [2016] | |
| 1862 | 1.2 | Bevan & Barlow [2016] | |
| 2211 | 3.0 | Bevan & Barlow [2016] | |
| 2875 | 8.0 | Bevan & Barlow [2016] | |
| 3500 | 1.4 | Bevan & Barlow [2016] | |
| 3604 | 1.7 | Bevan & Barlow [2016] | |
| 8515 | 0.55 | Matsuura et al. [2011] | |
| 8515 | 0.6 | Wesson et al. [2015] | |
| 9131 | 0.20 | Indebetouw et al. [2014] | |
| 9200 | 0.8 | Wesson et al. [2015] | |
| 9200 | 0.6 | Matsuura et al. [2015] | |
| SN 1993J | 5844 | 0.12 | Bevan et al. [2017] |
| SN 1995N | 827 | 6.0 | Wesson et al. in prep |
| 1589 | 2.0 | Wesson et al. in prep | |
| 5648 | 0.10 | Wesson et al. in prep | |
| 7858 | 0.20 | Wesson et al. in prep | |
| SN 1998S | 359 | 1.9 | Gall et al. [2014] |
| 499 | 1.7 | Sugerman et al. [2006] | |
| 499 | 4.0 | Meikle et al. [2007] | |
| 678 | 2.0 | Sugerman et al. [2006] | |
| SN 2004dj | 271 | 2.0 | Szalai et al. [2011] |
| 866 | (2.6 | Szalai et al. [2011] | |
| 1011 | (6.2 | Szalai et al. [2011] | |
| 1241 | (3.6 | Szalai et al. [2011] | |
| SN 2004et | 300 | 4.0 | Kotak et al. [2009] |
| 300 | 7.6 | Fabbri et al. [2011] | |
| 360 | 6.1 | Kotak et al. [2009] | |
| 360 | 1.0 | Fabbri et al. [2011] | |
| 406 | 6.1 | Kotak et al. [2009] | |
| 406 | 2.2 | Fabbri et al. [2011] | |
| 464 | 6.9 | Kotak et al. [2009] | |
| 464 | 5.0 | Fabbri et al. [2011] | |
| 690 | 9.9 | Kotak et al. [2009] | |
| 690 | 1.5 | Fabbri et al. [2011] | |
| 736 | 1.1 | Kotak et al. [2009] | |
| 795 | 1.4 | Kotak et al. [2009] | |
| SN 2005ad | 198 | 1.0 | Szalai & Vinkó [2013] |
| 364 | 3.0 | Szalai & Vinkó [2013] | |
| SN 2005af | 194 | 4.2 | Szalai & Vinkó [2013] |
| 399 | 1.6 | Szalai & Vinkó [2013] | |
| 576 | 2.6 | Szalai & Vinkó [2013] | |
| 772 | 7.0 | Szalai & Vinkó [2013] | |
| 940 | 4.5 | Szalai & Vinkó [2013] | |
| SN 2005ip | 169 | (7.4 | Bevan et al. [2019] |
| 413 | (7.2 | Bevan et al. [2019] | |
| 905 | (1.9 | Bevan et al. [2019] | |
| 940 | 5.0 | Fox et al. [2010] | |
| 2242 | (8.7 | Bevan et al. [2019] | |
| 3099 | (7.8 | Bevan et al. [2019] | |
| 4075 | (6.9 | Bevan et al. [2019] | |
| SN 2006bc | 550 | 2.0 | Gallagher et al. [2012] |
| SN 2006jc | 229 | 2.9 | Nozawa et al. [2008] |
| SN 2007it | 944 | 1.0 | Andrews et al. [2011b] |
| 944 | 4.6 | Andrews et al. [2011b] | |
| SN 2007oc | 250 | 3.1 | Szalai & Vinkó [2013] |
| 415 | 3.7 | Szalai & Vinkó [2013] | |
| SN 2007od | 300 | 2.5 | Andrews et al. [2010] |
| 455 | 4.2 | Andrews et al. [2010] | |
| SN 2010jl | 464 | 7.0 | Bevan et al. [2020] |
| 526 | (2.50 | Bevan et al. [2020] | |
| 526 | 7.0 | Bevan et al. [2020] | |
| 915 | (2.0 | Bevan et al. [2020] | |
| 996 | 3.0 | Bevan et al. [2020] | |
| 1286 | (5.0 | Bevan et al. [2020] | |
| 1367 | 1.0 | Bevan et al. [2020] | |
| SN 2014C | 1623 | (4.5 | Tinyanont et al. [2019] |
| SN 2018hfm | 182 | (2.8 | Zhang et al. [2022] |
| 389 | (1.0 | Zhang et al. [2022] |
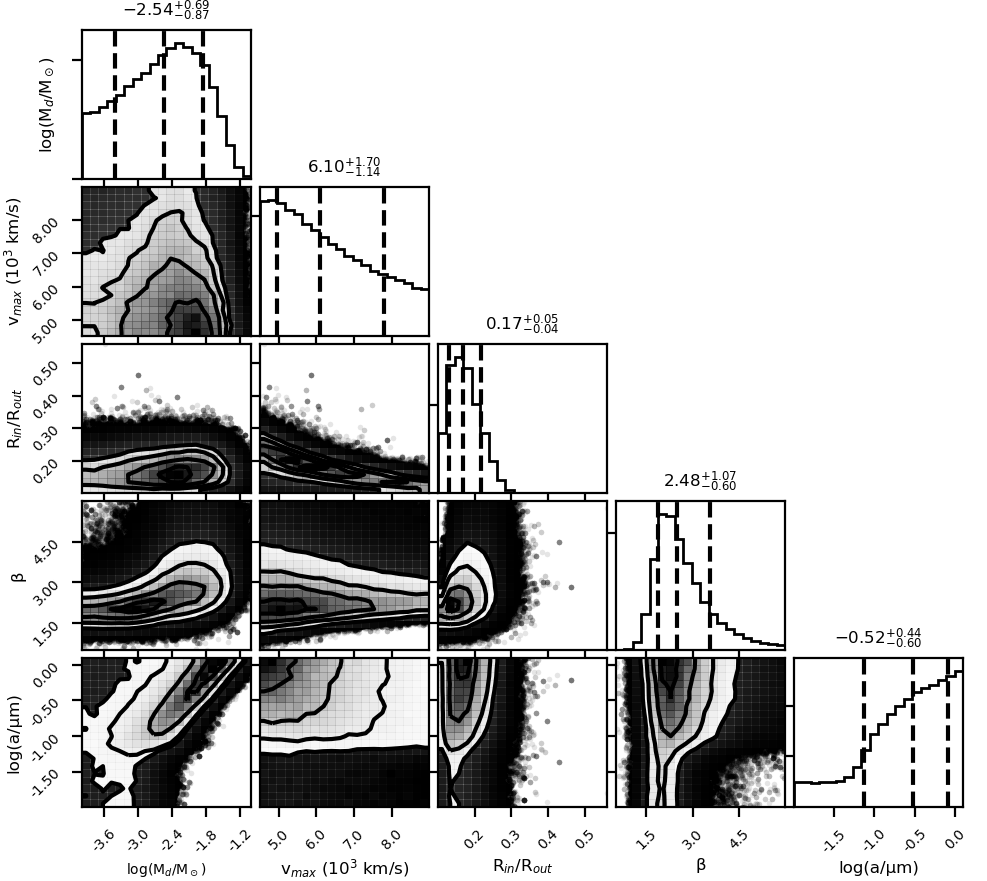
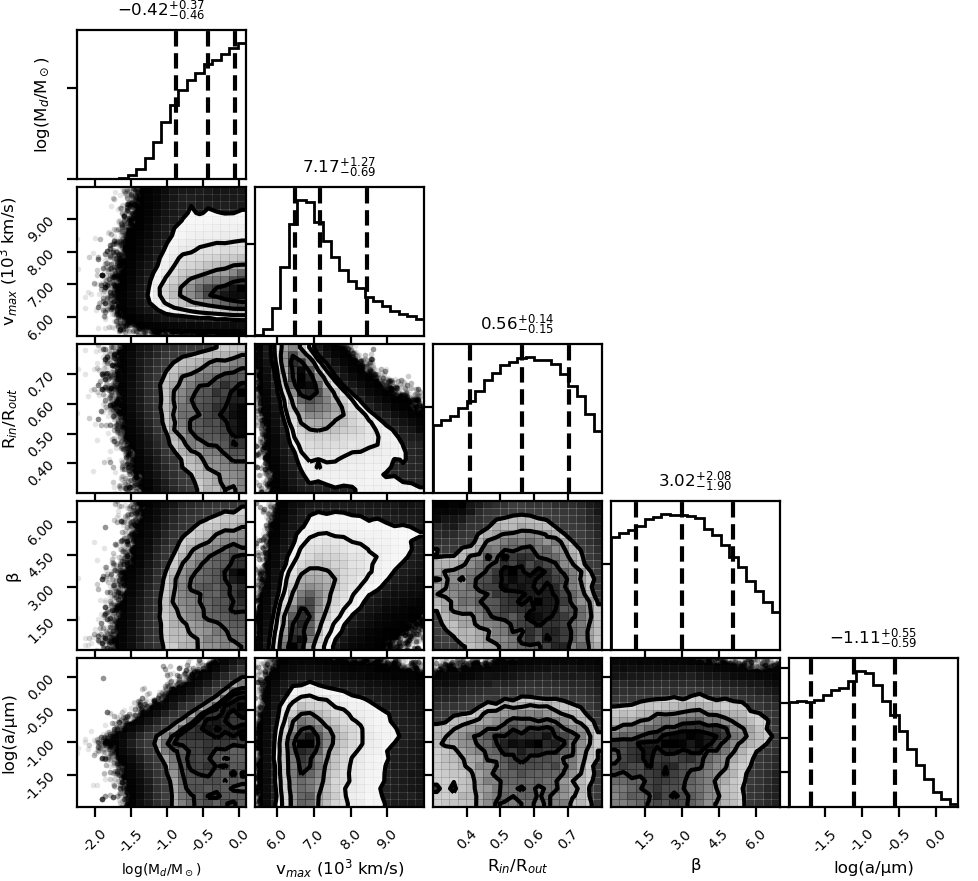
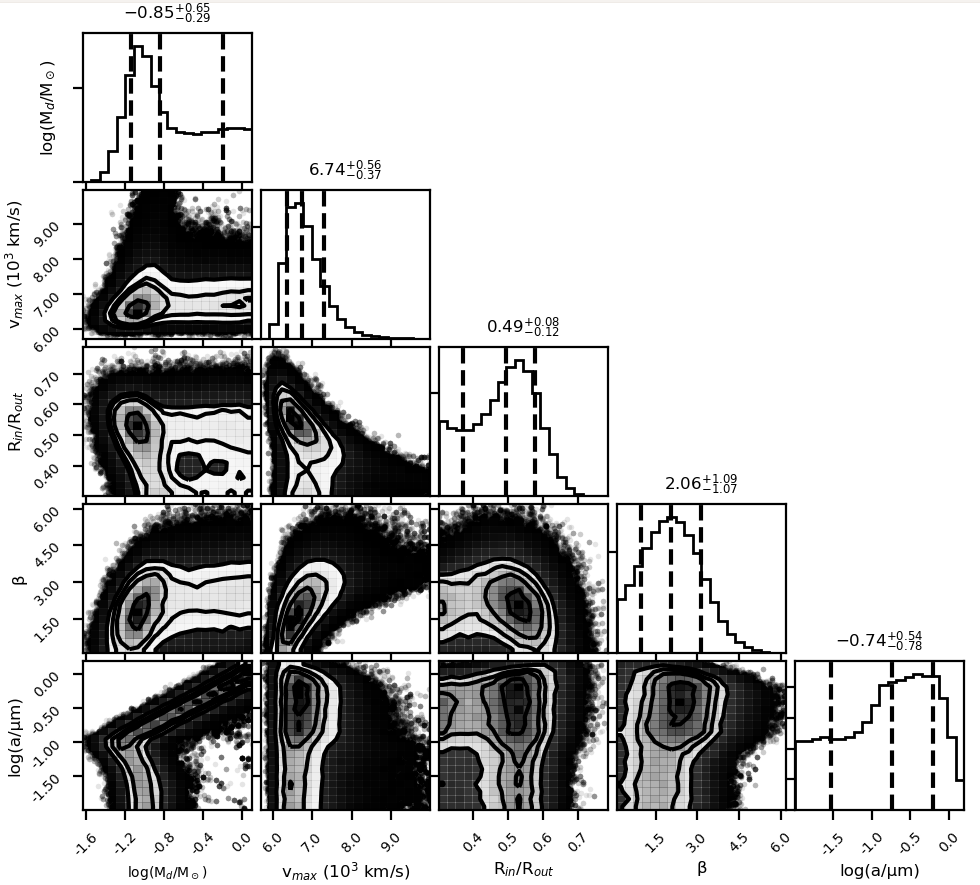
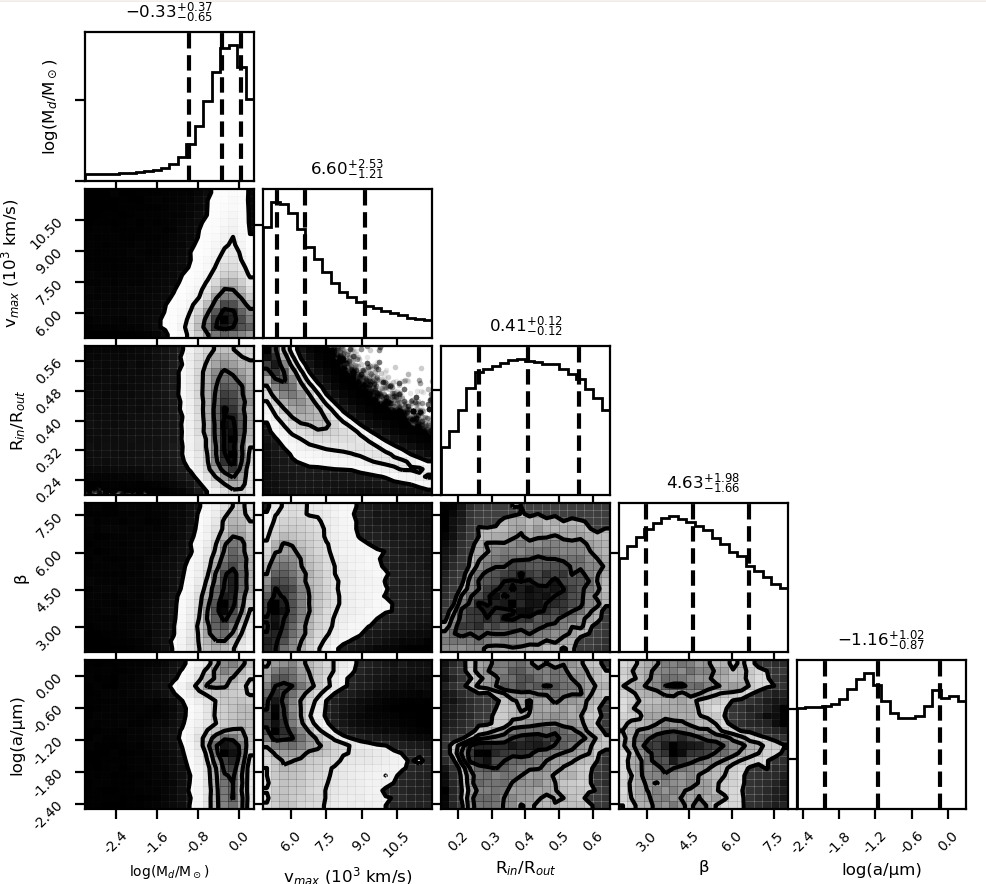
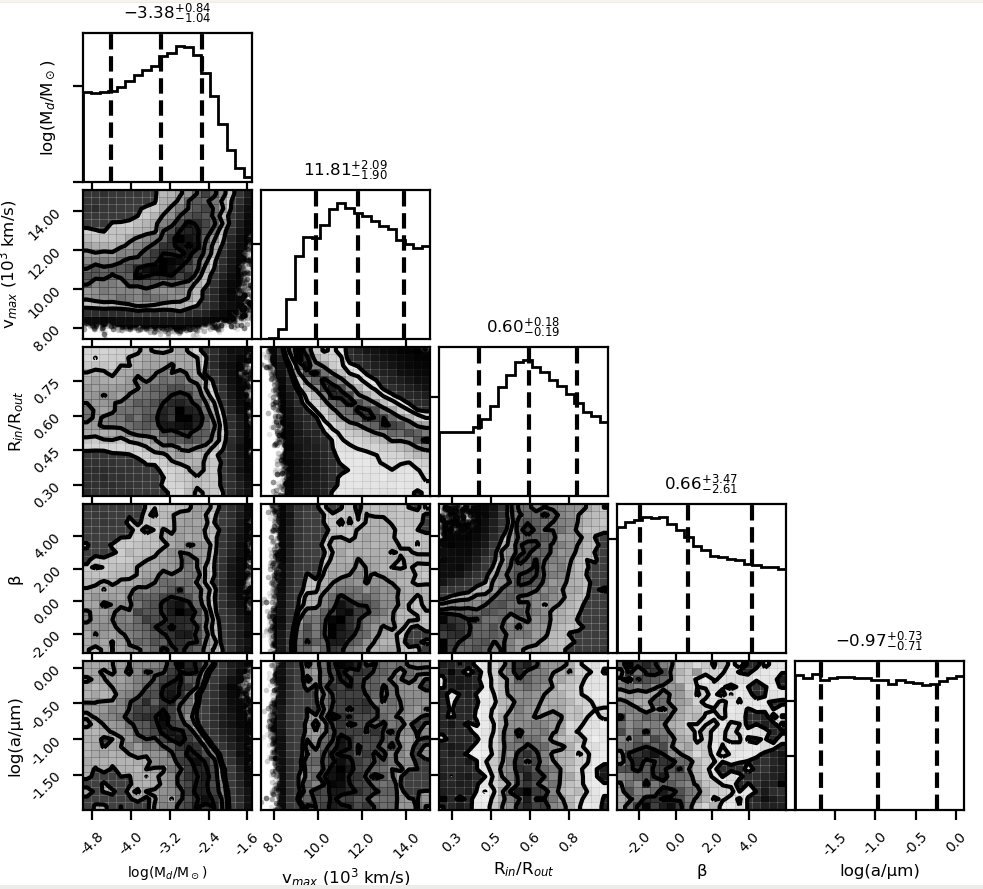
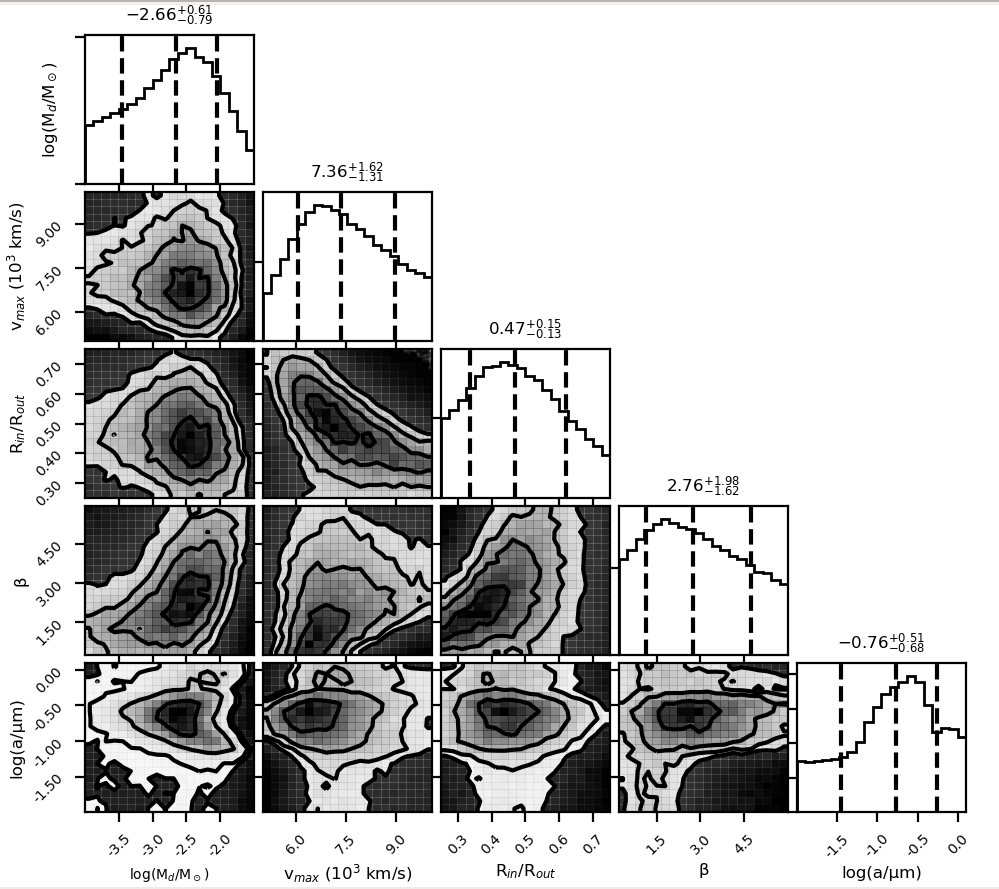
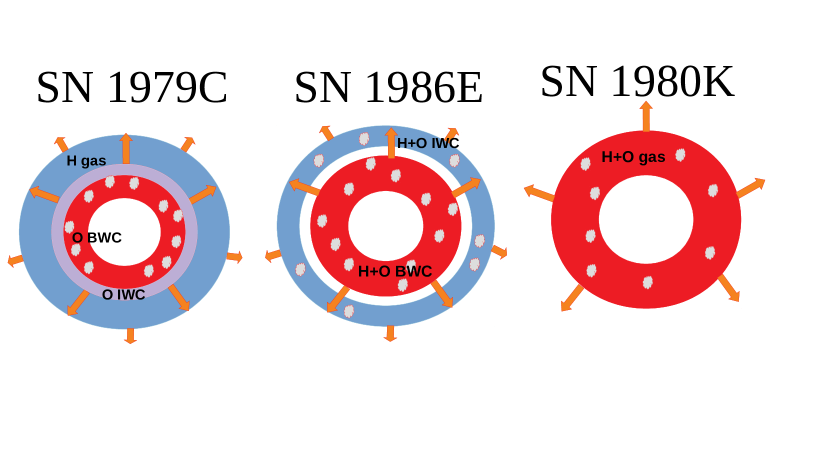
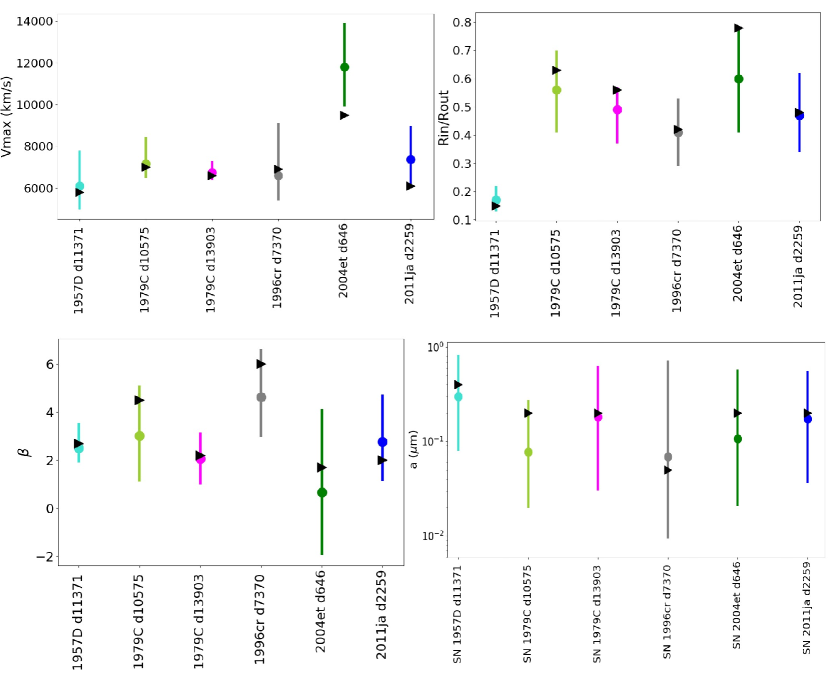
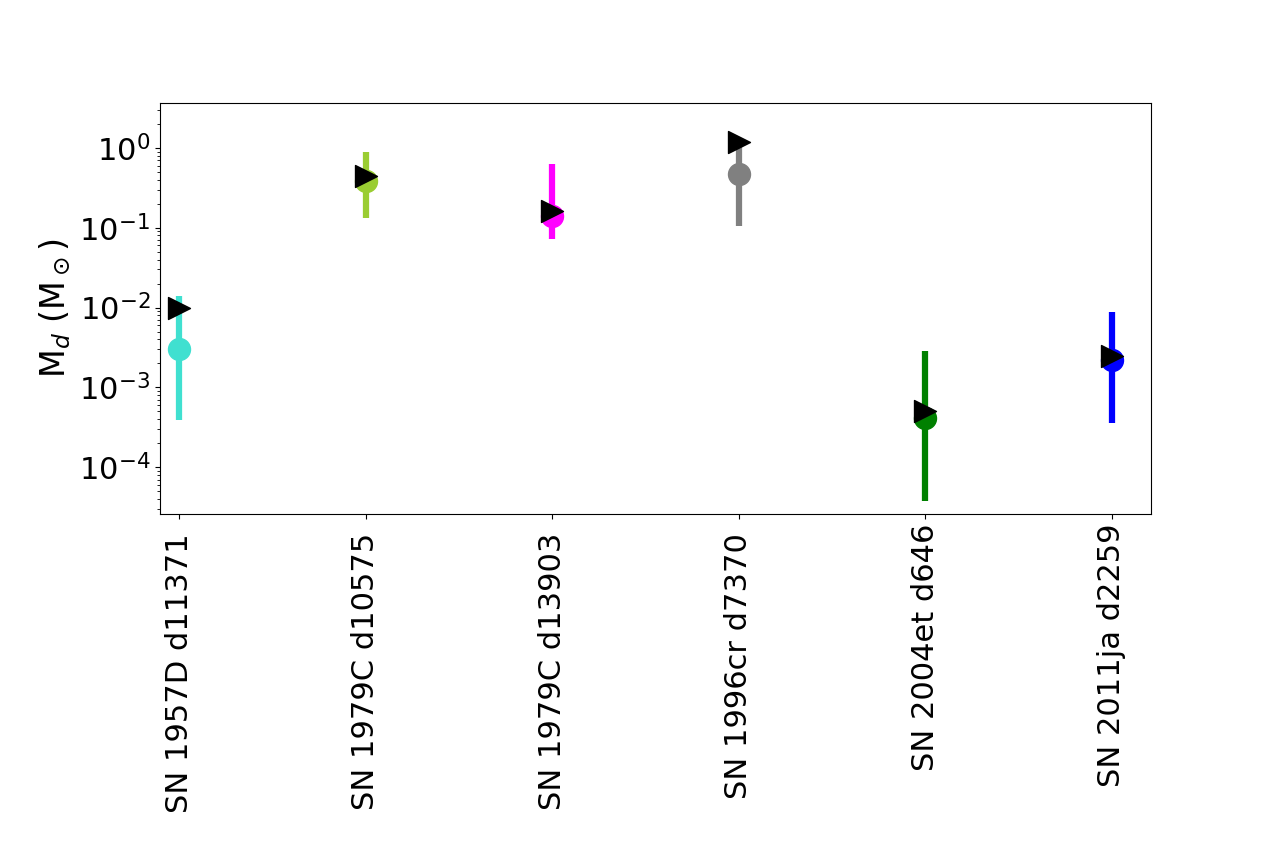
References
- Anderson et al. [2014] Anderson J. P., et al., 2014, MNRAS, 441, 671
- Andrews et al. [2010] Andrews J. E., et al., 2010, ApJ, 715, 541
- Andrews et al. [2011a] Andrews J. E., et al., 2011a, Astronomical Journal, 142, 45
- Andrews et al. [2011b] Andrews J. E., et al., 2011b, Astrophysical Journal, 731, 47
- Andrews et al. [2016] Andrews J. E., et al., 2016, Monthly Notices of the Royal Astronomical Society, 457, 3241
- Arendt et al. [2014] Arendt R. G., Dwek E., Kober G., Rho J., Hwang U., 2014, The Astrophysical Journal, 786, 55
- Baluja & Zeippen [1988] Baluja K. L., Zeippen C. J., 1988, Journal of Physics B: Atomic, Molecular and Optical Physics, 21, 1455
- Barbon et al. [1979] Barbon R., Ciatti F., Rosino L., 1979, A&A, 72, 287
- Baron et al. [1993] Baron E., Hauschildt P. H., Branch D., Wagner R. M., Austin S. J., Filippenko A. V., Matheson T., 1993, The Astrophysical Journal Letters, 416, L21
- Bauer et al. [2001] Bauer F. E., Brandt W. N., Sambruna R. M., Chartas G., Garmire G. P., Kaspi S., Netzer H., 2001, The Astronomical Journal, 122, 182
- Bauer et al. [2008] Bauer F. E., Dwarkadas V. V., Brandt W. N., Immler S., Smartt S., Bartel N., Bietenholz M. F., 2008, The Astrophysical Journal, 688, 1210
- Benetti et al. [2010] Benetti S., Bufano F., Vinko J., Marion G., Pritchard T., Wheeler J., Chatzopoulos E., Shetrone M., 2010, Central Bureau Electronic Telegrams, 2536, 1
- Bertoldi et al. [2003] Bertoldi F., Carilli C. L., Cox P., Fan X., Strauss M. A., Beelen A., Omont A., Zylka R., 2003, Astronomy and Astrophysics, 406, L55
- Bevan [2018] Bevan A., 2018, Monthly Notices of the Royal Astronomical Society, 480, 4659
- Bevan & Barlow [2016] Bevan A., Barlow M. J., 2016, MNRAS, 456, 1269
- Bevan et al. [2017] Bevan A., Barlow M. J., Milisavljevic D., 2017, Monthly Notices of the Royal Astronomical Society, 465, 4044
- Bevan et al. [2019] Bevan A., et al., 2019, Monthly Notices of the Royal Astronomical Society, 485, 5192
- Bevan et al. [2020] Bevan A. M., et al., 2020, The Astrophysical Journal, 894, 111
- Biscaro & Cherchneff [2014] Biscaro C., Cherchneff I., 2014, A&A, 564, A25
- Bocchio et al. [2014] Bocchio M., Jones A. P., Slavin J. D., 2014, Astronomy and Astrophysics, 570, 32
- Bouchet et al. [1996] Bouchet P., Danziger I. J., Gouiffes C., della Valle M., Moneti A., 1996, in Kuhn T. S., ed., IAU Colloq. 145: Supernovae and Supernova Remnants. p. 201
- Brooker et al. [2021] Brooker E. S., Stangl S. M., Mauney C. M., Fryer C. L., 2021, arXiv e-prints, p. arXiv:2103.12781
- Buta [1982] Buta R. J., 1982, Publications of the Astronomical Society of the Pacific, 94, 578
- Cappellaro et al. [1990] Cappellaro E., della Valle M., Iijima T., Turatto M., 1990, A&A, 228, 61
- Cappellaro et al. [1995] Cappellaro E., Danziger I. J., Turatto M., 1995, Monthly Notices of the Royal Astronomical Society, 277, 106
- Chakraborti et al. [2013] Chakraborti S., et al., 2013, Astrophysical Journal, 774, 30
- Chawner et al. [2019] Chawner H., et al., 2019, MNRAS, 483, 70
- Chugai [2018] Chugai N. N., 2018, Monthly Notices of the Royal Astronomical Society, 481, 3643
- Crook et al. [2007] Crook A. C., Huchra J. P., Martimbeau N., Masters K. L., Jarrett T., Macri L. M., 2007, The Astrophysical Journal, 655, 790
- De Looze et al. [2017] De Looze I., Barlow M. J., Swinyard B. M., Rho J., Gomez H. L., Matsuura M., Wesson R., 2017, Monthly Notices of the Royal Astronomical Society, 465, 3309 (DL2017)
- De Looze et al. [2019] De Looze I., et al., 2019, Monthly Notices of the Royal Astronomical Society, 488, 164
- Detre & Lovas [1970] Detre L., Lovas M., 1970, IAU circ, 2269, 1
- Draine & Lee [1984] Draine B. T., Lee H. M., 1984, The Astrophysical Journal, 285, 89
- Dwek [1983] Dwek E., 1983, The Astrophysical Journal, 274, 175
- Dwek et al. [2007] Dwek E., Galliano F., Jones A. P., 2007, The Astrophysical Journal, 662, 927
- Dwek et al. [2019] Dwek E., Sarangi A., Arendt R. G., 2019, ApJl, 871, L33
- Evans et al. [2007] Evans R. O., Nitschki D., Quirk S., 2007, Central Bureau Electronic Telegrams, 1065, 1
- Fabbri et al. [2011] Fabbri J., et al., 2011, Monthly Notices of the Royal Astronomical Society, 418, 1285
- Fassia et al. [2000] Fassia A., et al., 2000, Monthly Notices of the Royal Astronomical Society, 318, 1093
- Fesen & Weil [2020] Fesen R. A., Weil K. E., 2020, The Astrophysical Journal, 890, 15
- Fesen et al. [1999] Fesen R. A., et al., 1999, The Astronomical Journal, 117, 725
- Foreman-Mackey et al. [2013] Foreman-Mackey D., Hogg D. W., Lang D., Goodman J., 2013, Publications of the Astronomical Society of the Pacific, 125, 306
- Fox et al. [2010] Fox O. D., Chevalier R. A., Dwek E., Skrutskie M. F., Sugerman B. E. K., Leisenring J. M., 2010, ApJ, 725, 1768
- Fransson et al. [2005] Fransson C., et al., 2005, The Astrophysical Journal, 622, 991
- Fransson et al. [2014] Fransson C., et al., 2014, Astrophysical Journal, 797
- Freudling et al. [2013] Freudling W., Romaniello M., Bramich D. M., Ballester P., Forchi V., García-Dabló C. E., Moehler S., Neeser M. J., 2013, A&A, 559, A96
- Gall & Hjorth [2018] Gall C., Hjorth J., 2018, ApJ, 868, 62
- Gall et al. [2014] Gall C., et al., 2014, Nature, 511, 326
- Gallagher et al. [2012] Gallagher J. S., et al., 2012, ApJ, 753, 109
- Gerardy et al. [2000] Gerardy C. L., Fesen R. A., Höflich P., Wheeler J. C., 2000, The Astronomical Journal, 119, 2968
- Gerasimovic [1933] Gerasimovic B., 1933, Zeitschrift für Astrophysik, 7, 335
- Gomez et al. [2012] Gomez H. L., et al., 2012, Astrophysical Journal, 760, 96
- Goodman & Weare [2010] Goodman J., Weare J., 2010, Communications in Applied Mathematics and Computational Science, 5, 65
- Howarth et al. [2014] Howarth I. D., Murray J., Mills D., Berry D. S., 2014, DIPSO: Spectrum analysis code (ascl:1405.016)
- Howerton et al. [2012] Howerton S., et al., 2012, Central Bureau Electronic Telegrams, 3052, 1
- Indebetouw et al. [2014] Indebetouw R., et al., 2014, Astrophysical Journal Letters, 782, 11
- Itagaki et al. [2007] Itagaki K., et al., 2007, IAUC, 8874, 3
- Kirchschlager et al. [2019] Kirchschlager F., Schmidt F. D., Barlow M. J., Fogerty E. L., Bevan A., Priestley F. D., 2019, Monthly Notices of the Royal Astronomical Society, 489, 4465
- Kirchschlager et al. [2020] Kirchschlager F., Barlow M. J., Schmidt F. D., 2020, ApJ, 893, 70
- Kotak et al. [2009] Kotak R., et al., 2009, Astrophysical Journal, 704, 306
- Kozma & Fransson [1998] Kozma C., Fransson C., 1998, ApJ, 497, 431
- Laporte et al. [2017] Laporte N., et al., 2017, The Astrophysical Journal Letters, 837, L21
- Li et al. [1998] Li W. D., Li C., Filippenko A. V., Moran E. C., 1998, IAU circ, 6829, 1
- Liu et al. [2018] Liu N., Nittler L. R., Alexander C. M. O. D., Wang J., 2018, Science Advances, 4, eaao1054
- Long et al. [1989] Long K. S., Blair W. P., Krzeminski W., 1989, The Astrophysical Journal, 340, L25
- Long et al. [2012] Long K. S., et al., 2012, The Astrophysical Journal, 756, 18
- Lucy et al. [1989] Lucy L. B., Danziger I. J., Gouiffes C., Bouchet P., 1989, Dust Condensation in the Ejecta of SN 1987A. Springer-Verlag, p. 164, doi:10.1007/BFb0114861
- Lucy et al. [1991] Lucy L. B., Danziger I. J., Gouiffes C., Bouchet P., 1991, in Woosley S. E., ed., Supernovae. p. 82
- Maeda et al. [2013] Maeda K., et al., 2013, Astrophysical Journal, 776
- Matsuura et al. [2011] Matsuura M., et al., 2011, Science, 333, 1258
- Matsuura et al. [2015] Matsuura M., et al., 2015, ApJ, 800, 50
- Mattei et al. [1979] Mattei J., Johnson G. E., Rosino L., Rafanelli P., Kirshner R., 1979, The International Astronomical Union Circular, 3348, 1
- Mauerhan & Smith [2012] Mauerhan J., Smith N., 2012, Monthly Notices of the Royal Astronomical Society, 424, 2659
- Mauney & Lazzati [2018] Mauney C. M., Lazzati D., 2018, Molecular Astrophysics, 12, 1
- Meikle et al. [2007] Meikle W. P. S., et al., 2007, ApJ, 665, 608
- Meyer et al. [2004] Meyer M. J., et al., 2004, Monthly Notices of the Royal Astronomy, 350, 1195
- Micelotta et al. [2016] Micelotta E. R., Dwek E., Slavin J. D., 2016, Astronomy and Astrophysics, 590, 65
- Milisavljevic et al. [2009] Milisavljevic D., Fesen R. A., Kirshner R. P., Challis P., 2009, ApJ, 692, 839
- Milisavljevic et al. [2012] Milisavljevic D., Fesen R. A., Chevalier R. A., Kirshner R. P., Challis P., Turatto M., 2012, Astrophysical Journal, 751, 25
- Milisavljevic et al. [2013] Milisavljevic D., et al., 2013, Astrophysical Journal Letters, 770, L38
- Milisavljevic et al. [2018] Milisavljevic D., Patnaude D. J., Chevalier R. A., Raymond J. C., Fesen R. A., Margutti R., Conner B., Banovetz J., 2018, The Astrophysical Journal Letters, 864, L36
- Monard et al. [2011] Monard L. A. G., et al., 2011, Central Bureau Electronic Telegrams, 2946, 1
- Montes et al. [2000] Montes M. J., Weiler K. W., Van Dyk S. D., Panagia N., Lacey C. K., Sramek R. A., Park R., 2000, The Astrophysical Journal, 532, 1124
- Morgan & Edmunds [2003] Morgan H. L., Edmunds M. G., 2003, Monthly Notices of the Royal Astronomical Society, 343, 427
- Nath et al. [2008] Nath B. B., Laskar T., Shull J. M., 2008, The Astrophysical Journal, 682, 1055
- Niculescu-Duvaz et al. [2021] Niculescu-Duvaz M., Barlow M. J., Bevan A., Milisavljevic D., De Looze I., 2021, Monthly Notices of the Royal Astronomical Society
- Nozawa et al. [2003] Nozawa T., Kozasa T., Umeda H., Maeda K., Nomoto K., 2003, The Astrophysical Journal, 598, 785
- Nozawa et al. [2008] Nozawa T., et al., 2008, ApJ, 684, 1343
- Ott et al. [2019] Ott U., Stephan T., Hoppe P., Savina M. R., 2019, ApJ, 885, 128
- Owen & Barlow [2015] Owen P. J., Barlow M. J., 2015, ApJ, 801, 141
- Panagia et al. [1980] Panagia N., et al., 1980, Monthly Notices of the Royal Astronomical Society, 192, 861
- Patnaude et al. [2011] Patnaude D. J., Loeb A., Jones C., 2011, New Astronomy, 16, 187
- Pennypacker et al. [1986] Pennypacker C., et al., 1986, IAU circ, 4219, 1
- Pojmanski et al. [2007] Pojmanski G., Pojmanski G. 2007, IAUC, 8875, 1
- Pozzo et al. [2004] Pozzo M., Meikle W. P. S., Fassia A., Geballe T., Lundqvist P., Chugai N. N., Sollerman J., 2004, Mon. Not. R. Astron. Soc, 352, 457
- Pozzo et al. [2005] Pozzo M., Meikle W. P. S., Fassia A., Geballe T., Lundqvist P., Chugai N. N., Sollerman J., 2005, in Turatto M., Benetti S., Zampieri L., Shea W., eds, Astronomical Society of the Pacific Conference Series Vol. 342, 1604-2004: Supernovae as Cosmological Lighthouses. p. 337
- Priestley et al. [2019] Priestley F. D., Barlow M. J., De Looze I., 2019, Monthly Notices of the Royal Astronomical Society, 485, 440
- Priestley et al. [2020] Priestley F. D., Barlow M. J., De Looze I., Chawner H., 2020, MNRAS, 491, 6020
- Priestley et al. [2021] Priestley F. D., Chawner H., Matsuura M., De Looze I., Barlow M. J., Gomez H. L., 2021, Monthly Notices of the Royal Astronomical Society, 500, 2543
- Rho et al. [2008] Rho J., et al., 2008, The Astrophysical Journal, 673, 271
- Rho et al. [2009] Rho J., Reach W. T., Tappe A., Hwang U., Slavin J. D., Kozasa T., Dunne L., 2009, The Astrophysical Journal, 700, 579
- Rho et al. [2018] Rho J., et al., 2018, Monthly Notices of the Royal Astronomical Society, 479, 5101
- Ripero et al. [1993] Ripero J., et al., 1993, IAU circ, 5731, 1
- Rosino [1986] Rosino L., 1986, IAU circ, 4202, 1
- Sabater et al. [2012] Sabater J., Verdes-Montenegro L., Leon S., Best P., Sulentic J., 2012, Astronomy and Astrophysics, 545, 15
- Sahu et al. [2006] Sahu D. K., Anupama G. C., Srividya S., Muneer S., 2006, Monthly Notices of the Royal Astronomical Society, 372, 1315
- Sandstrom et al. [2009] Sandstrom K. M., Bolatto A. D., Stanimirović S., van Loon J. T., Smith J. D. T., 2009, The Astrophysical Journal, 696, 2138
- Sarangi & Cherchneff [2013] Sarangi A., Cherchneff I., 2013, ApJ, 776, 107
- Sarangi & Cherchneff [2015] Sarangi A., Cherchneff I., 2015, Astronomy and Astrophysics, 575, 95
- Sarangi et al. [2018] Sarangi A., Dwek E., Arendt R. G., 2018, The Astrophysical Journal, 859, 66
- Silverman et al. [2012] Silverman J. M., Cenko S. B., Miller A. A., Nugent P. E., Filippenko A. V., 2012, Central Bureau Electronic Telegrams, 3052, 2
- Silvia et al. [2010] Silvia D. W., Smith B. D., Michael Shull J., 2010, Astrophysical Journal, 715, 1575
- Slavin et al. [2020] Slavin J. D., Dwek E., Mac Low M.-M., Hill A. S., 2020, The Astrophysical Journal, 902, 135
- Sluder et al. [2018] Sluder A., Milosavljević M., Montgomery M. H., 2018, Monthly Notices of the Royal Astronomical Society, 480, 5580
- Smith et al. [2008] Smith N., Foley R. J., Filippenko A. V., 2008, The Astrophysical Journal, 680, 568
- Smith et al. [2012] Smith N., Silverman J. M., Filippenko A. V., Cooper M. C., Matheson T., Bian F., Weiner B. J., Comerford J. M., 2012, Astronomical Journal, 143
- Smith et al. [2017] Smith N., et al., 2017, Monthly Notices of the Royal Astronomical Society, 466, 3021
- Soderberg et al. [2012] Soderberg A., et al., 2012, The Astronomer’s Telegram, 3968, 1
- Stoll et al. [2011] Stoll R., Prieto J. L., Stanek K. Z., Pogge R. W., Szczygieł D. M., Pojmański G., Antognini J., Yan H., 2011, Astrophysical Journal, 730, 34
- Storey & Zeippen [2000] Storey P. J., Zeippen C. J., 2000, Monthly Notices of the Royal Astronomical Society, 312, 813
- Sugerman et al. [2006] Sugerman B. E., et al., 2006, Science, 313, 196
- Sugerman et al. [2012] Sugerman B. E., et al., 2012, Astrophysical Journal, 749, 170
- Szalai & Vinkó [2013] Szalai T., Vinkó J., 2013, A&A, 549, A79
- Szalai et al. [2011] Szalai T., Vinkó J., Balog Z., Gáspár A., Block M., Kiss L. L., 2011, A&A, 527, A61
- Takaki et al. [2013] Takaki K., et al., 2013, Astrophysical Journal Letters, 772, 17
- Temim et al. [2017] Temim T., Dwek E., Arendt R. G., Borkowski K. J., Reynolds S. P., Slane P., Gelfand J. D., Raymond J. C., 2017, The Astrophysical Journal, 836, 129
- Tinyanont et al. [2016a] Tinyanont S., et al., 2016a, The Astrophysical Journal, 833, 231
- Tinyanont et al. [2016b] Tinyanont S., et al., 2016b, The Astrophysical Journal, 833, 231
- Tinyanont et al. [2019] Tinyanont S., et al., 2019, ApJ, 887, 75
- Van Dokkum [2001] Van Dokkum P. G., 2001, PASP, 113, 1420
- Van Driel et al. [2016] Van Driel W., et al., 2016, A&A, 595, A118
- Watson et al. [2015] Watson D., Christensen L., Knudsen K. K., Richard J., Gallazzi A., Michałowski M. J., 2015, Nature, 519, 327
- Wesson & Bevan [2021] Wesson R., Bevan A., 2021, arXiv e-prints, p. arXiv:2111.06896
- Wesson et al. [2015] Wesson R., Barlow M. J., Matsuura M., Ercolano B., 2015, Monthly Notices of the Royal Astronomical Society, 446, 2089
- Woosley & Heger [2007] Woosley S. E., Heger A., 2007, Phys rep, 442, 269
- Yamanaka et al. [2010] Yamanaka M., Okushima T., Arai A., Sasada M., Sato H., 2010, Central Bureau Electronic Telegrams, 2539, 1
- Young & Branch [1989a] Young T. R., Branch D., 1989a, The Astrophysical Journal Letters, 342, L79
- Young & Branch [1989b] Young T. R., Branch D., 1989b, The Astrophysical Journal Letters, 342, L79
- Zeippen [1987] Zeippen C., 1987, Astronomy and astrophysics (Berlin. Print), 173, 410
- Zhang et al. [2022] Zhang X., et al., 2022, MNRAS, 509, 2013
- Zsíros et al. [2022] Zsíros S., Nagy A. P., Szalai T., 2022, MNRAS, 509, 3235
- Zubko et al. [1996] Zubko V. G., Mennella V., Colangeli L., Bussoletti E., 1996, Monthly Notices of the Royal Astronomical Society, 282, 1321
- Zwitter et al. [2004] Zwitter T., Munari U., Moretti S., 2004, IAU circ, 8413, 1