MASSIVE MERGING CLUSTER PSZ2G091 AS SEEN BY THE NIKA2 CAMERA
Abstract
PSZ2 G091.83+26.11 is a galaxy cluster with at [1]. This object exhibits a complex morphology with a clear bimodality observed in X-rays. However, it was detected and analysed in the Planck sample as a single, spherical cluster following a universal profile [2]. This model can lead to miscalculations of thermodynamical quantities, like the pressure profile. As future multiwavelength cluster experiments will detect more and more objects at high redshifts, it is crucial to quantify this systematic effect. In this work, we use high-resolution observations of the NIKA2 camera [3],[4],[5],[6] to integrate the morphological characteristics of the cluster in our modelling. This is achieved by fitting a two-halo model to the SZ image and then by reconstruction of the resulting projected pressure profile. We then compare these results with the spherical assumption.
1 Cosmological inference from cluster counts
The number of clusters per unit of mass and volume, modelled as the halo mass function [7], constitutes a robust cosmological probe [8]. However, the total mass of dark matter halos is not an observable quantity, and must be inferred from different physical phenomena [9], like the thermal Sunyaev-Zel’dovich effect [10] (tSZ). As a consequence, astrophysical systematic effects are biasing our measurements [11], and must be integrated in any cosmological analysis. Moreover, given the fact that the size of the catalogs will be increased by several orders of magnitude in the future, effects that are now neglected will play a crucial role [12],[13].
The Large program SZ [14] of the NIKA2 experiment (LPSZ) aims at investigating these issues, taking advantage of the spatial resolution and FoV of the NIKA2 camera. Here, we focus on the impact of cluster morphology on the reconstruction of thermdynamical quantities.
2 The case of PSZ2G091

| tSZ decrement peak | ||||
|---|---|---|---|---|
| 0.822 | 2.5h/2.5h=1 | 14.9 |
As part of the LPSZ, PSZ2G091 was observed in October, 2017, with an average elevation of and an average atmospheric opacity at 225 GHz of 0.243. These conditions are standard for observations at the IRAM 30 m telescope, at this season.
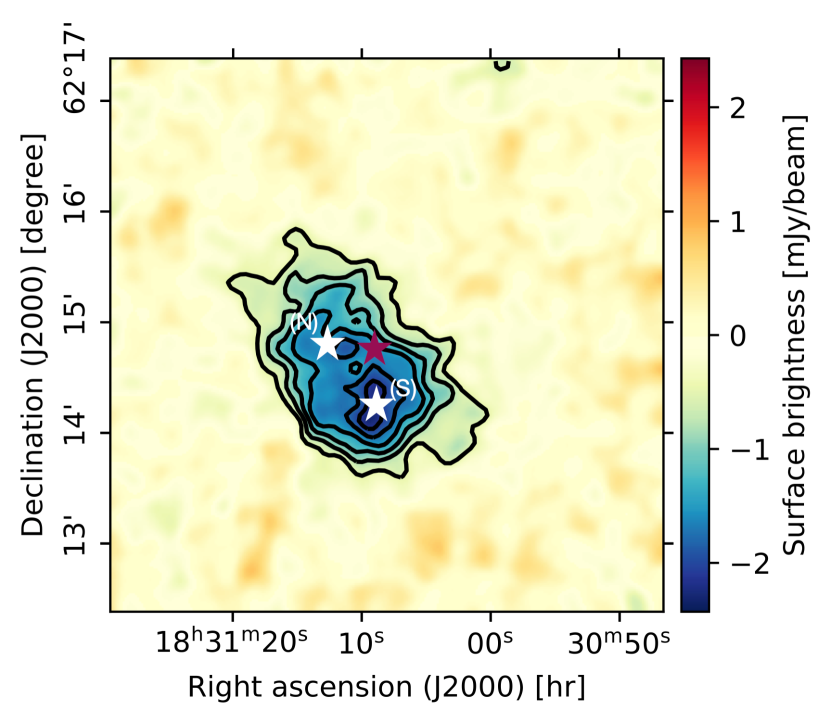
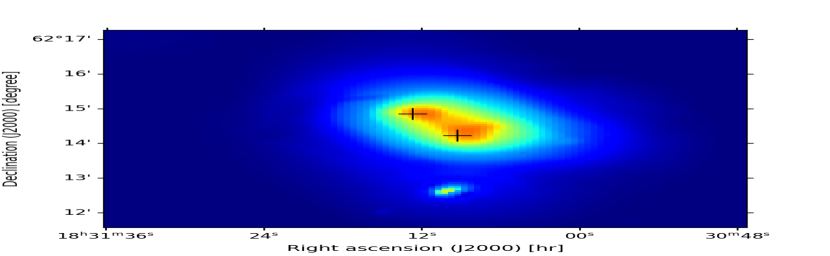
In figure 1, we show the results of the data reduction [3] at 1 and 2 mm. The cluster is clearly elongated in the NE-SW direction. There is a clear departure from sphericity, and a hint of bimodality later confirmed in the X-ray surface brightness map. The peaks in the X-ray map are in good agreement with the ones observed in the NIKA2 2 mm map. This would imply the presence of two well-defined sub-halos in the first stages of a major merger.
3 Imaging analysis
We first consider a single spherical halo centred on the X-ray centroid coordinates. A forward modelling approach is incorporated in an MCMC sampling framework to fit the parameters of the pressure profile, as well as the point sources, with the collaboration software PANCO2[15]. We use a power law model, where each of the 6 bins follows the identity
| (1) |
The top row of figure 2 shows the results of the fitting procedure. The spherical symmetry clearly does not encapsulate the bimodal nature of the cluster. It is then required to improve our modelling.
Then, instead of considering a single pressure profile, we jointly fit two halos at the positions of the X-ray peaks.

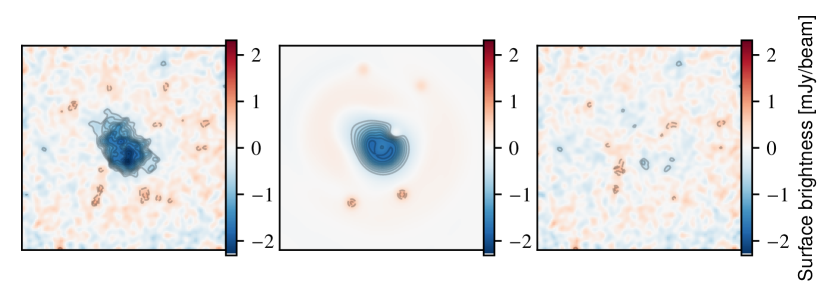
The results of the fits are shown on the bottom row of figure 2. It is clear that the two-halo model yields a more realistic representation of the dynamical state of the cluster. Additionally, the residuals are slightly improved in the region of the northern subhalo. Of course, due to the non-spherical nature of this cluster, it is not possible to consider a radial pressure profile. However, in section 4, we describe how we recover an average radial profile for the two-halo model.
4 Pressure profile reconstruction
Thermodynamical profiles are usually considered with the goal of reconstructing a mass profile, using the hydrostatic equilibrium assumption. This requires the presence of a 1D pressure profile,
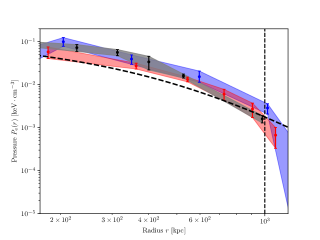
when we previously fitted a 2D map. Thus, we use the following procedure to recover an average 1D profile. With the assumption of the two sub-halos lying in the same plane perpendicular to the line of sight, we recover a mean radial pressure profile by integrating both the profiles in annuli centered around the X-ray centroid coordinates. The pressure in the -th bin reads:
| (2) |
where is the value of the pressure, and are respectively the profiles of the northern and southern subhalos, and being the inner and outer radii of the annulus. This allows us to reconstruct the profile shown in figure 3, where we compare our reconstructed quantities with the universal profile [16] .
5 Conclusions
This analysis shows the challenges related to the complexity of cluster morphologies. In this work, we showed that for the case of the highly disturbed cluster PSZ2G091, taking into account the merging state of the cluster yields results that are slightly different from the spherical profile. This is a promising result, as the pressure profile impacts the relation. To complete this analysis, we plan to perform a full thermodynamical analysis of this cluster, recovering the 2D maps of physical quantities like the temperature and the entropy. This a precondition to assess the impact of the morphology of this cluster on its full mass reconstruction, and generally on cosmological inference using clusters.
Acknowledgments
We would like to thank the IRAM staff for their support during the campaigns. The NIKA2 dilution cryostat has been designed and built at the Institut Néel. In particular, we acknowledge the crucial contribution of the Cryogenics Group, and in particular Gregory Garde, Henri Rodenas, Jean-Paul Leggeri, Philippe Camus. This work has been partially funded by the Foundation Nanoscience Grenoble and the LabEx FOCUS ANR-11-LABX-0013. This work is supported by the French National Research Agency under the contracts ”MKIDS”, ”NIKA” and ANR-15-CE31-0017 and in the framework of the ”Investissements d’avenir” program (ANR-15-IDEX-02). This work has benefited from the support of the European Research Council Advanced Grant ORISTARS under the European Union’s Seventh Framework Programme (Grant Agreement no. 291294). E. A. acknowledges funding from the French Programme d’investissements d’avenir through the Enigmass Labex. A. R. acknowledges financial support from the Italian Ministry of University and Research - Project Proposal CIR01_00010.
References
References
- [1] Planck Collaboration et al., A&A 594, A27 (2016), 1502.01598
- [2] M. Arnaud et al., A&A 517, A92 (2010), 0910.1234
- [3] L. Perotto et al., A&A 637, A71 (2020), 1910.02038
- [4] R. Adam et al., A&A 609, A115 (2018), 1707.00908
- [5] M. Calvo et al., Journal of Low Temperature Physics 184, 816 (2016), 1601.02774
- [6] O. Bourrion et al., Journal of Instrumentation 11, P11001 (2016), 1602.01288
- [7] W.H. Press, P. Schechter, ApJ 187, 425 (1974)
- [8] S.W. Allen et al., ARA&A 49, 409 (2011), 1103.4829
- [9] G.W. Pratt et al., Space Sci. Rev. 215, 25 (2019), 1902.10837
- [10] R.A. Sunyaev, Y.B. Zeldovich, Ap&SS 7, 3 (1970)
- [11] S. Bocquet et al. (2015), 1502.07357
- [12] E. Artis et al., A&A 649, A47 (2021), 2101.02501
- [13] A. Fumagalli et al., A&A 652, A21 (2021), 2102.08914
- [14] F. Mayet et al., EPJ Web of Conferences 228, 00017 (2020), 1911.03145
- [15] F. Kéruzoré et al., EPJ Web of Conferences 257, 00024 (2022), 2111.06493
- [16] Planck Collaboration et al., A&A 550, A131 (2013), 1207.4061