[]
[1]
Conceptualization, Data curation, Formal analysis, Investigation, Methodology, Software, Validation, Visualization, Writing-original draft, Writing-review and editing
1]organization=Microstructure Physics and Alloy Design, Max-Planck-Institut für Eisenforschung, addressline=Max-Planck-Straße 1, city=Düsseldorf, postcode=40237, state=, country=Germany
[]
Methodology, Software, Writing-review and editing
2]organization=The Department of Materials, The University of Manchester, addressline=, city=Manchester, postcode=M13 9PL, state=, country=UK 3]organization=Henry Royce Institute for Advanced Materials, The University of Manchester, addressline=, city=Manchester, postcode=M13 9PL, state=, country=UK
[]
Resources, Software, Data curation, Supervision, Writing-review and editing
[] \cormark[1]
Methodology, Software, Validation, Writing-review and editing
[]
Funding acquisition, Project administration, Resources, Supervision, Writing-review and editing \cortext[1]Corresponding Authors
Phase-Field Modeling of Coupled Brittle-Ductile Fracture in Aluminum Alloys
Abstract
Fracture in aluminum alloys with precipitates involves at least two mechanisms, namely, ductile fracture of the aluminum-rich matrix and brittle fracture of the precipitates. In this work, a coupled crystal plasticity - phase field model for mixed ductile-brittle failure modes is formulated and used to investigate the effect of precipitate morphology and size distribution on damage evolution in aluminum alloys. A thermodynamically consistent framework for elastic and plastic work dissipation in the fracture process zone is used to formulate the coupled constitutive behavior for brittle and ductile damage, respectively. Representative Volume Elements (RVE) with varying particle morphology and orientation were generated and their uni-axial loading was simulated to assess the damage resistance of the different model microstructures. For critical energy release rate () values of the aluminum matrix ranging from 4 to 8 Jm-2 for single crystals and from 10 to 16 Jm-2 for polycrystals, the model predicts a change in failure modes from particle debonding to cracking followed by ductile matrix failure. The change of particle failure mechanism as a result of increased critical energy release rate is observed for both, single and polycrystalline model microstructures. For the case of particle debonding, microstructures with circular or ellipsoidal particles (with the major axis perpendicular to the loading direction) show a higher ductility and fracture work compared to the other studied cases. In the case of particle cracking, microstructures with ellipsoidal particles aligned parallel to the loading axis show a higher ductility and fracture work among the investigated cases. The simulations qualitatively reproduce the experimentally observed particle failure mechanisms (cracking and debonding) for two different matrix alloy classes (commercially pure and 2xxx alloys) reinforced with ceramic particles.
keywords:
Ductile fracture\sepPhase field \sepCrystal plasticity \sepAluminum alloys \sepPrecipitate \sepParticle1 Introduction
The use of aluminum alloys in the transportation sector is projected to grow, due to the increased importance of light-weight materials and recyclability in the global agenda to reduce carbon dioxide emissions. However, the deployment of recycled aluminum alloys with higher impurity content and a tolerable fraction of undesired intermetallic particles is currently impeded by their poor formability and in-service ductility. Understanding the relationship between the microstructure of alloys and their damage tolerance Tasan et al. (2014); Wang et al. (2018); Bieler et al. (2009) is therefore critical to the development of aluminum alloys that are made from scrap Raabe et al. (2022). The predominant failure mechanism in aluminum alloys is ductile fracture, with damage initiating around large precipitates due to strain localization and high stress triaxiality Lassance et al. (2007); Hannard et al. (2016); Shen et al. (2013). This is exacerbated in recycled alloys, since the intermetallic particles, which are formed due to the presence of higher amounts of scrap-related impurities, are regions of strain localization. The localized strain and plastic deformation is detrimental for alloy performance in terms of ductility and damage tolerance. Experimentally investigating the effects of precipitates on the mechanical behavior of different aluminum alloys is demanding and time consuming. Employing computational methods for studying the fracture behavior of aluminum alloys can therefore be an essential additional approach which particularly allows to separate different effects on the structure-property relations, such as particle shape, decohesion, number density, size or dispersion.
Several studies have addressed the effects of precipitates and/or impurities on the fracture behavior of aluminum alloys using experiments. The ductile fracture of alloys with brittle particles is initiated by nucleation of micro-voids. In aluminum alloys, particle fracture or debonding from the matrix are as major mechanisms of damage initiation Argon et al. (1975); Lassance et al. (2007); Babout et al. (2004); Hannard et al. (2016). Lassance et al. Lassance et al. (2007) have observed both, particle breakage and particle/matrix debonding in in-situ tensile tests of AA 6060 alloys. Similarly, Babout et al. Babout et al. (2004) have shown these two damage mechanisms for two aluminum alloys, commercially pure Al and Al2124 alloy, reinforced with ceramic particles. Effects of particle size and distribution on the fracture behavior of Al 6xxx alloys have been studied by Hannard et al. Hannard et al. (2016, 2017). They showed that the particle size distribution plays an important role for the ductility of such alloys Hannard et al. (2016). Friction stir processing has been studied as a way to improve the fracture strain of Al 6056 alloys through homogenisation of the particle distribution, which yielded a shift of the size distribution towards smaller values Hannard et al. (2017).
Several damage modeling studies have been published, dealing with aluminum composites and the effect of particulates on their fracture behavior Geni and Kikuchi (1998); Law et al. (2012); Babout et al. (2004); Segurado et al. (2003); Segurado and Llorca (2006); Ayyar et al. (2008). Geni et al. Geni and Kikuchi (1998) have used a Finite Element Method (FEM)-Gurson model to study the influence of the size distribution of SiC particles on the damage behavior. They showed that a uniform size distribution of these particles leads to a higher fracture strain. The role of particle clustering on the mechanical properties of Metal Matrix Composites (MMCs) has been investigated by micro-mechanical modeling Segurado et al. (2003); Segurado and Llorca (2006) and it has been found that even a small perturbation of the particles’ spatial homogeneity significantly increases their damage probability. Moreover, it has been shown that the damage preferentially initiates from particles existing close to each other. Similar results about the damage initiation and particle dispersion have been also obtained by others Ayyar et al. (2008); Mishnaevsky et al. (2004). However, in case of nano-sized particles, the mechanical response of MMCs change dramatically Law et al. (2012). Using discrete dislocation simulations, it was shown that the mechanical response of the nano-composite is significantly deteriorated by the damage of non-clustered and weakly clustered particles Law et al. (2012).
For modeling ductile fracture, which is the main mechanism for the failure of aluminum alloys, the Gurson approach Gurson (1977) and its extensions Tvergaard and Needleman (1984) have been applied to model the nucleation and growth of the micro-voids which leads to creation of micro-cracks or voids via coalescence. Formation of micro-voids or micro-cracks is driven by strain localization, due to presence of hard inclusions in the microstructure. Based on the characteristics of the inclusions and the associated microstructure, formation of either micro-cracks via brittle fracture of inclusions or micro-voids via debonding of the inclusions from the base microstructure initiate the damage process.
Modeling approaches for ductile fracture fall into two categories, where cracks or voids are modeled either by discontinuous or by continuous methods. Discontinuous models include the FEM Ran et al. (2013), Cohesive Zone formulations (CZ) Needleman (1990), and extended FEM (XFEM) Moës et al. (1999) methods. Continuous approaches include continuum damage models, damage gradient, and Phase Field (PF) models. In contrast to the discontinuous approaches where the crack is explicitly modeled as a discontinuity in the material, in continuous approaches it is modeled via gradual material degradation during the damaging process, for instance in terms of the damage parameter in the PF method.
During the last years, the PF method has emerged as a promising approach for modeling fracture Bourdin et al. (2000); Kuhn and Müller (2010); Spatschek et al. (2011); Miehe et al. (2010); Borden et al. (2014); Ambati et al. (2015); Shanthraj et al. (2016, 2017); Borden et al. (2012); Miehe et al. (2015); Aygün et al. (2021); Rezaei et al. (2021), besides its widespread application for the simulation of phase transformation and microstructure evolution Boettinger et al. (2002); Chen (2002); Steinbach (2009); Tourret et al. (2022); Vakili et al. (2020a, b); Mianroodi et al. (2022). In the PF brittle fracture models Bourdin et al. (2000); Miehe et al. (2010); Kuhn and Müller (2010); Borden et al. (2014); Shanthraj et al. (2016, 2017); Borden et al. (2012), the discontinuity caused by the presence of a crack is represented by a non-conserved PF order parameter, which varies smoothly from a cracked surface () to the intact material (), characterized by a specified length scale. The initiation and propagation of the crack is driven by the minimization of the total free energy, considering contributions from elastic strain release (gain in energy) and surface energy of the crack (loss in energy). The energetic description of the brittle fracture PF models reduces to the classical Griffith theory when the characteristic length scale approaches zero. When considering elasto-plastic materials, corresponding PF models have to also take into account the inelastic deformation of the material, which can be described in the framework of the finite strain approximation Shanthraj et al. (2016, 2017); Borden et al. (2012); Miehe et al. (2015).
While many studies exist on brittle fracture, only few works addressed the modeling of ductile fracture, for example Ambati et al. (2015); Miehe et al. (2016); Borden et al. (2016); Miehe et al. (2017); Aldakheel et al. (2018); Noll et al. (2020); Dittmann et al. (2018). Only some of these formulations use the finite deformation approximation of the material, for instance Borden et al. (2016); Dittmann et al. (2018); Miehe et al. (2016, 2017); Aldakheel et al. (2018). The model proposed by Ambati Ambati et al. (2015) couples the damage degradation function with the accumulation of an effective plastic strain. For large strains, Miehe et al. Miehe et al. (2016) presented a PF model for ductile fracture, where the crack propagation is based on the accumulated effective elasto-plastic work. They assume that the hydrostatic pressure has negligible effect on material failure under plastic deformation conditions and that the gradual damage evolution reduces both, the material’s total elastic stiffness (due to gradual loss of material coherency) and the material’s strain hardening capability. In a similar approach, Borden et al. Borden et al. (2016) presented a ductile PF fracture model in which damage propagation reduces the size of the material’s yield surface. Moreover, they addressed the stress triaxiality as a driving force for damage propagation. An approach to integrate the Gurson model in the PF modeling of ductile fracture was introduced by Aldakheel et al. Aldakheel et al. (2018), where the criterion for damage initiation and propagation is based on the void volume fraction. In spite of the rich variety of existing ductile fracture models, there are yet no crystal plasticity ductile fracture models available for materials undergoing large deformations.
Therefore, in this paper a new PF model is formulated to simulate ductile fracture in conjunction with a crystal plasticity formulation. It is coupled with an existing brittle fracture PF model Shanthraj et al. (2016) to study damage evolution in aluminum alloys which contain stiff particles, such as precipitates, intermetallic compounds or non-metallic inclusions, that can intrude from scrap or processing. The ductile damage model is applied to the soft aluminum matrix, while the brittle damage model is used to simulate damage in the stiff particles. In the brittle damage model Shanthraj et al. (2016), the initiation of cracks effectively degrades the materials stiffness such that the fully cracked region looses its cohesion and thus its stiffness entirely. In contrast, in the ductile model part cracking of the material effectively leads to yield degradation.
2 Theory
2.1 Kinematics
We define a microstructural domain with as the boundary. The deformation under an applied load can be defined by a mapping function from points in the reference configuration to points in the deformed configuration . Here, we use the multiplicative decomposition of the deformation gradient, given by , into the elastic and plastic components, . The elastic part of the deformation gradient is used to obtain the second Piola–Kirchhoff stress with , where is the elastic stiffness tensor. For a given plasticity model, the plastic velocity gradient is evolved using .
2.2 Thermodynamics
We confine the model formulations to isothermal and quasi-static processes with no external heat supply. The balance laws for linear momentum, angular momentum, internal energy, and total entropy are given by
| (1) |
where, is the Piola–Kirchhoff stress, is the internal energy density, represents the entropy density, and is the entropy production-rate density. Through the absolute temperature , the entropy balance (Eq. 14) can be written in the corresponding dissipation balance form
| (2) |
where represents the dissipation-rate density. Combination of Eqs. 13 and 2 then yields the reduced form
| (3) |
of the dissipation-rate density , again at constant temperature, where represents the free energy density.
All free energy density models to be discussed below represent special cases of the general form
| (4) |
in terms of the inelastic local deformation, , a set of local internal variables, , and the scalar damage order parameter .
Modeling the stress as purely energetic, we have
| (5) |
for the first Piola–Kirchhoff stress. In this case,
| (6) |
follows from Eq. 4 for the dissipation rate with respect to , where
| (7) |
represents the variational derivative. Assuming no-flux (Neumann) or constant-rate (Dirichlet) boundary conditions, i.e.,
| (8) |
respectively, Eq. 6 reduces to the bulk form
| (9) |
for the dissipation rate and its density.
To model kinetics in the context of Eq. 9, attention is restricted here to constitutive relations based on the dissipation potential
| (10) |
This potential determines the dependent constitutive quantities
| (11) |
so that the residual form via Eq. 9 becomes
| (12) |
Assuming further that is non-negative () and convex in the thermodynamic driving forces, i.e.,
| (13) |
the resultant constitutive form expressed by Eq. 12 fulfils the dissipation principle .
2.3 Constitutive modeling
Using the general formalism outlined above, a constitutive law is now reduced to specifying two potentials: the free energy, , and the dissipation potential, , along with a suitable parameterization of the microstructure as a set of internal state variables. In the current constitutive model, the total free energy is separated into elastic, plastic and damage contributions.
| (14) |
These terms are explained in the context of the ductile fracture model in the following section
2.4 Ductile fracture
Ductile fracture occurs as a result of plastic deformation and its localization Pineau and Pardoen (2007). Therefore, the plastic work provides a major contribution to the total free energy. The elastic strain energy contribution is in most ductile materials smaller than the plastic work, owing to their usually moderate elastic modulus and the high local inelastic deformation that precedes damage initiation. Similarly, the elastic contribution to the energy release rate in the fracture zone is significantly lower than that of the plastic energy. However, for the sake of completeness and for treating also materials with high elastic stiffness, we consider the elastic contribution in the ductile fracture here as well. The elastic free energy is given by
| (15) |
where is the elastic strain energy of the intact (undamaged) material, which is given by , with and .
We use in the present work a phenomenological crystal plasticity formulation for alloys with Face-Centered Cubic (FCC) crystal structure Hutchinson and Hill (1976); Peirce et al. (1982). In this model, the internal state variables, , associated with plasticity are parameterised in terms of the accumulated plastic slip on each of the crystallographic slip systems, which are indexed by . The thermodynamic driving forces conjugate to is given by
| (16) |
The plastic deformation is described by activation of the slip systems when the resolved shear stress exceeds the critical resolved shear stress . For a more detailed description of the model see Eisenlohr et al. (2013).
The driving force for ductile fracture is the degradation of the stored plastic energy, i.e. the local loss in work hardening, given by
| (17) |
from the undamaged state, i.e. , to the fully damaged state, i.e. . The thermodynamic driving force conjugate to the internal variables is given by , i.e. the slip resistance on slip system .
Using a power law dissipation function for the set of yield surfaces , the plastic constitutive equations are given by
| (18) |
where and are unit vectors along the slip direction and slip plane normal, respectively, is the resolved shear stress, is the reference shear rate, and the stress exponent.
The dependence of the plastic free energy, , on is determined by the form of the hardening law. The slip resistances on each slip system, , evolve asymptotically towards with shear () according to the relationship
| (19) |
with the parameters and . The interaction between different slip systems is captured by the hardening matrix .
In the current ductile damage model, the damage contribution to the free energy is given by
| (20) |
where is the critical energy release rate in the ductile fracture model. The thermodynamic driving forces conjugate to the damage phase field can be obtained as
| (21) |
The constitutive description is completed by specifying the following convex, non-negative form of the dissipation potential,
| (22) |
where is a mobility parameter, which quantifies at which rate the decohesion zone is opening up, quantified by the phase-field variable, until its value reaches zero, translating to a fully developed crack. Equation. 22 results in the following field equation for the evolution of
| (23) |
2.5 Brittle fracture
The brittle fracture model used in this work follows the PF damage model described in Shanthraj et al. (2016). The approach is based on the extension of the brittle fracture theory of Griffith, which assumes that the fracture process is driven by the elastic energy release rate in the process zone. The elastic free energy contribution is given by , where the elastic energy degrades from the undamaged, i.e. (), to the fully damaged state, i.e. (), state. The is the elastic strain energy of the undamaged material.
The damage evolution equation for the brittle fracture model is given by
| (24) |
where and are the damage mobility and the damage length scale, respectively. It is noteworthy that the material’s effective stiffness is gradually reduced by the progressing damage, as quantified by the change in the value of the damage parameter, i.e. . This means that the damage parameter also quantifies the material’s loss in cohesion, which implies that for a fully damaged material, i.e. , the stiffness approaches zero. See Shanthraj et al. (2016) for more details about the model.
3 Simulation setup
The simulations are performed on a model aluminum alloy system containing Mg2Si particles. Regarding the role of particle size, one should note, that it is particularly the larger ones that are more prone to initiate damage. In Al 6xxx series alloys, the average size of the particles that tend to initiate damage, including Mg2Si, is around 1-20m Hannard et al. (2016); Petit et al. (2019). Therefore, in this work, we only consider those particles that are larger than a few microns. Sub-micron sized particles are not included explicitly. However, their effect on the material’s strength is included through the constitutive description of the mechanical response of the aluminum matrix, see the model parameters given in Table 1. For the case of alloys in which sub-micron sized particles are the largest ones that are present in the material, the model parameters, including the length scale parameter in (23) and (24), can be correspondingly adjusted. In the following, the detail of the simulation setup is explained.
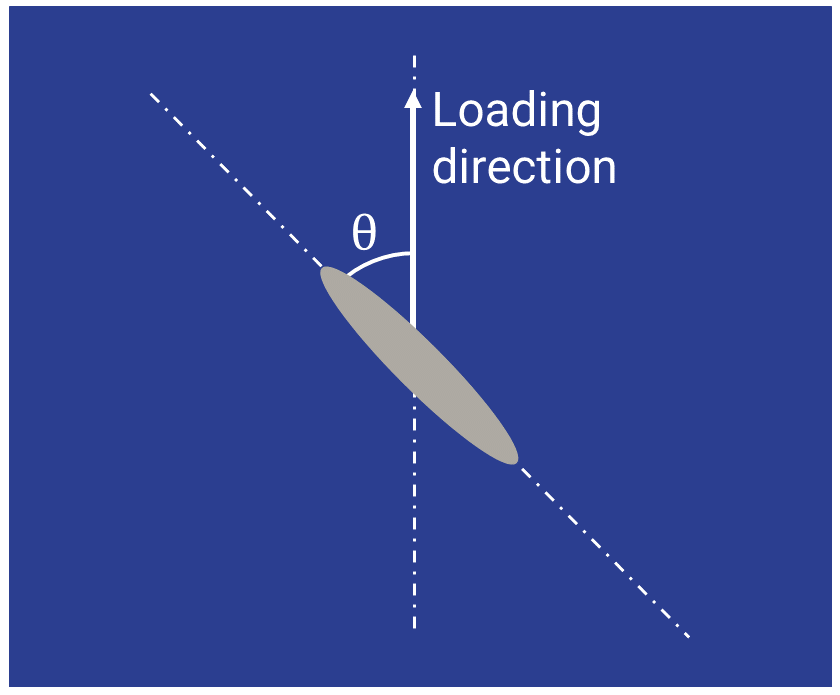
A set of simulations is performed on a single crystal Aluminum model alloy with randomly distributed Mg2Si particles in space. The simulations are based on the ductile fracture model for the aluminum matrix and the brittle fracture model for the Mg2Si particles, as described in section 2. To investigate the role of particle shape and orientation on fracture behavior, simulations are performed for both, circular and ellipsoidal particles. For the latter case, three different scenarios for ellipsoidal particles are investigated, with their major axes aligned either parallel, 45∘ inclined, or perpendicular to the loading direction, respectively, i.e. forming angles of 0, 45, and 90∘ to the loading direction. A schematic picture of an ellipsoidal particle and the angle between the loading direction and the long axis of the particle is shown in Fig. 1. It should be noted that throughout this paper the uni-axial loading direction is the same as shown in Fig. 1. Unless otherwise stated, the system size for all simulations is m which is discretized into voxels of size m. Three random seeds are considered for generating three spatially random particle distributions in each case of circular, parallel, 45∘ inclined, and perpendicular ellipsoidal particles. Three different seeds for each geometry are considered to investigate dependency of the results on the particles’ spatial distribution. It needs to be mentioned that the clustering of particles is excluded by assuring a minimum spacing of 20 between neighboring particles. Furthermore, the volume fraction of particles is approximately identical in all simulations for the single crystal.
Similar simulations are designed for the polycrystalline aluminum alloys consisting of 10 grains with random orientations. Similar to the case of the single crystal simulations, several Mg2Si particles with a minimum inter-particle spacing of 20m are placed inside the microstructure in a way that no particle is on the grain boundaries. Analogous to the single crystal simulations, in the polycrystal case four particle configurations are considered, namely, with circular, and ellipsoidal particles aligned parallel, 45∘ inclined, and perpendicular to the loading direction. However, here only one random spatial distribution of the particles is considered in each of the geometrical cases.
In all the simulations (either the single crystal or the polycrystal), the critical energy release rate for the Mg2Si particles is set to Jm-2. Different values for the matrix critical energy release rate are used for each set of simulations, to explore its effect on the fracture behavior of aluminum alloys. For the single crystal simulations, and Jm-2, and for the polycrystal simulations, and Jm-2 are employed. Here, the matrix critical energy release rate corresponds to that of the aluminum alloy excluding the micro-scale Mg2Si precipitates. This value can be different even for the same alloy having various sub-micron sized precipitates (for example , , or even Guinier-Preston (GP) zones) with various morphologies or characteristics (for instance chemical bonding, or coherency in case of GP zones) Chen et al. (2006). Through all the simulations, the sample is loaded in one direction (uniaxial tensile test). The aluminum matrix deforms elasto-plastically, while the particles (Mg2Si) deform purely elastically. The elastic properties of both, the Mg2Si Jain et al. (2013) particles and aluminum Ma (2018) matrix are listed in Table 1. For the aluminum matrix, with its FCC crystal structure, there are 12 slip system given by . The constitutive parameters for the phenomenological crystal plasticity model for the aluminum are taken from reference Eisenlohr et al. (2013) and are summarized in Table 1.
| a | n | ||||||||||
| (GPa) | (GPa) | (GPa) | (MPa) | (MPa) | (MPa) | ||||||
| Aluminum | 106.75 | 60.41 | 28.34 | 0.001 | 40 | 210 | 20 | 2.25 | 20.0 | 1.0 | 1.4 |
| Mg2Si | 113.09 | 23.0 | 44.0 | - | - | - | - | - | - | - | - |
4 Results and discussion
4.1 Single crystal
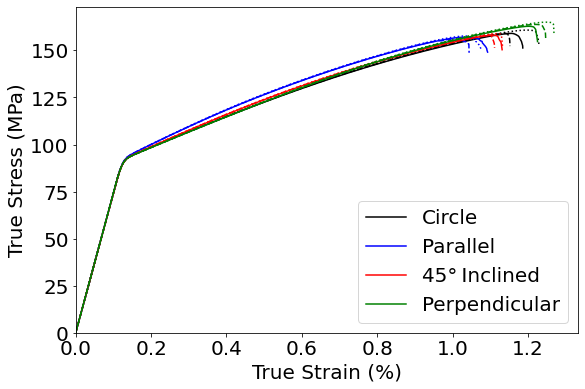
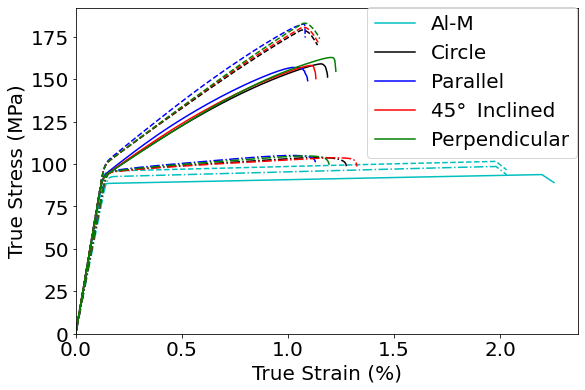
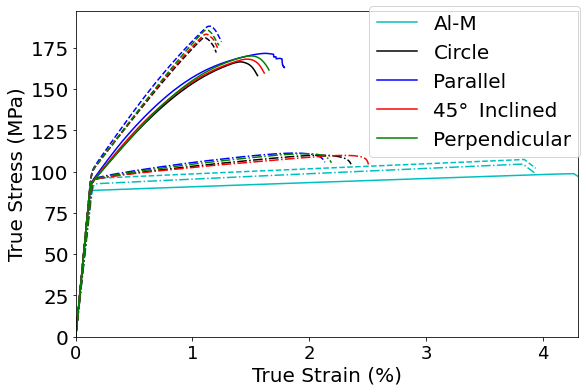
The uni-axial stress-strain response of the single crystal samples with four different particle configurations are depicted in Figs. 2 and 3 for and Jm-2, respectively, (see Section 3). Here, Al-M stands for the Aluminum Matrix. For the stress-strain curves in Figs. 2a and 3a, the colored lines represent either the shape (for the circular particles) or the orientation of particles about the loading direction (for ellipsoidal ones), respectively. For each figure, the extracted data for fracture strain, fracture work, and the fracture strength are shown in (b), (c), and (d), respectively. The solid, dashed, and pointed lines (Figs. 2c-d and Figs. 3c-d) correspond to three different spatially random distributions of the particles. Using the lower value of Jm-2, the alloys with ellipsoidal particles aligned parallel to the loading direction show the lowest ductility (fracture strain), fracture work, fracture stress, and fracture strength, see Fig. 2b-d, respectively. In contrast, for the alloys with higher matrix critical energy release rate Jm-2 (Fig. 3), the parallel particles aligned to the loading direction show superior mechanical behavior, higher fracture strain, fracture work, and higher fracture strength. It is noteworthy, that the alloys with parallel particles aligned to the loading direction show slightly higher strain hardening than the other particle configurations (circular, and ellipsoidal rather than those that are parallel to the loading direction) for both and Jm-2 (Figs. 2a and 3a), and still they show the highest ductility, fracture work, and fracture strength for Jm-2 (Figs. 3b-d). This is in contrast with the fact that generally the ductility decreases as the strain hardening increases.
(a) (b)
(c) (d)
(a) (b)

(c) (d)
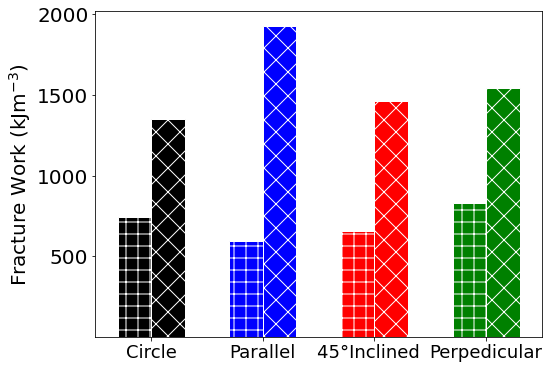
The comparison of the results for the two sets of single crystal simulations with two different values of (Figs. 2 and 3) reveals that the fracture strain and fracture work both increase when using a higher value of Jm-2, compared to Jm-2. The critical energy release rate, in Eqs. 23 (ductile fracture) and 24 (brittle fracture), determine the initiation of the damage. One might therefore expect that by doubling , the fracture work will likewise double since the critical energy release rate of particles is kept constant. In order to asses this estimate, the average values of the fracture work for different particle configurations are plotted in Fig. 4, where the bars with "+" and "x" correspond to and Jm-2, respectively. The average fracture work approximately doubles with the doubling, except for the case of parallel particles, where it almost triples.
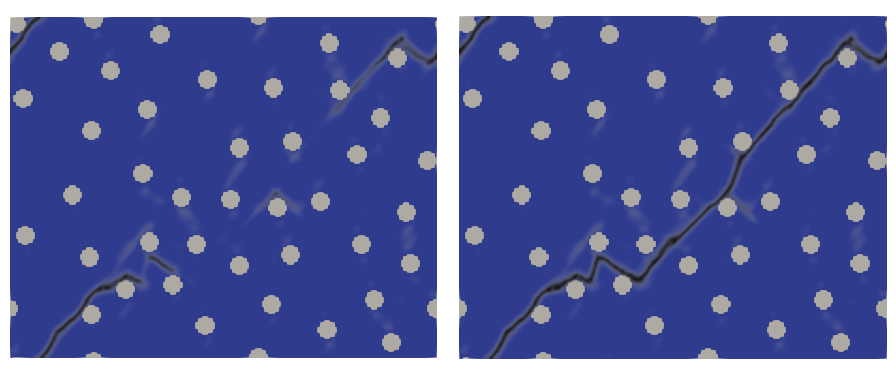
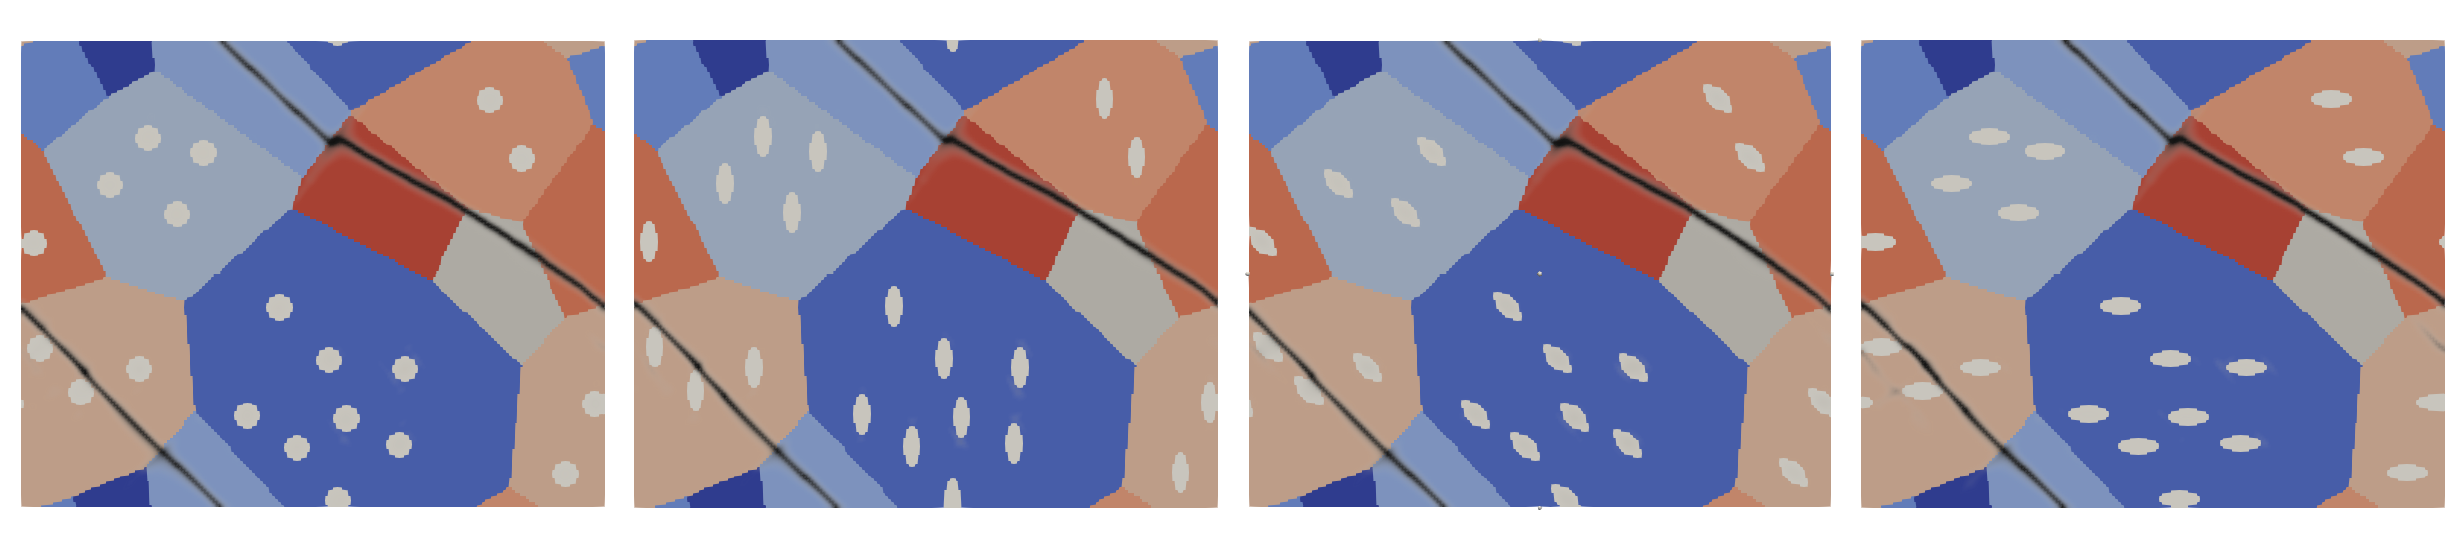
The variations in the fracture work can be explained by noting the microstructure and the damage mechanism. For the single crystal aluminum with circular particles, the crack evolution in Fig. 5 shows that the damage initiates from the Mg2Si/aluminum matrix interface and propagates into the matrix for the case of Jm-2, Fig. 5a, while cracking of Mg2Si particles is the main mechanism for damage initiation in the alloys with Jm-2, see Fig. 5b. For the former case, as shown in Fig. 5a, besides damage initiation from the particle/aluminum interface, the crack tends to propagate along these interfaces until it sweeps through the sample. On the other hand, for Jm-2, crack propagation occurs by merging of the originally isolated cracks from the individually damaged particles, Fig. 5b. The debonding of particle/matrix and cracking of the particles for the two kinds of aluminum alloys, with different critical energy release rates, are also observed for the rest of samples with different particle topology (ellipsoidal particles aligned parallel, 45∘ inclined, and perpendicular to the loading direction), see Fig. 6. The different types of damage mechanisms found for the two sets of simulations is the main reason for the observed variations in the fracture work ratios for the different particle configurations.
(a)
(b)
(a) (b) (c) (d)
(e) (f) (g) (h)
)
4.2 Single crystal: Aluminum crystal orientation
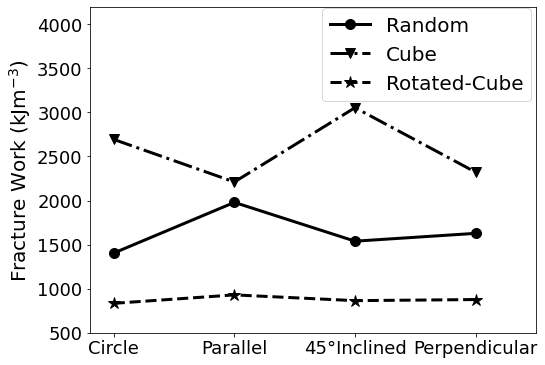
The effect of the aluminum single crystal orientation on the damage behavior of the samples with different particle configuration is shown in Fig. 7 and compared with that of the aluminum matrix without any particles. The results of simulations with and Jm-2 are shown, respectively, in Figs. 7a and b. For both values of , the curves depicted by the solid lines are the results that have already been discussed in Section 4.1. Since the crystal orientation of theses simulations has been randomly selected with respect to the sample coordinates, we refer to them as ’random’ in the following. This randomly chosen crystal orientation was used for all the samples with different particle configurations. The aim of showing these results is to compare them with the result obtained for the two other crystal orientations, namely, the cube and the rotated-cube orientation, which are depicted in terms of point-dashed lines and dashed lines, respectively in Fig. 7. For the cube orientation, the crystal lattice coordinates coincide with the sample coordinates, while for the rotated cube, the crystal lattice is rotated 45∘ about the axis for the lattice represented by the three coordinates , , and . Therefore, for the cube orientation, the uniaxial loading direction is parallel to the aluminum crystal orientation of , and for the rotated-cube crystal it is parallel to . Considering the crystal orientation (distinguished by line type) and particle topology (distinguished by color), the stress-strain response of the samples varies significantly with the crystal orientation rather than with the particles’ shape/orientation, see Figs. 7a and b. In other words, for a single crystal, the effect of the crystal orientation of the host matrix on the mechanical response is more pronounced than that of the particles’ configuration (shape/orientation). Regardless of the shape/orientation, the presence of particles by itself is the main reason for such a variety on the mechanical response observed for different aluminum crystal orientations, as seen in Figs. 7a and b. To explain this, for each crystal orientation, a simulation is performed for a matrix without any particle. The results are shown by turquoise color in Figs. 7a and b, where solid, point-dashed, and dashed lines correspond to the random, cube, and rotated cube orientation, respectively. As shown in Figs. 7a and b, the crystal orientation does not significantly change the stress-strain response of the samples without particles compared to those samples with particles. It is noteworthy, that for the cube orientation (loading along ), the strain hardening of samples with different particle configurations (circular, and ellipsoidal aligned parallel, 45∘ inclined, and perpendicular to the loading direction) is similar to the samples without particles, but they show lower ductility. Although these simulations have been performed for a single crystalline host matrix, the results are also relevant for poly-crystalline materials.
(a) (b)
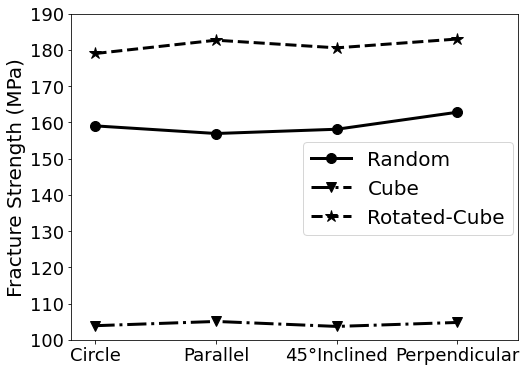
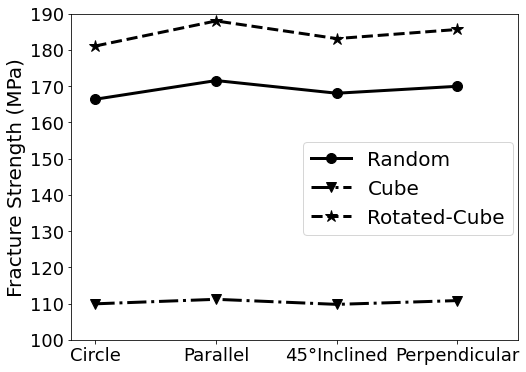
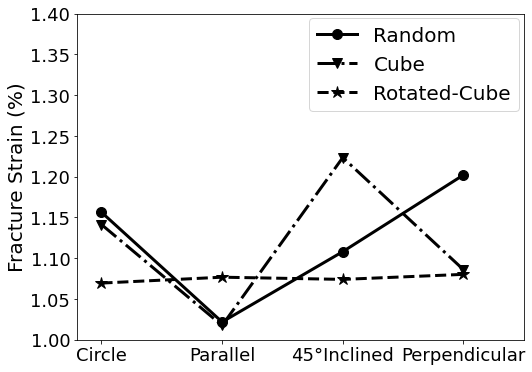
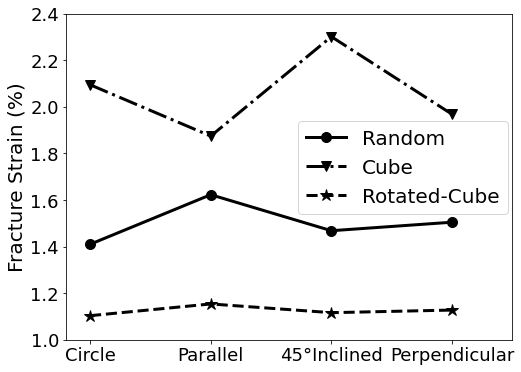
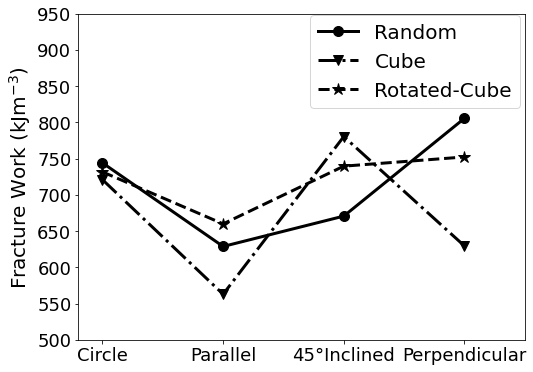
To compare the stress-strain curves in Figs. 7, the extracted data for maximum strength, fracture strain, and fracture work are plotted in Fig. 8. The figures in the left (Fig. 8a, c, and e) are the result for Jm-2, and the ones on the right (Fig. 8b, d, and f) are for Jm-2. The maximum strength, fracture strain, and fracture work are shown, respectively, in the first (Fig. 8a-b), second (Fig. 8c-d), and third (Fig. 8e-f) row. In all figures, the x-axis corresponds to different particle configurations, while different line styles show the aluminum matrix crystal orientation, solid line for random, point-dashed line for cube, and dashed line for rotated-cube orientation. The results referred to as ’random’ have already been discussed in Section 4.1. The maximum strength of the samples having the same crystal orientations are approximately identical for all particle configurations. As an example, for the material with cube orientation (shown with point-dashed lines in Figs. 8a and b) the maximum strength is around MPa for and MPa for Jm-2. These values are higher for the material with random orientation (solid lines in Figs. 8a and b) with about MPa for and MPa for Jm-2, and even higher for the material with rotated-cube orientation (dashed lines in Figs. 8a and b) with about MPa for and MPa for Jm-2. The fracture strain obtained using Jm-2 (Fig. 8) for the single crystal material with cube orientation demonstrates that the sample with particles parallel to the loading direction have the lowest value, similar to that of the random orientation. As already discussed in Section 4.1, this was the case for debonding of the particles from the matrix, see Figs. 2b and 6b. However, for the case of the rotated-cube crystal, the fracture strain is approximately identical for all particle configurations. For a higher value of Jm-2 (Fig. 8d), the fracture strain of the material with different particle configurations (circular, and ellipsoidal particles aligned parallel, 45∘ inclined, and perpendicular to the loading direction) for the material with rotated-cube orientation is almost unchanged, while for the single crystal with cube orientation, the results show a similar trend to that of using Jm-2, see the point-dashed lines in Figs. 8c and d. This finding reveals that increasing from to Jm-2 for the cube orientation does not change the damage mechanism and the single crystal with ellipsoidal particles aligned parallel to the loading direction fails first compared to the other cases with other particle configurations. A similar trend is observed for the magnitude of the fracture work, where the single crystal samples with cube orientation show a similar trend for both and Jm-2, see Figs. 8e and f. However, for the case of rotated-cube, the variation of the fracture work for different particle configurations is similar to the result of the random orientation for both values of and Jm-2, as shown by the dashed lines in Figs. 8e and f. It needs to be mentioned that for Jm-2, the increase of the fracture work for the parallel case is very small, as shown by the dashed line in Fig. 8f. These results reveal that the change of the damage mechanism between particle/matrix debonding and particle cracking does depend on the matrix’ crystal orientation. In a polycrystal, where different orientations are present in the microstructure, it is expected that the damage mechanism is a mixture of particle/matrix debonding in some grains, while particle breakage can prevail in others.
(a) (b)
(c) (d)
(e) (f)
4.3 Polycrystal
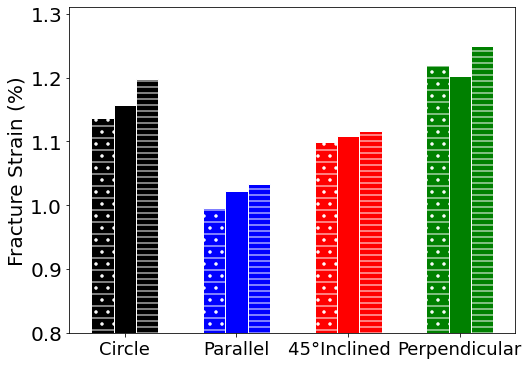
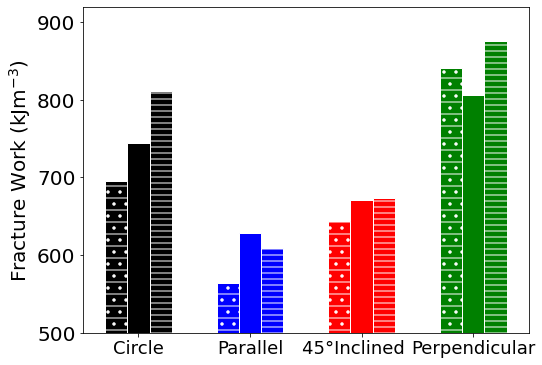
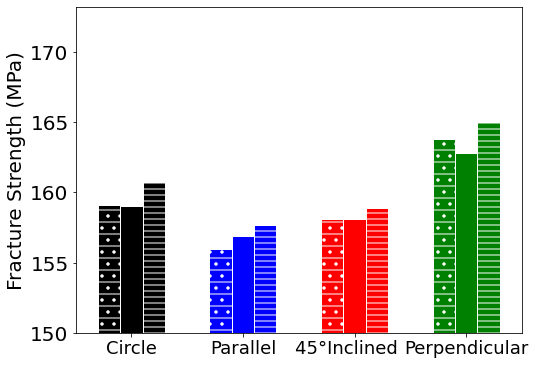
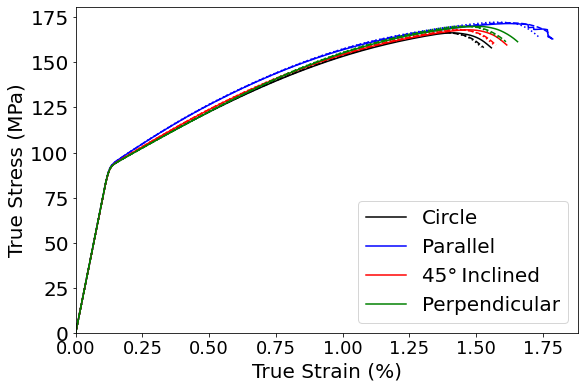
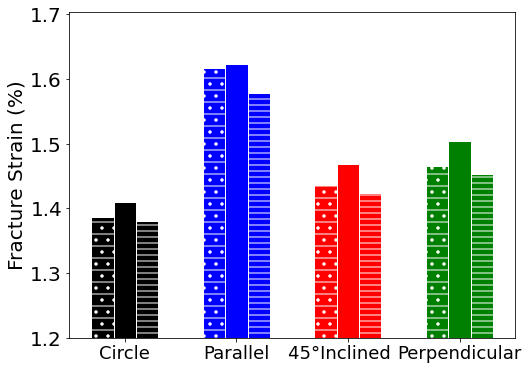
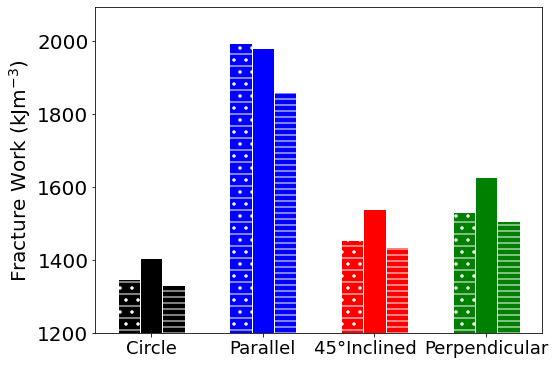
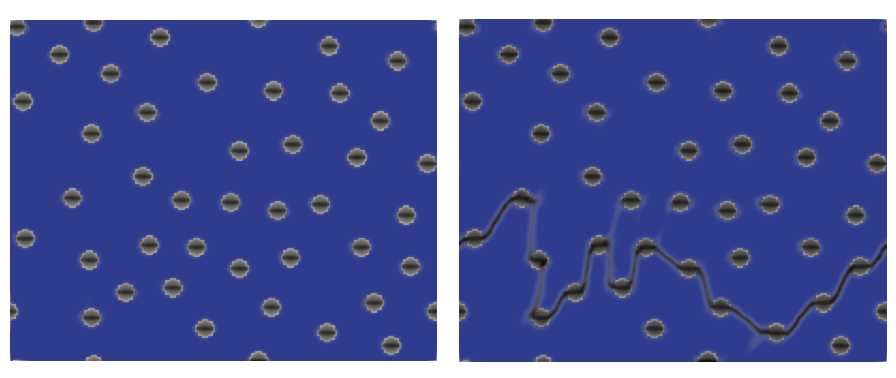
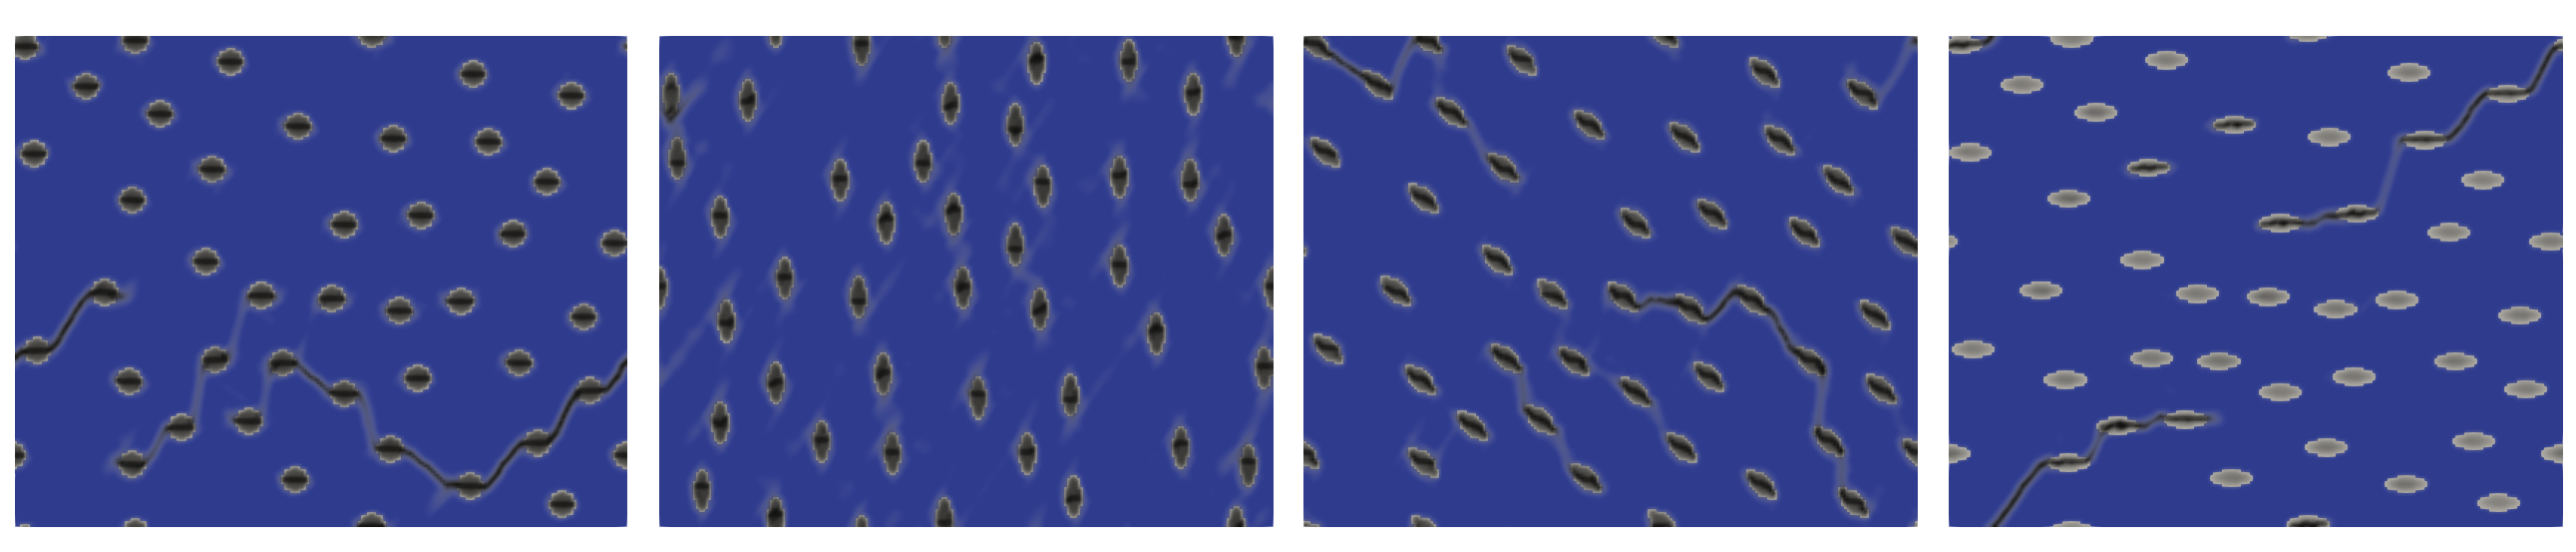
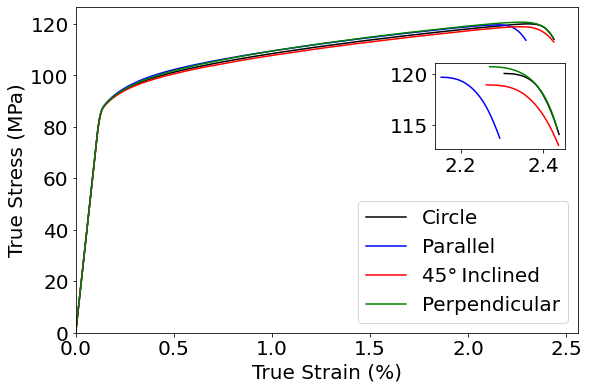
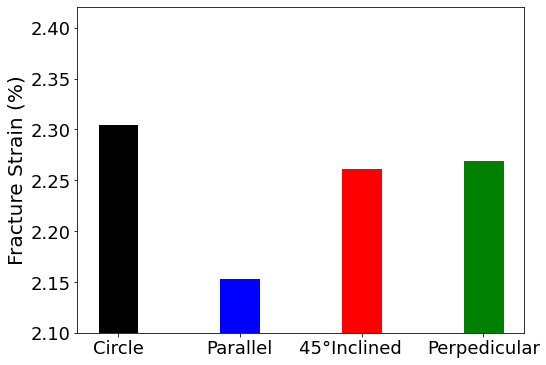
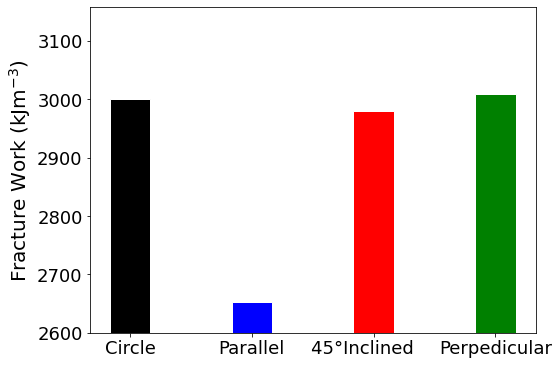
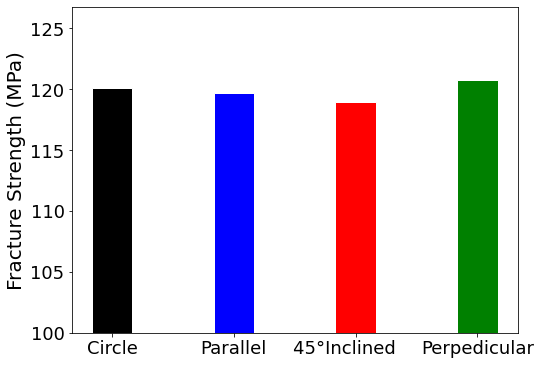
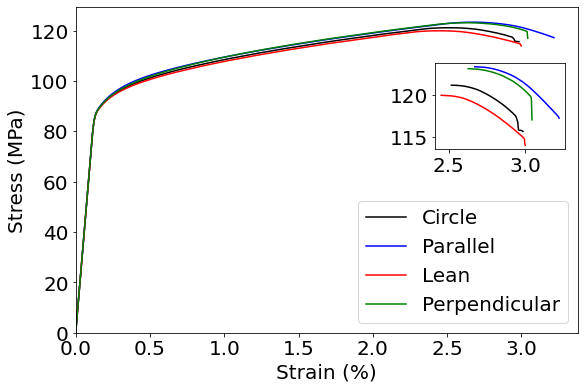
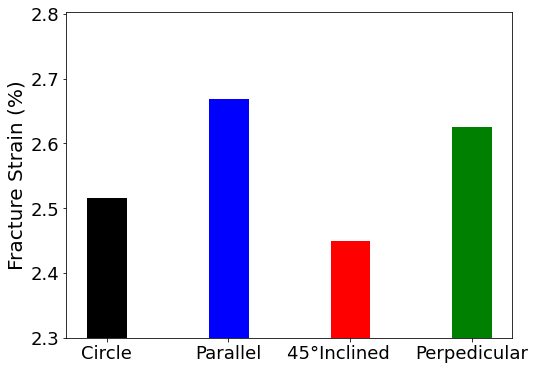
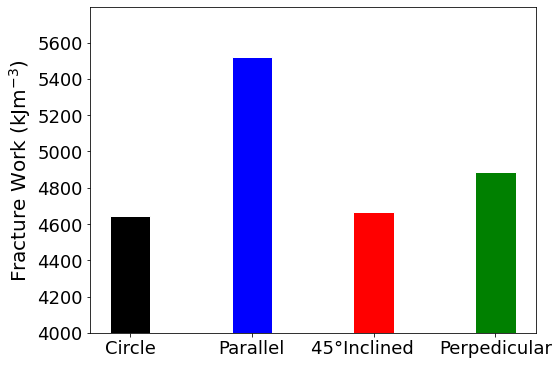
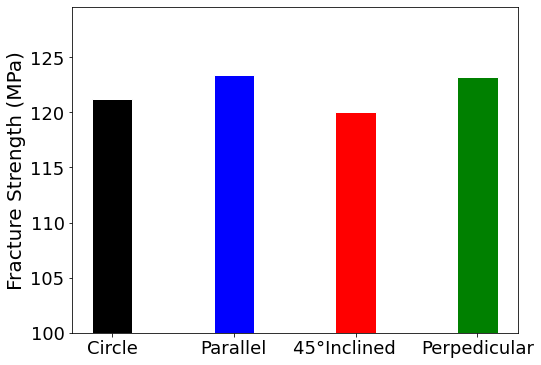
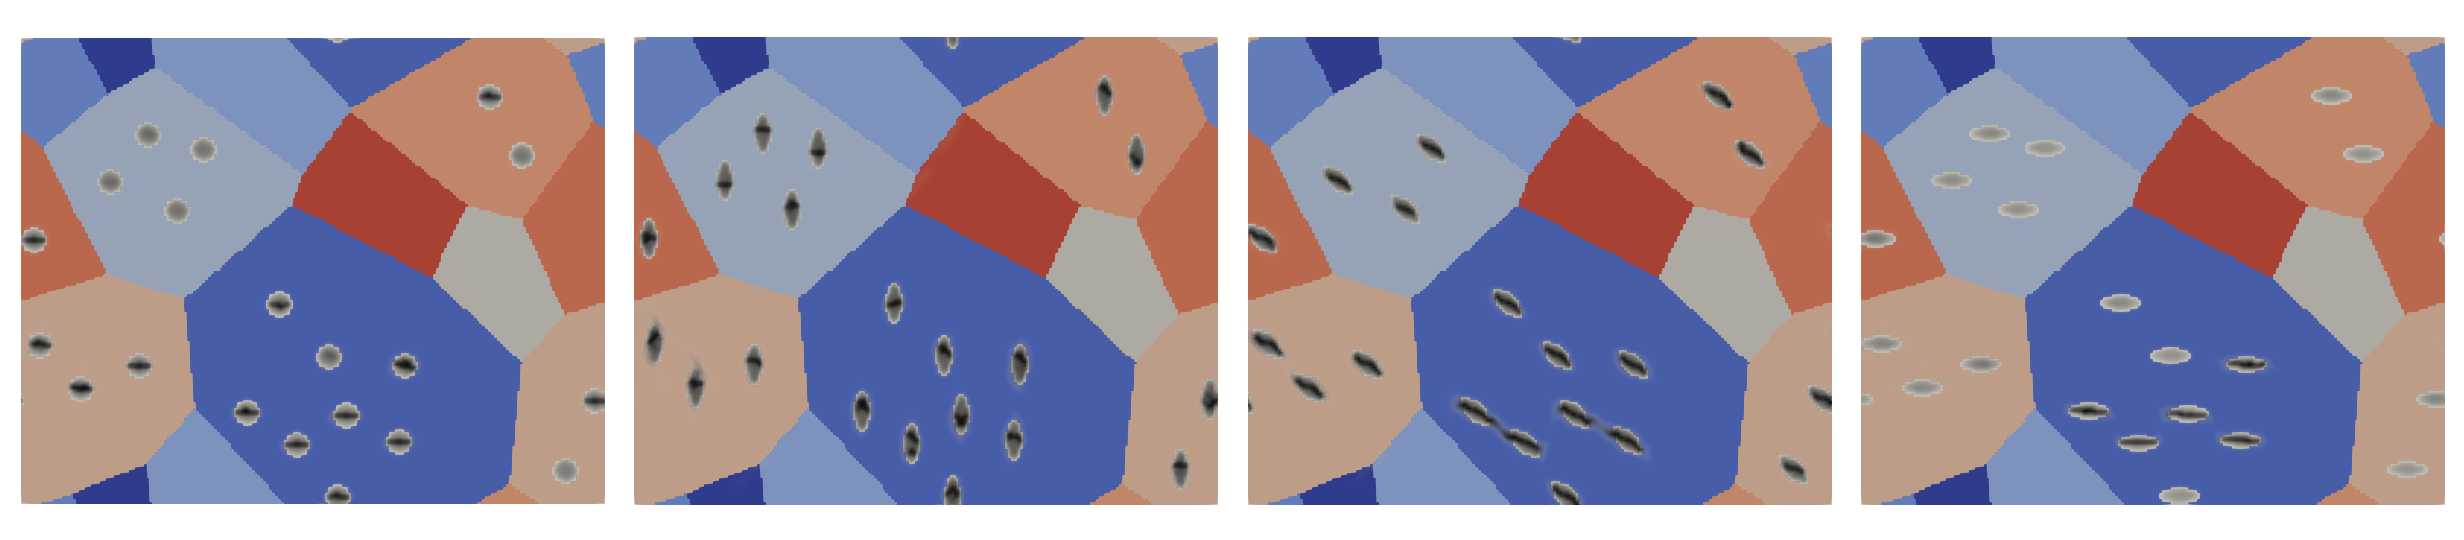
For a polycrystalline aluminum alloy with randomly distributed particles, similar particle configurations (circular and ellipsoidal Mg2Si particles aligned parallel, 45∘ inclined, and perpendicular to the loading direction) are simulated. The simulation setup is similar as for the single crystals, see Section 4.1. However, fewer particles are used to avoid overlap between particles and grain boundaries. The damaged microstructure of the polycrystal samples including circular and ellipsoidal particles aligned parallel, 45∘ inclined, and perpendicular to the loading direction are shown in Figs. 9a-d. When using Jm-2, which exceeds the maximum value used for the single crystals, the cracks initiate from the Mg2Si/aluminum interfaces. To show the damage initiation and propagation, we have chosen a series of snapshots for the uniaxial loading case with ellipsoidal particles parallel to the loading direction, Fig. 10. The damage propagates through the matrix without considerable particle failure, i.e. fracture is entirely ductile in this case. The reason for this behavior, at a relatively high critical energy release rate of Jm-2, is explained by the strengthening provided by the presence of grain boundaries. In polycrystalline materials, grain boundaries act as barriers against dislocation motion, so that dislocations pile-up and enhance the strain hardening. Even though the constitutive model does not account for the Hall-Petch effect, we do observe additional strengthening due to the sole presence of grain boundaries. This is due to the additional compatibility constraints at the grain boundaries. As a result, the plastic energy for ductile fracture is reached at lower strains than in single crystals which undergo weaker strain hardening. Therefore, the crack initiates in the aluminum matrix while almost no damage is observed for the Mg2Si particles, even not when using Jm-2, see Fig. 9. The stress-strain response of the polycrystals is shown in Fig. 11a, where the colors correspond to the particles’ shape (for circular particles) and their orientation to the loading direction (for ellipsoidal particles). The magnification in Fig. 11a shows the region where fracture starts in each sample (maximum stress of the true stress-strain curves). The fracture strain, fracture work, and fracture strength extracted from the stress-strain curves are shown in Fig. 11b to d, respectively. Similar to the single crystal case using Jm-2, see Figs. 2, the polycrystalline material with ellipsoidal particles parallel to the load axis show the lowest fracture strain and fracture work (Fig. 11b and c). However, for the other model materials, the difference between the values of the fracture strain is only , i.e. their damage response is approximately identical. Likewise, the fracture work for the other samples (circular and ellipsoidal particles aligned 45∘ inclined, and perpendicular to the loading direction) only varies slightly, Fig. 11c. The fracture strength remains approximately identical for all particle configurations as well, see Fig. 11d.
(a) (b) (c) (d)

(a) (b) (c)
(a) (b)
(c) (d)
The results obtained for polycrystal simulations with a higher value for the critical energy release rate Jm-2 are depicted in Fig. 12, where Fig. 12a represents the stress-strain curves, and Fig. 12b-d show the fracture strain, fracture work, and fracture strength of these simulations, respectively. The model material with ellipsoidal particles aligned parallel to the loading direction shows the highest fracture strain and fracture work (Figs. 12b and c) among all polycrystals, similar as observed for the single crystal cases using Jm-2, see Fig. 3.
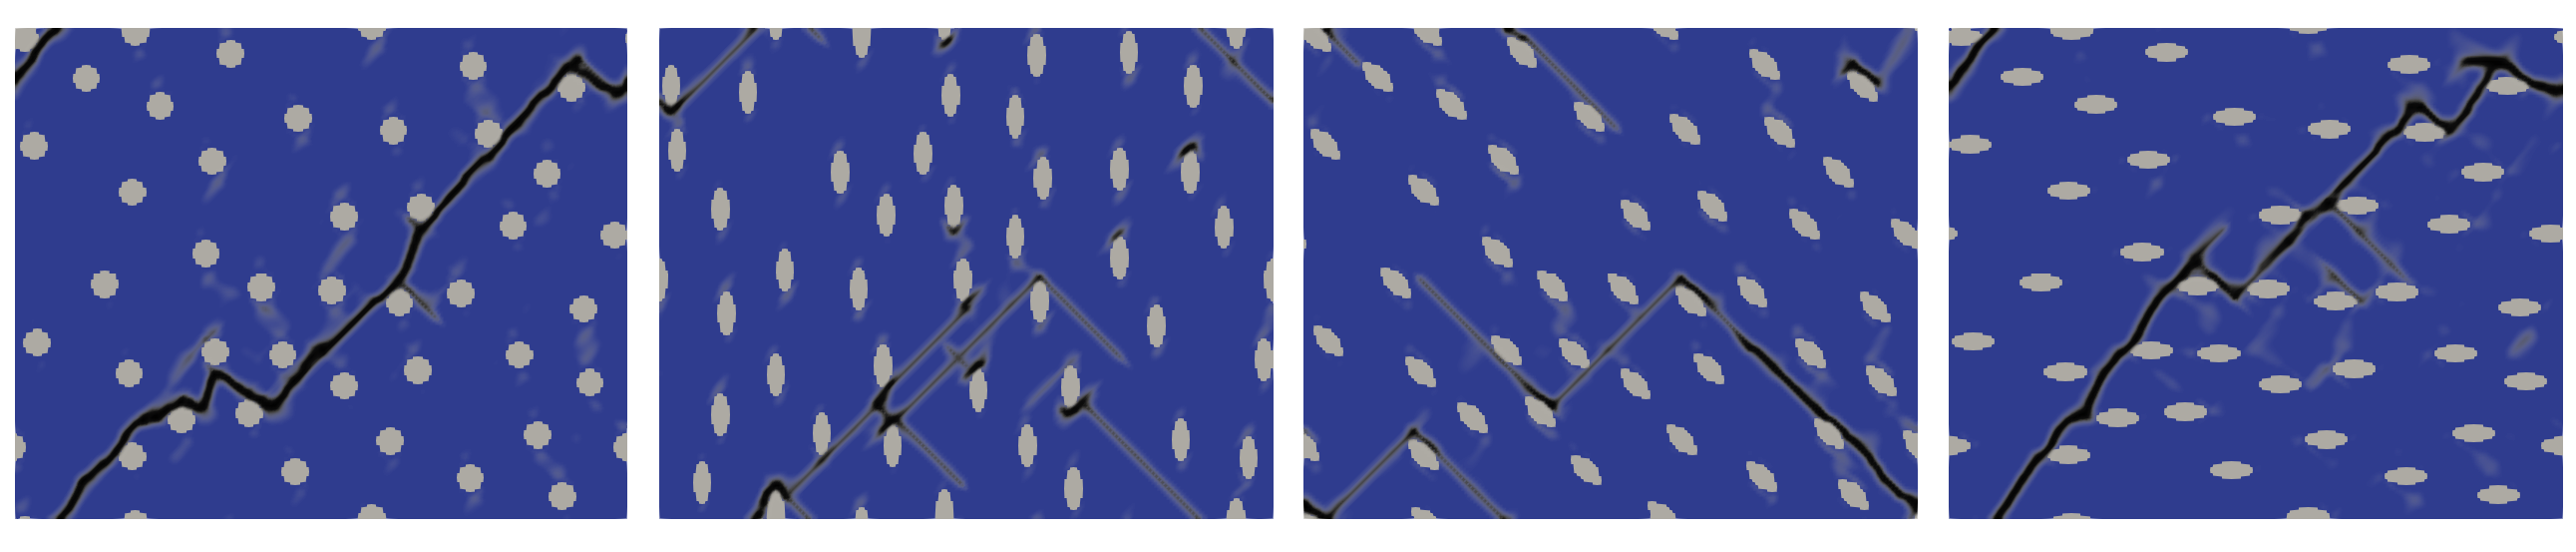
The damage morphologies of the polycrystalline microstructures are shown in Fig. 13 for the four particle configurations. Cracking starts from by breaking of the Mg2Si precipitates and subsequent crack propagation into the adjacent aluminum matrix. An example is shown in Fig. 13c.
The simulation of two different types of damage initiation scenarios in this work, debonding of particles from the matrix and their breaking, reveals that differences in topology, shape, spacing and orientation of the particles in aluminum alloys can substantially affect the materials’ mechanical properties, particularly their damage mode. These different types of failure modes have been indeed observed in the alloy AA 6060 Lassance et al. (2007). For a tensile test at room temperature, it was found that the particles break, while at an elevated test temperature of 550 ∘C they debond from the aluminum matrix. Furthermore, Babout et al. Babout et al. (2004) have found two different types of damage mechanisms by using two different aluminum matrices, namely pure Al and Al2124, reinforced with spherical hard ceramic particles. They observed that for commercially pure aluminum, particles debond from the matrix, while they break for Al2124 alloy. The results of the simulations shown in Figs. 9 and 13 qualitatively describe these two regimes, i.e. particle/matrix debonding and particle breakage, respectively, as observed in Lassance et al. (2007); Babout et al. (2004).
(a) (b)
(c) (d)
(a) (b) (c) (d)
5 Conclusions
In this paper, a new ductile fracture model is formulated and applied to investigate the particle- and microstructure-dependent initiation and evolution of damage in aluminum alloys. For an aluminum alloy with micro-scale particles (Mg2Si precipitates), a ductile fracture model is used for describing the response of the aluminum matrix, while a brittle fracture model is used for the particles. The effect of the particles’ shapes and orientations (relative to the loading axis) is studied by simulating both, single crystal and polycrystal model materials with circular and ellipsoidal particles (varying their longitudinal axis relative to the loading direction). It is demonstrated that depending on the aluminum matrix’s critical energy release rate, damage can initiate either from the particle/matrix interface (debonding) or by particle cracking. Based on the type of damage initiation, different particle topologies lead to differences in damage behavior. For particle/matrix damage initiation, circular and ellipsoidal particles arranged perpendicular to the loading direction leads to the highest ductility and fracture work, while for particle breaking, model materials with parallel ellipsoidal particles show the best results (i.e. highest damage resistance). For the case of single crystals, the change in damage mechanism depends on the crystal’s orientation.
References
- Aldakheel et al. (2018) Aldakheel, F., Wriggers, P., Miehe, C., 2018. A modified gurson-type plasticity model at finite strains: formulation, numerical analysis and phase-field coupling. Computational Mechanics 62, 815–833.
- Ambati et al. (2015) Ambati, M., Gerasimov, T., De Lorenzis, L., 2015. A review on phase-field models of brittle fracture and a new fast hybrid formulation. Computational Mechanics 55, 383–405.
- Argon et al. (1975) Argon, A.S., Im, J., Safoglu, R., 1975. Cavity formation from inclusions in ductile fracture. Metallurgical Transactions A 6, 825.
- Aygün et al. (2021) Aygün, S., Wiegold, T., Klinge, S., 2021. Coupling of the phase field approach to the Armstrong-Frederick model for the simulation of ductile damage under cyclic load. International Journal of Plasticity 143, 103021. URL: https://www.sciencedirect.com/science/article/pii/S0749641921000966.
- Ayyar et al. (2008) Ayyar, A., Crawford, G., Williams, J., Chawla, N., 2008. Numerical simulation of the effect of particle spatial distribution and strength on tensile behavior of particle reinforced composites. Computational Materials Science 44, 496–506.
- Babout et al. (2004) Babout, L., Maire, E., Fougères, R., 2004. Damage initiation in model metallic materials: X-ray tomography and modelling. Acta Materialia 52, 2475–2487.
- Bieler et al. (2009) Bieler, T., Eisenlohr, P., Roters, F., Kumar, D., Mason, D., Crimp, M., Raabe, D., 2009. The role of heterogeneous deformation on damage nucleation at grain boundaries in single phase metals. International Journal of Plasticity 25, 1655–1683. URL: https://www.sciencedirect.com/science/article/pii/S074964190800140X. exploring New Horizons of Metal Forming Research.
- Boettinger et al. (2002) Boettinger, W.J., Warren, J.A., Beckermann, C., Karma, A., 2002. Phase-field simulation of solidification. Annual Review of Materials Research 32, 163–194.
- Borden et al. (2016) Borden, M.J., Hughes, T.J., Landis, C.M., Anvari, A., Lee, I.J., 2016. A phase-field formulation for fracture in ductile materials: Finite deformation balance law derivation, plastic degradation, and stress triaxiality effects. Computer Methods in Applied Mechanics and Engineering 312, 130–166.
- Borden et al. (2014) Borden, M.J., Hughes, T.J., Landis, C.M., Verhoosel, C.V., 2014. A higher-order phase-field model for brittle fracture: Formulation and analysis within the isogeometric analysis framework. Computer Methods in Applied Mechanics and Engineering 273, 100–118.
- Borden et al. (2012) Borden, M.J., Verhoosel, C.V., Scott, M.A., Hughes, T.J., Landis, C.M., 2012. A phase-field description of dynamic brittle fracture. Computer Methods in Applied Mechanics and Engineering 217-220, 77–95.
- Bourdin et al. (2000) Bourdin, B., Francfort, G., Marigo, J.J., 2000. Numerical experiments in revisited brittle fracture. Journal of the Mechanics and Physics of Solids 48, 797–826.
- Chen et al. (2006) Chen, J.H., Costan, E., van Huis, M.A., Xu, Q., Zandbergen, H.W., 2006. Atomic pillar-based nanoprecipitates strengthen AlMgSi alloys. Science 312, 416–419.
- Chen (2002) Chen, L.Q., 2002. Phase-field models for microstructure evolution. Annual Review of Materials Research 32, 113–140.
- Dittmann et al. (2018) Dittmann, M., Aldakheel, F., Schulte, J., Wriggers, P., Hesch, C., 2018. Variational phase-field formulation of non-linear ductile fracture. Computer Methods in Applied Mechanics and Engineering 342, 71–94.
- Eisenlohr et al. (2013) Eisenlohr, P., Diehl, M., Lebensohn, R., Roters, F., 2013. A spectral method solution to crystal elasto-viscoplasticity at finite strains. International Journal of Plasticity 46, 37–53. Microstructure-based Models of Plastic Deformation.
- Geni and Kikuchi (1998) Geni, M., Kikuchi, M., 1998. Damage analysis of aluminum matrix composite considering non-uniform distribution of SiC particles. Acta Materialia 46, 3125–3133.
- Gurson (1977) Gurson, A.L., 1977. Continuum Theory of Ductile Rupture by Void Nucleation and Growth: Part I-Yield Criteria and Flow Rules for Porous Ductile Media. Journal of Engineering Materials and Technology 99, 2–15. arXiv:https://asmedigitalcollection.asme.org/materialstechnology/article-pdf/99/1/2/5788715/2_1.pdf.
- Hannard et al. (2017) Hannard, F., Castin, S., Maire, E., Mokso, R., Pardoen, T., Simar, A., 2017. Ductilization of aluminium alloy 6056 by friction stir processing. Acta Materialia 130, 121--136.
- Hannard et al. (2016) Hannard, F., Pardoen, T., Maire, E., Bourlot, C.L., Mokso, R., Simar, A., 2016. Characterization and micromechanical modelling of microstructural heterogeneity effects on ductile fracture of 6xxx aluminium alloys. Acta Materialia 103, 558--572.
- Hutchinson and Hill (1976) Hutchinson, J.W., Hill, R., 1976. Bounds and self-consistent estimates for creep of polycrystalline materials. Proceedings of the Royal Society of London. A. Mathematical and Physical Sciences 348, 101--127.
- Jain et al. (2013) Jain, A., Ong, S.P., Hautier, G., Chen, W., Richards, W.D., Dacek, S., Cholia, S., Gunter, D., Skinner, D., Ceder, G., Persson, K.a., 2013. The Materials Project: A materials genome approach to accelerating materials innovation. APL Materials 1, 011002.
- Kuhn and Müller (2010) Kuhn, C., Müller, R., 2010. A continuum phase field model for fracture. Engineering Fracture Mechanics 77, 3625--3634. Computational Mechanics in Fracture and Damage: A Special Issue in Honor of Prof. Gross.
- Lassance et al. (2007) Lassance, D., Fabregue, D., Delannay, F., Pardoen, T., 2007. Micromechanics of room and high temperature fracture in 6xxx al alloys. Progress in Materials Science 52, 62--129.
- Law et al. (2012) Law, E., Pang, S.D., Quek, S.T., 2012. Effects of particle arrangement and particle damage on the mechanical response of metal matrix nanocomposites: A numerical analysis. Acta Materialia 60, 8--21.
- Ma (2018) Ma, D., 2018. Elastic properties of Mn-rich intermetallic phase in engineering aluminum alloys: An ab initio study. Journal of Applied Physics 124, 085109.
- Mianroodi et al. (2022) Mianroodi, J.R., Shanthraj, P., Liu, C., Vakili, S., Roongta, S., Siboni, N.H., Perchikov, N., Bai, Y., Svendsen, B., Roters, F., Raabe, D., Diehl, M., 2022. Modeling and simulation of microstructure in metallic systems based on multi-physics approaches. npj Computational Materials 8, 93.
- Miehe et al. (2016) Miehe, C., Aldakheel, F., Raina, A., 2016. Phase field modeling of ductile fracture at finite strains: A variational gradient-extended plasticity-damage theory. International Journal of Plasticity 84, 1--32.
- Miehe et al. (2017) Miehe, C., Aldakheel, F., Teichtmeister, S., 2017. Phase-field modeling of ductile fracture at finite strains: A robust variational-based numerical implementation of a gradient-extended theory by micromorphic regularization. International Journal for Numerical Methods in Engineering 111, 816--863.
- Miehe et al. (2015) Miehe, C., Hofacker, M., Schänzel, L.M., Aldakheel, F., 2015. Phase field modeling of fracture in multi-physics problems. Part II. coupled brittle-to-ductile failure criteria and crack propagation in thermo-elastic-plastic solids. Computer Methods in Applied Mechanics and Engineering 294, 486--522.
- Miehe et al. (2010) Miehe, C., Welschinger, F., Hofacker, M., 2010. Thermodynamically consistent phase-field models of fracture: Variational principles and multi-field fe implementations. International Journal for Numerical Methods in Engineering 83, 1273--1311.
- Mishnaevsky et al. (2004) Mishnaevsky, L., Derrien, K., Baptiste, D., 2004. Effect of microstructure of particle reinforced composites on the damage evolution: probabilistic and numerical analysis. Composites Science and Technology 64, 1805--1818.
- Moës et al. (1999) Moës, N., Dolbow, J., Belytschko, T., 1999. A finite element method for crack growth without remeshing. International Journal for Numerical Methods in Engineering 46, 131--150.
- Needleman (1990) Needleman, A., 1990. An analysis of decohesion along an imperfect interface. International Journal of Fracture 42, 21--40.
- Noll et al. (2020) Noll, T., Kuhn, C., Olesch, D., Müller, R., 2020. 3D phase field simulations of ductile fracture. GAMM-Mitteilungen 43, e202000008.
- Peirce et al. (1982) Peirce, D., Asaro, R., Needleman, A., 1982. An analysis of nonuniform and localized deformation in ductile single crystals. Acta Metallurgica 30, 1087--1119.
- Petit et al. (2019) Petit, T., Besson, J., Ritter, C., Colas, K., Helfen, L., Morgeneyer, T.F., 2019. Effect of hardening on toughness captured by stress-based damage nucleation in 6061 aluminum alloy. Acta Materialia 180, 349--365.
- Pineau and Pardoen (2007) Pineau, A., Pardoen, T., 2007. 2.06 - failure of metals, in: Milne, I., Ritchie, R., Karihaloo, B. (Eds.), Comprehensive Structural Integrity. Pergamon, Oxford, pp. 684--797.
- Raabe et al. (2022) Raabe, D., Ponge, D., Uggowitzer, P., Roscher, M., Paolantonio, M., Liu, C., Antrekowitsch, H., Kozeschnik, E., Seidmann, D., Gault, B., De Geuser, F., Dechamps, A., Hutchinson, C., Liu, C., Li, Z., Prangnell, P., Robson, J., Shanthraj, P., Vakili, S., Sinclair, C., Bourgeois, L., Pogatscher, S., 2022. Making sustainable aluminum by recycling scrap: The science of dirty alloys. Progress in Materials Science , 100947URL: https://www.sciencedirect.com/science/article/pii/S0079642522000287.
- Ran et al. (2013) Ran, J., Fu, M., Chan, W., 2013. The influence of size effect on the ductile fracture in micro-scaled plastic deformation. International Journal of Plasticity 41, 65--81. URL: https://www.sciencedirect.com/science/article/pii/S0749641912001325.
- Rezaei et al. (2021) Rezaei, S., Mianroodi, J.R., Brepols, T., Reese, S., 2021. Direction-dependent fracture in solids: Atomistically calibrated phase-field and cohesive zone model. Journal of the Mechanics and Physics of Solids 147, 104253.
- Segurado et al. (2003) Segurado, J., González, C., LLorca, J., 2003. A numerical investigation of the effect of particle clustering on the mechanical properties of composites. Acta Materialia 51, 2355--2369.
- Segurado and Llorca (2006) Segurado, J., Llorca, J., 2006. Computational micromechanics of composites: The effect of particle spatial distribution. Mechanics of Materials 38, 873--883.
- Shanthraj et al. (2016) Shanthraj, P., Sharma, L., Svendsen, B., Roters, F., Raabe, D., 2016. A phase field model for damage in elasto-viscoplastic materials. Computer Methods in Applied Mechanics and Engineering 312, 167--185.
- Shanthraj et al. (2017) Shanthraj, P., Svendsen, B., Sharma, L., Roters, F., Raabe, D., 2017. Elasto-viscoplastic phase field modelling of anisotropic cleavage fracture. Journal of the Mechanics and Physics of Solids 99, 19--34.
- Shen et al. (2013) Shen, Y., Morgeneyer, T.F., Garnier, J., Allais, L., Helfen, L., Crépin, J., 2013. Three-dimensional quantitative in situ study of crack initiation and propagation in AA6061 aluminum alloy sheets via synchrotron laminography and finite-element simulations. Acta Materialia 61, 2571--2582.
- Spatschek et al. (2011) Spatschek, R., Brener, E., Karma, A., 2011. Phase field modeling of crack propagation. Philosophical Magazine 91, 75--95.
- Steinbach (2009) Steinbach, I., 2009. Phase-field models in materials science. Modelling and Simulation in Materials Science and Engineering 17, 073001.
- Tasan et al. (2014) Tasan, C., Hoefnagels, J., Diehl, M., Yan, D., Roters, F., Raabe, D., 2014. Strain localization and damage in dual phase steels investigated by coupled in-situ deformation experiments and crystal plasticity simulations. International Journal of Plasticity 63, 198--210. URL: https://www.sciencedirect.com/science/article/pii/S0749641914001260. deformation Tensors in Material Modeling in Honor of Prof. Otto T. Bruhns.
- Thomas (1968) Thomas, J.F., 1968. Third-order elastic constants of aluminum. Phys. Rev. 175, 955--962.
- Tourret et al. (2022) Tourret, D., Liu, H., LLorca, J., 2022. Phase-field modeling of microstructure evolution: Recent applications, perspectives and challenges. Progress in Materials Science 123, 100810.
- Tvergaard and Needleman (1984) Tvergaard, V., Needleman, A., 1984. Analysis of the cup-cone fracture in a round tensile bar. Acta Metallurgica 32, 157--169.
- Vakili et al. (2020a) Vakili, S., Steinbach, I., Varnik, F., 2020a. Controlling bubble coalescence in metallic foams: A simple phase field-based approach. Computational Materials Science 173, 109437.
- Vakili et al. (2020b) Vakili, S., Steinbach, I., Varnik, F., 2020b. Multi-phase-field simulation of microstructure evolution in metallic foams. Scientific Reports 10, 19987.
- Wang et al. (2018) Wang, D., Shanthraj, P., Springer, H., Raabe, D., 2018. Particle-induced damage in Fe-TiB2 high stiffness metal matrix composite steels. Materials & Design 160, 557--571.