Quantum versus classical nature of a low-temperature magnetic phase transition in TbAl3(BO3)4
Abstract
Specific heat, , of a TbAl3(BO3)4 crystal was studied for 50 mK 300 K, with emphasis on K, where a phase transition was found at K. Nuclear, non-phonon (), and lattice contributions to were separated. Lowering of with ncrease of magnetic field parallel to the easy magnetization axis, , was found. It was established that and a Grüneisen ratio depend on and in a way characteristic of systems, in which a classical transition is driven by quantum fluctuations, QF, to a quantum critical point at , by tuning a control parameter (). The phase diagram was constructed and the dynamical critical exponent was assessed. Nature of the transition was not established explicitly. Magnetization studies point at the ferromagnetic ordering of Tb3+ magnetic moments, however, lowering of with increase in is opposite to the classical behavior. Hence, a dominant role of QF was supposed.
I Introduction
Quantum phase transitions, QPT, induced at zero temperature, , by quantum fluctuations, QF, as the result of tuning a certain control parameter, e.g., pressure or magnetic field, , are a topical subject of research in condensed matter physics [1]. As the phenomena appearing at inaccessible experimentally , they are much more difficult for investigation than the classical phase transitions, induced by thermal fluctuations. Their existence can be recognized only by investigating certain unusual properties induced by them at finite near the quantum critical point, QCP. For example, near QCP, unconventional superconductivity and pronounced non-Fermi-liquid effects in metallic systems were observed [2]. Moreover, at the classical transitions, some thermodynamic quantities being the second derivatives of the thermodynamic potential diverge, whereas due to the third law of thermodynamics, some of these divergences, e.g., of specific heat, disappear at QCP. According to [3] and [4], in such a case, the parameter :
| (1) |
called the magnetic Grüneisen ratio, is much more informative, because it should diverge and change sign at QCP. is proportional to the ratio of the sensitivity of entropy, , to the control parameter (i.e., ), growing near QPT, to the sensitivity of to (i.e., ), growing near the classical transition. By using standard thermodynamic transformations and the Maxwell relation, it can be shown (1) that is the ratio of the measurable quantities, i.e., of the minus derivative of magnetization, with respect to , at fixed , to the specific heat, , or as the (multiplied by ) adiabatic change of under influence of . The latter value is the main parameter characterizing magnetocaloric effect.
While many papers considered QPT in metallic, heavy-fermion and/or superconducting systems [2], experimental papers on QPT in insulating anti- or ferromagnets are scarce and, in majority, consider pyrochlores [5] or organic systems, in which magnetic moments arranged in chains or planes are considered by using the Ising or Heisenberg models, e.g., [6], [7], and [8].
While the quantum Ising system located in perpendicular to the Ising axis is the basic and intuitively clear example of the system showing QPT, the bulk TbAl3(BO3)4 crystal seems to be a unique ferromagnetic Ising system, in which the temperature of the magnetic transition, discovered by us below 1 K and reported initially in Ref. [9], is lowered and driven to, as we suppose, QCP by applied along the Ising axis. This is a counterintuitive behavior, because in “normal” ferromagnets, applied along the easy axis supports the low temperature phase and lifts the transition temperature. Our paper is aimed (i) at presenting measurements of and of the TbAl3(BO3)4 single crystal, demonstrating the presence and evolution of the magnetic transition under influence of , (ii) at analysing whether near the transition point, the specific heat, magnetization, and parameter behaviors as functions of and are consistent with universal behaviors, independent of a physical mechanism of the transition, predicted by the renormalization group theory for the second order phase transitions, (iii) at analyzing if these behaviors are characteristic of the transitions having a quantum character, i.e., influenced by QF, and (iv) at considering possible mechanisms of the transition found.
It should be noted that (BO3)4 crystals, with Y or rare earth ion and Al, Ga, Cr or Fe, attract attention, because they are suitable for laser applications (e.g., aluminoborates doped with Nd are used in self-doubling frequency lasers), show large magnetoelectric effect [10], [11] and different magnetocrystalline anisotropy for various ions [12]. Thus, deep knowledge of their properties over a wide temperature range is highly desirable.
II Experiment
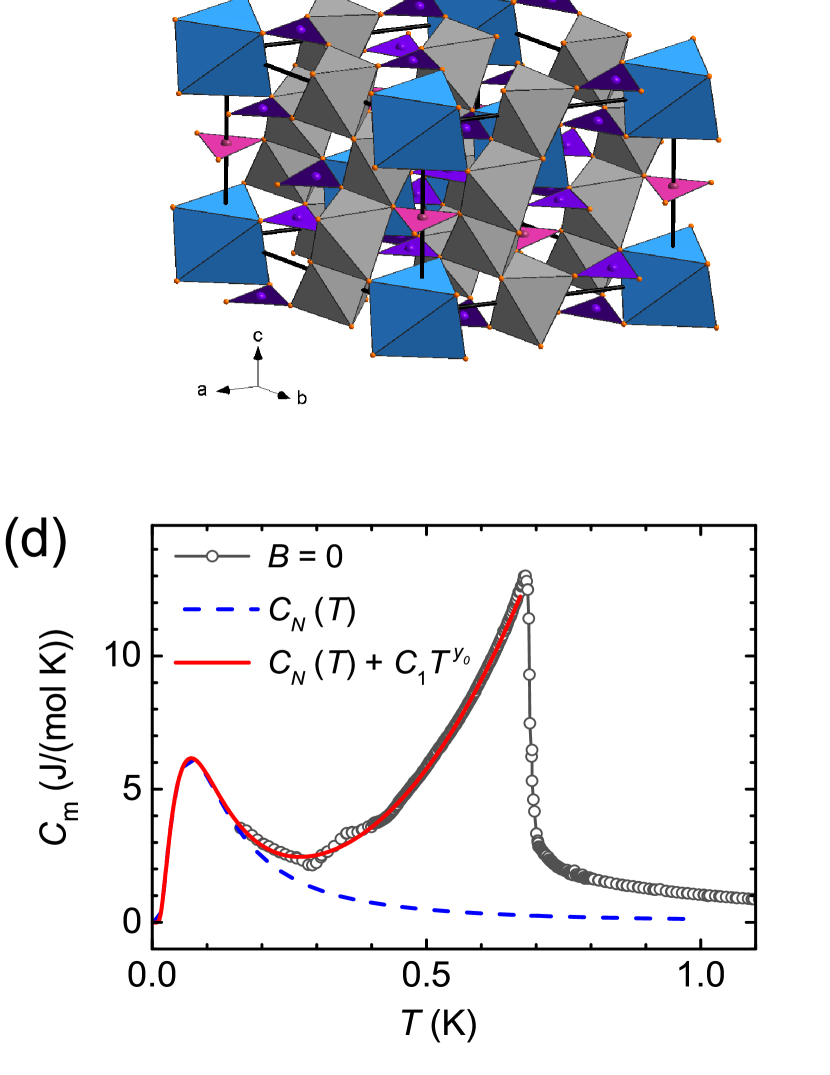
Al3(BO3)4 compounds with Y, Sm – Yb crystallize in a trigonal structure (space group no. 155, R32), Fig. 1a, with three formula units in the trigonal unit cell [13]. Magnetic ions are located inside the deformed trigonal prisms formed by six O2- ions. The –O6 prisms, separated along the c axis by B–O3 triangles, form chains along the 3-fold axis. Between the neighboring chains, other B–O3 triangles and oxygen octahedra containing Al3+ ions are located.
For the 0.514(2) mg plate, cut perpendicularly to the c axis from the TbAl3(BO3)4 single crystal grown by using the flux method [14], [15], specific heat and magnetization were measured as a function of and magnetic field applied along, , and perpendicularly, , to the axis.
was measured by means of the relaxation method, by using the Quantum Design PPMS system, equipped with the Dilution Refrigerator and Heat Capacity options. To gather the data for estimating the lattice specific heat, , the measurements were done from 50 mK to 300 K for . Since these studies showed that a certain unknown phase transition appears at 0.68 K, the detailed studies were performed for the 50 mK – 4 K range, for and for several and values, up to 3 T. It was verified that for both zero and non-zero , no singularities appear above 4 K. Near the discovered transition, was measured each 2 mK, whereas outside this region, over the range 50 mK – 1 K, each mK.
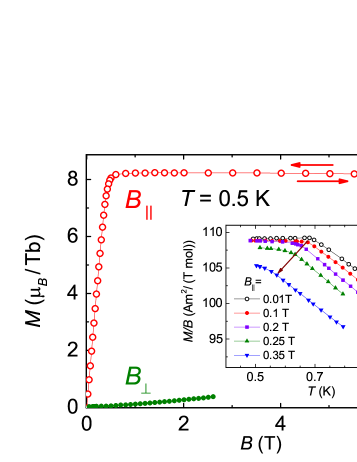
By using the Quantum Design MPMS - XL SQUID magnetometer equipped with the Helium 3 option, functions were measured for several values (0.01, 0.1, 0.2, 0.25, and 0.35 T), for 0.5 K 1 K. At 0.5 K, the function was measured for and .
III Results
In order to extract the most interesting for the present studies, “magnetic” or “non-phonon” contribution, , to , we modelled with the expression:
| (2) |
which mimics the contribution related to acoustic and some optical phonons in frames of the Debye model (the first therm in the parentheses), the contribution related to remaining optical phonons in frames of the Einstein model (the second term in the parentheses), and takes into account the effect of thermal lattice expansion by the method proposed in [16] (the denominator). It was used successfully for describing the lattice specific heat of many materials, e.g. of layered cobaltites [17] and olivines [18]. We fitted (2) to the data measured for TbAl3(BO3)4 in above 15 K, because, as Fig. 1b illustrates, for K all other than contributions can be neglected. The best description of was achieved by taking the following values of the fitted parameters: 0.00129 K-1, , K, , and, for 1, 2,..,6, respectively, 1, 2, 3, 2, 6, and 6, and 105, 160, 302, 462, 496, and 565 K. The values represent energies of the lowest optical branches, expressed in temperature units. They agree qualitatively with the energies of optical phonons corresponding to translations of the ions, as well as to translations and librations of the BO3 complexes, given in [19].
determined as the difference between the measured and the estimated is presented in Figs. 1c and 1d. At low , for T, the functions show: (i) a -shaped anomaly (at 680(2) mK for ), which decreases and shifts towards lower temperatures with increasing , (ii) a practically field-independent minimum 1.10(5) J/(mol K) at 290(1) mK, and (iii) upturn with decreasing below . The temperature range in which this upturn could be studied in our apparatus, was limited by a strong increase of the heat relaxation time with lowering , and as the result, no reliable specific heat values could be measured below 160 mK for and 200 mK for T. For T, Figs. 1c and 1e, sudden disappearance of the anomaly and of the minimum at are observed, and decreases with decreasing monotonically, down to unmeasurable values. Thus, the “lowest” experimental points were measured at mK for T and at mK for T.
IV Analysis
The asymmetric shape of the anomalies found in the functions, their rather large width, and lack of thermal hysteresis of their appearance on heating and on cooling the sample allow to assume that they are related to a second order phase transition. Of course, the lack of hysteresis is the necessary, but not sufficient, condition only and the two former arguments are rather heuristic. Thus, a more detailed analysis whether the specific heat as a function of temperature and magnetic field shows universal critical behaviors characteristic of the second order transitions, predicted by the renormalization group theory and independent of a physical mechanism of the transition, is necessary to identify the order of the found transition unequivocally. Such analysis was performed and will be presented below.
The specific heat data, Fig. 1, the magnetization curves presented in Fig. 2, as well as high sensitivity of the phase transition temperature to suggest the transition to be related to ordering of magnetic moments of the Tb3+ ions, being the only magnetic ions in the system. The shape of the magnetization curve for , presented in Fig. 2, and the measured saturation magnetization of TbAl3(BO3)4, 8.2 /Tb, being close to the magnetic moment of the free Tb3+ (9 ) ion, suggest that we deal with the ferromagnetic ordering. However, if it were the classical transition between the paramagnetic and ferromagnetic phases, induced by thermal fluctuations, should smear it and shift it towards higher . Actually, we observe the opposite, counterintuitive effect. The anomaly remains sharp and shifts towards lower with increase in , i.e., it behaves in a way characteristic of antiferromagnets. Thus, we suppose that the transition found has a “quantum” character, i.e. it is dominated by QF, which destroy the long range ferromagnetic order. In other words, we deal with one of the two model cases considered in the physics of quantum transitions [1], [20], shown schematically in the inset to Fig. 1f, in which the line of classical transitions ends at QCP. Below, we analyse, if other characteristics of the transition support this idea. However, the possibility that Tb–Tb exchange interactions are not the main driving force leading to the ferromagnetic order but some other mechanism is responsible for the transition evolving to QCP and the ordering of Tb3+ moments is a side effect only, can not be excluded a priori. An ordering of electric quadrupolar moments of the Tb–O6 complexes, cooperative-Jahn-Teller effect, or a more complex multipolar ordering [21], [22] could be indicated as such possible mechanisms.
To interpret the presence of the minimum at and of the upturn of on lowering below , for T, we assumed to be the sum of the critical contribution, , related to the phase transition, and the nuclear specific heat, , related to excitations of magnetic Tb nuclei. grows on lowering temperature, and becomes a dominating contribution to the measured specific heat, , below . Following analysis presented in [23], we verified that for TbAl3(BO3)4, the nuclear quadrupole interaction can be neglected. Then, the Hamiltonian of the nucleus can be presented in the form , where is the operator of the -component of the nuclear spin and is the coefficient of the interaction between the nuclear magnetic moment and the hyperfine field, . For Tb3+, and the nuclear magnetic moment is equal to 1.994 ( is the nuclear magneton). Thus, expressing energy in temperature units, we obtain the following formula for the nuclear contribution to the molar specific heat of TbAl3(BO3)4:
| (3) |
where , and denotes the gas constant. In the further analysis, we treated the hyperfine field, , as the fitted parameter.
According to [3] and [4], in the vicinity of a quantum second order transition, the scaling relation for the critical contribution to free energy, , has a form:
| (4) |
where is a universal scaling function, is dimension of the considered system, is the control parameter describing the distance from the QCP at and , and are non universal parameters, is the exponent of the critical behavior of the correlation length near QCP, , and is the “dynamical critical exponent” describing the correlation length along the direction of “imaginary time” . For , for the system evolving along the trajectory denoted as “” in the schematic phase diagram in the inset to Fig. 1f, the free energy is a regular function of that can be expanded into the Taylor series. However, at , for the system evolving along the “” trajectory and meeting on its “way” the classical phase transition, the free energy shows a more peculiar behavior. In the limit of and , can be approximated by the formula , where is a positive exponent. Thus, differentiating (4) with respect to , one obtains the entropy and next, by differentiating it with respect to and one obtains the following formulae for the critical specific heat, , and , valid for the area below the line of classical phase transitions, denoted in the inset to Fig. 1f as “Ordered phase”:
| (5) |
| (6) |
By assuming to be the sum of and (5):
| (7) |
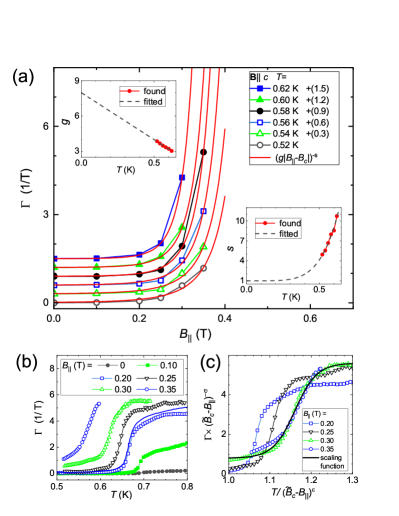
and treating , and as fitted parameters, a good description of the experimental dependence for (thick solid red line in Fig. 1d) was achieved. The best fit value T seems to be reasonable, because for the magnetically ordered terbium metal [24] and alloys [25], the values T were reported. As Fig. 1c shows, T has no influence on , because for these values, all curves overlap below . Thus, it was assumed that remains constant for T, then for larger , it falls down due to destruction of the long range order of Tb3+ magnetic moments, and for T, becomes unmeasurably small. We found that the “sinusoidal” anomaly of the experimental curve, visible in Fig. 1d between 0.25 and 0.35 K, is not a physical effect, because it is the same for all T and appears also for samples of other composition. Thus, it was interpreted as an apparatus effect and eliminated from the experimental curves for T by subtracting from them the difference between the experimental and theoretical (red solid line in Fig. 1d) curves for the range mK. The corrected functions (for T) denoted as are plotted in Fig. 1e together with the curves (7) fitted to them (red solid lines) by taking T and fitting and . Next, assuming the maxima of the functions to correspond to the phase transition temperature, we constructed the – phase diagram, Fig. 1f. We found that the power function: 0.681 , with , , and given in T describes the experimental phase transition line very well and gives the hypothetical quantum critical field value T. With this value, the phase transition line for can be described by the typical critical dependence: , with K, , and given in T. Using this in the definition of , we obtained that the values correspond to . This result is essential, because usually one assumes the critical behavior to appear for , thus, the behaviors observed in our experiments should be extrapolated to smaller values to get actual critical behaviors of the studied system.
Plots of the found and values as a function of (inset to Fig. 1b) can be approximated by, drawn with the black solid lines, the field independent value and the function with J/(mol K), , and given in T. Comparing the function and (5) we get:
| (8) |
The functions for different were estimated by substituting into (1) the functions determined and the derivatives, approximated by the difference quotients, calculated basing on the measured functions, Fig. 2. For T, for which was not measured, was estimated as the average of the values calculated for and 0.35 T. The results are shown in Fig. 3b. In principle, having for different , it was possible to calculate the entropies and . However, was measured for a few values only and hence, the approximation of with the difference quotients was rough. Thus, this method of determining was less accurate and only one of such determined functions, for T, is shown in Fig. 3b as an example. The functions were converted into functions, shown in Fig. 3a for several fixed values. It was found that they can not be described by the formula (6) but they can be approximated by formula:
| (9) |
The functions (9) fitted to the experimental data for different are plotted in Fig. 3a with red solid lines and the and parameters of the best fit lines are plotted as a function of in the insets to Fig. 3a. As the dashed lines show, (i) the function can be approximated by: , for given in K, which, when extrapolated to K, gives the value, consistent with the theoretical prediction (6), and (ii) can be approximated by the straight line: , for T given in K, which allows to assume the parameter appearing in (6) to be . Thus, based on (8) and (6), using the determined , , and parameters, and taking into account experimental uncertainties, we obtain: and:
| (10) |
By assuming that the we deal with the 3D magnetic system () and that takes a value between 1/2 (found in the molecular field model) and 0.715 (found for the 3D Heisenberg model) we find the dynamical critical exponent of the studied system to be .
Seeking for a based on scaling argument for the quantum character of the transition analyzed, we based on the observation [26], that for some systems, near QCP with the critical field , scales with , with a constant . Thus, we assumed that at quantum criticality, is a generalized homogeneous function relative , which fulfills the relation with a constant and being a scaling function. If the scaling occurs, it should be possible to find such , , and that in the critical region, the plots versus for different values collapse onto a single curve, . As Fig. 3c shows, such a collapse of the curves for and 0.35 T was achieved by taking T, and . Practically zero value confirms the scaling assumed in [26]. The data sets for T do not follow the scaling curve, which suggests that these field values are below the quantum critical region. The T value found from scaling is slightly smaller than that found from extrapolation of the phase transition line shown in Fig. 1f, which suggests that the real QCP is located between 0.57 an 0.6 T.
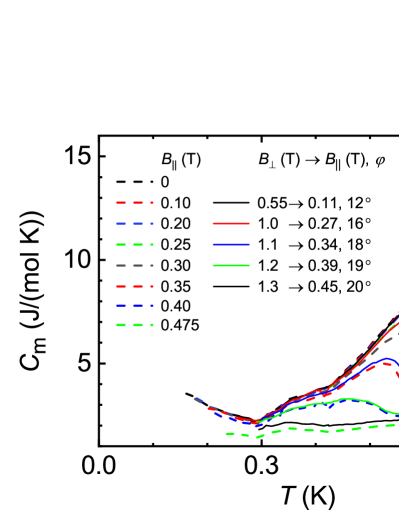
In order to study influence of the magnetic field directed perpendicularly to the easy magnetization axis, , on the observed magnetic phase transition, temperature dependence of the specific heat, , was measured for several fixed values of the field applied intentionally perpendicularly to the axis. Next, the non-phonon contribution to it, , was determined by subtracting from the measured , i.e., in the same way as for the case of . As Fig. 4 shows, , applied intentionally perpendicularly to the axis, influences the transition weaker than does and shifts the transition point, identified as the maximum, towards lower temperatures. However, it must be taken into account that in the PPMS system used, the calorimeter is suspended by 8 thin wires and in a torque is applied to the sample. As the result, the sample tilts and the axis is no longer perpendicular to the applied field. Thus, we analyzed whether the shift of the transition can be attributed to tilting of the sample only, i.e., we assumed that the perpendicular to the axis component of the field has no influence on the transition and only the parallel component, appearing in the result of tilting, affects the transition. Then, based on the phase diagram constructed for , presented in Fig. 1f, we determined what , i.e. what tilting angle, would be necessary to cause the observed shift of the transition. As indicated in the legend of Fig. 4, the expected tilt angles are quite probable and grow monotonically up to . Thus, we find the assumption, that the transition is insensitive to , to be well-grounded.
V Conclusions
Based on the detailed studies of specific heat, , and magnetization, , below 1 K, we found a magnetic phase transition in TbAl3(BO3)4, which shifts to lower temperatures with increase of magnetic field , parallel to the easy magnetization axis. Determined behaviors of both and the Grüneisen ratio, , as a function of (especially scaling of the latter for T), as well as dependence of on are characteristic of systems, in which the classical phase transition line is influenced by QF and ends at QCP. Vanishing of the nuclear specific heat for T confirms that destroys the long range magnetic order. The value of the dynamical critical exponent was assessed to . However, a physical nature of the transition is not clear. The interpretation that this is the transition to the ferromagnetic order of Tb3+ magnetic moments is the most natural, intuitive, and supported by the studies of . However, such a classical transition should be smeared and shifted to higher by , while we observe the opposite effect. We attribute this to QF, which dominate the behavior of the system and destroy the long range order, i.e., we suppose the transition to have quantum character. On the other hand, the behavior observed would be consistent with the behavior of the transition to an antiferromagnetic phase, but the studies of , e.g., lack of a metamagnetic transition, linear dependence of on , and reaching saturation magnetization nearly equal to the magnetic moment of free Tb3+ ions in small T, contradict this interpretation. Also the possibility, that the transition is not a magnetic one but related to any other kind of ordering, e.g., a complex multipolar ordering, and the ordering of the Tb3+ moments is a “side effect” only, related to strong magneto-electric effect present in these materials, can not be ruled out. Generally, a physical mechanism proposed must predict not only the decrease of the transition point with increase in but the also the other unusual behaviors, like and divergence of , found in the present studies. To elucidate the physical mechanism responsible for the transition, detailed neutron diffraction studies are necessary but due to the low transition temperature and the presence of boron, very highly absorbing neutrons, such studies would be very difficult, though possible [11].
Acknowledgements.
This work was supported partially by the National Science Centre, Poland, under project No. 2018/31/B/ST3/03289.References
- Sachdev [2011] S. Sachdev, Quantum Phase Transitions (Cambridge University Press, 2011).
- Gegenwart et al. [2008] P. Gegenwart, Q. Si, and F. Steglich, Quantum criticality in heavy-fermion metals, Nature Phys. 4, 186 (2008).
- Zhu et al. [2003] L. Zhu, M. Garst, A. Rosch, and Q. Si, Universally diverging Grüneisen parameter and the magnetocaloric effect close to quantum critical points, Phys. Rev. Lett. 91, 066404 (2003).
- Garst and Rosch [2005] M. Garst and A. Rosch, Sign change of the Grüneisen parameter and magnetocaloric effect near quantum critical points, Phys. Rev. B 72, 205129 (2005).
- Kadowaki et al. [2018] H. Kadowaki, H. Takatsu, and M. Wakita, Dimensional change of the quadrupole order in pseudospin- pyrochlore magnets under magnetic field in the [111] direction, Phys. Rev. B 98, 144410 (2018).
- Ryll et al. [2014] H. Ryll, K. Kiefer, C. Rüegg, S. Ward, K. W. Krämer, D. Biner, P. Bouillot, E. Coira, T. Giamarchi, and C. Kollath, Magnetic entropy landscape and Grüneisen parameter of a quantum spin ladder, Phys. Rev. B 89, 144416 (2014).
- Gálisová and Strečka [2015] L. Gálisová and J. Strečka, Magnetic Grüneisen parameter and magnetocaloric properties of a coupled spin-electron double-tetrahedral chain, Phys. Lett. A 379, 2474 (2015).
- Wolf et al. [2011] B. Wolf, Y. Tsui, D. Jaiswal-Nagar, U. Tutsch, A. Honecker, K. Removic-Langer, G. Hofmann, A. Prokofiev, W. Assmus, G. Donath, and M. Lang, Magnetocaloric effect and magnetic cooling near a field-induced quantum-critical point, Proc. Natl. Acad. Sci. U. S. A. 108, 6862 (2011).
- Bedarev et al. [2015] V. A. Bedarev, M. I. Paschenko, M. I. Kobets, K. G. Dergachev, E. N. Khatsko, S. L. Gnatchenko, A. A. Zvyagin, T. Zajarniuk, A. Szewczyk, M. U. Gutowska, L. N. Bezmaternykh, and V. L. Temerov, Low-temperature magnetic phase transition in aluminum borate TbAl3(BO3)4, Low Temp. Phys. 41, 534 (2015).
- Liang et al. [2011] K.-C. Liang, R. P. Chaudhury, B. Lorenz, Y. Y. Sun, L. N. Bezmaternykh, V. L. Temerov, and C. W. Chu, Giant magnetoelectric effect in HoAl3(BO3)4, Phys. Rev. B 83, 180417(R) (2011).
- Zhang et al. [2019] H. Zhang, S. Liu, C. S. Nelson, L. N. Bezmaternykh, Y.-S. Chen, S. G. Wang, R. P. S. M. Lobo, K. Page, M. Matsuda, D. M. Pajerowski, T. J. Williams, and T. A. Tyson, Structural features associated with multiferroic behavior in the RX3(BO3)4 system, J. Phys. Condens. Matter 31, 505704 (2019).
- Liang et al. [2012] K.-C. Liang, R. P. Chaudhury, B. Lorenz, Y. Y. Sun, L. N. Bezmaternykh, I. A. Gudim, V. L. Temerov, and C. W. Chu, Magnetoelectricity in the system Al3(BO3)4 ( = Tb, Ho, Er, Tm), J. Phys.: Conf. Ser. 400, 032046 (2012).
- Leonyuk and Leonyuk [1995] N. Leonyuk and L. Leonyuk, Growth and characterization of , Prog. Cryst. Growth Charact. Mater. 31, 179 (1995).
- Eremin et al. [2016] E. V. Eremin, N. V. Volkov, V. L. Temerov, and I. A. Gudim, Specific features of magnetic properties of Tb1-xHoxAl3(BO3)4 aluminoborates, Physics of the Solid State 58, 660 (2016).
- Gudim et al. [2010] I. A. Gudim, E. V. Eremin, and V. L. Temerov, Flux growth and spin reorientation in trigonal Nd1-xDyxFe3(BO3)4 single crystals, J. Cryst. Growth 312, 2427 (2010).
- Martin [1991] C. A. Martin, Simple treatment of anharmonic effects on the specific heat, J. Phys. Condens. Matter 3, 5967 (1991).
- Wieckowski et al. [2012] J. Wieckowski, M. U. Gutowska, A. Szewczyk, S. Lewinska, K. Conder, E. Pomjakushina, V. P. Gnezdilov, and S. L. Gnatchenko, Thermal properties of layered cobaltites BaCo2O5.5 ( Y, Gd, and Tb), Phys. Rev. B 86, 054404 (2012).
- Lewińska et al. [2019] S. Lewińska, A. Szewczyk, M. U. Gutowska, J. Wieckowski, R. Puzniak, R. Diduszko, A. Reszka, B. J. Kowalski, Y. Kharchenko, and J. Molenda, Magnetic susceptibility and phase transitions in , Phys. Rev. B 99, 214440 (2019).
- Dobretsova et al. [2014] E. A. Dobretsova, E. Y. Borovikova, K. N. Boldyrev, V. S. Kurazhkovskaya, and N. I. Leonyuk, IR spectroscopy of rare-earth aluminum borates Al3(BO ( Y, Pr – Yb), Opt. Spectrosc. 116, 77 (2014).
- Vojta [2003] M. Vojta, Quantum phase transitions, Rep. Prog. Phys. 66, 2069 (2003).
- Santini et al. [2009] P. Santini, S. Carretta, G. Amoretti, R. Caciuffo, N. Magnani, and G. H. Lander, Multipolar interactions in f-electron systems: The paradigm of actinide dioxides, Rev. Mod. Phys. 81, 807 (2009).
- Sivardière and Blume [1972] J. Sivardière and M. Blume, Dipolar and quadrupolar ordering in s=3/2 Ising systems, Phys. Rev. B 5, 1126 (1972).
- Lounasmaa and Roach [1962] O. V. Lounasmaa and P. R. Roach, Specific heat of terbium metal between 0.37 and 4.2 K, Phys. Rev. 128, 622 (1962).
- Heltemes and Swenson [1961] E. C. Heltemes and C. A. Swenson, Nuclear contribution to the heat capacity of terbium metal, J. Chem. Phys. 35, 1264 (1961).
- Vijayaraghavan et al. [1977] R. Vijayaraghavan, K. Shimizu, J. Itoh, A. K. Grover, and L. C. Gupta, Hyperfine field studies in magnetically ordered samarium and terbium alloys, J. Phys. Soc. Jpn. 43, 1854 (1977).
- Gegenwart [2017] P. Gegenwart, Classification of materials with divergent magnetic Grüneisen parameter, Philos. Mag. 97, 3415 (2017).