Unsteady rheo-optical measurements of uniaxially extending liquid polymers
Abstract
The viscoelastic behavior of liquid polymers changes depending on the microstructure of the polymer chains. To investigate the unsteady structural changes induced by polymer chain morphology under stress, we develop a simple rheo-optical technique combining a high-speed polarization camera and dripping-onto-substrate capillary breakup extensional rheometry (CaBER-DoS), which uniaxially extends and aligns the polymer along the stress direction. Using this technique, the viscoelastic behavior and birefringence field of an extending liquid polymer are simultaneously measured. Unlike the conditions that occur under shear-stress loading with a rotational rheometer, this technique provides a linear relation between birefringence and extensional stress. The measurements reflect the structural change in a flexible polymer (a mixed solution of PEO and CNCs) in the temporal evolution of the birefringence and orientation angle, which is a measure of the orientation state and coil-stretch transition of a polymer chain. Remarkably, within the elasto-capillary regime, the measured birefringence remains constant with a constant orientation state, while the Weissenberg number gradually increases, which provides experimental evidence of the coil-stretch transition of the polymer chain under constant extensional stress loading.
I Introduction
For a liquid polymer, the stress and velocity distributions of the fluid are complicated owing to the effects of flow resistance and apparent viscosity induced by the influence of the microstructure of polymer chains. To investigate the phenomena occurring in liquid polymers, rheo-optical techniquesNoto et al. (2020); Philippoff (1956); Lodge (1955, 1956); Shikata, Dahman, and Pearson (1994); Gortemaker et al. (1976); Yevlampieva, Pavlov, and Rjumtsev (1999); Meyer et al. (1993); Chow and Fuller (1984); Ito, Yoshitake, and Takahashi (2016) involving simultaneous rheometric and optical measurements are often used. A variety of rheo-optical techniques combining a rotational rheometer, which applies deformation to the fluid with a moving wall, and birefringence measurement have been reported. With these techniques, changes in microstructure, indicated by the orientational state and coil-stretch transition (the degree of stretch from the coil state) of polymer chains, can be inferred from birefringence measurements. By matching results at different scales measured separately by rheometry and an optical method, a comprehensive evaluation of the phenomena occurring in liquid polymers can be performed. While there have been many studies of the microstructural behavior of liquid polymers under “shear” conditionsIto, Yoshitake, and Takahashi (2016); Haward et al. (2019); Zhao, Shen, and Haward (2016); Haward et al. (2012); Iwata et al. (2019), there have been few reports on changes in the microstructure under extensional conditions.
To investigate polymer chain morphology under coil-stretch transition, the Weissenberg number , which is a dimensionless number representing the ratio of elasticity and viscosity, is often used as an indicator. However, evidence that is in fact an indicator of coil-stretch transition is limited to the results of numerical calculationsEntov and Hinch (1997); Mathues et al. (2018), which depend on the type of constitutive model chosen Sur and Rothstein (2018); McKinley (2005); Prabhakar, Prakash, and Sridhar (2006); Doyle et al. (1998); Doyle, Shaqfeh, and Gast (1997). On the other hand, there have been few reports of experimental investigations of the changes in molecular structure of polymer chains under extensional conditions. LodgeLodge (1955, 1956) and PhilippoffPhilippoff (1956) proposed to measure the flow-induced birefringence of highly viscoelastic solutions reeled in by a draw wheel. Rothstein and McKinleyRothstein and McKinley (2002) developed a method for combined measurements by a filament stretching rheometer and a birefringence measurement system for dilute solutions undergoing extension. These techniques enable investigation of the effect of extensional stress on the flow-induced birefringence of liquid polymers. Nevertheless, to demonstrate the validity of the stress-optic lawNoto et al. (2020); Janeschitz-Kriegl (2012); Ryu, Inoue, and Osaki (1996); Inoue, Okamoto, and Osaki (1991) for a flowing polymer fluid, it is important to simultaneously measure the birefringence and the orientational state of the polymer chain under extensional stress loading. For this purpose, it is necessary to establish a simple approach to the investigation of the above-mentioned complex problems through birefringence measurements and develop a simple rheo-optical measurement method using a high-speed polarization camera.
The purpose of this study is to develop a simple system for examining changes in microstructure (i.e., the orientational state and coil-stretch transition of polymer chains) of liquid polymers under extensional stress loading with the birefringence measurements. For this purpose, we have chosen dripping-onto-substrate capillary breakup extensional rheometry (CaBER-DoS)Dinic and Sharma (2020); Dinic, Jimenez, and Sharma (2017); Sur and Rothstein (2018); McKinley (2005); McKinley and Tripathi (2000); Clasen et al. (2006) as the means of applying the extensional stress. Unlike a rotational rheometer, which measures the shear viscosity, CaBER-DoS is a noncontact method that measures the extensional viscosity from the radius of the liquid filament, which decays as the fluid is extended. In this paper, we report the results of an investigation of the chain morphology of a polymer chain in a stretched flow field, where elasticity becomes dominant. Selection of the elastic-dominant regime, i.e., the elasto-capillary (EC) regime is particularly important when calculating viscoelastic properties such as the extensional viscosity, strain, and relaxation time. Importantly, within the EC regime, a uniaxial extensional stress is applied to the fluid, allowing the assumption of uniform flow without shear stress to be madeMcKinley (2005). Therefore, the polymer chains inside the fluid are assumed to be oriented in the extensional direction and uniformly aligned, which should be experimentally demonstrable by the birefringence measurements. Note that, according to the theory of CaBER-DoS, three regimes, dominated by inertia, elasticity, and viscosity, respectively, can be defined on the basis of the temporal decay of the radius of the liquid filamentSur and Rothstein (2018); McKinley (2005); Entov and Hinch (1997); Wagner, Bourouiba, and McKinley (2015); Prabhakar, Prakash, and Sridhar (2006). Thus, the most important requirement for our rheo-optical method is to be able to simultaneously measure the changes of the three regimes in CaBER-DoS and the birefringence, which reflects the morphology of the polymer chain. To do this, a high-speed polarization camera, which enables us to obtain polarization information (i.e., the flow-induced birefringence and the orientation angle), is used.
II Methods
In this section, the mechanism of flow-induced birefringence of a polymer and the measurement principle of the rheo-optical technique that uses both a high-speed polarization camera and the CaBER-DoS system are described.
II.1 Flow-induced birefringence of polymer
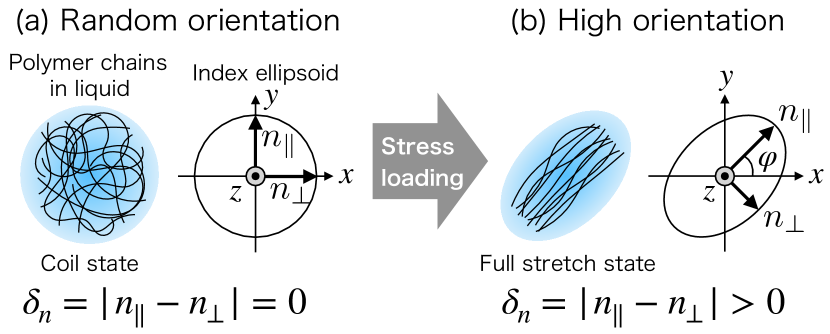
The flow-induced birefringence of polymer chains is a key indicator of chain morphology. The flow-induced birefringence that appears due to stress loading is proportional to the principal stress difference in what is known as the stress-optic law Noto et al. (2020); Janeschitz-Kriegl (2012); Ryu, Inoue, and Osaki (1996); Inoue, Okamoto, and Osaki (1991):
| (1) |
where and are the refractive indices for polarizations respectively parallel and perpendicular to the orientation of the polymer chain and is the stress-optic coefficient. In our experimental setup using birefringence measurements, the intensity of the flow-induced birefringence can be measured from the polarization of the light transmitted through the liquid polymer.
When there is no stress loading, polymer chains in the liquid have random orientations in the coil state, and thus flow-induced birefringence does not occur [see Fig. 1(a)]. When stress is applied to the liquid polymer, the polymer chains become highly aligned by stretching, resulting in increased birefringence [see Fig. 1(b)]. In this paper, the orientation angle is defined as the tilt angle of the polymer chain with respect to the horizontal () direction [the vertical () direction is the extensional direction].
II.2 Rheo-optical technique with high-speed polarization camera
We employed a birefringence measurementsBass (2010); Rastogi (2015) to determine the phase retardation of polarized light passing thorough polymer chains under stress loading. Figure 2 shows how the polarization state of light changes when it is transmitted through a birefringent object.
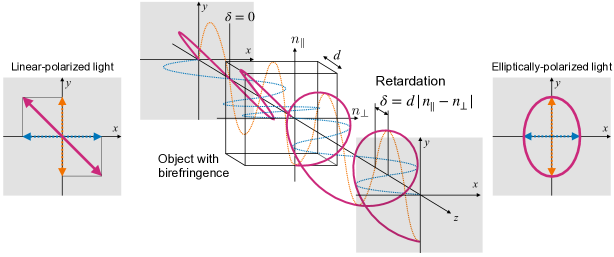
The incident electromagnetic wave, which is represented by the red curve, consists of two orthogonal components, which are represented by the blue and orange curves. When both components are in phase, the retardation is zero, and thus the incident light is linearly polarized. When light is transmitted through a birefringent object (the liquid polymer) under stress loading, the propagation speed of each component wave differs, since the refractive indices and are different from one another. As a result, the phases of the component differ, and the values of the retardation change. The retardation is given by the integral of the birefringence over infinitesimal volume elements within the object along the optical axis (the direction):
| (2) |
We propose a simple calibration technique that combines a CaBER-DoS system and a high-speed polarization camera based on the theory of birefringence measurement (CRYSTA PI-1P, Photron Ltd.) (see Fig. 3). Our concept can be realized by using just a simple setup: a target sample (liquid polymer) between the polarization camera and an LED light source.
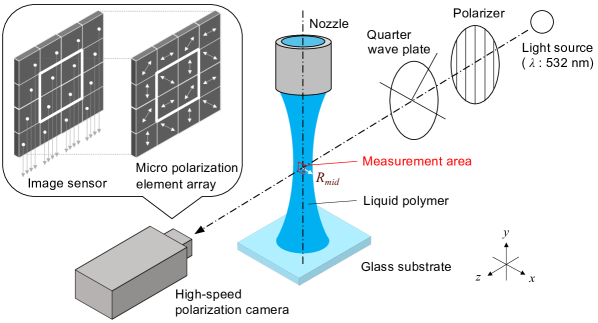
In the CaBER-DoS system, a fluid dispensing device with a syringe pump (Pump 11 Elite, Harvard Apparatus Ltd.) is used to deliver a drop of the polymer solution at a relatively low flow rate onto a glass substrate placed at a fixed distance below the nozzle exit. As the droplet slowly drips from the nozzle, a filament is formed. By measuring the minimum necking radius of the filament, which becomes thinner as it extends, we can calculate the extensional viscosity, strain, relaxation time, etc. When utilizing the CaBER-DoS system, we can assume that the orientation of all chain polymers is uniform, because the stress exerted along the optical axis is uniform. Therefore, the retardation over the optical depth of the measurement object in Eq. (2) can be rewritten as follows:
| (3) |
This equation is valid for our technique, although it is generally invalid for experiments under shear stress loading. Note that it is valid only when the incident polarized light passes through the center of the filament, in which case we can rewrite in our setup.
The high-speed polarization camera is capable of capturing photoelastic phenomena with a pixelated polarizer array at a frame rate of up to frames/s. The array consists of four adjacent polarizers () arranged in four different orientations. The instantaneous retardation and the instantaneous orientation angle can be calculated from the light intensities captured by these four polarizers ( at 0∘, at 45∘, at 90∘, and at 135∘)Onuma and Otani (2014):
| (4) | ||||
| (5) |
where is the wavelength of the incident light. In this experiment, the incident light was emitted from a green LED with a wavelength of 520 nm and was polarized by a circular polarization sheet consisting of a polarizer and a quarter-wave plate. Note that the incident light must be directed straight into the camera.
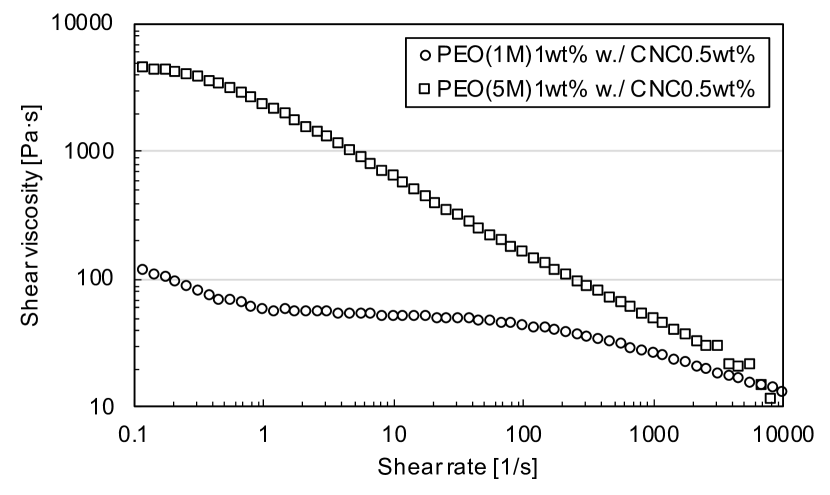
In this study, a mixed solution of polyethylene oxide [PEO, 1 wt. % concentration in ultrapure water, molecular weight , Sigma-Aldrich Co. LLC] and cellulose nanocrystals (CNCs, 0.5 wt. %, Cellulose Lab Inc.) was used as the liquid polymer. The solvents were stirred in ultrapure water for 24 h with a hot stirrer, with the preset temperature and speed of revolution set to 80 ∘C and 1000 rpm, respectively. Note that the mixed solutions was a non-Newtonian fluid exhibiting shear-thinning behavior (see Fig. 4).
III Results and discussion
We divide this section into three subsections. The first reports the visualized phase retardation field of the extending liquid polymer filament, captured by the high-speed polarization camera. The second reports the temporal evolution of phase retardation and orientation angle. The third presents the flow-induced birefringence.
III.1 Visualized phase retardation field of extending liquid polymer filament
The visualization results for the phase retardation field of the extending liquid polymer filament captured with the high-speed polarization camera are discussed here. Figure 5 shows the temporal evolution of the filament, using the raw images captured by the high-speed polarization camera.
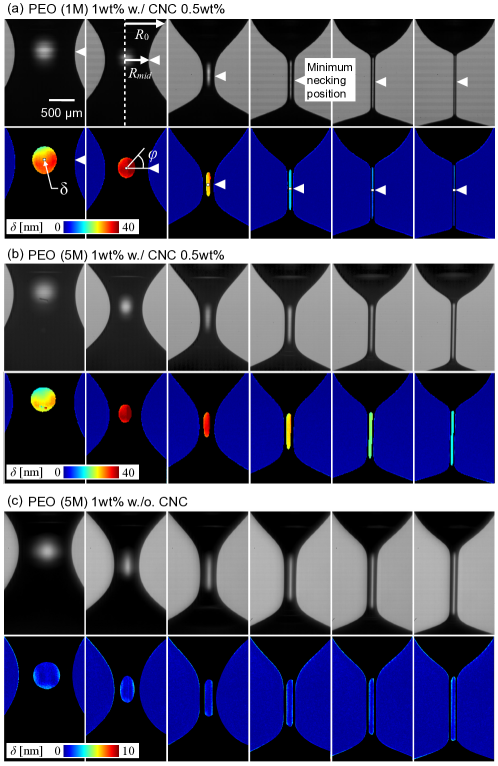
The position of the minimum necking radius was also changing continually during the measurement, and could be tracked using our field measurement technique. The retardation field was visualized by converting the intensity value at each pixel position in the raw images to the corresponding retardation value.
It was confirmed that the retardation appeared differently as the molecular weight of the PEO was changed [Figs. 5(a) and 5(b)]. This was due to the difference in the intensity of stress loading, which depends on the molecular structure and viscoelasticity of a polymer. Moreover, in the case of the PEO solution without CNCs [Fig. 5(c)], no retardation could be observed. Thus, we argue that the retardation in mixed solutions of PEO and CNCs is induced by microstructural changes in the CNCs, since the induction of birefringence by CNCs is due to their chain structureKádár, Spirk, and Nypelö (2021); Calabrese, Haward, and Shen (2021); Hasegawa, Horikawa, and Shikata (2020); Arai, Horikawa, and Shikata (2018); Chowdhury, Peng, and Youngblood (2017); Cranston and Gray (2008).
From the retardation field, as the stretching continued, the intensity of phase retardation also changed, i.e., it increased in the early stages and decreased thereafter. This is because phase retardation is proportional not only to the principal stress difference but also to the optical thickness, i.e., the diameter of the liquid polymer filament, as indicated in Eq. (3). For an extending liquid filament in a CaBER-DoS system, while the principal stress differences tend to increase, the diameter of the filament decreases. Therefore, it can be predicted that retardation will decrease owing to the reduction in optical thickness.
III.2 Phase retardation and orientation angle
We now consider the measurement results for the phase retardation and orientation angle of the extending liquid polymer filament. To investigate these quantitatively, we introduced a measurement area ( pixels, shown by the white box in Fig. 5) on the axis of symmetry of the filament. This measurement area migrated together with the minimum necking radius. The values of the retardation and orientation angle were obtained as spatial averages over the measurement area. Figure 6 shows the results for radius ratio, retardation, and orientation angle over time for two different molecular weights of PEO.
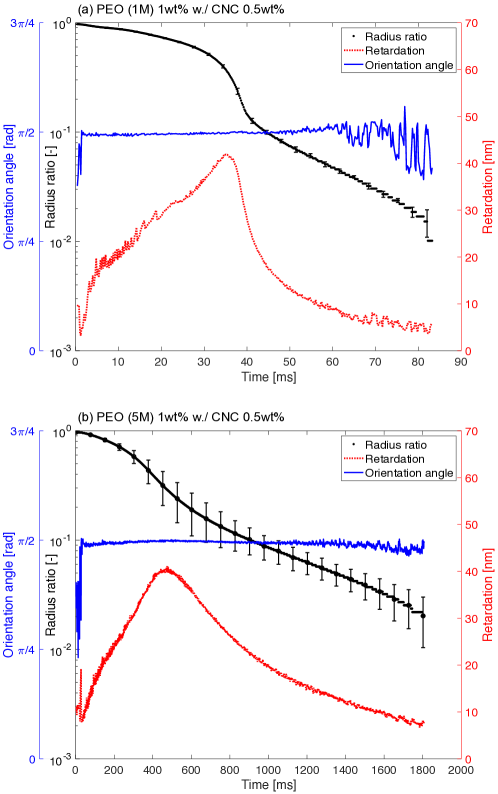
The measurement results for the temporal evolution of the radius ratio (the black plots in Fig. 6) can be seen to decrease with time. The elapsed time for the filament to pinch off increases as the molecular weight of PEO increases. In the elasto-capillary (EC) regime, which is an important indicator when determining the viscoelastic properties, the radius decays exponentially with time Sur and Rothstein (2018); McKinley (2005); Entov and Hinch (1997); Wagner, Bourouiba, and McKinley (2015); Prabhakar, Prakash, and Sridhar (2006):
| (6) |
where is the initial radius, and , , and are the elastic modulus, surface tension, and relaxation time of the fluid, respectively. Moreover, the duration of the EC regime is the same as the duration of the period when the strain rate is constant:
| (7) |
Knowing this, we can determine the EC regime of the mixed solutions of PEO and CNCs. Plots of the radius ratio for common viscoelastic fluids have an inflection point corresponding to the transition from the inertio-capillary (IC) regime to the EC regime Sur and Rothstein (2018); McKinley (2005); Entov and Hinch (1997); Wagner, Bourouiba, and McKinley (2015); Prabhakar, Prakash, and Sridhar (2006). The results for the mixed solutions of PEO and CNCs (Fig. 6) clearly show the characteristics of the EC regime. The plots of the radius ratio for the mixed solutions both exhibit an inflection point, and the temporal images [Fig. 5(b)] clearly show that the filament is cylindrical. The duration of the EC regime for the mixed solutions of PEO and CNCs of different molecular weights are 46–78 ms for and 750–1730 ms for .
The blue curves in Fig. 6 show the results for the orientation angle of the polymer chains. Remarkably, these results confirm that the orientation angle remains constant at , which means that the polymer chains have become highly aligned along the extensional direction of the filament, except during the early stage (part of the IC regime) and the final stage [part of the visco-capillary regime (VC) regime]. Note that the values of the orientation angle oscillate in the VC regime owing to the lack of spatial resolution. The relationship between the flow-induced birefringence and the orientation angle is expressed by the following equationOkada, Urakawa, and Inoue (2016):
| (8) |
where is the intrinsic birefringence, which is a material constant for the orientational birefringence of polymers. Importantly, within the EC regime, the birefringence can be treated as intrinsic birefringence, because the orientation angle remains constant at . In such situations, the liquid polymer filament is assumed to be an axially uniform cylindrical column of constant radius , with a free-slip boundary condition, which does not induce a radial shear flow McKinley (2005); McKinley and Tripathi (2000). Thus, the principal stress difference in Eq. (1) is equal to the normal stress, i.e., the uniaxially extensional stress , and the stress-optic law within the EC regime can be written as follows:
| (9) |
As a result, in our experiment, polymers were oriented along the extensional direction. Thus, it is confirmed that the CaBER-DoS system provides sufficient extensional stress to orient the polymer chains.
Each of the red plots of retardation in Fig. 6 exhibits a maximum point, which is at the same locations as the inflection point in the corresponding plot of the radius ratio. Thus, the positions of these maxima in the retardation plots indicate the locations where the IC regime switches to the EC regime, since the results for the retardation are affected by the optical thickness [see Eq. (9)]. In the next subsection, we describe a more detailed validation oft the change in birefringence that is not affected by the decay.
III.3 Flow-induced birefringence within coil-stretch transition
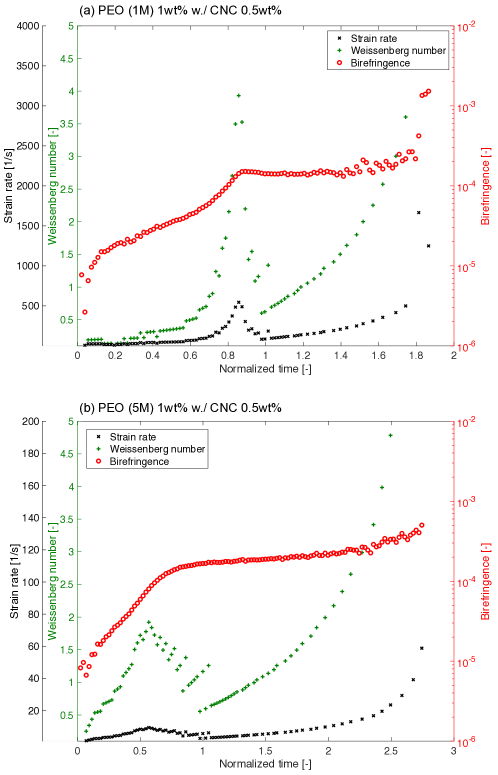
We now analyze the results for the flow-induced birefringence measured with the high-speed polarization camera for an extending liquid polymer. When all the polymer chains are aligned with the optical axis, the flow-induced birefringence due to the polymer chain morphology can be derived from the measured retardation [Eq. (3)]. Figure 7 show plots of the birefringence vs normalized time (normalized by the transition time from the IC to the EC regime). Here, the normalized times within the EC regime for the PEO with molecular weights and are from 1 to 1.7 and from 1 to 2.3, respectively. These results confirm that the birefringence increases exponentially within the IC regime, has a constant value within the EC regime, and increases again within the VC regime. Moreover, the plot of birefringence has an inflection point at the transition from the IC to the EC regime. Within the EC regime, the variations of the birefringence with respect to the overall range are and for PEO with molecular weights and , respectively. The fact that the value of birefringence remains constant within the EC regime is consistent with the theoretical basis of CaBER-DoS, according to which the uniaxial extensional stress is constant within the EC regime Sur and Rothstein (2018); McKinley (2005); Entov and Hinch (1997); Wagner, Bourouiba, and McKinley (2015); Prabhakar, Prakash, and Sridhar (2006).
We believe that there are two reasons why the temporal evolution of the birefringence shows a similar trend to that of the extensional stress. The first is that, within the EC regime, the birefringence is proportional to the extensional stress. This is evident from the fact that Eq. (9) holds under conditions where the birefringence can be measured as the intrinsic birefringence and only a uniaxial extensional stress is exerted on the filament within the EC regime [as follows from the derivation of Eq. (9) in Sec. III.2]. The second reason is that, from the IC to the EC regime, the tendency of the birefringence matches that of the capillary pressure (i.e., the extensional stress) calculated through numerical simulation by Mathues et al.Mathues et al. (2018), who argued that the transition from the IC to the EC regime can be explained by the temporal evolution of the stress contributions. Within the IC regime, the polymer chains remain in a coiled state, and the inertial acceleration balances the capillary pressure in the fluid column, which results in the strong stretching of the chains in the coiled state. Immediately after this, the elastic stress rises quickly to balance the capillary pressure, and the inertial contribution drops to a negligible value. The inflection point of the capillary pressure occurs when the contributions of inertial and elastic forces are swapped at the transition from the IC to the EC regime. As a result, upon entry into the EC regime, the growth of the uniaxial deformation of the chains suddenly slows down, which results in the formation of an equilibrium state of the capillary pressure.
To verify whether the birefringence corresponds to the polymer chain morphology, we introduce the Weissenberg number as an indicator. It is known that for a polymer coil to stretch, must at least exceed a critical value of Sur and Rothstein (2018); McKinley (2005); Prabhakar, Prakash, and Sridhar (2006). In this study, we calculate as the product of the strain rate and the relaxation time . The latter is constant McKinley (2005), and so the curve of has the same shape as that of the strain rate. Figure 7 show that remains larger than the critical value of until the pinching off of the liquid polymer filament, while the strain rate is constant within the EC regime. Moreover, it is clear that each plot of has two turning points: a maximum followed by a minimum. The normalized times at the first turning point are 0.86 and 0.57 for the PEOs with molecular weight and , respectively, both of which are within the IC region. For both PEOs, the second turning point of , which is at a value greater than , is located at the transition from the IC to the EC regime. The existence of two turning points, which cause the plot of to have a mountainous shape from the IC to the EC regime, has also been reported for other polymer solutions Sur and Rothstein (2018); Prabhakar, Prakash, and Sridhar (2006). From a comparison of the experimental results for the birefringence and , we can confirm that the birefringence becomes constant at the point of transition from the IC to the EC regime, where the data show that the polymer chain gradually becomes stretched from the coiled state. Therefore, we argue that the measured birefringence can be used as an indicator to investigate the coil-stretch transition in our rheo-optical technique that uses both a high-speed polarization camera and a CaBER-DoS system.
IV Conclusion
To investigate unsteady changes in the microstructure of liquid polymers under extensional stress loading, we have developed a simple rheo-optical system based on CaBER-DoS and birefringence measurements. The CaBER-DoS system was used to uniaxially extend the liquid polymer under extensional stress loading, and we successfully measured the phase retardation field of a liquid polymer (a mixed solution of PEO and CNCs) using a high-speed polarization camera.
As the molecular weight of the polymer was changed, the visualized retardation changed in appearance, owing to differences in the intensity of stress loading. By performing measurements in a defined area of the retardation field, we confirmed that the plot of retardation vs time exhibits a maximum point, which is at the same location as an inflection point in the plot of the radius ratio corresponding to the transition from the IC to the EC regime. From this, we argue that the position of the maximum point of the retardation indicates where the IC regime switches to the EC regime.
According to the theoretical basis of CaBER-DoS, the direction of the extensional stress and the orientation of the polymer chain are the same within the EC regime. To verify this, a simultaneous measurement of the orientation angle of the polymer chains was carried out, and it was confirmed that the orientation within the EC regime is the same as the extensional direction. Thus, we have proved that our system enables measurement of flow-induced birefringence of polymer solutions in the case where the polymer is oriented in the extensional direction.
The plot of the temporal evolution of the flow-induced birefringence of the extending liquid polymer also exhibits an inflection point at the transition from the IC to the EC regime. We confirmed that there is an exponential increase within the IC regime and a constant value within the EC regime; the variations in the birefringence within the EC regime with respect to the overall range are and for PEOs with molecular weights and , respectively. This trend matches that of the uniaxially extensional stress obtained from numerical simulations in the literature and is consistent with the theoretical behavior according to which the extensional stress is constant within the EC regime. Moreover, at the same point of transition from the IC to the EC regime, the data show that the polymer chain gradually becomes stretched from its coiled state. Thus, we argue that the measured birefringence can be used as an indicator in investigations of the coil-stretch transition.
Acknowledgements.
This work was supported by the Japan Society for the Promotion of Science, KAKENHI Grant Nos. 17H01246, 20H00223, 19K23483, and 20K14646. We thank D. Yamada and Y. Matsumoto for support with the experiments.Author declarations
Conflict of Interest
The authors have no conflicts to disclose.
Data availability
The data that support the findings of this study are available from the corresponding authors upon reasonable request.
*
Appendix A Xanthan gum solution
We believe that the difficulties in orienting polymer chains of polyethylene oxide (PEO) arise because PEO is more flexible than a semirigid polymer such as xanthan gum (XG) Pereira, Andrade, and Soares (2013). Thus, the fact that the polymer chains of PEO were oriented by our measurement technique could probe its generalizability. To investigate the ease of orientation of a semirigid polymer, the same experiment as for PEO was carried out for XG solutions with various concentrations. In this experiment (see Fig. 8), solutions of XG (0.3–0.7 wt. % in ultrapure water, molecular weight , Sigma-Aldrich Co. LLC) were used. It should be noted that XG solutions are non-Newtonian fluids that show shear-thinning behavior (see Fig. 9) and induce birefringence due to their chain structureYevlampieva, Pavlov, and Rjumtsev (1999); Meyer et al. (1993); Chow and Fuller (1984).
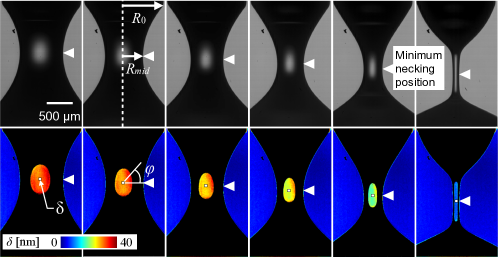
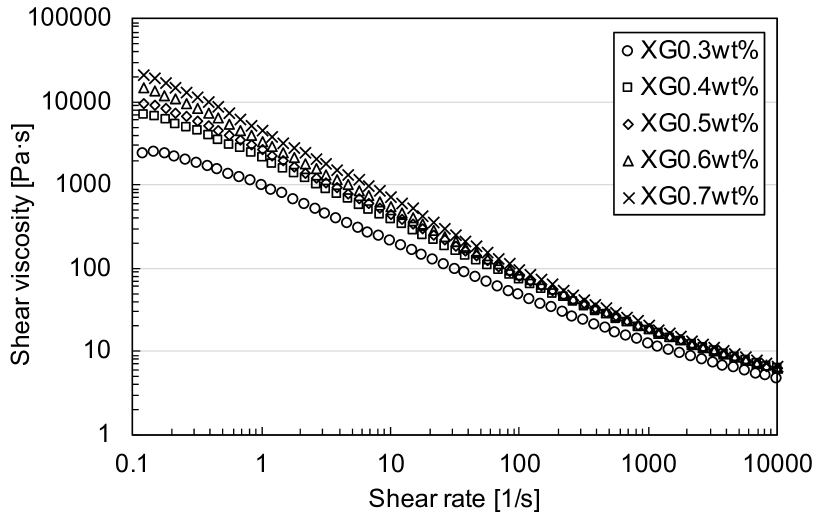
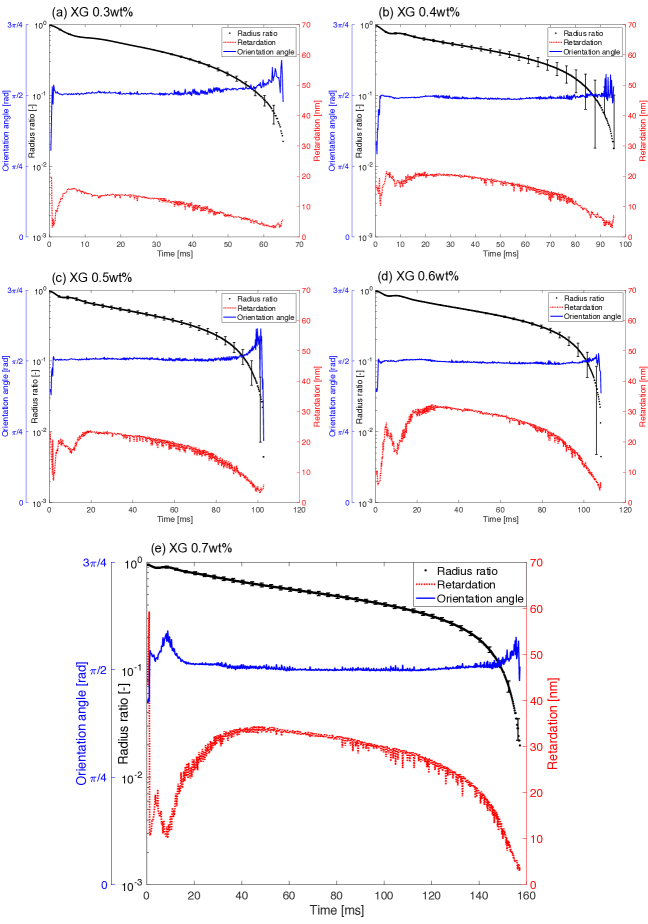
Figure 10 shows the results for radius ratio, retardation, and orientation angle over time for five different concentrations of XG. Within the EC regime, it is known that the liquid filaments of common viscoelastic fluids are cylindrical, while the temporal images of the XG solutions (Fig. 8) clearly show that the filament decays with a curvature unlike that in the case of PEO solutions. Thus, it is difficult to determine the presence of the EC regime. However, since the radius ratio of the XG solutions obeys the scaling law of the EC regime [Eq. ( 6)], we assume the existence of the EC regime here and estimate the durations of the EC regime for XG solutions of different concentrations as follows: 15–30 ms for 0.3 wt. %, 30–60 ms for 0.4 wt. %, 30–60 ms for 0.5 wt. %, 30–60 ms for 0.6 wt. %, and 50–100 ms for 0.7 wt. %.
The results for the orientation angle in Fig. 10 confirm that the orientation angle remains constant at except during the early stage (part of the IC regime) and the final stage (part of the VC regime). Since XG is a semirigid polymer while PEO is a flexible polymer, we initially expected that it would be more difficult to orient the XG than the PEO. However, in our experiment, both types of polymers were oriented along the extensional direction, and thus it is confirmed that CaBER-DoS provides sufficient extensional stress to orient the polymer chains. For the retardation of XG solutions (Fig. 10), the curves are clearly different from those of the mixed solutions of PEO and CNCs (Fig. 6). The curves for the XG solutions increase in the early stage and then decrease gradually from the EC to the VC regime.
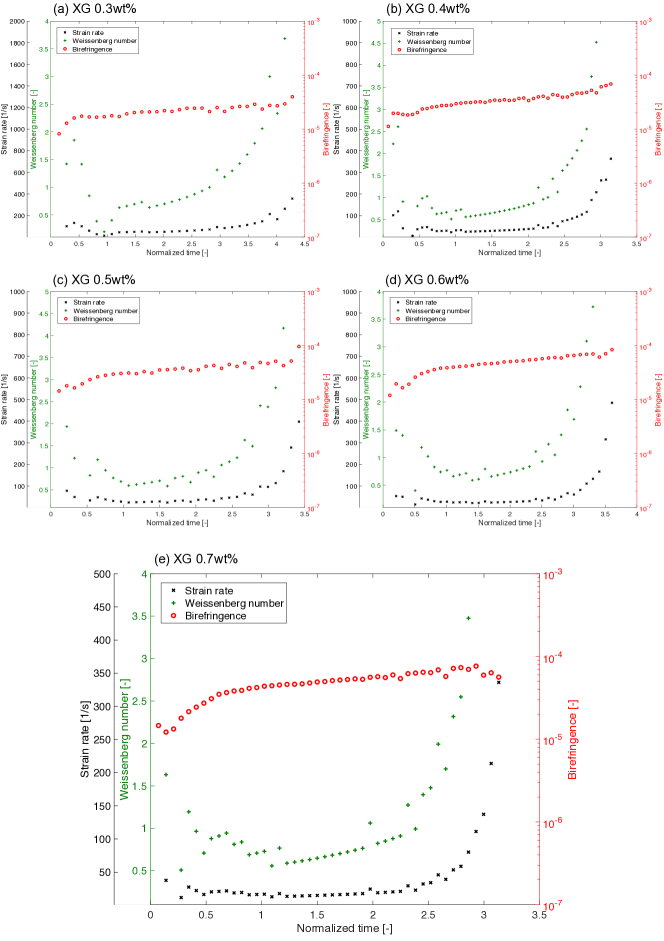
Figure 11 show plots of birefringence vs normalized time . It is confirmed that the slope of the birefringence for the XG solutions is slightly different at the start of the EC regime, showing a slight increase. However, we cannot determine whether the birefringence can be an indicator for determining the presence of the EC regime, because it is difficult to extract any significant trend at the transition from the IC to the EC regime (this is evident from the data on ). In other words, the birefringence results reflect the fact that the presence of the EC regime cannot be determined from the temporal evolution image of the XG solution, as mentioned above. We believe this this to be because XG is a naturally extracted polymer, with a nonuniform molecular weight.
References
References
- Noto et al. (2020) D. Noto, Y. Tasaka, J. Hitomi, and Y. Murai, “Applicability evaluation of the stress-optic law in Newtonian fluids toward stress field measurements,” Phys. Rev. Res. 2, 043111 (2020).
- Philippoff (1956) W. Philippoff, “Flow birefringence and stress,” J. Appl. Phys. 27, 984–989 (1956).
- Lodge (1955) A. S. Lodge, “Variation of flow birefringence with stress,” Nature 176, 838–839 (1955).
- Lodge (1956) A. Lodge, “A network theory of flow birefringence and stress in concentrated polymer solutions,” Trans. Faraday Soc. 52, 120–130 (1956).
- Shikata, Dahman, and Pearson (1994) T. Shikata, S. J. Dahman, and D. S. Pearson, “Rheo-optical behavior of wormlike micelles,” Langmuir 10, 3470–3476 (1994).
- Gortemaker et al. (1976) F. H. Gortemaker, M. G. Hansen, B. De Cindio, and H. Janeschitz-Kriegl, “A re-designed cone-and-plate apparatus for the measurement of the flow birefringence of polymer melts,” Rheol. Acta 15, 242–255 (1976).
- Yevlampieva, Pavlov, and Rjumtsev (1999) N. P. Yevlampieva, G. M. Pavlov, and E. I. Rjumtsev, “Flow birefringence of xanthan and other polysaccharide solutions,” Int. J. Biol. Macromol. 26, 295–301 (1999).
- Meyer et al. (1993) E. L. Meyer, G. G. Fuller, R. C. Clark, and W. M. Kulicke, “Investigation of xanthan gum solution behavior under shear flow using rheooptical techniques,” Macromolecules 26, 504–511 (1993).
- Chow and Fuller (1984) A. W. Chow and G. G. Fuller, “Response of moderately concentrated xanthan gum solutions to time-dependent flows using two-color flow birefringence,” J. Rheol. 28, 23–43 (1984).
- Ito, Yoshitake, and Takahashi (2016) M. Ito, Y. Yoshitake, and T. Takahashi, “Shear-induced structure change in shear-banding of a wormlike micellar solution in concentric cylinder flow,” J. Rheol. 60, 1019–1029 (2016).
- Haward et al. (2019) S. J. Haward, N. Kitajima, K. Toda-Peters, T. Takahashi, and A. Q. Shen, “Flow of wormlike micellar solutions around microfluidic cylinders with high aspect ratio and low blockage ratio,” Soft Matter 15, 1927–1941 (2019).
- Zhao, Shen, and Haward (2016) Y. Zhao, A. Q. Shen, and S. J. Haward, “Flow of wormlike micellar solutions around confined microfluidic cylinders,” Soft Matter 12, 8666–8681 (2016).
- Haward et al. (2012) S. J. Haward, T. J. Ober, M. S. Oliveira, M. A. Alves, and G. H. McKinley, “Extensional rheology and elastic instabilities of a wormlike micellar solution in a microfluidic cross-slot device,” Soft Matter 8, 536–555 (2012).
- Iwata et al. (2019) S. Iwata, T. Takahashi, T. Onuma, R. Nagumo, and H. Mori, “Local flow around a tiny bubble under a pressure-oscillation field in a viscoelastic worm-like micellar solution,” J. Non-Newtonian Fluid Mech. 263, 24–32 (2019).
- Entov and Hinch (1997) V. M. Entov and E. J. Hinch, “Effect of a spectrum of relaxation times on the capillary thinning of a filament of elastic liquid,” J. Non-Newtonian Fluid Mech. 72, 31–53 (1997).
- Mathues et al. (2018) W. Mathues, S. Formenti, C. McIlroy, O. G. Harlen, and C. Clasen, “CaBER vs ROJER—different time scales for the thinning of a weakly elastic jet,” J. Rheol. 62, 1135–1153 (2018).
- Sur and Rothstein (2018) S. Sur and J. Rothstein, “Drop breakup dynamics of dilute polymer solutions: Effect of molecular weight, concentration, and viscosity,” J. Rheol. 62, 1245–1259 (2018).
- McKinley (2005) G. H. McKinley, “Visco-elasto-capillary thinning and break-up of complex fluids,” Hatsopoulos Microfluids Laboratory, Department of Mechanical Engineering, Massachusetts Institute of Technology, HML Report No. 05-P-04 (2005).
- Prabhakar, Prakash, and Sridhar (2006) R. Prabhakar, J. R. Prakash, and T. Sridhar, “Effect of configuration-dependent intramolecular hydrodynamic interaction on elastocapillary thinning and breakup of filaments of dilute polymer solutions,” J. Rheol. 50, 925–947 (2006).
- Doyle et al. (1998) P. S. Doyle, E. S. G. Shaqfeh, G. H. McKinley, and S. H. Spiegelberg, “Relaxation of dilute polymer solutions following extensional flow,” J. Non-Newtonian Fluid Mech. 76, 79–110 (1998).
- Doyle, Shaqfeh, and Gast (1997) P. S. Doyle, E. S. G. Shaqfeh, and A. P. Gast, “Dynamic simulation of freely draining flexible polymers in steady linear flows,” J. Fluid Mech. 334, 251–291 (1997).
- Rothstein and McKinley (2002) J. P. Rothstein and G. H. McKinley, “A comparison of the stress and birefringence growth of dilute, semi-dilute and concentrated polymer solutions in uniaxial extensional flows,” J. Non-Newtonian Fluid Mech. 108, 275–290 (2002).
- Janeschitz-Kriegl (2012) H. Janeschitz-Kriegl, Polymer Melt Rheology and Flow Birefringence (Springer, 2012).
- Ryu, Inoue, and Osaki (1996) D.-S. Ryu, T. Inoue, and K. Osaki, “A simple evaluation method of stress-optical coefficient of polymers,” Nihon Reoroji Gakkaishi 24, 129–132 (1996).
- Inoue, Okamoto, and Osaki (1991) T. Inoue, H. Okamoto, and K. Osaki, “Birefringence of amorphous polymers. 1. Dynamic measurement on polystyrene,” Macromolecules 24, 5670–5675 (1991).
- Dinic and Sharma (2020) J. Dinic and V. Sharma, “Flexibility, extensibility, and ratio of kuhn length to packing length govern the pinching dynamics, coil-stretch transition, and rheology of polymer solutions,” Macromolecules 53, 4821–4835 (2020).
- Dinic, Jimenez, and Sharma (2017) J. Dinic, L. N. Jimenez, and V. Sharma, “Pinch-off dynamics and dripping-onto-substrate (DoS) rheometry of complex fluids,” Lab Chip 17, 460–473 (2017).
- McKinley and Tripathi (2000) G. H. McKinley and A. Tripathi, “How to extract the Newtonian viscosity from capillary breakup measurements in a filament rheometer,” J. Rheol. 44, 653–670 (2000).
- Clasen et al. (2006) C. Clasen, J. P. Plog, W.-M. Kulicke, M. Owens, C. Macosko, L. E. Scriven, M. Verani, and G. H. McKinley, “How dilute are dilute solutions in extensional flows?” J. Rheol. 50, 849–881 (2006).
- Wagner, Bourouiba, and McKinley (2015) C. Wagner, L. Bourouiba, and G. H. McKinley, “An analytic solution for capillary thinning and breakup of FENE-P fluids,” J. Non-Newtonian Fluid Mech. 218, 53–61 (2015).
- Bass (2010) M. Bass, Handbook of Optics: Volume I. Geometrical and Physical Optics, Polarized Light, Components and Instruments (McGraw-Hill, 2010).
- Rastogi (2015) P. Rastogi, Digital Optical Measurement Techniques and Applications (Artech House, 2015).
- Onuma and Otani (2014) T. Onuma and Y. Otani, “A development of two-dimensional birefringence distribution measurement system with a sampling rate of 1.3 MHz,” Opt. Commun. 315, 69–73 (2014).
- Kádár, Spirk, and Nypelö (2021) R. Kádár, S. Spirk, and T. Nypelö, “Cellulose nanocrystal liquid crystal phases: Progress and challenges in characterization using rheology coupled to optics, scattering, and spectroscopy,” ACS Nano 15, 7931–7945 (2021).
- Calabrese, Haward, and Shen (2021) V. Calabrese, S. J. Haward, and A. Q. Shen, “Effects of shearing and extensional flows on the alignment of colloidal rods,” Macromolecules 54, 4176–4185 (2021).
- Hasegawa, Horikawa, and Shikata (2020) H. Hasegawa, Y. Horikawa, and T. Shikata, “Cellulose nanocrystals as a model substance for rigid rod particle suspension rheology,” Macromolecules 53, 2677–2685 (2020).
- Arai, Horikawa, and Shikata (2018) K. Arai, Y. Horikawa, and T. Shikata, “Transport properties of commercial cellulose nanocrystals in aqueous suspension prepared from chemical pulp via sulfuric acid hydrolysis,” ACS omega 3, 13944–13951 (2018).
- Chowdhury, Peng, and Youngblood (2017) R. A. Chowdhury, S. X. Peng, and J. Youngblood, “Improved order parameter (alignment) determination in cellulose nanocrystal (CNC) films by a simple optical birefringence method,” Cellulose 24, 1957–1970 (2017).
- Cranston and Gray (2008) E. D. Cranston and D. G. Gray, “Birefringence in spin-coated films containing cellulose nanocrystals,” Colloids Surf. A 325, 44–51 (2008).
- Okada, Urakawa, and Inoue (2016) Y. Okada, O. Urakawa, and T. Inoue, “Reliability of intrinsic birefringence estimated via the modified stress-optical rule,” Polym. J. 48, 1073–1078 (2016).
- Pereira, Andrade, and Soares (2013) A. S. Pereira, R. M. Andrade, and E. J. Soares, “Drag reduction induced by flexible and rigid molecules in a turbulent flow into a rotating cylindrical double gap device: Comparison between poly (ethylene oxide), polyacrylamide, and xanthan gum,” J. Non-Newtonian Fluid Mech. 202, 72–87 (2013).