Refining magnetic interactions from the magnetic field dependence of spin-wave excitations in magnetoelectric LiFePO4
Abstract
We investigated the spin excitations of magnetoelectric LiFePO4 by THz absorption spectroscopy in magnetic fields up to 33 T. By studying their selection rules, we found not only magnetic-dipole, but also electric-dipole active (electromagnons) and magnetoelectric resonances. The magnetic field dependence of four strong low-energy modes is reproduced well by our four-sublattice spin model for fields applied along the three orthorhombic axes. From the fit, we refined the exchange couplings, single-ion anisotropies, and the Dzyaloshinskii-Moriya interaction parameters. Additional spin excitations not described by the mean-field model are observed at higher frequencies. Some of them shows a strong shift with magnetic field, up to 4 /T, when the field is applied along the easy axis. Based on this field dependence, we attribute these high frequency resonances to excitation of higher spin multipoles and of two magnons, which become THz-active due to the low symmetry of the magnetically ordered state.
1 Introduction
Recent optical studies of multiferroic materials have revealed non-reciprocal directional dicroism, which is the light absorption difference for unpolarized counter-propagating beams [1, 2, 3, 4, 5, 6, 7, 8, 9, 10, 11, 12, 13, 14, 15, 16, 17, 18, 19, 20, 21, 22, 23, 24, 25]. This unusual phenomenon is the finite-frequency manifestation of the magnetoelectric (ME) effect, which emerges at simultaneously electric- and magnetic-dipole allowed excitations, that we term as ME resonance111Usually, magnons couple to the magnetic component of electromagnetic radiation, i.e. they are magnetic-dipole active. If the magnons are electric-dipole active, the term electromagnon is often used [26]. Magnetoelectric resonance is a spin-wave excited by both components of electromagnetic radiation [3, 27]. For the rest of the paper we classify the spin-waves, based on their coupling to the electromagnetic radiation, using magnetic-dipole active, electric-dipole active and magnetoelectric spin-wave. We use “magnon” for the spin-wave excitation described by the mean-field model without making a difference in its coupling to the electromagnetic radiation.. Since the relative orientation of the electric and magnetic fields is different for counter-propagating beams ME coupling generates an absorption difference between the two beams and may even lead to one-way transparency [7]. This non-reciprocal absorption may gain applications in photonics and spintronics [3, 13]. For example, materials with ME resonances can be used as optical diodes where the direction of transparency for the THz radiation can be switched by magnetic fields [4, 3, 5, 7, 9, 8, 17], electric fields [28, 20, 24], or both [13]. From the fundamental science point of view, the spectroscopy of the ME excitations promotes the understanding of the static ME response which is linked to the non-reciprocal directional dichroism spectrum via the Kramers-Kronig relations [29, 16]. Moreover, a THz absorption study, combined with magnetization, inelastic neutron scattering measurements [30, 31, 32], and theoretical modeling [33, 34, 35, 36] can resolve realistic spin Hamiltonians of ME compounds.
The relativistic spin-orbit coupling plays an essential role for ME spin excitations. It establishes a coupling between spins and electric dipoles and also introduces single-ion anisotropy for . The single-ion anisotropy expands the frequency scale of spin excitations as it separates the doublets from each other in zero field, where is the spin quantum number. In addition to conventional spin waves, spin-quadrupolar excitations corresponding to may appear in systems with strong single-ion anisotropy and spin [37, 38, 39, 40, 41], broadening the frequency range for possible applications of ME materials. In general, if there are spins in the magnetic unit cell we expect spin excitations, which can be described by the multi-boson spin-wave theory [37, 38, 13, 42] or by single-ion spin Hamiltonian with added molecular field to take into account spin-spin interactions [43, 32, 44].
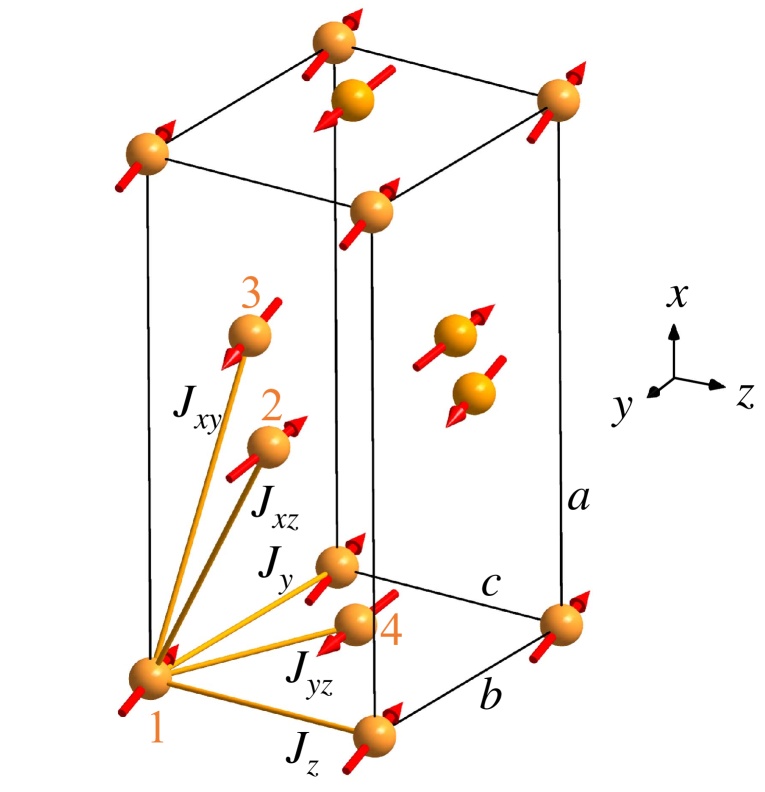
The LiPO4 ( Mn, Co, Fe, Ni) orthophosphate compounds become ME as their magnetic order breaks the inversion symmetry [45]. This, together with their large single-ion anisotropy [31, 32, 46], makes them appealing candidates to explore unconventional spin excitations. Among these compounds, LiFePO4 has the highest Néel temperature, K below which an antiferromagnetic (AFM) order develops, as depicted in Fig. 1. The spins of the four magnetic ions of the unit cell are nearly parallel to the axis [47]. Detailed neutron diffraction experiments showed that the spins are slightly rotated in the plane and canted toward the axis [31]. LiFePO4 has one of the largest spins in the orthophosphate family but the number of spin-wave modes detected in the magnetically ordered phase has been substantially less than , allowed for a spin system. In zero-field inelastic neutron scattering (INS) studies two spin-wave branches [30, 31, 32] and a dispersionless mode were observed below 10 meV [32]. Whereas, a recent high-frequency electron spin resonance study detected two modes in the vicinity of the spin-flop field, 32 T [46]. Therefore, further experimental data is needed to understand better the spin dynamics and spin Hamiltonian of LiFePO4.
In this work, we studied the magnetic field dependence of the spin excitations using THz absorption spectroscopy in the low temperature AFM phase of LiFePO4. The spectral range of our experiments extending up to 175 (22 meV) covers two and five times larger energy window compared to former INS [30, 31, 32] and electron spin resonance studies [48, 46], respectively. The broader spectral range allowed us to observe 17 spin excitations and to determine their selection rules. The absorption spectra were measured with magnetic field applied along all three principal crystallographic axes up to 33 T in the Faraday configuration (light propagates along the field, ) and up to 17 T in Voigt geometry (light propagates perpendicular to the field, ). Beside THz spectroscopy, we measured high-field magnetization up to 120 T along the easy-axis from which we determined the spin-flop and the saturation fields. Finally, we successfully employed a mean-field model to describe the field dependence of the magnetization and the resonance frequencies of the four strongest low-frequency spin-wave modes in the AFM state. By fitting the magnetic field dependence of four magnons we have refined the values of the exchange couplings, the single-ion anisotropies, and the Dzyaloshinskii-Moriya interaction.
2 Experimental
The LiFePO4 single crystals were grown by the floating zone method [49]. The quality of the crystals was verified by powder diffraction and Laue XRD, which confirmed the orthorhombic structure with the same lattice constants as reported in Ref. [50].
The low field magnetization measurements were done using a 14 T PPMS with VSM option (Quantum Design). High-field magnetization measurements were carried out up to 120 T using ultra-high semidestructive pulses at the Laboratoire National des Champs Magnétiques Intenses in Toulouse [51, 52]. The maximum field of a semidestructive pulse was reached in 2.5 s.
For THz spectroscopy studies the single crystal was cut into three 1 mm thick slabs each with a large face normal to one of the three principal crystallographic directions. The slabs were wedged by two degrees to suppress the fringes in the spectra produced by the internal reflections in the crystal.
The THz measurements up to 17 T were performed with a polarizing Martin-Puplett interferometer and a 0.3 K silicon bolometer in Tallinn. High field spectra from 17 T up to 33 T were measured using a Bruker IFS 113v spectrometer and a 1.6 K silicon bolometer in High Field Magnet Laboratory in Nijmegen. The experiments above 17 T were done in Faraday configuration, while below 17 T both Faraday and Voigt configuration experiments were performed. All spectra were measured with an apodized spectral resolution of 0.3 or 0.5 . The polarizer angle with respect to the crystal axes was determined by evaluating the intensity change of the strongest modes in the THz absorption spectra as the function of rotation angle of the polarizer. This information was also used to mount the polarizer in the high field experiments in Nijmegen where the in situ polarizer rotation was not possible. Absorption was determined by using a reference spectrum of an open hole, sample spectrum in the paramagnetic phase or by statistically calculating the baseline from the magnetic field dependence of sample spectra. In the first method, the absorption was calculated as
| (1) |
where is the intensity through the reference hole with the area equal to the sample hole area and is the sample thickness. In the second method, the absorption difference was calculated,
| (2) | |||||
where is the intensity through the sample measured at 0 T and 55 K in the paramagnetic phase. In the third method, the statistically calculated baseline, , was found as a minimum of differential absorption,
| (3) | |||||
at each frequency over several magnetic field values . By adding to the differential absorption we get the dependence of absorption spectra on magnetic field. This method was used to obtain the spectra measured above 17 T.
3 Mean-field model
The mean-field theory of localized magnetic moments is a widely applied tool to interpret the static and dynamic magnetic properties of systems with periodic magnetic structures [53], e.g. ferro- [54], ferri- [34] and antiferromagnetic- [33] insulators. Particularly, the microscopic spin Hamiltonian of LiFePO4 has been discussed by several papers [30, 55, 31, 32, 56, 46].
Here we aim to describe the static magnetism and the infrared-active optical magnetic resonances of LiFePO4. Thus, we use a simplified Hamiltonian where the exchange coupling terms and have been omitted as they connect spins at crystallographically equivalent sites, see Fig. 1. While the one-magnon THz spectrum is insensitive to the same energy shift of all states at the point of the Brillouin zone produced by and , these couplings are relevant when describing the dispersion of the magnon modes [31]. The Hamiltonian of our study is
| (4) | |||||
where the terms, exchange interactions, Dzyaloshinskii-Moriya term, single-ion anisotropy terms, and the Zeeman energy, have been considered in the earlier works of LiFePO4 summarized in Table 1. The model is based on four Fe2+ spins, here represented by classical vectors of length, that occupy crystallographically non-equivalent positions of the unit cell. As shown in Fig.1, the spins are coupled by three different exchange couplings with parameters and . There are two single-site hard-axis anisotropies, and , that effectively produce the easy axis along . The spins are slightly rotated away from the axis towards the axis as observed by neutron scattering [31]. Extending previous studies to reproduce this small deviation of the magnetic structure from the collinear antiferromagnetic order we introduced an additional single-site anisotropy term . The Dzyaloshinskii-Moriya interaction is . Since the spins are predominantly along the direction, cants spins towards the direction. The last term in Eq. (4) is the interaction of the electron spin with the applied magnetic field taking into account the -factor anisotropy.
We model the spin dynamics using the Landau-Lifshitz-Gilbert equation, Ref. [57], as used in Ref. [58], by assuming that the spins are oscillating about their equilibrium orientations without changing their lengths. The equilibrium orientation of the spins is found by minimizing the energy described in the Hamiltonian of Eq. (4), with respect to the spin orientations. The magnetic-dipole absorption of light by spin-waves is calculated assuming that the magnetic field of radiation couples to the total magnetic moment of the spins [58]. Dielectric permittivity in the absorption coefficient formula, Eq. (10) in Ref. [58], was assumed to be real and frequency-independent with components , and [59].
| Ref. | ||||||||
| 0.086 | 0.51 | 0.52 | 1.52 | 0.027 | 222This work | |||
| 0.05 | 0.14 | 0.77 | 0.62 | 1.56 | - | 0.038333The Dzyaloshinskii-Moriya parameter where is from Ref. [46]. | [46] | |
| 0.01 | 0.09 | 0.46 | 0.86 | 2.23 | - | - | - | [32] |
| 0.05 | 0.14 | 0.77 | 0.62 | 1.56 | - | - | - | [31] |
4 Results
4.1 Magnetization
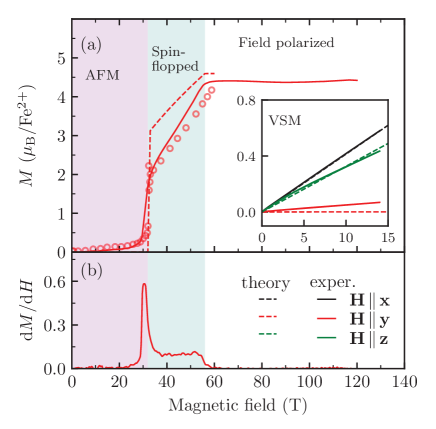
We characterized LiFePO4 samples by measuring the magnetization at 2.4 K along the principal axes up to 14 T. Along Hy, the measurement is extended up to 120 T at 5 K using pulsed fields, see Fig. 2. The -axis magnetization determined from the pulsed-field measurements was normalized to the value of static field measurements in the range from 4 to 14 T, neglecting a small hysteresis of magnetization between 0 and 4 T. In the AFM state the spins are predominantly aligned along the easy axis, the axis in LiFePO4. The magnetization grows approximately linearly in increasing field for Hx and Hz. When Hy is applied, the spins maintain easy-axis alignment up to the spin-flop field marked by a jump in the magnetization at 323 T. As the field further increases the magnetization grows linearly and reaches saturation at 563 T. In the field-polarized state, the saturation magnetization is estimated to 4.4 per iron. The spin-flop field deduced from our measurements is in agreement with former high-field magnetization measurements [46].
4.2 THz absorption spectra in zero field
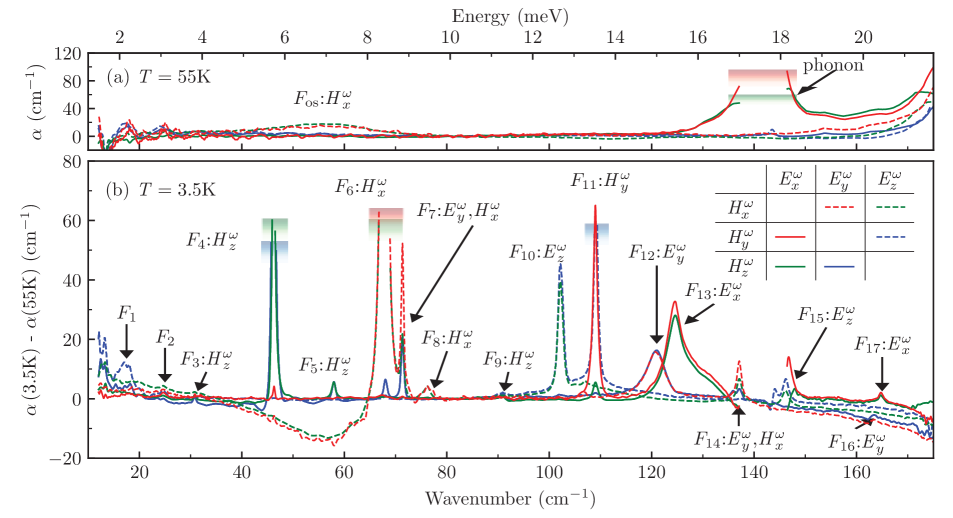
The zero-field THz absorption spectra of LiFePO4 are presented in Fig. 3 and the mode parameters are collected in Table 2, while Fig. 3(b) features absorption spectra in the AFM phase, relative to the paramagnetic phase.
The spectra in the paramagnetic phase show a broad but weak magnetic-dipole active peak at around 55 , Fig. 3 (a). The magnetic on-site excitation is active as it is seen in two polarization configurations, {,} and {,}. The frequency and the selection rules of are reproduced by exact diagonalization of a four-spin cluster, see Fig. S6 in the Supplementary Material. Other features in the paramagnetic phase spectra are -active phonon at 140, with a strong absorption exceeding the detection limit, and absorption rising towards higher frequencies due to the phonons with resonance frequencies above 175.
To better resolve spectral features emerging in the magnetically ordered phase we plot the difference spectra, , Fig. 3 (b). We observe a diminished absorption at the tails of phonons at low appearing as negative features in the difference spectra between 140 and 175. The change of the 140 phonon mode is obscured by the strong absorption and therefore the -spectra, green and red solid lines, are discontinued where the 140 phonon peaks. The broad peak from the high- paramagnetic phase appears as a negative feature in the difference spectra in polarization.
All sharp modes, labeled ,, , are absent above and we assign them to spin excitations. The seven excitations, , , , , , and , are identified as magnetic-dipole active modes. Six modes, , , , , and , are identified as electric-dipole active resonances. The mode has a shoulder, thus, it was fitted with two Gaussian lines with maxima at 124.4 and 127.6. Two modes, at 71.4 and at 137.1, are both electric- and magnetic-dipole allowed, therefore, we identified them as ME resonances. is the strongest in {,} polarization, red dashed line in Fig. 3 (b), and its intensity is halved if only one of the components, or , is present. Thus, is an example of a ME resonance which couples equally to the magnetic and electric components of radiation. We detected in the same three polarization configuration, thus, we also assigned it to a ME resonance with the same selection rule as mode , {,}.
The three strongest magnetic-dipole active modes , , and show only weak absorption in polarizations orthogonal to their main magnetic dipole component. The weak absorption in other polarizations could be explained by the imperfections of the polarizer. However, we can not completely rule out that some of these modes are ME resonances with a weak electric-dipole component which can be tested by further measurements of the non-reciprocal directional dichroism on magneto-electrically poled samples [13, 16]. We can not identify the selection rules for modes and as they are too weak.
4.3 Magnetic field dependence of spin-waves
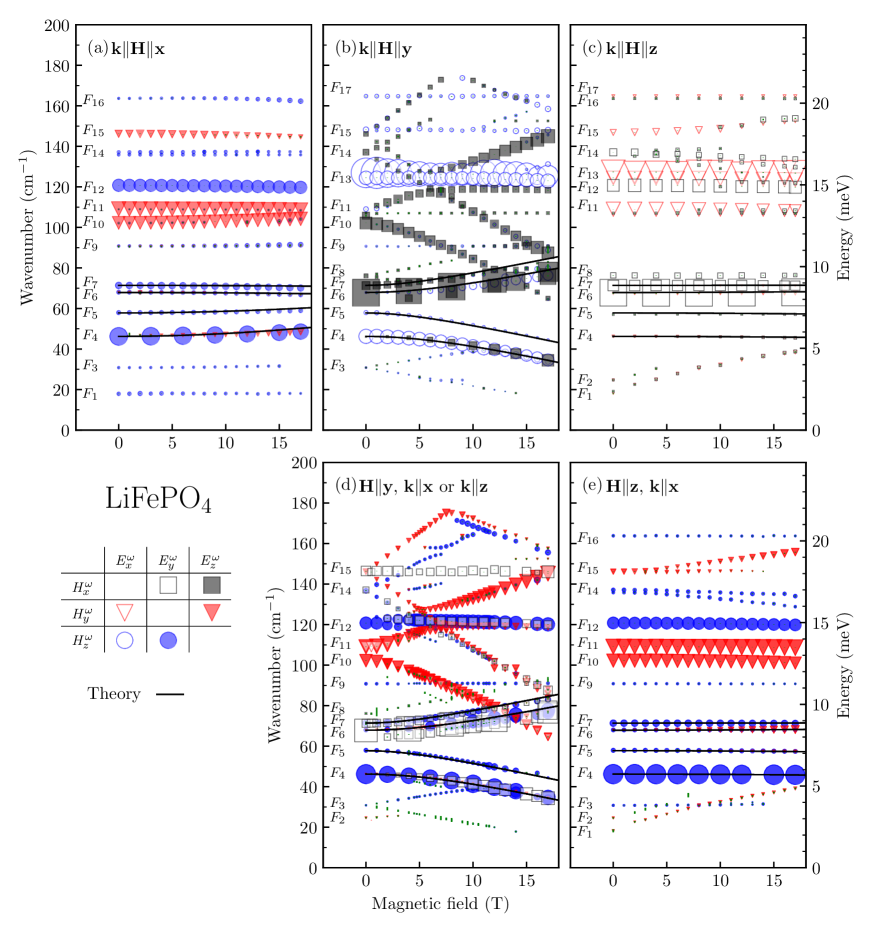
The magnetic field dependence of mode frequencies and intensities between 0 and 17 T is shown in Fig. 4 for Faraday, panels (a)-(c), and Voigt configuration, (d) and (e). The modes mostly stay at constant frequency when the magnetic field is applied along the hard axes, Hx, Fig. 4(a) and Hz, Fig. 4(c, e). However, most of the resonances shift with the magnetic field for Hy. We assigned a slope, , calculated between 15 and 17 T in units T-1, to each of the modes and collected them in Table 2. If the mode was not visible in this range, a lower magnetic field range was used. One mode, , has zero slope and , , and have a moderate value, . Modes and have the largest for Hy but also a substantial for Hz.
Assuming we estimated from the slopes the change of the spin projection quantum number, , upon the excitations. The results are listed in Table 2. The spin-waves below 80 (zero-field frequency) have while above 100 is 2, 3 or 4. was not assigned to and where T-1 below 8 T, which is between and 2. We note that of changes with field. It is 0.9T-1 above 8 T. This change of slope could be due to the anti-crossing with but we do not have evidence for that because the mode was too weak to be detected in the high-field magnet set-up above 17 T.
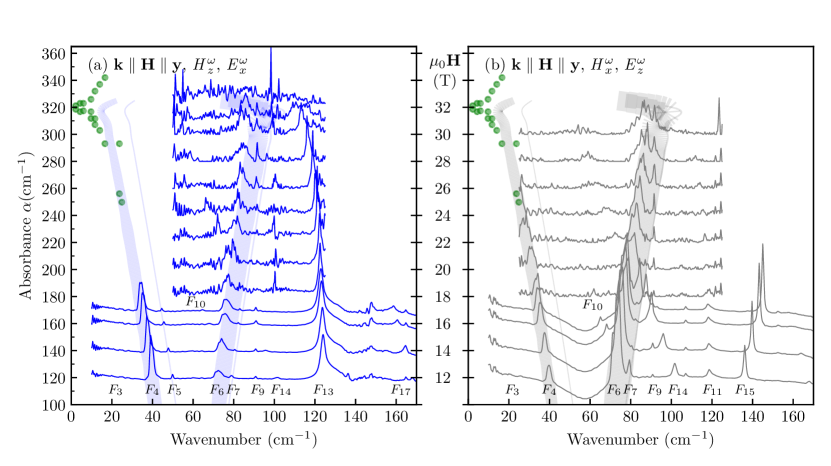
The absorption spectra in high magnetic field Hy up to 31.6 T are presented in Fig. 5. The spin-wave excitations, and , start softening before reaching the spin-flop transition at 32 T, in accordance with the mean-field calculation. Also, at about 125 shows softening close to 30 T. Spectra in other two field directions, Hx and Hz, above 17 T are shown in Supplementary Material, Figs. S1 and S3.
| Mode | Energy at 0 T | Area at 0 T | Selection | Magnetic field | Slope | |
|---|---|---|---|---|---|---|
| (cm-1) | (cm-2) | rules at 0 T | direction | (cm-1T-1) | ||
| 4 | ||||||
| 2 | ||||||
| 2 | , | 1 | ||||
| 100 | ||||||
| 6 | ||||||
| 200 | ||||||
| 37 | , | 1 | ||||
| 9 | , | 1 | ||||
| 2 | ||||||
| 57 | 3 | |||||
| 74 | ||||||
| 50 | ||||||
| 124.4, 127.6 | 185 | |||||
| 17 | , | , | ||||
| 30 | , | |||||
| 2 | ||||||
| 4 |
4.4 Mean-field model results
The mean-field model parameters of Table 1 were obtained by fitting the magnetic field dependence of frequencies of the spin-wave modes , , , and . The magnetic field dependence of these modes below 17 T is reproduced remarkably well by the model for all three magnetic field directions, Fig. 5 and Fig. 4. The isotropic -factor was not sufficient to quantitatively describe the magnetic field dependence of mode frequencies. The anisotropic -factor values improved not only the magnetic field dependence of spin-wave frequencies, but also reproduce the value of the spin-flop field and the saturation field, Fig. 2. In addition, the calculated magnetization as a function of and follows the measured below 15 T, inset to Fig. 2.
The equilibrium spin configuration deviates in two ways from the perfect collinear arrangement of spins along the axis. With the parameters from Table 1 we get the canting away from the axis towards the axis by 0.86 degrees, driven by the Dzyaloshinskii-Moriya interaction . The rotation of spins, driven by , away from the axis towards the axis is 0.95 degrees. Using the spin length , the out-of-easy-axis magnetic moments per spin are and reproducing the experimentally determined deviations, = 0.063(5) and = 0.067(5) [31].
The saturation value of the magnetization for Hy calculated from the mean-field model is 4.5% higher than the experimentally observed, Fig. 2 (a). Reason for the failure to reproduce the saturation magnetization and the spin-flop field with the same set of magnetic-field independent parameters could be magnetostriction [56]. Magnetostriction, as was proposed in Ref. [46], could also be the reason why the mean-field model does not reproduce the frequency of close to the spin-flop field, 32 T in Fig. 5.
5 Discussion
5.1 Spin-wave excitations from the mean-field model
We found that the the mean-field model quantitatively describes the magnetic field dependence of the frequencies of spin-waves , , , and , Fig. 4. The modes , , , and have a linear field dependence with the slope close to T-1 when the field is along the easy axis . This slope corresponds to a spin-wave excitation with , assuming . Other studies also found a g-factor close to 2 [46]. Other candidates for the spin-wave excitations are and . However, both of these modes have two branches degenerate in zero field. The magnetization measurements, inset of Fig. 2(a), indicate bi-axial magnetic anisotropy in LiFePO4 which lifts the degeneracy of magnetic resonances in zero field. Therefore, and cannot be consistently included into the mean-field description.
The spin-waves of the mean-field model have oscillating spin components, , perpendicular to the equilibrium direction of the -th spin, . The spin-wave couples to the magnetic field of radiation if the oscillating spin component of the whole magnetic unit cell is finite, . The equilibrium direction of the spins is aligned to the easy axis within few degrees in LiFePO4. The selection rules, Table 2, show that and are excited by the component of radiation and modes and by the component, which both are perpendicular to . The magnetic field dependence of intensities of the strongest modes and is well described by the mean-field model. Firstly, is - and is -active in zero field, Table 2. Secondly, as increases, becomes -active and becomes -active, Fig. S4 in the Supplementary Material. Thus, for modes and the agreement between theory and experiment is good.
The experimental and theoretical selection rules of magnetic dipole transition for agree, it is -active. For the spin-wave the theory predicts -activity, although it is -active in the experiment, see Fig. S4 in the Supplementary Material. Overall, theory underestimates and magnetic dipole transition intensity by two orders of magnitude. It is not surprising as the modes and are relatively weak as compared to and and therefore they are sensitive to the composition of the spin-wave state. If the mean-field model, as an approximation, does not give the true spin-wave state, the weak intensities could be seriously affected. As observed experimentally, Fig. 3, is electric-dipole active in addition. The coupling of spins to the electric field was not included in the mean-field model.
Similar to the quantum-mechanical formulas of the magnon dispersion relation of former studies [30, 60, 31], the classical expressions for the zero-field resonance frequencies of the magnon modes can be derived. For the two strongest spin-waves and
| (5) |
while the zero-field frequencies of the weaker and are
| (6) |
where we neglected the weak Dzyaloshinskii-Moriya interaction and the single-ion anisotropy terms. While these two terms are necessary to give finite magnetic dipole activity to the weak and resonances by breaking the equivalence of and ( and , respectively) sublattices, they do not change the resonance frequencies significantly.
As follows from Eq. (5) and Eq. (6), if , and are degenerate in zero field, , and also . In this case the nearest-neighbor planes of the and sub-lattices, separated by , are decoupled from each other, thus, their in-phase and out-of-phase excitations with respect to each other are degenerate. Consequently, and can be considered as the in-phase while and as the out-of-phase resonances of the nearest-neighbor planes. Without Dzyaloshinskii-Moriya interaction and anisotropy the total oscillating magnetic dipole moment of the unit cell produced by and is zero. This explains the weak intensity of and compared to and in the THz absorption spectrum. Furthermore, the correspondence between the INS magnon dispersion interpreted in the two-spin unit cell scheme [30, 31, 32] and our -point optical experiments can also be formulated based on the mean-field results. Namely, and correspond to the spin-waves observed in the zone center, [31] or [32] while and are zone-boundary excitations of the two-spin unit cell, seen at [32], [30, 31] and [31] in the INS experiments [30, 31, 32].
5.2 Spin excitations beyond the mean-field model
Out of 17 lines appearing below in the THz absorption spectrum only four can be described by the classical four-spin mean-field model. The rest can be (i) spin-stretching excitations captured only by multi-boson spin-wave theory or alternatively by crystal-field schemes including exchange fields, (ii) two-magnon excitations (two spin waves with nearly opposite k vectors), or can even be (iii) excitations from impurity spins. Assuming that the spins are aligned along the -axis the magnetic symmetry reduces to [30]. Since all spatial symmetries of the paramagnetic state remain in the AFM phase, at least in combination with time-reversal operation, we do not expect new optical phonon modes to emerge below .
We assign absorption lines , and to impurities because these very weak modes are located below the lowest magnon mode . In addition, the frequencies of and increase linearly in magnetic field Hz, not coinciding with easy-axis direction . Previous works have found that Fe2+ at Li+ site has zero field splitting 7.3 (220 GHz) [48]. The lowest impurity absorption line in our spectrum is at 18 in zero field. This suggests that we are observing different impurities than reported in Ref. [48].
The mean-field model does not describe spin excitations –. Several of them are electric-dipole active and have a steep magnetic field dependence of frequency, suggesting change of a spin projection quantum number. This is unusual for a spin-wave excitation but can be explained by a large single-ion anisotropy () which is comparable or stronger than the exchange coupling () [37], see Table 1. In that case a suitable approach is a multi-boson spin-wave theory, which describes more than four spin-wave excitations in a four-sublattice magnet. Out from the ortho-phosphate compounds, the multi-boson spin-wave theory has been only applied to LiCoPO4, a spin system [13]. Developing a multi-boson spin-wave theory for LiFePO4 is a tedious calculation, therefore, it is out of the scope of this paper.
Some of the observed features can be explained qualitatively in the limit of zero exchange and Dzyaloshinskii-Moriya coupling. Assuming rotational symmetry about the axis in Eq. (4), , the spins are parallel to the quantization axis , and the energy levels of spin are , and . When the Hy field is applied, the energy difference increases approximately at a rate 4 T-1, as observed for the spin-wave excitation . The electric dipole activity comes from the on-site spin-induced polarization which in the lowest order of spin operators is () [13]. Although and (quantization axis is ) couple states different by it does not explain the transitions, , and . However, in LiFePO4 the single ion anisotropies are not equal, and mix into states, see Table I in Ref. [32]. Therefore, the selection rule for the electric-dipole transition, , and mixing of states gives finite electric-dipole moment to the transition. In a similar manner, and could give rise to transitions and if the mixing of states is taken into account, then to the electric-dipole allowed transitions.
Two spin-waves, and , can be excited by THz radiation of frequency if , which is termed as two-magnon excitation. The exact frequency dependence of this absorption depends on the coupling mechanism between the radiation and the spin-wave and on the density of spin-wave states [61, 62, 63, 64, 65, 66]. This leads to broad absorption bands with peaks at the highest density of spin-wave states [61, 62, 63, 67, 64, 68, 58], mostly with spin-waves from the edge of the Brillouin zone. Since the product of the two spin operators has the same time-reversal parity as the electric dipole moment, the simultaneous excitation of two spin-waves by the electric field is allowed and this mechanism usually dominates over the magnetic-dipole active absorption [69]. A relatively broad electric-dipole active absorption line is . If , the spin-wave frequency should be meV. At about the same energy two dispersion curves cross in the Brillouin zone point of the two-spin unit cell [31, 32]. The point, equivalent to , is the Brillouin zone boundary of the four-spin unit cell and therefore we expect anti-crossing of two dispersion curves which leads to increase in the density of magnon states at this point. Thus, considering the linewidths, energy scale, and the electric-dipole activity, could be a two-magnon excitation. Another candidate for a two-magnon excitation is the electric dipole active . Although it is relatively broad in zero field, it has a complicated field dependence in Hy, see Fig. S5 in the Supplementary Material, what can not be explained within a simple model of two-magnon excitation.
6 Summary
We studied the magnetic ground state and the spin excitations of the magnetoelectric antiferromagnet LiFePO4 by magnetization measurements in magnetic fields up to 120 T and by THz absorption spectroscopy up to 33 T. Magnetization measurements revealed a spin-flop transition at 32 T before reaching the saturation at 56 T. We found 17 absorption lines below 175 (5.25 THz) appearing in the magnetically ordered phase. Based on the magnetic field dependence of the resonance frequencies and the intensities, we assigned four of them to magnon modes (-), eight to multiboson spin-wave excitations (-, -), two to two-magnon excitations (, ) and the rest to the absorption by impurity spins (-). We applied a mean-field model, which describes well the four magnon modes (-). We attribute the other spin-wave modes to excitations with arising due to the large, , spin of octahedrally coordinated Fe2+ ions. Such excitations may become electric-dipole active due to symmetry allowed coupling between spin-quadrupolar fluctuations and electric polarization. Two modes, and , are magneto-electric resonances with significant coupling to both, electric and magnetic field component of radiation. Additional experiments on magneto-electrically poled samples are needed to clarify if these two resonances show non-reciprocal directional dichroism [13, 16].
7 Acknowledgments
The authors acknowledge the valuable discussions with Karlo Penc and thank Kirill Amelin and Jakub Vit for fruitful discussions and for the help with the THz spectroscopy measurements. This project was supported by the Estonian Research Council grant PRG736, institutional research funding IUT23-3 of the Estonian Ministry of Education and Research, the European Regional Development Fund project TK134, by the bilateral program of the Estonian and Hungarian Academies of Sciences under Contract No. NMK2018-47, by the Hungarian National Research, Development and Innovation Office—NKFIH Grants No. FK 135003. The high magnetic field magnetization experiments were supported by LNCMI-CNRS and HFML-RU/NWO-I, members of the European Magnetic Field Laboratory (EMFL). D. S. acknowledges the FWF Austrian Science Fund I 2816-N27 and TAI 334-N. The cooperation of Austrian and Hungarian partners was supported by Austrian Agency for International Cooperation in Education Research Grant No. WTZ HU 08/2020 and by the Hungarian NKFIH Grant No. 2019-2.1.11-TÉT-2019-00029. V. K. was supported by the RIKEN Incentive Research Project and B.B. acknowledges the support by the European Research Council (Grant Agreement No.835279-Catch-22). The data handling, calculations and figures were done in Python programming language using libraries NumPy [70], Matplotlib [71], Scipy [72] and Pandas [73].
L.P., V.K., and D.S. contributed equally to this work.
References
- Tokura [2007] Y. Tokura, Multiferroics—toward strong coupling between magnetization and polarization in a solid, J Magn Magn Mater 310, 1145 (2007).
- Saito et al. [2008] M. Saito, K. Taniguchi, and T. Arima, Gigantic optical magnetoelectric effect in CuB2O4, J. Phys. Soc. Jpn. 77, 013705 (2008).
- Kézsmárki et al. [2011] I. Kézsmárki, N. Kida, H. Murakawa, S. Bordács, Y. Onose, and Y. Tokura, Enhanced directional dichroism of terahertz light in resonance with magnetic excitations of the multiferroic Ba2CoGe2O7 oxide compound, Phys. Rev. Lett. 106, 057403 (2011).
- Miyahara and Furukawa [2011] S. Miyahara and N. Furukawa, Theory of magnetoelectric resonance in two-dimensional antiferromagnet Ba2CoGe2O7 via spin-dependent metal-ligand hybridization mechanism, J. Phys. Soc. Jpn. 80, 073708 (2011).
- Bordács et al. [2012] S. Bordács, I. Kézsmárki, D. Szaller, L. Demkó, N. Kida, H. Murakawa, Y. Onose, R. Shimano, T. Rõõm, U. Nagel, S. Miyahara, N. Furukawa, and Y. Tokura, Chirality of matter shows up via spin excitations, Nat. Phys. 8, 734 (2012).
- Takahashi et al. [2013] Y. Takahashi, Y. Yamasaki, and Y. Tokura, Terahertz magnetoelectric resonance enhanced by mutual coupling of electromagnons, Phys. Rev. Lett. 111, 037204 (2013).
- Kézsmárki et al. [2014] I. Kézsmárki, D. Szaller, S. Bordács, V. Kocsis, Y. Tokunaga, Y. Taguchi, H. Murakawa, Y. Tokura, H. Engelkamp, T. Rõõm, and U. Nagel, One-way transparency of four-coloured spin-wave excitations in multiferroic materials, Nat Commun 5, 3203 (2014).
- Kézsmárki et al. [2015] I. Kézsmárki, U. Nagel, S. Bordács, R. S. Fishman, J. H. Lee, H. T. Yi, S.-W. Cheong, and T. Rõõm, Optical diode effect at spin-wave excitations of the room-temperature multiferroic BiFeO3, Phys. Rev. Lett. 115, 127203 (2015).
- Bordács et al. [2015] S. Bordács, V. Kocsis, Y. Tokunaga, U. Nagel, T. Rõõm, Y. Takahashi, Y. Taguchi, and Y. Tokura, Unidirectional terahertz light absorption in the pyroelectric ferrimagnet CaBaCo4O7, Phys. Rev. B 92, 214441 (2015).
- Kuzmenko et al. [2015] A. M. Kuzmenko, V. Dziom, A. Shuvaev, A. Pimenov, M. Schiebl, A. A. Mukhin, V. Y. Ivanov, I. A. Gudim, L. N. Bezmaternykh, and A. Pimenov, Large directional optical anisotropy in multiferroic ferroborate, Phys. Rev. B 92, 184409 (2015).
- Toyoda et al. [2015] S. Toyoda, N. Abe, S. Kimura, Y. H. Matsuda, T. Nomura, A. Ikeda, S. Takeyama, and T. Arima, One-way transparency of light in multiferroic CuB2O4, Phys. Rev. Lett. 115, 267207 (2015).
- Iguchi et al. [2017] Y. Iguchi, Y. Nii, and Y. Onose, Magnetoelectrical control of nonreciprocal microwave response in a multiferroic helimagnet, Nat Commun 8, 10.1038/ncomms15252 (2017).
- Kocsis et al. [2018] V. Kocsis, K. Penc, T. Rõõm, U. Nagel, J. Vít, J. Romhányi, Y. Tokunaga, Y. Taguchi, Y. Tokura, I. Kézsmárki, and S. Bordács, Identification of antiferromagnetic domains via the optical magnetoelectric effect, Phys. Rev. Lett. 121, 057601 (2018).
- Yu et al. [2018] S. Yu, B. Gao, J. W. Kim, S.-W. Cheong, M. K. L. Man, J. Madéo, K. M. Dani, and D. Talbayev, High-temperature terahertz optical diode effect without magnetic order in polar FeZnMo3O8, Phys. Rev. Lett. 120, 037601 (2018).
- Tokura and Nagaosa [2018] Y. Tokura and N. Nagaosa, Nonreciprocal responses from non-centrosymmetric quantum materials, Nat Commun 9, 10.1038/s41467-018-05759-4 (2018).
- Kocsis et al. [2019] V. Kocsis, S. Bordács, Y. Tokunaga, J. Viirok, L. Peedu, T. Rõõm, U. Nagel, Y. Taguchi, Y. Tokura, and I. Kézsmárki, Magnetoelectric spectroscopy of spin excitations in LiCoPO4, Phys. Rev. B 100, 155124 (2019).
- Viirok et al. [2019] J. Viirok, U. Nagel, T. Rõõm, D. G. Farkas, P. Balla, D. Szaller, V. Kocsis, Y. Tokunaga, Y. Taguchi, Y. Tokura, B. Bernáth, D. L. Kamenskyi, I. Kézsmárki, S. Bordács, and K. Penc, Directional dichroism in the paramagnetic state of multiferroics: A case study of infrared light absorption in Sr2CoSi2O7 at high temperatures, Phys. Rev. B 99, 014410 (2019).
- Yokosuk et al. [2020] M. O. Yokosuk, H.-S. Kim, K. D. Hughey, J. Kim, A. V. Stier, K. R. O’Neal, J. Yang, S. A. Crooker, K. Haule, S.-W. Cheong, D. Vanderbilt, and J. L. Musfeldt, Nonreciprocal directional dichroism of a chiral magnet in the visible range, npj Quantum Materials 5, 10.1038/s41535-020-0224-6 (2020).
- Kimura et al. [2020a] K. Kimura, T. Katsuyoshi, Y. Sawada, S. Kimura, and T. Kimura, Imaging switchable magnetoelectric quadrupole domains via nonreciprocal linear dichroism, Communications Materials 1, 39 (2020a).
- Kimura et al. [2020b] S. Kimura, M. Matsumoto, and H. Tanaka, Electrical switching of the nonreciprocal directional microwave response in a triplon Bose-Einstein condensate, Phys. Rev. Lett. 124, 217401 (2020b).
- Ogino et al. [2020] M. Ogino, Y. Kaneko, Y. Tokura, and Y. Takahashi, Gyrotropic birefringence via electromagnon resonance in a multiferroic of spin origin, Phys. Rev. Research 2, 023345 (2020).
- Kimura et al. [2021] S. Kimura, N. Terada, M. Hagiwara, M. Matsumoto, and H. Tanaka, Electric dipole active magnetic resonance and nonreciprocal directional dichroism in magnetoelectric multiferroic materials in terahertz and millimeter wave regions, Appl. Magn. Reson. 10.1007/s00723-020-01307-w (2021).
- Toyoda et al. [2021] S. Toyoda, M. Fiebig, T. hisa Arima, Y. Tokura, and N. Ogawa, Nonreciprocal second harmonic generation in a magnetoelectric material, Sci. Adv. 7, 10.1126/sciadv.abe2793 (2021).
- Vít et al. [2021] J. Vít, J. Viirok, L. Peedu, T. Rõõm, U. Nagel, V. Kocsis, Y. Tokunaga, Y. Taguchi, Y. Tokura, I. Kézsmárki, P. Balla, K. Penc, J. Romhányi, and S. Bordács, In situ electric-field control of THz nonreciprocal directional dichroism in the multiferroic Ba2CoGe2O7, Phys. Rev. Lett. 127, 157201 (2021).
- Reschke et al. [2022] S. Reschke, D. G. Farkas, A. Strinić, S. Ghara, K. Guratinder, O. Zaharko, L. Prodan, V. Tsurkan, D. Szaller, S. Bordács, J. Deisenhofer, and I. Kézsmárki, Confirming the trilinear form of the optical magnetoelectric effect in the polar honeycomb antiferromagnet Co2Mo3O8, npj Quantum Materials 7, 10.1038/s41535-021-00417-3 (2022).
- Pimenov et al. [2006] A. Pimenov, A. A. Mukhin, V. Y. Ivanov, V. D. Travkin, A. M. Balbashov, and A. Loidl, Possible evidence for electromagnons in multiferroic manganites, Nat. Phys. 2, 97 (2006).
- Takahashi et al. [2012] Y. Takahashi, R. Shimano, Y. Kaneko, H. Murakawa, and Y. Tokura, Magnetoelectric resonance with electromagnons in a perovskite helimagnet, Nat. Phys. 8, 121 (2012).
- Kuzmenko et al. [2018] A. M. Kuzmenko, D. Szaller, T. Kain, V. Dziom, L. Weymann, A. Shuvaev, A. Pimenov, A. A. Mukhin, V. Y. Ivanov, I. A. Gudim, L. N. Bezmaternykh, and A. Pimenov, Switching of magnons by electric and magnetic fields in multiferroic borates, Phys. Rev. Lett. 120, 027203 (2018).
- Szaller et al. [2014] D. Szaller, S. Bordács, V. Kocsis, T. Rõõm, U. Nagel, and I. Kézsmárki, Effect of spin excitations with simultaneous magnetic- and electric-dipole character on the static magnetoelectric properties of multiferroic materials, Phys. Rev. B 89, 184419 (2014).
- Li et al. [2006] J. Li, V. O. Garlea, J. L. Zarestky, and D. Vaknin, Spin-waves in antiferromagnetic single-crystal LiFePO4, Phys. Rev. B 73, 024410 (2006).
- Toft-Petersen et al. [2015] R. Toft-Petersen, M. Reehuis, T. B. S. Jensen, N. H. Andersen, J. Li, M. D. Le, M. Laver, C. Niedermayer, B. Klemke, K. Lefmann, and D. Vaknin, Anomalous magnetic structure and spin dynamics in magnetoelectric LiFePO4, Phys. Rev. B 92, 024404 (2015).
- Yiu et al. [2017] Y. Yiu, M. D. Le, R. Toft-Petersen, G. Ehlers, R. J. McQueeney, and D. Vaknin, Hybrid excitations due to crystal field, spin-orbit coupling, and spin waves in LiFePO4, Phys. Rev. B 95, 104409 (2017).
- Szaller et al. [2017] D. Szaller, V. Kocsis, S. Bordács, T. Fehér, T. Rõõm, U. Nagel, H. Engelkamp, K. Ohgushi, and I. Kézsmárki, Magnetic resonances of multiferroic TbFe3(BO3)4, Phys. Rev. B 95, 024427 (2017).
- Szaller et al. [2020] D. Szaller, K. Szász, S. Bordács, J. Viirok, T. Rõõm, U. Nagel, A. Shuvaev, L. Weymann, A. Pimenov, A. A. Tsirlin, A. Jesche, L. Prodan, V. Tsurkan, and I. Kézsmárki, Magnetic anisotropy and exchange paths for octahedrally and tetrahedrally coordinated Mn2+ ions in the honeycomb multiferroic , Phys. Rev. B 102, 144410 (2020).
- Rõõm et al. [2020] T. Rõõm, J. Viirok, L. Peedu, U. Nagel, D. G. Farkas, D. Szaller, V. Kocsis, S. Bordács, I. Kézsmárki, D. L. Kamenskyi, H. Engelkamp, M. Ozerov, D. Smirnov, J. Krzystek, K. Thirunavukkuarasu, Y. Ozaki, Y. Tomioka, T. Ito, T. Datta, and R. S. Fishman, Magnetoelastic distortion of multiferroic BiFeO3 in the canted antiferromagnetic state, Phys. Rev. B 102, 214410 (2020).
- Farkas et al. [2021] D. G. Farkas, D. Szaller, I. Kézsmárki, U. Nagel, T. Rõõm, L. Peedu, J. Viirok, J. S. White, R. Cubitt, T. Ito, R. S. Fishman, and S. Bordács, Selection rules and dynamic magnetoelectric effect of the spin waves in multiferroic BiFeO3, Phys. Rev. B 104, 174429 (2021).
- Penc et al. [2012] K. Penc, J. Romhányi, T. Rõõm, U. Nagel, A. Antal, T. Fehér, A. Jánossy, H. Engelkamp, H. Murakawa, Y. Tokura, D. Szaller, S. Bordács, and I. Kézsmárki, Spin-stretching modes in anisotropic magnets: Spin-wave excitations in the multiferroic Ba2CoGe2O7, Phys. Rev. Lett. 108, 257203 (2012).
- Romhányi and Penc [2012] J. Romhányi and K. Penc, Multiboson spin-wave theory for Ba2CoGe2O7: A spin-3/2 easy-plane Néel antiferromagnet with strong single-ion anisotropy, Phys. Rev. B 86, 174428 (2012).
- Akaki et al. [2017] M. Akaki, D. Yoshizawa, A. Okutani, T. Kida, J. Romhányi, K. Penc, and M. Hagiwara, Direct observation of spin-quadrupolar excitations in Sr2CoSi2O7 by high-field electron spin resonance, Phys. Rev. B 96, 214406 (2017).
- Legros et al. [2021] A. Legros, S.-S. Zhang, X. Bai, H. Zhang, Z. Dun, W. A. Phelan, C. D. Batista, M. Mourigal, and N. Armitage, Observation of 4- and 6-magnon bound states in the spin-anisotropic frustrated antiferromagnet FeI2, Phys. Rev. Lett. 127, 267201 (2021).
- Bai et al. [2021] X. Bai, S.-S. Zhang, Z. Dun, H. Zhang, Q. Huang, H. Zhou, M. B. Stone, A. I. Kolesnikov, F. Ye, C. D. Batista, and M. Mourigal, Hybridized quadrupolar excitations in the spin-anisotropic frustrated magnet FeI2, Nat. Phys. 17, 467 (2021).
- Fishman et al. [2018] R. S. Fishman, J. A. Fernandez-Baca, and T. Rõõm, Spin-Wave Theory and its Applications to Neutron Scattering and THz Spectroscopy (IOP Concise Physics, Morgan and Claypool Publishers, 1210 Fifth Avenue, Suite 250, San Rafael, CA, 94901, USA, 2018).
- Chaix et al. [2014] L. Chaix, S. de Brion, S. Petit, R. Ballou, L.-P. Regnault, J. Ollivier, J.-B. Brubach, P. Roy, J. Debray, P. Lejay, A. Cano, E. Ressouche, and V. Simonet, Magneto- to electroactive transmutation of spin waves in ErMnO3, Phys Rev Lett 112, 137201 (2014).
- Strinić et al. [2020] A. Strinić, S. Reschke, K. V. Vasin, M. Schmidt, A. Loidl, V. Tsurkan, M. V. Eremin, and J. Deisenhofer, Magnetoelectric properties and low-energy excitations of multiferroic FeCr2S4, Phys Rev B 102, 134409 (2020).
- Santoro and Newnham [1967] R. P. Santoro and R. E. Newnham, Antiferromagnetism in LiFePO4, Acta Crystallogr. 22, 344 (1967).
- Werner et al. [2021] J. Werner, C. Neef, C. Koo, A. Ponomaryov, S. Zvyagin, and R. Klingeler, Exceptional field dependence of antiferromagnetic magnons in LiFePO4, Phys. Rev. B 103, 174406 (2021).
- Creer and Troup [1970] J. Creer and G. Troup, The magnetic susceptibility of LiFePO4 and LiCoPO4, Phys. Lett. A 32, 439 (1970).
- Werner et al. [2020] J. Werner, C. Neef, C. Koo, S. Zvyagin, A. Ponomaryov, and R. Klingeler, Antisite disorder in the battery material LiFePO4, Phys. Rev. Materials 4, 115403 (2020).
- Baker et al. [2011] P. J. Baker, I. Franke, F. L. Pratt, T. Lancaster, D. Prabhakaran, W. Hayes, and S. J. Blundell, Probing magnetic order in LiPO4 ( Ni, Co, Fe) and lithium diffusion in LixFePO4, Phys. Rev. B 84, 174403 (2011).
- García-Moreno et al. [2001] O. García-Moreno, M. Alvarez-Vega, F. Garcıá-Alvarado, J. García-Jaca, J. M. Gallardo-Amores, M. L. Sanjuán, and U. Amador, Influence of the structure on the electrochemical performance of lithium transition metal phosphates as cathodic materials in rechargeable lithium batteries: A new high-pressure form of LiPO4 ( Fe and Ni), Chem. Mater. 13, 1570 (2001).
- Portugall et al. [1999] O. Portugall, N. Puhlmann, H. U. Müller, M. Barczewski, I. Stolpe, and M. von Ortenberg, Megagauss magnetic field generation in single-turn coils: new frontiers for scientific experiments, J. Phys. D: Appl. Phys. 32, 2354 (1999).
- Takeyama et al. [2012] S. Takeyama, R. Sakakura, Y. H. Matsuda, A. Miyata, and M. Tokunaga, Precise magnetization measurements by parallel self-compensated induction coils in a vertical single-turn coil up to 103T, J. Phys. Soc. Japan 81, 014702 (2012).
- Turov [1963] E. A. Turov, Physical properties of magnetically ordered crystals (Moscow: Izdat. Acad. Sci. SSSR, 1963).
- Kittel [1948] C. Kittel, On the theory of ferromagnetic resonance absorption, Phys. Rev. 73, 155 (1948).
- Liang et al. [2008] G. Liang, K. Park, J. Li, R. E. Benson, D. Vaknin, J. T. Markert, and M. C. Croft, Anisotropy in magnetic properties and electronic structure of single-crystal LiFePO4, Phys. Rev. B 77, 064414 (2008).
- Werner et al. [2019] J. Werner, S. Sauerland, C. Koo, C. Neef, A. Pollithy, Y. Skourski, and R. Klingeler, High magnetic field phase diagram and failure of the magnetic Grüneisen scaling in LiFePO4, Phys. Rev. B 99, 214432 (2019).
- Gilbert [2004] T. L. Gilbert, A phenomenological theory of damping in ferromagnetic materials, IEEE Trans. Magn. 40, 3443 (2004).
- Peedu et al. [2019] L. Peedu, V. Kocsis, D. Szaller, J. Viirok, U. Nagel, T. Rõõm, D. G. Farkas, S. Bordács, D. L. Kamenskyi, U. Zeitler, Y. Tokunaga, Y. Taguchi, Y. Tokura, and I. Kézsmárki, Spin excitations of magnetoelectric LiNiPO4 in multiple magnetic phases, Phys. Rev. B 100, 024406 (2019).
- Stanislavchuk et al. [2017] T. Stanislavchuk, D. S. Middlemiss, J. S. Syzdek, Y. Janssen, R. Basistyy, A. A. Sirenko, P. G. Khalifah, C. Grey, and R. Kostecki, Infrared-active optical phonons in LiFePO4 single crystals, J. Appl. Phys. 122, 045107 (2017).
- Tian et al. [2008] W. Tian, J. Li, J. W. Lynn, J. L. Zarestky, and D. Vaknin, Spin dynamics in the magnetoelectric effect compound LiCoPO4, Phys. Rev. B 78, 184429 (2008).
- Halley and Silvera [1965] J. W. Halley and I. Silvera, Odd-exciton magnon interaction and explanation of anomalous far-infrared absorption in antiferromagnetic FeF2, Phys. Rev. Lett. 15, 654 (1965).
- Allen et al. [1966] S. J. Allen, R. Loudon, and P. L. Richards, Two-magnon absorption in antiferromagnetic MnF2, Phys. Rev. Lett. 16, 463 (1966).
- Loudon [1968] R. Loudon, Theory of infra-red and optical spectra of antiferromagnets, Adv. Phys. 17, 243 (1968), https://doi.org/10.1080/00018736800101296 .
- Tanaka and Nagasaka [1990] Y. Tanaka and K. Nagasaka, Far infrared activity due to two-magnon excitation in antiferromagnetic MEM(TCNQ)2, Solid State Commun 73, 735 (1990).
- Tanabe et al. [2005] Y. Tanabe, Y. Fujimaki, K. Kojima, S. Uchida, S. Onari, T. Matsuo, S. Azuma, and E. Hanamura, Direct optical excitation of two and three magnons in -Fe2O3, Low Temp Phys+ 31, 780 (2005).
- Filho et al. [2015] C. C. Filho, P. Gomes, A. García-Flores, G. Barberis, and E. Granado, Two-magnon raman scattering in LiMnPO4, J. Magn. Magn. Mater. 377, 430 (2015).
- Fert et al. [1978] A. Fert, D. Bertrand, J. Leotin, J. Ousset, J. Magariño, and J. Tuchendler, Excitation of two spin deviations by far infrared absorption in FeI2, Solid State Commun. 26, 693 (1978).
- Hildebrand et al. [1999] M. G. Hildebrand, A. Slepkov, M. Reedyk, G. Amow, J. E. Greedan, and D. A. Crandles, Far-infrared optical properties of antiferromagnetic SmTiO3, Phys Rev B 59, 6938 (1999).
- Richards [1967] P. L. Richards, Far infrared absorption by two magnon excitations in antiferromagnets, J. Appl. Phys. 38, 1500 (1967), http://dx.doi.org/10.1063/1.1709683 .
- Harris et al. [2020] C. R. Harris, K. J. Millman, S. J. van der Walt, R. Gommers, P. Virtanen, D. Cournapeau, E. Wieser, J. Taylor, S. Berg, N. J. Smith, R. Kern, M. Picus, S. Hoyer, M. H. van Kerkwijk, M. Brett, A. Haldane, J. Fernández del Río, M. Wiebe, P. Peterson, P. Gérard-Marchant, K. Sheppard, T. Reddy, W. Weckesser, H. Abbasi, C. Gohlke, and T. E. Oliphant, Array programming with NumPy, Nature 585, 357–362 (2020).
- Hunter [2007] J. D. Hunter, Matplotlib: A 2D graphics environment, Computing in Science Engineering 9, 90 (2007).
- Virtanen et al. [2020] P. Virtanen, R. Gommers, T. E. Oliphant, M. Haberland, T. Reddy, D. Cournapeau, E. Burovski, P. Peterson, W. Weckesser, J. Bright, S. J. van der Walt, M. Brett, J. Wilson, K. J. Millman, N. Mayorov, A. R. J. Nelson, E. Jones, R. Kern, E. Larson, C. J. Carey, İ. Polat, Y. Feng, E. W. Moore, J. VanderPlas, D. Laxalde, J. Perktold, R. Cimrman, I. Henriksen, E. A. Quintero, C. R. Harris, A. M. Archibald, A. H. Ribeiro, F. Pedregosa, P. van Mulbregt, and SciPy 1.0 Contributors, SciPy 1.0: Fundamental algorithms for scientific computing in Python, Nat. Methods 17, 261 (2020).
- Wes McKinney [2010] Wes McKinney, Data structures for statistical computing in Python, in Proceedings of the 9th Python in Science Conference, edited by Stéfan van der Walt and Jarrod Millman (2010) pp. 56 – 61.