spacing=nonfrench
Dashlet: Taming Swipe Uncertainty for Robust Short Video Streaming
Zhuqi Li, Yaxiong Xie, Ravi Netravali, Kyle Jamieson
Abstract
Short video streaming applications have recently gained substantial traction, but the non-linear video presentation they afford swiping users fundamentally changes the problem of maximizing user quality of experience in the face of the vagaries of network throughput and user swipe timing. This paper describes the design and implementation of Dashlet, a system tailored for high quality of experience in short video streaming applications. With the insights we glean from an in-the-wild TikTok performance study and a user study focused on swipe patterns, Dashlet proposes a novel out-of-order video chunk pre-buffering mechanism that leverages a simple, non machine learning-based model of users’ swipe statistics to determine the pre-buffering order and bitrate. The net result is a system that achieves 77–99% of an oracle system’s QoE and outperforms TikTok by 43.9-45.1, while also reducing by 30% the number of bytes wasted on downloaded video that is never watched.
1 Introduction
Short video streaming applications like TikTok and YouTube Shorts have rapidly risen in popularity, attracting billions of active users per month [33, 32, 41] and consistently topping popularity lists for mobile apps [34]. Unlike typical video streaming, the median duration of short videos is around 14 seconds [4]. During operation, these apps generate an ordered playlist of short videos (e.g., based on a search or user-specific recommendations), and users watch them serially, with the ability to swipe from one to the next at any time. To provide an immersive experience and keep users engaged, short video streaming applications should minimize the video rebuffering time and maximize the video bitrate, which is modeled by quality-of-experience (QoE) [3, 12, 14, 1].
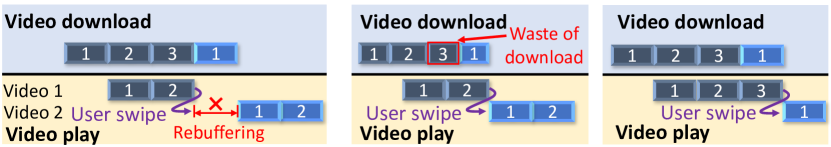
Although the aforementioned goals are consistent with those in traditional video streaming scenarios, existing ABR algorithms [23, 40, 2, 37, 17] are ill-suited for interactive, short videos. The reason is that predicting user swipes is difficult, and swipe times dictate both which video content will be viewed and when during a session. However, existing algorithms assume that the user will watch content sequentially to completion, and will hence buffer chunks (i.e., multi-second blocks of video) in that order. The deleterious effects, shown in Figure 1, are twofold: (1) many chunks may be downloaded in the current video but never viewed if the user swipes before their playback, wasting resources and adding delays for the chunks that are required, and (2) users may swipe to the next video and incur significant rebuffering because that video’s chunks have not been downloaded yet.
The fundamental challenge is that there are far too many possible chunk viewing sequences—the user may swipe at any position in each short video, and expects seamless (i.e., no stalls) playback for both the current video, and the next one upon a swipe. The problem thus becomes how to find (at any time during playback) a buffering sequence of chunks in this large search space that maximizes QoE by simultaneously minimizing rebuffering time and wasted bandwidth.
To understand how commercial short streaming platforms attempt to address these challenges, we conducted a detailed examination of TikTok in the wild (§2). Our key finding is that TikTok does download chunks out of order, but follows a generic algorithm that hedges against immediate rebuffering in the face of fast user swipes (it always pre-buffers the first chunk for the next five videos regardless of network conditions, user patterns, and/or video). This, however, entails substantial QoE penalties and wasted data consumption, as we will show via results from our own study of user swipe patterns across two distinct sets of users on a college campus and Amazon Mechanical Turk (§3). Specifically, we find substantial heterogeneity in the swipe patterns across users, with each warranting a different chunk downloading strategy.
A naïve solution would be to simply predict user swipes—if accurate, this would reduce the problem to a traditional streaming setting since chunk viewing sequences would be known a priori. However, predicting user behavior in interactive applications has consistently proven to be difficult [6, 27, 22]. Instead, we take a more fundamental approach that is rooted in an understanding of where swipe predictions are actually helpful (and actionable).
We present Dashlet, a new video streaming algorithm for short video applications (§4). The underlying insight behind Dashlet is that application playback constraints predetermine the relative priorities between many chunks that are candidates for buffering. More specifically, (1) later chunks in a video are only reachable via earlier ones, and (2) later videos are only reachable via swipes from earlier ones. To prioritize among the remaining chunks, e.g., the next chunk in a given video vs. the first chunk in the next video, only coarse grained information about swipe timings in videos is required. We show, via our user study, that although users tend to exhibit multimodal swipe patterns (complicating chunk prioritization) across videos, distributions from aggregating users’ swipes per video provide a clear enough signal about which mode to expect. This information is readily available to current short video platforms, and our finding is spiritually aligned with past studies that highlight similarities in user engagement for certain video content [43, 36].
Building on this, Dashlet develops functions that characterize the expected rebuffering time for each potential chunk that could be downloaded, as a continuous function over both the expected download and playback times. These functions embed the aforementioned inter-chunk relationships, as well as rough swipe likelihoods at video start and end. Using these functions, Dashlet employs a greedy algorithm to determine the set of ordered chunks that should be downloaded in the current time horizon to minimize expected rebuffering delays for a given network estimate and across potential viewing sequences. This buffer sequence then feeds directly into a traditional ABR algorithm, which determine bitrates for those chunks that maximize overall QoE. Dashlet further improves upon existing short video systems by not prematurely binding bit rate decisions across entire short videos, and not letting the network idle at any point in time.
We have implemented Dashlet in the DASH framework [8], and compare with the TikTok mobile app on a wide range of mobile network conditions, 100 short videos, and real user swipe traces (from our user studies). Across these conditions, we find that Dashlet achieves QoE values within 77.3-98.6% of an oracle strategy (based on MPC [40]), outperforming TikTok by 43.9-45.1 (85.3-246.2% higher bitrate rewards, 102.4-128.4 lower rebuffering penalties, and 30% less wasted bandwidth). Further, Dashlet is largely tolerant to errors in swipe distributions: QoE degradations are only 10% with distribution errors of 50%. We will open source our datasets and implementation post publication.
2 A TikTok Case Study
We examine how TikTok, a state-of-the-art short video app, operates. We first describe its basic architecture (§2.1), before analyzing its operation and limitations (§2.2).
2.1 Short Video Streaming Primer
In contrast to traditional streaming apps that divide video into chunks of equal time duration, TikTok instead splits each video into size-based chunks. For each supported bitrate, if the video file is smaller than 1 MB, TikTok treats the entire video as one chunk; else, the first chunk is the first 1 MB, and the entire remaining video is grouped into a second chunk. As we will highlight below, the rationale for this chunking strategy is to enable more stable (and consistent) download delays as TikTok pre-buffers the first chunk for subsequent videos (to cope with swipe uncertainty); chunking in terms of bytes eliminates variance from variable bitrate encoding.
Upon receiving a client session request either via a keyword search or category selection (e.g., recommended videos), the server generates an ordered list of short videos to serve (Figure 2). The server then ships a manifest file to the client which embeds the URL, as well as information about the number of chunks (multi-second blocks of video) and available bitrates, per video in the ordered list. The client operates much like a traditional streaming player (e.g., DASH), maintaining a playback buffer for downloaded video and employing an adaptive bitrate (ABR) algorithm to determine what chunk to download next, when, and at what bitrate.
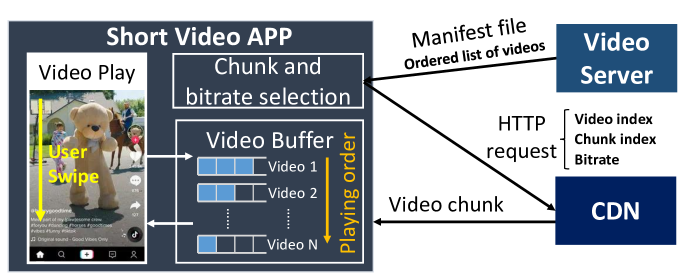
A key difference between traditional and short video streaming is that the client maintains one logical buffer per video in the server-provided manifest file. Video playback operates sequentially within each logical buffer and across buffers (in the specified order); user swipes and video completion trigger the playback to move to the head of the buffer for the next video. To cope with such semantics, ABR algorithms for short videos have the ability to download chunks for any of the videos in the manifest file at any time.
TikTok provides four bitrate options for each video: 480p, 560p low, 560p high, and 720p, with bitrate adaptation occurring only at video-level (and not chunk-level) granularity. We hypothesize this is because the first 1 MB of a video encoded at different bitrates corresponds to different time durations, precluding seamless bitrate switches for the latter chunk, i.e., content would be missed or repeated. As we will discuss, such constraints significantly limit TikTok from adapting to variations in network capacity during user sessions.
To retain flexibility in recommendations, each manifest file contains information for an ordered group of only 10 videos. The client requests a new manifest file after it downloads all the first chunks of the 10 videos listed in the current one.
2.2 Analysis of TikTok
To study TikTok in a controlled and systematic manner, we perform our analysis over emulated networks using Mahimahi [24]. We mirror the screen of Android TikTok App to a Linux desktop with scrcpy [29] and use the pyautogui tool [25] to replay aggregated user swipe traces that were collected from our user study (described in §3). During experiments, we use the mitmproxy [5] to collect and decrypt TikTok’s network traffic. From the deciphered HTTP messages and headers, we are able to extract for each requested chunk, the video that it pertains to, its index in that video, the requested bitrate, and the download start/end time. Finally, we have developed a screen analysis tool using pyautogui and opencv [18] to record duration of each rebuffering event. §6.1 further details our setup.
2.2.1 Chunk Download Control
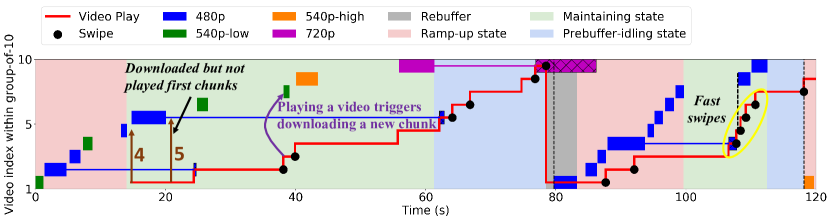
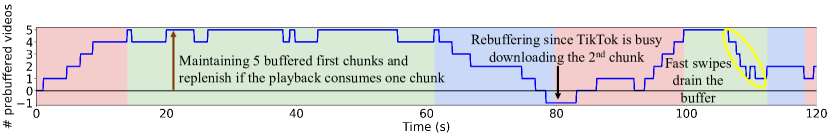
In this section, we introduce TikTok’s chunk download ordering and scheduling which depend both on instantaneous network throughput and the client’s internal buffer status. Figure 3(a) serves as the foundation of our analysis, illustrating the download decisions (i.e., order and timing of chunk downloads across videos, bitrates used each time) that TikTok makes during a representative two-minute session in which we replay a 21-swipe user trace. We plot client-side playback buffer occupancy in Figure 3(b), which shows the number of videos with at least one downloaded (but unplayed) chunk. We see that TikTok spends most of its time downloading the first chunk of videos, and downloads the second chunk when and only when the video starts to play, e.g., the download of the second chunk of video two and the play-start of video two start simultaneously at seconds.
Our analysis indicates that TikTok proceeds according to three discrete states, cycling among the three in order to handle one group-of-ten videos. When the app starts and at the beginning of every group-of-ten, TikTok starts in a ramping-up state where it continuously downloads the first chunks to build up the buffer as quick as possible.
After accumulating five first chunks at seconds, TikTok starts to play the buffered video and at the same time enters the maintaining state, where TikTok aims to maintain a constant five first chunks in its buffer. When TikTok switches to play a new video (due to user swipe or the playback reaching the end of a video), the player fetches one first chunk from the buffer, triggering TikTok to immediately initiate the download of the first chunk of next video listed in the manifest file, as indicated by the additional download events corresponding to either swipes or video changes due to end of video in the green “maintaining state” regions of Figure 3(a). We see in Figure 3(b) that as the downloading of each first chunk finishes, buffer levels return to five, high water mark buffering level TikTok has chosen.
The advantage of being in the maintaining state is that in this state, TikTok is quite resilient to quick user swipes. For example, in the second group-of-ten of Figure 3 (), the user swipes early in multiple consecutive videos, quickly draining the buffer. Even under such challenging circumstances, TikTok experiences no rebuffering since its buffer contains five first chunks.
Finally, after downloading all the first chunks of the 10 videos listed in the current manifest file, TikTok enters the prebuffer-idling state, where TikTok stops initiating any new downloads of first chunks. Meanwhile, TikTok continues video playback, consuming video chunks in its buffer, so buffer occupancy decreases monotonically in this state, as shown in Figure 3(b). Our hypothetical explanation of this idle period is that TikTok is waiting to measure the user’s reaction (swiping early means they might not be interested in the content) to the videos TikTok recommends in last round (manifest file), so it can assess its recommendation quality and adjust the subsequent round’s recommendation before sending the next manifest file.
In contrast to the resilience of the maintaining state, TikTok becomes somewhat vulnerable in the prebuffer-idling state, where TikTok drains the buffer by itself. For example, TikTok experiences rebuffering in the middle of two video groups in Figure 3. At that moment, TikTok has no buffered first chunk and at the same time spends a long time downloading the second chunk of the current video, leaving no time budget for downloading the first chunk of next video. In such a case, one user swipe results in rebuffering.
When the user watches nine out of 10 videos listed in the current manifest file, TikTok exits the prebuffer-idling state and begins afresh in the ramp-up state, to download the videos listed in the next manifest file. We observe from Figure 3 that TikTok repeats these three states every group-of-ten videos listed in the manifest file.
2.2.2 Network and Swipe Input Adaptation
We now investigate the effects of swipes, buffer occupancy, and the network on TikTok’s bitrate and buffering choices.
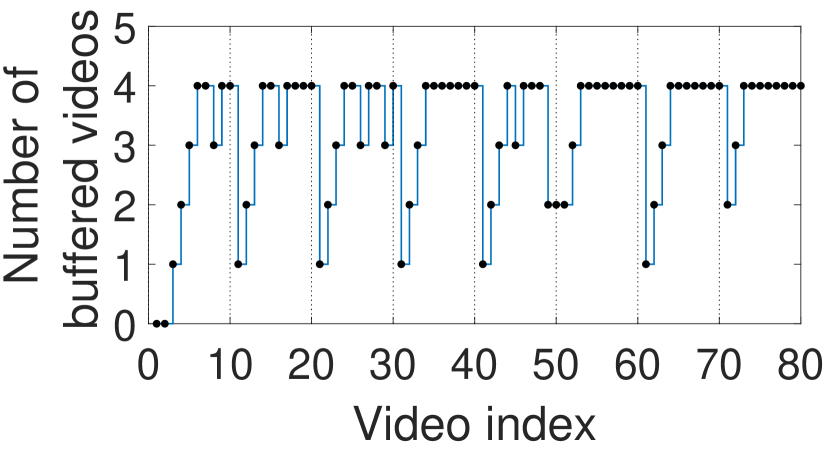
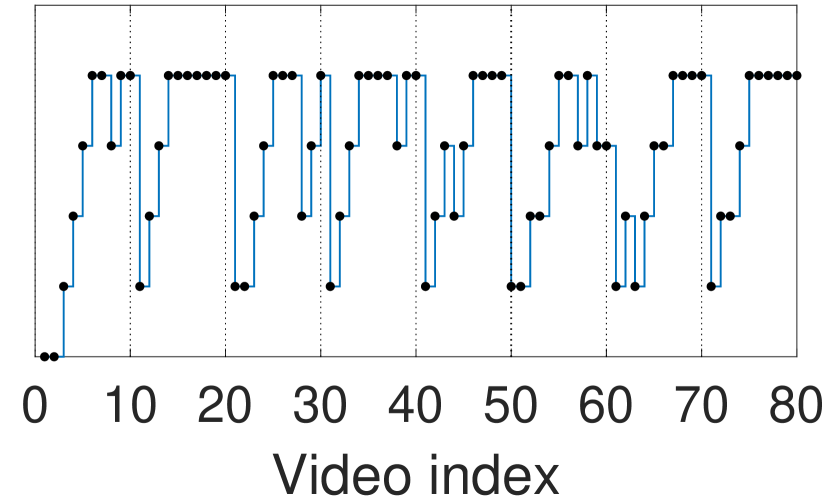
To measure the impact of network throughput on the TikTok’s buffering strategy, we conduct a controlled experiment by setting the network capacity to 10 and 3 Mbit/s using Mahimahi. We plot the number of buffered first chunks at the moment TikTok initiates a downloading of the first chunks in Figure 4. Combing Figure 4(a) and 4(b), we see that TikTok adopts the same buffering strategy even when the network capacity decreases. As we will introduce in the following section that the network throughput mainly affects the selected bitrate not the buffering strategy.
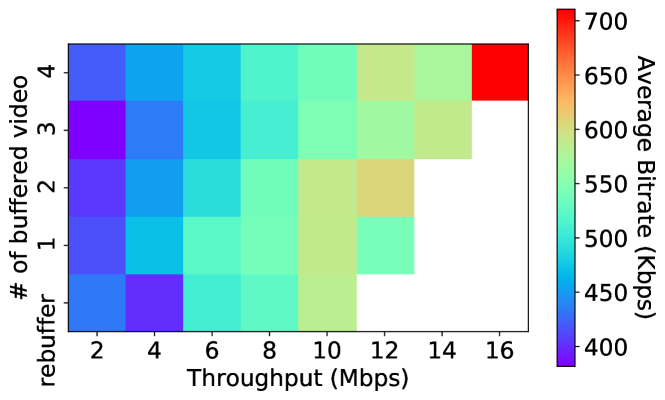
Next, we analyze the joint impact of network throughput and buffering status on the bitrate decisions TikTok makes. We collect instantaneous network throughput and buffer status coupled with TikTok’s bitrate decisions, for 5,300 videos, and plot the results in Figure 5. In the figure, the x-axis is the network throughput of the one-second period before the downloading of that video, i.e., the time period within which TikTok makes its decisions about the bitrate. The y-axis is the number of downloaded first chunks in the buffer. The color of a tile represents the average bitrate of the video, which is given by where is the size of the video in bits and is the length of the video in seconds. Some tiles are not colored because the combination of the throughput and buffer status is not observed during our measurement, e.g., when the throughput is 16 Mbit/s, we always observe four downloaded first chunks in the buffer. We observe that bitrate decisions correlate positively with network throughput, but observe no evidence for correlation with buffer status.
2.2.3 Limitations of Current Short Video Streaming
Despite pre-buffering the beginnings of short videos, TikTok has a fundamentally static approach to coping with the uncertainty of future user swipes, with no adaptation across different videos or users. This static approach is often too cautious or aggressive, manifesting in two particular ways, with the intended goal of minimizing issues with fast swipes:
Lack of swipe prediction. TikTok prioritizes the downloading of the first chunk, assuming that the user always swipes frequently, and delays the downloading of the second chunk to the beginning of the video playing. As we will show in the next section however, there are indeed some users swipe early when watching a video, but there also exists a significant number of users who watch most of many videos and swipe at the end or not at all. So, the urgency of downloading the second varies with users and videos: a fixed rule cannot handle all the cases.
Premature bitrate binding. TikTok groups the first 1 MB data of each video into the first chunk, which allows for some certainty in chunk download completion times, but TikTok selects the bitrate for both chunks according to the network conditions present during the first chunk, prematurely binding the system into that fixed bitrate for the both the first and second chunks. By design, there is often a large time lag between the downloading of the first and second chunks of a video, as shown in Figure 3(a), which our comprehensive measurements confirm (the median gap between first and second chunk downloads is 25 s., with an interquartile range of 23 s.), resulting in a potential mismatch with network throughput conditions that change in this interim time period.
Network Idling.
As shown in Figure 3(a), TikTok leaves a significant among of time idling without downloading video content. In the contrast, the bitrate of videos still has room to improve. This also calls for a better ABR algorithm to stream higher bitrate video by utilizing the idle time in a better way.
To understand the mismatch between TikTok’s generic rule and the varying user swipe patterns, in the next section, we characterize the swipe patterns across real users and videos via two user studies.
3 Characterizing User Swipes
To better understand the nature of user interactions (i.e., swipes) with short video applications, we conducted two IRB-approved user studies. In each study, we present users with a web-based short video streaming service that resembles the interface offered by TikTok We considered 500 popular short videos gathered by crawling the videos displayed on the TikTok landing page over time. The videos were randomly ordered per session, and each user watches 20 minutes of video with the ability to swipe freely (all swipes are recorded). Note that the number of videos watched by a given user depends on the number of swipes they performed.
For generality, we performed two versions of this study:
1. College campus: we recruit 25 student volunteers who collectively swipe 3,069 across the study.
2. Amazon Mechanical Turk (“MTurk”): we recruit 258 different users. To ensure active user participation, we augment our web application to inject random interactivity tests that ask users to swipe within 10 seconds. Users who fail to swipe in time are entirely excluded from the study; users who do swipe continue the experience, but we exclude the forced swipe(s) from our final dataset. In total, we retain data from 133 workers, which covers 15,344 swipes.
Overall swipe distributions.
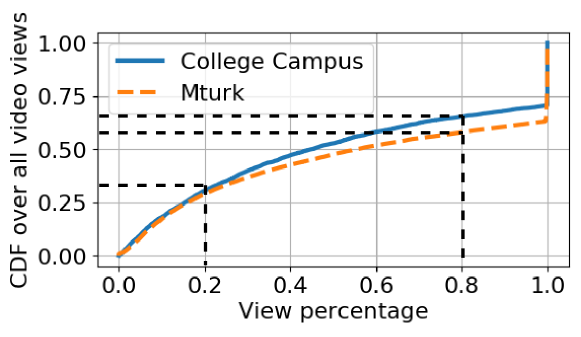
Figure 6 shows the distribution of swipe times across all video-user pairs in both studies. As shown, users are most likely to swipe either soon after the video playback begins or at the tail end of the video (manually or via auto-swiping once the video completes); this is consistent with prior studies on user swipe patterns [44]. For instance, 29% and 42% of swipes from MTurk users are within the first 20% or last 20% of videos, respectively. Swipes between these two endpoints occur, but far less often and with increasingly low likelihood as users watch more videos, e.g., only 6% of swipes in the College Campus dataset are in the 60–80% of videos.
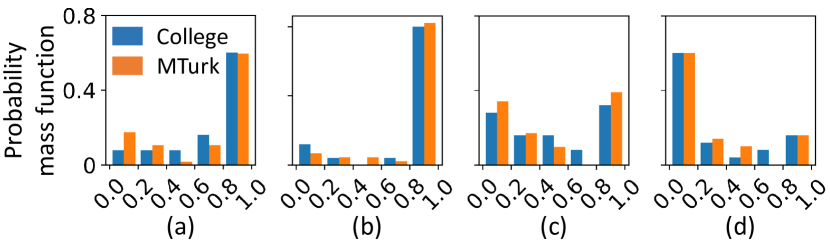
Swipe distributions per video.
Figure 7 shows the swipe probabilities for four representative videos, aggregated across the users who watched each one in the two studies. As shown, different videos can exhibit significantly different patterns in terms of user swipe probabilities. For instance, over 60% of swipes in videos (a) and 80% of swipes in videos (d) come within the last few seconds of the videos (indicating low swipe probabilities for those videos). Video (c) exhibits the opposite pattern—60% of swipes in the first 20% of the video (indicating high swipe probabilities)—while swipes in (b) are more evenly distributed across the start and end of the video. Perhaps more importantly, we observe substantial stability in the swipe distributions per video across different user datasets: KL divergence values between the MTurk and College Campus datasets are 0.2 and 0.8 for the median and 95th percentile videos, respectively.
Takeaway.
Despite general similarities in their swipe patterns, users follow a few different modes of swiping (e.g., swiping early in the chunk vs. not at all), each of which warrants a different buffering strategy to ensure high QoE. Fortunately, cross-user swipe data that is aggregated per video provides a relatively stable indicator as to how likely swipes are (and will be) in a given video, and (more coarsely) at what part of the video they will occur. We show in §4 how Dashlet leverages this coarse information – which is readily available at existing short video servers – to make robust buffering decisions that handle cross-user swipe traces.
4 Design
The core idea behind Dashlet is to leverage the stability in swipe distributions across videos (§3) to get a coarse sense of the likelihood of swipes at different video chunks. Coupling this information with constraints on inter-chunk viewing sequences intrinsic to short video applications, Dashlet models the expected rebuffering time for each potential chunk as a continuous function over the expected download and playback times (§4.1). Dashlet then employs a greedy algorithm atop those functions to find a chunk buffering sequence that minimizes the expected rebuffering delay over a time horizon for a given network throughput estimate, and across different user viewing sequences. Lastly, Dashlet feeds that buffering sequence into a bitrate selection algorithm (RobustMPC [40] in our implementation) that determines the bitrate to use per chunk to optimize overall QoE (§4.2).
4.1 Forecasting Rebuffering Delay
Dashlet’s expected rebuffering functions aim to quantify user-perceived delays across different chunk download times and viewing sequences. For clarity of exposition, we begin by explaining the construction of these functions in a discrete setting where users can only swipe at chunk boundaries; we then extend the discussion to incorporate continuous functions and arbitrarily-timed user swipes.
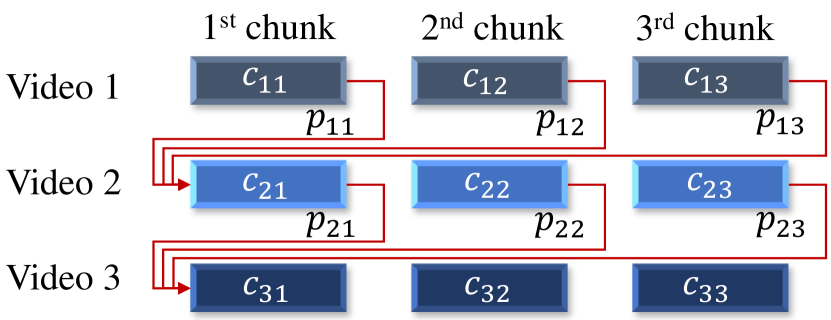
System Model. Short video apps follow the flow shown in Figure 10. Each video consists of multiple chunks of chunk time . Within the video with chunks, if the user does not swipe, the video player plays its chunks sequentially, where is the chunk index. When playback reaches the end of the video or the user swipes, the player jumps to the first chunk of the next video. Since user swipe distributions vary across videos (§3), we denote the probability that the user swipes after watching chunk as . The list of the chunks the user watches is a viewing sequence
| (1) |
where the user views the first chunks of the video, assuming that the user watches videos in total. Then the probability distribution of is . We define , the number of chunks that a user has watched prior to chunk :
| (2) |
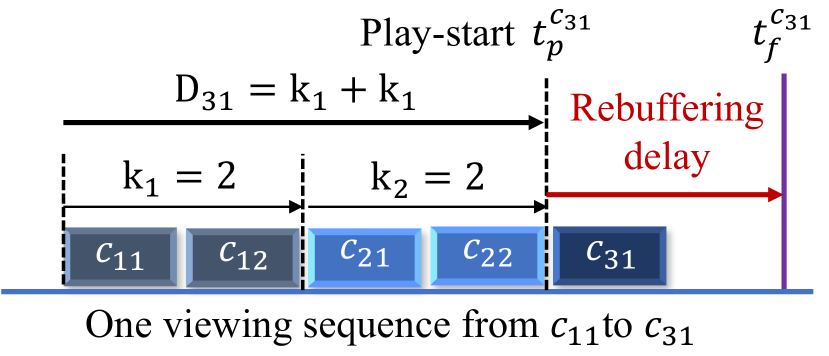
By knowing the number of chunks that a user has watched before , the playback start time of then will be . As shown in Figure 10, the expected rebuffering delay for some chunk depends on the relationship between the chunk’s play start time and download finish time . There exists no rebuffering if the chunk downloading finishes before the play start time. Otherwise, rebuffering happens and the time difference between and tells us ’s rebuffering delay:
| (3) |
The play start time of each chunk is determined by the viewing sequence , as shown in Figure 10. Since our goal is to schedule ’s download to minimize rebuffering, we now formulate a reward function to meet this goal, parameterized on and averaging over all possible viewing sequences (which are not under our control). The expected rebuffering delay of chunk given that chunk’s download finish time , across all possible viewing sequences, is:
| (4) |
where probability represents how likely a specific viewing sequence will appear based on user swipe distribution data, is ’s play start time in , and is the set of all possible viewing sequences.
To calculate the expected rebuffering delay for a specific chunk, we need to enumerate all possible viewing sequences that reach this chunk, as Eq. 4 shows. For each sequence, we need to compute how likely this sequence will appear based on the user swipe probability and then determine the play start time of that specific chunk. Based on short video chunk playback constraints (§1, p. 1), we propose separate algorithms for calculating the expected rebuffering delay of a video’s first chunk, and remaining chunks, respectively.
First chunk of a video.
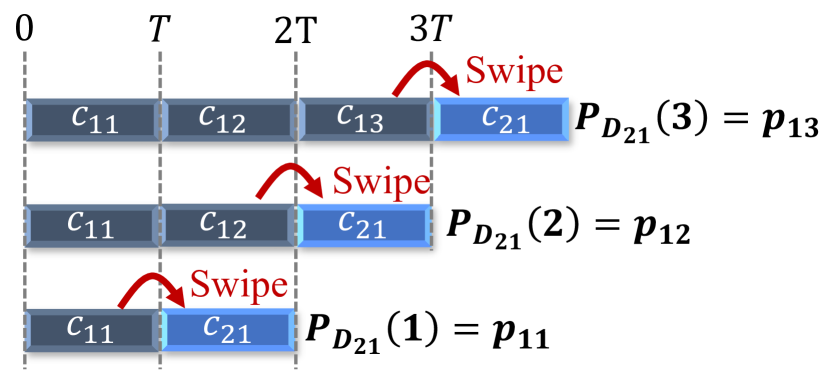
The number of possible viewing sequences between chunk one of video one () and chunk one of video () increases exponentially with . On the other hand, the number of sequences from the first chunk of the previous video to the first chunk of the current video is bounded by the number of chunks in the former. For example, as shown in Figure 10, there are only three possible viewing sequences from chunk to chunk . We therefore enumerate the viewing sequences in a recursive manner: deriving the viewing sequences that reach the first chunk of the video based on the viewing sequence of the first chunk of the video.
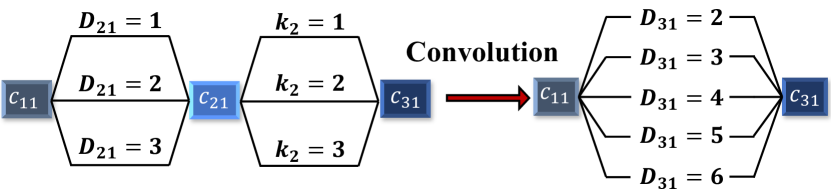
We start from the base case, viewing sequences from to . Figure 10 lists all three possible viewing sequences that start from : we see that random variable (cf. Eq. 2). Similarly, as shown in Figure 10, (cf. Eq. 1). The distribution of random variable can then be calculated as:
| (5) |
where means the probability of there are chunks before chunk is viewed. This formula by definition is the operation of convolution between and , as shown in Figure 11. Without losing generality, the number of chunks that user watches before chunk , , is the sum of and . Therefore the distribution of is the convolution of and :
| (6) |
With the knowledge of ’s distribution for the first chunk of all the videos, we calculate the expected rebuffering delay of chunk , as the function of download finish time:
| (7) |
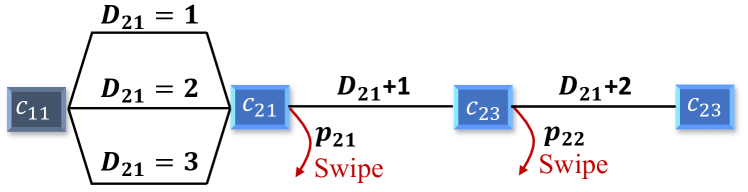
Remaining chunks in a video.
There exist only one possible viewing sequence from the first chunk to later chunks in the same video. For example, as shown in Figure 12, the video chunk will be played when and only when the user watches the video continuously without swiping. For non-first chunk , the number of chunks that user watched before it, , is the summation between the and since the user has to watch the first chunks in video before starting watch it. Then the distribution of should be the distribution of delayed by chunks. In addition, the user might swipe to the next video before watching . To summarize this, we can calculate the distribution of for non-first chunk as:
| (8) |
With the distribution of , we follow the same procedure to calculate expected rebuffering time for remaining chunks in a video, according to Eq. 7.
Arbitrary user swipes.
In reality, the users’ swipe does not only happen after a chunk finishes. We extend our analysis to allow the user to swipe at arbitrary time points when playing video. If the user (continuously-valued) viewing time for video is , the PDF of is . The play start time of chunk , , is a random variable, with probability density function . For the first chunk of video , its playing start time is also the summation of the playing start time of the previous video and the time the user spends watching the previous video . Following a similar principle, we compute for the first chunk of a video as
| (9) |
For subsequent chunks , we also calculate the playing start distribution based on the first chunk
| (10) |
Then the expected rebuffering function can be calculated similarly to Eq. 7:
| (11) |
4.2 Determining Buffering Sequences
Given the preceding computation of expected rebuffering delay for each chunk, Dashlet’s next task is to determine an order of chunks to download (i.e., a buffering sequence) that minimizes expected rebuffering delay over a lookahead horizon. Prior schemes (e.g., MPC [40]) can then be used to determine the bitrates for those chunks to optimize overall QoE for the horizon. However, unlike prior schemes, the horizon that we use is based on time (not chunks). The reason is that different user swipe patterns can translate into different numbers of viewed chunks—using a horizon sized to a fixed number of chunks could result in optimization over very short viewing times (negating the effects of longer-term planning). Our current implementation uses a lookahead window of 25 seconds based on empirical observations, which is equivalent to the five chunks MPC uses. Intuitively, coarse-grained swipe information suffice to determine download order for video chunks. Chunk ordering relies primarily on whether the user swipes at the beginning of the video or not: e.g. if the user is highly likely to not swipe in chunk , the algorithm then needs to prioritize chunk over chunk .
4.2.1 Selecting the candidate chunk set
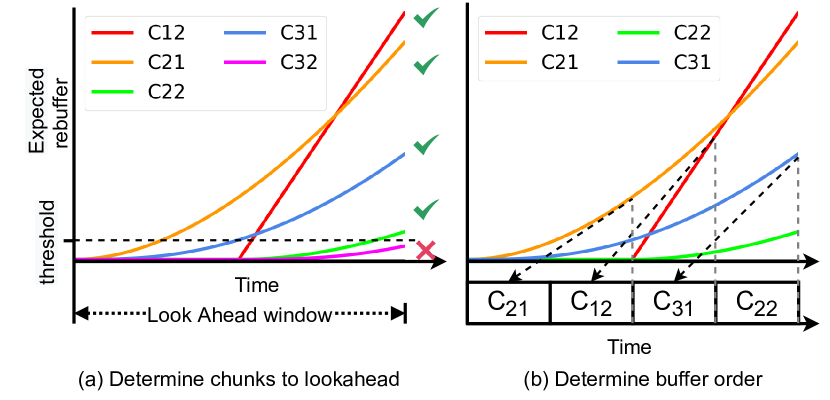
To determine the set of chunks to consider, we enforce a threshold on the minimum rebuffering penalty that each chunk is expected to incur at the end of the horizon if it is not included in the buffer sequence (Figure 13(b)). Chunks whose rebuffering penalty falls below the threshold are deemed as unlikely to be viewed during the horizon ( in Figure 13(a)), and thus low priority for inclusion in the buffer sequence. Note that buffer sequences are constructed each time a chunk download completes, so an excluded chunk for one horizon may still be downloaded shortly (via inclusion in the next horizon’s buffer sequence). We use an empirically-configured value of for threshold, which is the inverse of the rebuffering penalty weight in our target QoE function.
Using the set of chunks to consider, our final task is to order them in a manner that minimizes expected rebuffering penalties. Our approach is to assign a bitrate to each chunk, and then use an estimate of the network bandwidth to determine when a chunk will complete donwloading (assuming some start time); this, in turn, allows us to compute the expected rebuffering time per chunk using the functions from §4.1. However, to do this with low computational complexity, since download decisions must be fast, we temporarily assume an equal bitrate per chunk that is set to the maximum bitrate which ensures that all chunks in the list will complete downloading before the horizon completes. Although exclusion of per-chunk bitrate decisions here can result in suboptimal orderings, we find these effects to be minimal (as evidenced by Dashlet closeness to the optimal scheme in §6.2). The reason is that, as discussed in §4.1, priorities between chunks (and potential per-chunk viewing times) are largely dictated by viewing constraints imposed by the application. Thus, minor discrepancies in bitrates across chunks are thus unlikely to flip the priority order among them.
4.2.2 Priority-ordering the buffer sequence
To sort our list of chunks into a buffer sequence, we follow a greedy algorithm, whereby we partition the horizon into chunk-sized slots. For a given slot , we select the chunk that will incur the largest additional rebuffering penalty if it were to be scheduled in slot rather than . Figure 13(b) shows this process for a scenario in which chunk just completed downloading: is assigned to slot 1 as its rebuffering penalty jumps the most between slots 1 and 2; is next as it has the highest penalty for not going in slot 2, and so on. Finally, using the generated buffer sequence, Dashlet applies MPC’s algorithm to determine the bitrate for each chunk in the buffer sequence in a way that optimizes the entire QoE (not just minimizing rebuffering) for the horizon according to the forecasted network throughput, i.e., the harmonic mean over the observed throughputs in the last 5 chunk downloads.
5 Implementation
Dashlet makes no change to the CDN/server side so our system can be easily deployed client side. Dashlet includes one control module and multiple buffer modules. Each buffer module manages the video playback of one short video, including downloading chunks, tracking playback progress, and reporting buffer status. We reuse the DASH.js playback management for the buffer modules. The control module manages scheduling across short videos, collecting estimated throughput and buffer length from each buffer module. With the collected data, control module runs Dashlet’s algorithm to schedule the video buffering. Based on the algorithm’s output, it assigns the quota to the buffer module that is assigned to download the next video chunk. The quota includes the target video bitrate and the target download finish time. Once the buffer module receives the quota, it sends an HTTP request with target bitrate to the CDN to download the corresponding video chunk. A call back function is set to report the status to control module in case the download time exceeds the target download finish time. The control module schedules the video buffering when the call back function for target download time is triggered, the chunk download finishes, or the user swipes. Similar to Pensieve [23], we also use an ABR server to run Dashlet’s algorithm on the same machine as the client. The control module communicates with the ABR server using XMLHttpRequests locally.
6 Evaluation
We evaluate Dashlet across a variety of mobile network conditions, real user swipe traces, and videos. Our key findings:
-
•
Dashlet achieves QoE values within 77.3-98.6% of the optimal, outperforming TikTok by 43.9-45.1.
-
•
In comparison to Tiktok, Dashlet increases QoE rewards for video bitrates by 85.3-246.2%, while also incurring 102.4-128.4 lower rebuffering penalties. Further, data wastage is 30% lower with Dashlet than TikTok.
-
•
Dashlet is largely tolerant of errors in swipe distributions: with errors of 50%, Dashlet makes the correct buffering decisions 96.5% of the time, yielding QoE reductions of only 10% compared to when no distribution errors exist.
6.1 Methodology
Baselines.
We compare Dashlet with the following systems:
-
•
TikTok: we directly run the TikTok Android App (v. 15.7.46). To report QoE values and to analyze TikTok’s behavior in our experiments, we employ the man-in-the-middle setup described in §2.2.
-
•
Oracle: we also run an ‘oracle’ baseline that serves as an upper bound for QoE. The oracle is the RobustMPC algorithm [40] running with perfect (a priori) knowledge of both the user swipe traces and network throughput in each experiment. With that information, the algorithm knows the upcoming video viewing sequence at all times, and can thus pick the buffer sequences (and bitrates) that directly optimize QoE for the current network conditions.
Overall setup.
All video clients run on a rooted Pixel 2 phone (Android 10). The Oracle algorithm and Dashlet run in the Google Chrome browser (v. 97.0.4692.87), and contact a local desktop which houses the videos accessed in each experiment (described below). In contrast, TikTok runs as an unmodified, native Android app and contacts Akamai CDNs to fetch video content as it normally does. All traffic to and from the phone passes over emulated mobile networks (which run atop WiFi connections with average speeds of 300 Mbps); to compensate for the discrepancy in video servers, we added 6 ms of round trip delay to traffic for Dashlet and the Oracle algorithm, which reflects the maximum ping time we observed to the CDN used by TikTok.
Videos.
We consider 100 videos directly downloaded from TikTok’s CDN server via keyword search for popular categories, e.g., racecar. Once downloaded, we use ffmpeg [10] to transcode the videos into the DASH format for the same set of bitrates that TikTok supports (§2.1). By default, we store videos in 5-second chunks (which matches the average duration of the first chunks with TikTok when using the highest available bitrate); §6.3.3 includes results for other chunk durations. Each experiment considers 10 minutes of viewing time to match the average session time for TikTok users [35]. In order to enforce the same playing sequence (i.e., ordered list) of videos across the considered systems, we exploit the fact that the order in which videos are streamed with TikTok for a given keyword search remains unchanged on the order of many days. We use that same order across all systems and across experiments with different network and swipe traces.
Swipe traces.
We pair each video in our experiments with one used in our user studies (§3), trying to match video durations as closely as possible. When a video is played during an experiment, we replay a randomly-selected real user trace (i.e., exact swipe time) for the corresponding video in the user studies. Note that Dashlet has access to the aggregated distribution of cross-user swipe times for each video, but does not have knowledge of the specific user trace (and thus, exact swipe times) that will be used in any experiment.
Network conditions.
Evaluation metrics.
Short video streaming follows the same general goals as traditional video streaming scenarios [23, 40]: maximize video bitrate, minimize rebuffering delays, and avoid frequent bitrate fluctuations. Thus, we adopt the following widely used QoE definition:
| (12) |
where is the average video bitrate, is the cumulative penalty for rebuffering (i.e., stalled playback), and is the penalty for frequent bitrate switching across adjacent chunks within a short video. We use the same values for and as prior work [23], i.e., and . As discussed in §1, user swipes can produce scenarios in which downloaded video is never watched by users. We compute QoE only based on viewed video chunks, but also report on the resources consumed for wasted downloads.
6.2 End-to-End performance
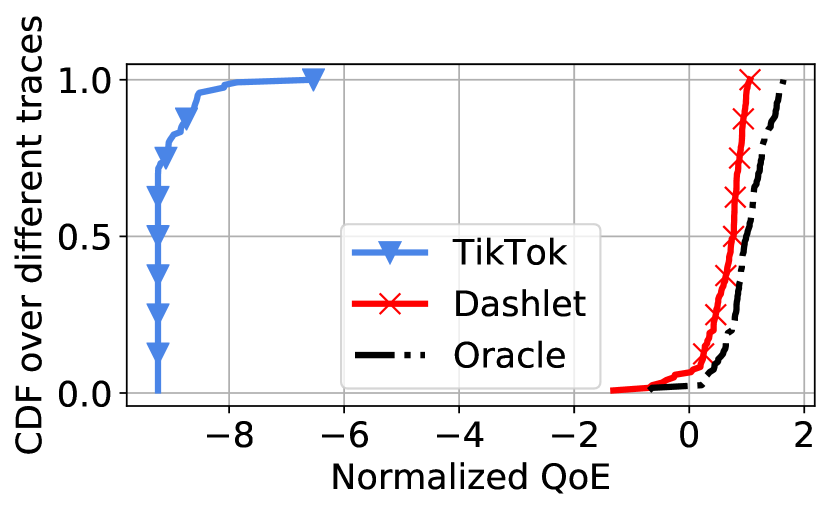
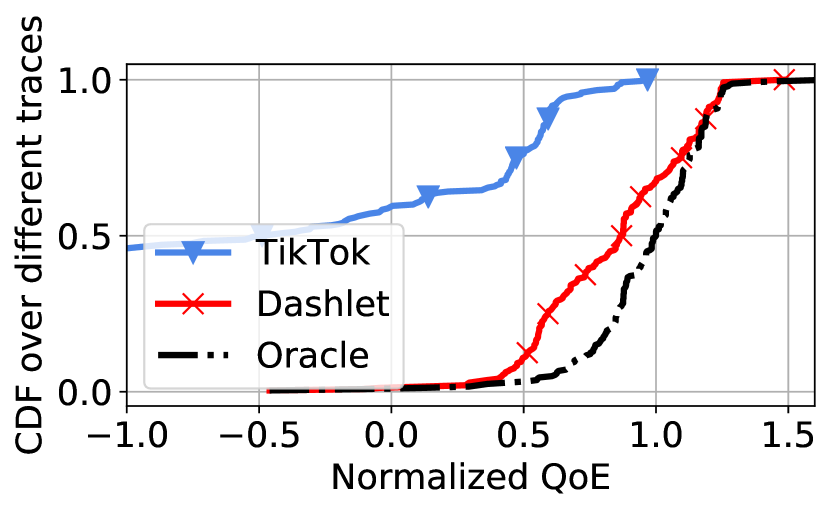
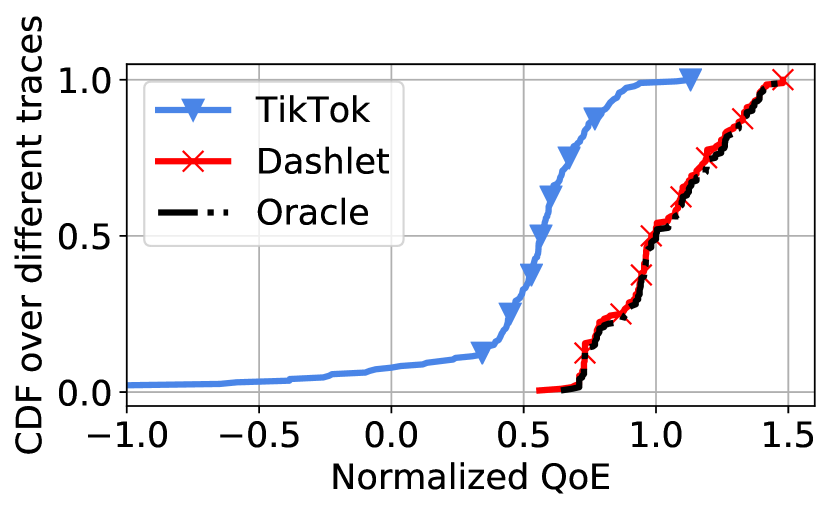
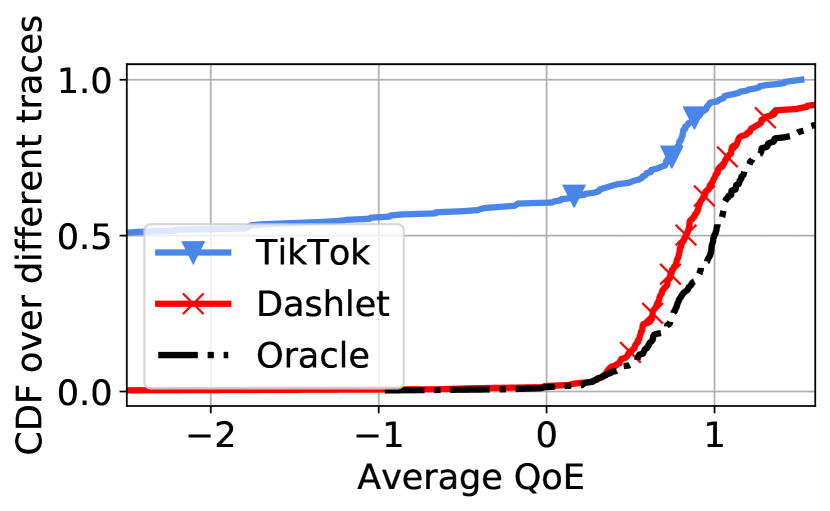
Figure 14 compares the average QoE of all three systems when running over the FCC LTE dataset. To aid analysis, results are broken down into 3 categories based on the available bandwidth in each trace. Figure 16 shows the same results for the Mall WiFi traces. Reported QoE results are normalized to the median values for the Oracle in each case.
There are two key takeaways from these results. First, Dashlet consistently outperforms TikTok across all settings, with QoE benefits that are 43.9-45.1 closer to the Optimal. For example, for the FCC LTE traces, (median) QoE values with Dashlet are within 77.3-98.6% of the median optimal values. TikTok’s QoE values, on the other hand, has gaps of -923.6-56.7% from the optimal across those cases. This performance advantage persists on WiFi, with percent differences from the optimal of 83% and 266% for Dashlet and TikTok, respectively. The main reason is that, whereas Dashlet buffers video according to swipe distributions and application playback constraints, TikTok follows a fixed algorithm in all cases that buffers many chunks that are never watched. The wasted resources translate to substantial rebuffering delays for required chunks (as discussed below), particularly in low-bandwidth scenarios, e.g., Figure 14(a). In addition, Dashlet’s algorithm leaves the network idle only if the client-side playback buffer is fully occupied (and cannot house additional chunks); in contrast, TikTok enters a prebuffer-idling state after it completes prebuffering the first chunk for each video in the current group-of-ten (§2.2.1).
Second, Dashlet’s gap from the optimal shrinks as network throughput increases. For instance, on the FCC dataset, median gaps are 22.7%, 12.7%, and 1.4% as the network ranges rise from 1 to 1-6 to 6 Mbps. The reason is that Dashlet is able to grow and maintain larger playback buffers, which in turn lowers the risk of rebuffering from unanticipated swipes. In other words, the larger bandwidths mask the (already minimal) errors induced from errors in swipe distributions in terms of how well they characterize the current user.
6.2.1 Breaking down QoE
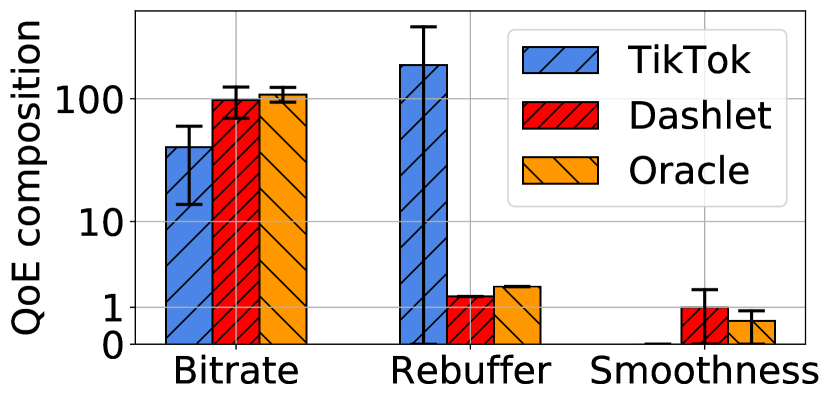
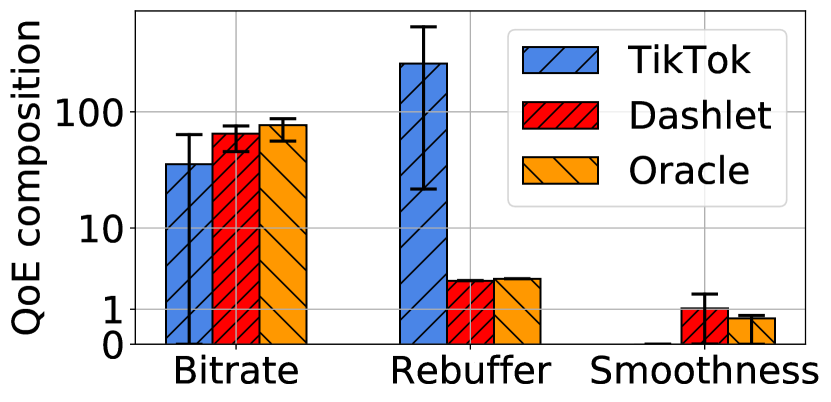
Figure 16 lists the contributing elements to overall QoE values of each system, i.e., bitrate reward, rebuffering penalty, and smoothness penalty. There are four points to note.
First, TikTok’s performance degradations are primarily due to substantial rebuffering: its average rebuffering penalties in the QoE function are 186.5 and 259.2 for the LTE and WiFi datasets. This translates to upwards of 208 and 289 seconds of rebuffering in 10-minute video sessions, which is 128.4 and 102.4 higher than with Dashlet. The root cause is Dashlet’s conservative approach to explicitly minimize rebuffering in an effort to hedge against uncertainty in user swipe times. Second, and for the same reason, Dashlet’s rebuffering penalty is lower than that with the Oracle algorithm. However, in doing so, Dashlet also achieves moderately lower bitrate rewards compared to the Oracle. Third, compared to TikTok, Dashlet achieves 246.2% and 85.3% higher video bitrates than TikTok on the FCC LTE and Mall WiFi datasets, respectively. Fourth, all three systems incur minimal smoothness penalties. This is because short videos last only 10s of seconds (and thus, a handful of chunks)). The algorithms can switch bitrates between videos to adapt to throughput changes without incurring smoothness penalties.
6.3 Micro Benchmarks
6.3.1 Impact of Swipe and Network Speeds on QoE
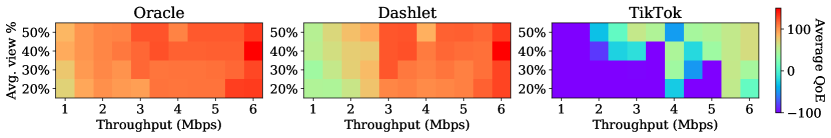
Patterns in network throughput and user swipes largely influence the performance of short video streaming algorithms. To understand the effect of each, we report Dashlet’s QoE results for different network throughputs (for our FCC LTE dataset) and swipe rates. As shown in Figure 17, the major factor that affects QoE with Dashlet is the network throughput. Importantly, swipe speed does not have a significant impact on Dashlet’s performance, validating its use of only coarse information from swipe distributions to hedge against different swipe patterns. In contrast, both network throughput and swipe speed have a large impact on TikTok’s QoE.
6.3.2 Network Idle and Data Waste
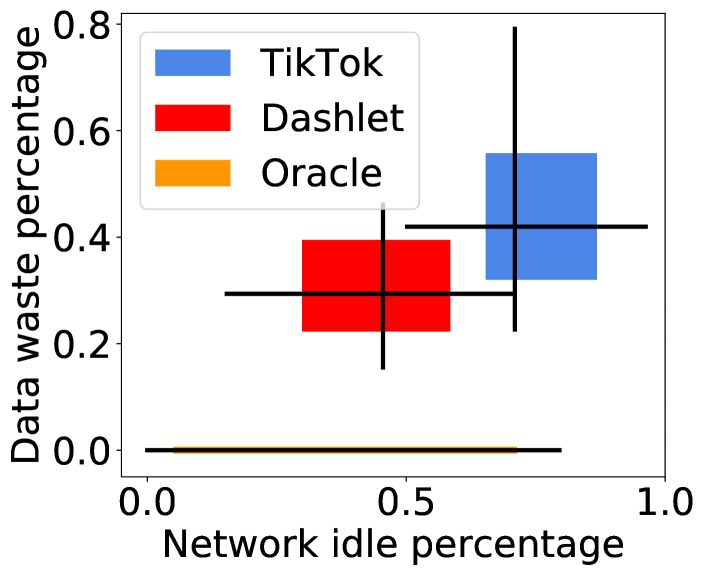
To dig deeper into Dashlet’s higher QoE values over TikTok from §6.2.1, we investigate network idling and data wastage for both systems. Figure 20 shows our results; note that the Oracle algorithm does not incur any data wastage since it has perfect knowledge of user swipe times. As shown, median data wastage and idle time for Dashlet are 29.4% and 45.5%, respectively, which are 30.0% and 35.9% lower than those with TikTok. These improvements, in turn, enable Dashlet to stream video at higher bitrates than TikTok for a given network throughput while keeping rebuffering delays low.

6.3.3 The impact of chunk size on Dashlet’s QoE
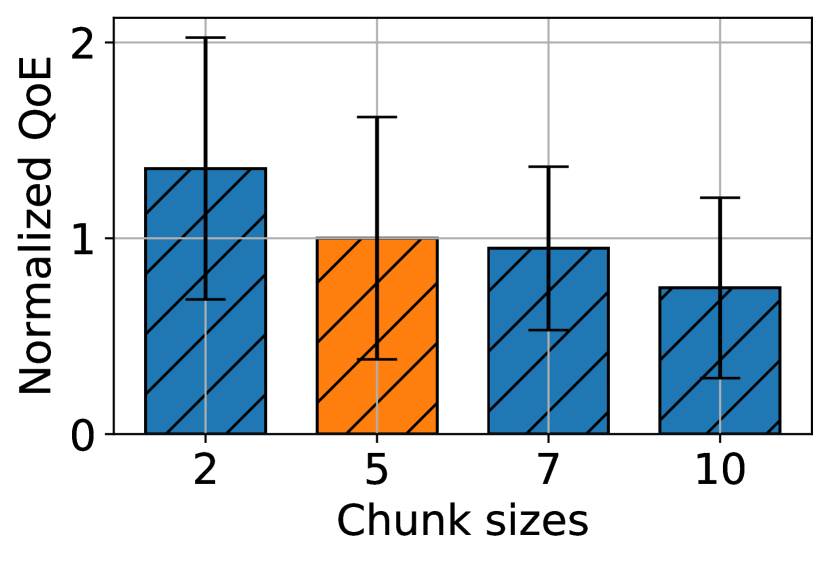
Unlike TikTok which breaks up videos by bytes, Dashlet (by default) breaks up videos into 5-second chunks. We evaluated the impact that chunk sizes have on Dashlet’s performance by considering the following chunk sizes (based on prior work [42]): {2, 5, 7, 10} seconds. Note that we did not modify chunk sizes for TikTok as we could not alter its video servers. As shown in Figure 20, Dashlet’s performance steadily decreases as chunk sizes grow, e.g., average QoE drops by 35.4% as chunk sizes grow from 5 to 10 seconds. The reason is that data wastage grows with larger chunk sizes: a user swipe at 1 second into a chunk will result in more wasted bytes with chunks of 10 seconds than 2 seconds.
6.3.4 Decision Stability with Swipe Prediction Errors
Dashlet determines buffer sequences by leveraging (coarse information from) users’ swipe distributions for each video. Thus, a natural question is how robust are Dashlet’s decisions to errors in those distributions, i.e., does it make the right decisions even with different degrees of errors?
Recall that there are three inputs to Dashlet’s algorithm at any time: the swipe distribution for each considered video, the estimated network throughput, and the client-side player’s current buffer state. The algorithm uses this information and returns a buffer sequence of chunks to download, with the first chunk in the ordered list indicating the action to perform immediately, i.e., the chunk to download now. To answer the above question, we profiled the above inputs throughout our experiments, and then compared the actions selected by Dashlet with those that it would select if the input swipe distribution involved errors. In particular, we considered 10 versions of each video’s distribution by (roughly) modeling its original distribution as an exponential one, and then altering the corresponding value to change the average swipe time by 1{0-50%} (in 10% increments).
Figure 20 shows our results. As shown, 83.7% of Dashlet’s decisions are unchanged across all of the considered distribution errors. The values remain relatively stable as errors grow – e.g., 96.5% of Dashlet’s decisions are unchanged with errors of 50% – but begin to grow after 82%. These results illustrate that Dashlet only relies on coarse information from swipe distributions (e.g., about whether a user is likely to swipe early or late in the video); it is for this reason that decisions are varied only when errors are very high (and even the coarse information that Dashlet uses has changed).
6.3.5 QoE sensitivity with Swipe and Network Errors
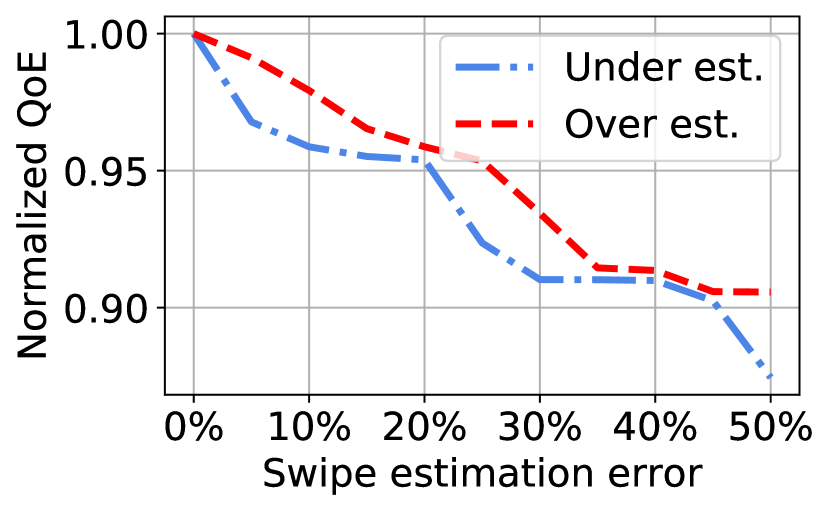
Building on the previous results, we now analyze how errors in swipe distribution affect the QoE that Dashlet delivers. Using same faulty distributions from above, we ran Dashlet on all videos and the network traces in our FCC LTE dataset. Figure 22 shows the results, breaking them down in terms of scenarios with over estimation of swipe times (longer average viewing time than the correct distribution, i.e., later swipes) and under estimation (shorter average viewing time). As shown, Dashlet is quite tolerant to such errors, delivering 87% and 91% of its full QoE (with no errors) when the traces are over- and under-estimating swipe times by 50%.
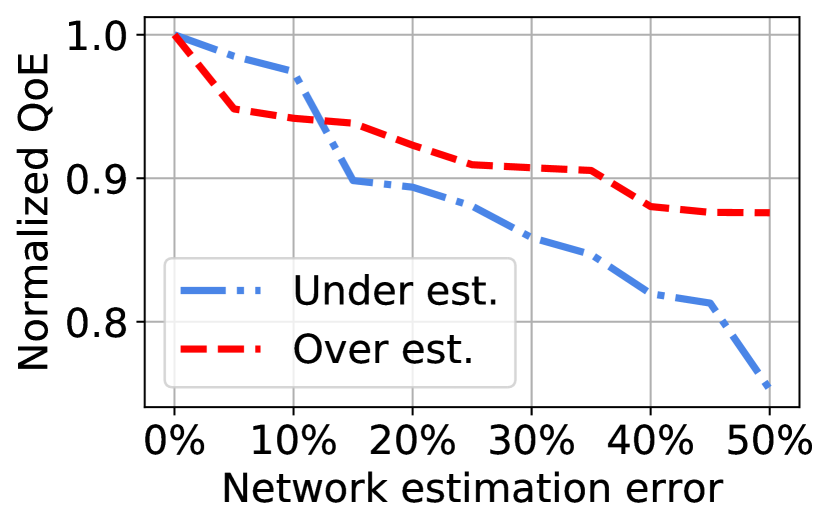
We perform a similar analysis to evaluate Dashlet in the presence of network prediction errors. Specifically, we replace the network predictor in RobustMPC [40] with one that reads in the actual instantaneous throughput from the current Mahimahi trace, and multiplies that value by between 1{0-50%}. Overall, as per Figure 22, we find that Dashlet’s QoE drops to 88% and 76% of its values without network errors when the network estimate is over- or under-estimating by 50%. These results highlight that Dashlet is more robust to errors in swipe distributions than network forecasts.
7 Related work
Traditional adaptive video streaming
Traditional video streaming services deliver video content from the CDN to the user with adaptive bitrate system with the objective of maximizing the quality of experience for users [21]. Research effort has been made to improve the quality of experience from different perspectives, including streaming algorithm [40, 30, 23, 19, 20], video codec [11, 7], network prediction [37, 31], protocol design [45, 15], and video super resolution [39, 38]. But all these optimization is for the same video streaming model: the video download sequence is the same as the video playing sequence. Dashlet also uses QoE as the optimization goal but tackles a different problem as in the short video streaming the video download sequence is the same as the video playing sequence due to users’ swipes.
Streaming new form of video
There are also rising interest on 360 degree video [27, 13] and volumetric video streaming [26]. These systems need to handle the uncertainty from the users’ head position or location. Dashlet’s design also models the uncertainty from the user swipe patterns. But Dashlet targets on a different problem compared with 360 degree or volumetric video streaming. Some existing works [28, 16] also try to apply reinforcement learning algorithms from traditional video streaming [23] to short video streaming. However, these works do not factor in the impact of user swipes on buffering decisions as Dashlet does.
8 Conclusion
In this paper, we design and implement Dashlet with the insight provided by measurement for a commercial short video app and a user study on general user swipe pattern. Dashlet’s algorithm strategically determines the buffer order with the input from a coarse-grained swipe distribution. Evaluation result shows Dashlet significantly improves video quality and reduces rebuffering compared with the baseline system.
References
- [1] 24 Important TikTok Stats Marketers Need to Know in 2022. https://blog.hootsuite.com/tiktok-stats/.
- [2] Akhtar, Z., Nam, Y. S., Govindan, R., Rao, S., Chen, J., Katz-Bassett, E., Ribeiro, B., Zhan, J., and Zhang, H. Oboe: Auto-tuning video abr algorithms to network conditions. In Proceedings of the 2018 Conference of the ACM Special Interest Group on Data Communication (New York, NY, USA, 2018), SIGCOMM ’18, Association for Computing Machinery, p. 44–58.
- [3] Chen, F., Li, P., Zeng, D., and Guo, S. Edge-assisted short video sharing with guaranteed quality-of-experience. IEEE Transactions on Cloud Computing (2021), 1–1.
- [4] Chen, Z., He, Q., Mao, Z., Chung, H.-M., and Maharjan, S. A study on the characteristics of douyin short videos and implications for edge caching. In Proceedings of the ACM Turing Celebration Conference-China (2019), pp. 1–6.
- [5] Cortesi, A., Hils, M., Kriechbaumer, T., and contributors. mitmproxy: A free and open source interactive HTTPS proxy, 2010–. [Version 8.0].
- [6] Dasari, M., Bhattacharya, A., Vargas, S., Sahu, P., Balasubramanian, A., and Das, S. R. Streaming 360-degree videos using super-resolution. In IEEE INFOCOM 2020 - IEEE Conference on Computer Communications (2020), IEEE Press, p. 1977–1986.
- [7] Dasari, M., Kahatapitiya, K., Das, S. R., Balasubramanian, A., and Samaras, D. Swift: Adaptive video streaming with layered neural codecs. In USENIX NSDI (2022).
- [8] DASH Industry Forum. https://reference.dashif.org/dash.js/latest/samples/index.html.
- [9] Federal Communications Commission. 2016. Raw Data - Measuring Broadband America. (2016). https://www.fcc.gov/reports-research/reports/.
- [10] FFmpeg Formats Documentation. https://ffmpeg.org/ffmpeg-formats.html#dash-2.
- [11] Fouladi, S., Emmons, J., Orbay, E., Wu, C., Wahby, R. S., and Winstein, K. Salsify:Low-Latency network video through tighter integration between a video codec and a transport protocol. In USENIX NSDI (2018).
- [12] Gao, X., Le Callet, P., Li, J., Li, Z., Lu, W., and Yang, J. QoEVMA’20: 1st Workshop on Quality of Experience (QoE) in Visual Multimedia Applications. Association for Computing Machinery, New York, NY, USA, 2020, p. 4771–4772.
- [13] Guan, Y., Zheng, C., Zhang, X., Guo, Z., and Jiang, J. Pano: Optimizing 360 video streaming with a better understanding of quality perception. In ACM SIGCOMM (2019).
- [14] Guo, J., and Zhang, G. A Video-Quality Driven Strategy in Short Video Streaming. Association for Computing Machinery, New York, NY, USA, 2021, p. 221–228.
- [15] Han, B., Qian, F., Ji, L., and Gopalakrishnan, V. Mp-dash: Adaptive video streaming over preference-aware multipath. In CoNEXT (2016).
- [16] He, J., Hu, M., Zhou, Y., and Wu, D. Liveclip: towards intelligent mobile short-form video streaming with deep reinforcement learning. In Proceedings of the 30th ACM Workshop on Network and Operating Systems Support for Digital Audio and Video (2020).
- [17] Huang, T.-Y., Johari, R., McKeown, N., Trunnell, M., and Watson, M. A buffer-based approach to rate adaptation: Evidence from a large video streaming service. In Proceedings of the 2014 ACM Conference on SIGCOMM (New York, NY, USA, 2014), SIGCOMM ’14, Association for Computing Machinery, p. 187–198.
- [18] Itseez. The OpenCV Reference Manual, 4.5.1 ed., 2022.
- [19] Jiang, J., Sekar, V., and Zhang, H. Improving fairness, efficiency, and stability in http-based adaptive video streaming with festive. In ACM CoNEXT (2012).
- [20] Kim, J., Jung, Y., Yeo, H., Ye, J., and Han, D. Neural-enhanced live streaming: Improving live video ingest via online learning. In ACM SIGCOMM (2020).
- [21] Krishnan, S. S., and Sitaraman, R. K. Video stream quality impacts viewer behavior: inferring causality using quasi-experimental designs. IEEE/ACM Transactions on Networking (2013).
- [22] Lymberopoulos, D., Riva, O., Strauss, K., Mittal, A., and Ntoulas, A. Pocketweb: Instant web browsing for mobile devices. In ASPLOS 2012 (Architectural Support for Programming Languages and Operating Systems) (March 2012), ACM.
- [23] Mao, H., Netravali, R., and Alizadeh, M. Neural adaptive video streaming with pensieve. In ACM SIGCOMM (2017).
- [24] Netravali, R., Sivaraman, A., Das, S., Goyal, A., Winstein, K., Mickens, J., and Balakrishnan, H. Mahimahi: Accurate Record-and-Replay for HTTP. In USENIX ATC (2015).
- [25] PyAutoGUI - PyPI. https://pypi.org/project/PyAutoGUI/.
- [26] Qian, F., Han, B., Pair, J., and Gopalakrishnan, V. Toward practical volumetric video streaming on commodity smartphones. In ACM HotMobile (2019).
- [27] Qian, F., Han, B., Xiao, Q., and Gopalakrishnan, V. Flare: Practical viewport-adaptive 360-degree video streaming for mobile devices. In ACM MobiCom (2018).
- [28] Ran, D., Zhang, Y., Zhang, W., and Bian, K. Ssr: Joint optimization of recommendation and adaptive bitrate streaming for short-form video feed. In IEEE MSN (2020).
- [29] Genymobile/scrcpy: Display and control your Android device. https://github.com/Genymobile/scrcpy.
- [30] Spiteri, K., Urgaonkar, R., and Sitaraman, R. K. Bola: Near-optimal bitrate adaptation for online videos. IEEE/ACM Transactions on Networking 28, 4 (2020), 1698–1711.
- [31] Sun, Y., Yin, X., Jiang, J., Sekar, V., Lin, F., Wang, N., Liu, T., and Sinopoli, B. Cs2p: Improving video bitrate selection and adaptation with data-driven throughput prediction. In ACM SIGCOMM (2016).
- [32] TikTok: Thanks a billion! https://newsroom.tiktok.com/en-us/1-billion-people-on-tiktok.
- [33] TikTok Revenue and Usage Statistics (2022). https://www.businessofapps.com/data/tik-tok-statistics/.
- [34] https://influencermarketinghub.com/tiktok-stats/. https://influencermarketinghub.com/tiktok-stats/.
- [35] TikTok User Statistics (2022). https://backlinko.com/tiktok-users.
- [36] Wang, S. W., Yang, S., Li, H., Zhang, X., Zhou, C., Xu, C., Qian, F., Wang, N., and Xu, Z. Salientvr: Saliency-driven mobile 360-degree video streaming with gaze information. In Proceedings of the 28th Annual International Conference on Mobile Computing and Networking (New York, NY, USA, 2022), MobiCom ’22, Association for Computing Machinery.
- [37] Yan, F. Y., Ayers, H., Zhu, C., Fouladi, S., Hong, J., Zhang, K., Levis, P., and Winstein, K. Learning in Situ: A Randomized Experiment in Video Streaming. USENIX Association, USA, 2020, p. 495–512.
- [38] Yeo, H., Chong, C. J., Jung, Y., Ye, J., and Han, D. Nemo: enabling neural-enhanced video streaming on commodity mobile devices. In ACM MobiCom (2020).
- [39] Yeo, H., Jung, Y., Kim, J., Shin, J., and Han, D. Neural adaptive content-aware internet video delivery. In USENIX OSDI (2018).
- [40] Yin, X., Jindal, A., Sekar, V., and Sinopoli, B. A control-theoretic approach for dynamic adaptive video streaming over http. In ACM SIGCOMM (2015).
- [41] YouTube Shorts Video-Making App Now Receiving 3.5 Billion Daily Views. https://www.latestly.com/technology/youtube-shorts-video-making-app-now-receiving-3-5-billion-daily-views-says-ceo-sundar-pichai-2300573.html.
- [42] Zhang, T., Ren, F., Cheng, W., Luo, X., Shu, R., and Liu, X. Modeling and analyzing the influence of chunk size variation on bitrate adaptation in dash. In IEEE INFOCOM 2017-IEEE Conference on Computer Communications (2017), IEEE, pp. 1–9.
- [43] Zhang, X., Ou, Y., Sen, S., and Jiang, J. SENSEI: Aligning video streaming quality with dynamic user sensitivity. In 18th USENIX Symposium on Networked Systems Design and Implementation (NSDI 21) (Apr. 2021), USENIX Association, pp. 303–320.
- [44] Zhang, Y., Liu, Y., Guo, L., and Lee, J. Y. Measurement of a large-scale short-video service over mobile and wireless networks. IEEE Transactions on Mobile Computing (2022).
- [45] Zheng, Z., Ma, Y., Liu, Y., Yang, F., Li, Z., Zhang, Y., Zhang, J., Shi, W., Chen, W., Li, D., et al. Xlink: Qoe-driven multi-path quic transport in large-scale video services. In ACM SIGCOMM (2021).