Using HITRAN to Model Opacities for Planetary Atmospheres: Test case of Microwave Spectra of \chNH3, \chSO2 and \chPH3
Abstract
The latest version of the HITRAN molecular spectroscopic database, HITRAN2020, has recently been released featuring many updates, including line-by-line broadening parameters (and their temperature dependence) appropriate for the dominant constituents of planetary atmospheres. In this work, line shape codes suitable for calculating microwave spectra have been implemented within the HITRAN Application Programming Interface (HAPI). These new additions allow for spectroscopic calculations of microwave absorbing species pertinent to current and future studies of the atmospheres of Jupiter and Venus, and more generally for the atmospheres of gas giants and rocky planets. The inversion spectrum of the \chNH3 molecule broadened by \chH2, \chHe and \chH2O dominates the microwave region of Jupiter. Whereas for Venus, accurate spectroscopic data of \chSO2 broadened by \chCO2 is necessary in order to determine its significance, if any, on the reported detection of \chPH3 in the Venusian upper cloud deck. Comparisons have been made to available microwave laboratory opacities and the following results illustrate that HITRAN data can be used in conjunction with HAPI to reproduce the existing experimental measurements and provide reliable calculation of planetary opacities. Users should be mindful regarding selection of appropriate parameters in HITRAN and selecting suitable line shape functions in HAPI, depending on the spectral region, target molecular species, as well as ambient chemical and thermodynamic conditions.
Introduction
The high-resolution transmission molecular spectroscopic database (HITRAN) is an international standard for reference molecular spectroscopy in various fields of science and industry, where its primary goal is to interpret absorption of electromagnetic radiation in terrestrial, planetary and exoplanetary atmospheres. HITRAN2020 (Gordon et al., 2022), the most recent edition, contains a compilation of line-by-line spectroscopic parameters that can be used to simulate and analyze the transmission and emission spectra of 55 molecules in gaseous media (Gordon et al., 2022). Furthermore, HITRAN contains experimental absorption cross sections for over 300 additional molecules (Kochanov et al., 2019), as well as collision induced absorption (Karman et al., 2019) for many important collisional complexes. The HITEMP database follows the same formalism as HITRAN but contains substantially more transitions that are necessary for high-temperature calculations, including those encountered in the Jovian and Venusian atmospheres. The HITRAN Application Programming Interface (HAPI) (Kochanov et al., 2016) contains a set of Python scripts that have been developed for use with HITRAN data, thus allowing line-by-line calculations of absorption cross sections, transmission and emission spectra, and more.
Prior to the work of Wilzewski et al. (2016), HITRAN provided only air-broadening (typically from a combination of \chN2- and \chO2-broadening) and self-broadening parameters for every spectral line. However, line broadening is strongly dependent on the perturber and if one aims at accurate modeling of the spectra of atmospheres dominated by gases other than \chN2 and \chO2, the air-broadening values cannot be employed. For example, Tan et al. (2019) demonstrated the significant differences in absorption cross-sections calculated using air-broadening and \chH2O-broadening parameters. Since the atmospheres of gas giants share \chH2, \chHe, and (to a lesser extent) \chH2O as major constituents, and since \chCO2 predominates in atmospheres of Venus and Mars (and exoplanets with a history of high-volcanic activity), efforts have been made towards incorporating broadening parameters due to collisions with these gases into HITRAN for planetary atmosphere applications (Wilzewski et al., 2016; Tan et al., 2019, 2022). These studies combine numerous experimental and theoretical data in order to determine semi-empirical models of collisional broadening for each molecule. These models thereby allow effective application of the relevant broadening parameters to each spectroscopic transition of the molecules studied (Tan et al., 2022).
It is worth defining here that ”broadening parameters” refer to 1) Lorentzian half-widths at half maximum (HWHM) denoted as , , , and for \chH2-, \chHe-, \chCO2-, and \chH2O-broadening, respectively; 2) temperature dependence (exponent) of these half-widths (denoted as , , , ) defined through the power law given in equation 1; 3) collisional line shifts (denoted as , , , ) which at the moment are available only for some HITRAN molecules and in some cases only for some specifically selected lines of these molecules. The power law equation for determining the HWHM at T is given as:
|
|
(1) |
where T0 is the reference temperature (296 K in HITRAN) and is the HWHM at the reference temperature.
where T0 is the reference temperature (296K in HITRAN) and is the HWHM at the reference temperature.
HAPI is capable of utilizing the aforementioned parameters to calculate absorption cross sections of gaseous spectra with a variety of gas mixture concentrations. This work demonstrates how HITRAN2020 data can be used in conjunction with HAPI to reproduce available experimental absorption data, obtained under Jovian and Venusian conditions. The ability to reproduce experimental opacities in turn provides confidence in the quality and applicability of the calculations using HITRAN data under planetary conditions. The primary addition applied to HAPI in order to carry out this work, was to include additional asymmetric line shape functions appropriate for modeling in the microwave spectral region. These new (to HAPI) line shape functions are available as a Python script to be used in conjunction with HAPI and are given in the supplementary materials section in conjunction with publication of this work in the Monthly Notices of the Royal Astronomical Society (MNRAS).
Choice of Test Cases
Inversion Spectrum of \chNH3 and the Jovian Atmosphere
Missions to Jupiter equipped with spectrometers are necessary in order to better understand the atmospheric composition of the gas giant. The microwave radiometers are of especial advantage because Jupiter’s neutral atmosphere is shrouded by clouds that are impenetrable to all but microwave radiation (Orton, 2018). Ground-based microwave measurements of Jupiter are impeded by intense synchrotron radiation that obscures all except the shortest-wavelength microwave radiation emitting from above the few-bar pressure level of the atmosphere (Orton, 2018). In August of 2011 NASA launched its “New Frontiers” Juno mission with a primary objective to better understand the complexities of Jupiter’s atmosphere (Ingersoll et al., 2017). Juno is spin-stabilized and solar-powered (Levin et al., 2019), and carries as one of its payloads a microwave radiometer (MWR) that can be used to retrieve the atmospheric composition in the Jovian atmosphere (Ingersoll et al., 2017). The Juno spacecraft is passing below Jupiter’s radiation belts (Bolton et al., 2021). In addition, the MWR has the capability to separate Jupiter’s synchrotron emission effectively from atmospheric thermal emission (Fletcher et al., 2021).
Juno’s MWR operates within six microwave channels to retrieve the abundance of molecular constituents from the microwave signature of Jupiter (Janssen et al., 2017; Bolton et al., 2017). At these frequencies, the microwave opacity of the Jovian atmosphere is dominated by the inversion of the \chNH3 molecule and is broadened by the major species in Jupiter’s atmosphere \chH2 and \chHe as well as the minor species \chH2O (Atreya et al., 2003). Therefore, it is essential to correctly model the \chNH3 microwave spectrum in order to maximize the benefit of Juno’s observations.
Recently, data from Juno was used to determine that the mid-latitudes of Jupiter’s atmosphere show a significant depletion of \chNH3 (Guillot et al., 2019), while Jupiter’s equatorial zone displays a column of enriched \chNH3 gas (Li et al., 2017; Ingersoll et al., 2017). It was suggested by Guillot et al. (2020) that this strong \chNH3 vertical distribution is due to a lack of “mushballs” (i.e., mixed-phase \chNH3/\chH2O condensates (Weidenschilling and Lewis, 1973)) and storms in the equatorial zone (Fletcher et al., 2021). Although, with the Juno mission underway, the detailed composition of Jupiter’s atmosphere is still under investigation. The MWR is able to shed light on the mysteries of Jupiter’s atmosphere since it can probe the composition deeper than what is possible from any Earth-based telescope or previous spacecraft (Bolton et al., 2019). This has enabled better understanding of the mixture and concentration of \chH2O and \chNH3 in Jupiter’s atmosphere and in particular has furthered understanding of the \chNH3 plume in Jupiter’s equatorial zone. Although the global distributions of winds, heat fluxes, temperature gradients, and chemical species below the weather layer are still largely unknown (Ingersoll et al., 2017) they remain under investigation by the Juno mission.
For this study, \chNH3 absorption under Jovian conditions is considered with \chHe, \chH2 and \chH2O broadening applied. Overall, there are a variety of molecular species in HITRAN which have broadening parameters relevant for the Jovian atmosphere. For instance, HITRAN provides \chHe, and \chH2-broadening and their temperature dependence exponents for \chHCN which was observed by Cassini/CIRS in December 2000 on Jupiter (Lellouch et al., 2006). Additional molecular species which have been detected on Jupiter are detailed in Table 1 of Atreya et al. (2003). These include \chH2O, \chCO2, \chCO, \chCH4, \chHCl, \chC2H2, \chPH3, \chH2S, \chH2 and \chGeH4. In HITRAN these molecules are available with some or all \chH2, \chHe, \chH2O and \chCO2 broadening parameters, temperature dependence exponents and for select molecules there are pressure-induced line shift values. Molecules that have also been detected on Jupiter and detailed in Atreya et al. (2003, 1995) which are available in HITRAN but without “planetary” broadening parameters include; \chC2H6, \chC2H4, \chC4H2 and \chCS2.
A comprehensive set of laboratory studies at the Georgia Institute of Technology have investigated the microwave opacity of \chNH3 under Jovian conditions (Steffes and Jenkins, 1987; Joiner et al., 1989; Joiner and Steffes, 1991; Mohammed and Steffes, 2003, 2004; Hanley et al., 2009; Devaraj et al., 2011, 2014; Bellotti et al., 2016). These results have been fundamental in the development of \chNH3 opacity models and have contributed to the interpretation of Juno’s atmospheric observations (Fletcher et al., 2021). These laboratory measurements have formed the basis of a series of \chNH3 opacity models following the method of Hanley et al. (2009), with the most recent modifications presented in Bellotti et al. (2016). To clarify, it is not within the scope of this work to compare to Radiative Transfer Models which are utilized by the Juno mission. Instead, only the \chNH3 opacity models and their corresponding laboratory measurements will be used in comparison with HITRAN2020 data and HAPI.
Microwave Spectra of \chSO2 & \chPH3 and the Venusian Atmosphere
\chSO2 is a principal constituent in the sulfur cycle on Venus (Vandaele et al., 2017). Its spectrum is broadened by \chCO2, which makes up the majority of the Venusian atmosphere. It is thought that, due to Hadley cell circulation and convective transportation, \chSO2 effectively transfers from the lower to the upper portions of the Venusian atmosphere (Vandaele et al., 2017). In the middle/upper atmosphere, \chSO2 is oxidized and forms \chSO3 which then synthesizes with \chH2O to precipitate as \chH2SO4 droplets that enrich the Venusian clouds and haze (Vandaele et al., 2017). This process leads to a substantial decrease in \chSO2 abundance above the Venusian clouds (Vandaele et al., 2017). The main cloud deck is placed around altitudes of 45-70 km (Vandaele, 2020) with \chSO2 as the most abundant sulfur-bearing species in the middle (Mills et al., 2007) and lower atmosphere, varying with altitude, latitude and time (Marcq et al., 2021).
PH3 has tentatively been observed by Greaves et al. (2021b, a) within the Venusian atmosphere. This potential detection was based on two separate observations using the James Clerk Maxwell Telescope (JCMT) and the Atacama Large Millimeter/submillimeter Array (ALMA). Greaves et al. (2021b) show that the observed feature can be attributed to the \chPH3 rotational transition for the () 10 line located at 8.904 cm-1 (J is the rotational quantum number associated with the total angular momentum and K is associated with the projection of the total angular momentum on the symmetry axis of the molecule), originating from the middle/upper cloud deck layers with altitudes approximately 53–61 km. On the one hand, a detection of \chPH3 is not unusual elsewhere in the Solar System; for instance, \chPH3 is also known to be present in Jupiter’s atmosphere (Fletcher et al., 2009; Larson et al., 1977; Ridgway et al., 1976). On the other hand, \chPH3 is an unexpected species in the Venusian atmosphere since there are no known photochemical pathways where \chPH3 can be abiotically produced with the proposed abundances (Greaves et al., 2021b; Bains et al., 2020). The primary significance of \chPH3 on Venus is that it has been proposed as a potential biosignature by Sousa-Silva et al. (2020). Furthermore, Venus has a highly oxidized atmosphere, therefore the presence of \chPH3 is unexpected since it is not an oxidized species (Encrenaz et al., 2020; Bains et al., 2020).
However, it has been proposed that the spectral feature, attributed to \chPH3 by Greaves et al. (2021b), could be explained by the rotational () transition 30 318,24 of \chSO2, as both molecules have absorption lines that coincide with the identified absorption feature at 8.904 cm-1 or 266.94 GHz (Lincowski et al., 2021). Here J, Ka, Kc are rotational quantum numbers associated with asymmetric top molecules. In the microwave region the \chPH3 spectra demonstrates little opacity before the 1 00 line. For \chSO2 there are many dense spectral transitions at the same spectral region as the \chPH3 1 00 line.
For these reasons, this work concentrates on \chSO2 and \chPH3 under Venusian conditions. With that, as it will be widely discussed below, HITRAN contains \chCO2-broadening parameters for the lines of sulfur dioxide, while they are not available for phosphine due to the lack of measurements in calculations. It should be noted that, in general, there are a number of chemical species which have been detected on Venus (see, for instance, Mogul et al. (2021)) available in HITRAN. These HITRAN data and their available perturbers can be used to generate planetary opacities under a variety of temperatures, pressures, and mixture concentrations. There are some broadening considerations to keep in mind, though.
Many of these molecules have broadening parameters relevant to the Venusian atmosphere, but some do not. For example, \chHF, \chHCl and \chOCS have \chCO2-broadening parameters (as well as \chH2, and \chHe). Naturally, HITRAN features a very comprehensive line list for 12 isotopologues of carbon dioxide itself, and one can obtain \chCO2-broadening parameters by selecting self-broadening. For self-broadening of \chCO2, HITRAN contains some additional data in comparison with other molecules. This includes line-mixing parameters and their temperature dependencies as well as non-Voigt parameters (Hashemi et al. (2020)). In the context of this paper, this may not have much of an impact as since the symmetric isotopologues of \chCO2 there is no permanent dipole moment; therefore, pure-rotational transitions in the microwave (MW) region are forbidden, and only very small dipole moment of minor asymmetric isotopologues allows some very weak transitions for these species.
Molecules that have also been detected in the Venusian atmosphere which are available in HITRAN but without \chCO2-broadening parameters include; \chH2O, \chO3, \chO2, \chOH , \chClO, \chN2, \chO, \chSO3 and \chSO (Krasnopolsky et al., 2013; Piccioni et al., 2008; Evdokimova et al., 2021; Mogul et al., 2021; Sandor and Todd Clancy, 2018; Mogul et al., 2021; Fox, 2012; Sandor et al., 2010). Some of these molecules have broadening parameters due to pressure of water vapor, hydrogen and helium, but these are not relevant to Venus. There is an extensive effort underway to provide \chCO2-broadening parameters for the lines of water vapor. However, for other molecules there is a lack of measurements and calculations and we strongly advocate for relevant experimental and theoretical works.
This work uses HITRAN2020 data (which contains state-of-the-art spectral parameters, including broadening parameters due to pressure of different gases) and line shape codes introduced into HAPI to calculate \chSO2 broadened by \chCO2 under the conditions at Venus. Comparisons of this work against laboratory opacities by Bellotti and Steffes (2015); Steffes et al. (2015) are presented. The available microwave laboratory measurements of the opacity of \chSO2 in a \chCO2 atmosphere were conducted under simulated conditions of the Venusian atmosphere. These laboratory measurements mainly cover the very low frequency rotational transitions for \chSO2. Regrettably, these measurements do not coincide with the spectral region where \chPH3 was detected on Venus. Nevertheless, this works analyses can validate general applicability of new HITRAN data and the microwave line shapes implemented into HAPI in the course of this work.
The potential detection of \chPH3 on Venus has resulted in a renewed interest in Venus with forthcoming missions focusing on observing the Venusian atmosphere. Notably, one of these upcoming missions is the orbiter and atmospheric balloon mission Shukrayaan-1 by the Indian Space Research Organization (ISRO) (Haider et al., 2018) which will observe the surface and atmospheric composition of Venus in 2024. Additionally, the orbiter and lander Venera-D by NASA-Space Research Institute (IKI)/Roscosmos (Zasova, 2021) will be exploring Venus when it launches in 2029. The DAVINCI+ (Deep Atmosphere Venus Investigation of Noble gases, Chemistry, and Imaging) NASA mission will be analyzing the atmospheric chemistry of Venus in 2029 using near-IR, IR and ultra-violet (UV) measurements (Garvin, 2021). Due to the numerous upcoming missions to observe and analyze the Venusian atmosphere, it is necessary that HITRAN provide more accurate spectroscopic data of relevance to Venus.
Since the primary chemical constituent in the Venusian atmosphere is \chCO2 (Vandaele, 2020), the ideal situation would have been for this work to compare against laboratory opacities of \chPH3 broadened by \chCO2. However, no such measurements exist, and there are no relevant data in HITRAN either, due to lack of measurements or calculations. However, there are data for \chH2 and \chHe broadening of \chPH3 lines in HITRAN. Also there are experimental measurements of microwave opacities of \chPH3 in a \chH2 and \chHe atmosphere conducted by Mohammed and Steffes (2004, 2003); Hoffman et al. (1999, 2001). Therefore, here to test the general approach we compare these experimental opacities in a \chH2 and \chHe atmosphere with the ones calculated using the HITRAN data. In the meantime, we encourage experimental and theoretical studies of \chPH3 lines perturbed by \chCO2.
Methods
For accurate line-by-line opacity calculations, the line positions, intensities, line broadening parameters and line shape details are required for each constituent molecule. The following summarizes the microwave data available in HITRAN2020 for the selected molecules included in this work (i.e., \chNH3, \chSO2 and \chPH3). Many updates (with respect to previous editions of the database) which are relevant for calculating opacities other than \chNH3, \chSO2 and \chPH3 for planetary atmospheres are detailed in the HITRAN2020 paper (Gordon et al., 2022). It is important to note that the HITRAN line intensities account for “natural” terrestrial isotopic abundances (Gordon et al., 2022; De Biévre et al., 1984). Thus, the calculations presented in this work use these natural abundance intensities. However, when calculating opacities for Jovian or Venusian observations one will need to account for the abundances characteristic to those environments (see for instance Owen and Encrenaz (2003)).
The HITRAN2020 paper details improvements (with respect to previous editions of the HITRAN database) to the \chSO2 line list (Gordon et al., 2022) relevant to the microwave region. For instance, the principal isotopologue \ch^32S^16O2 has newly included microwave hot bands which came from the work of Naumenko and Horneman (2019) and greatly increased the number of lines in this region. Moreover, the minor isotopologue \ch^34S^16O2 line list contains microwave hot band additions, which came from the work of Huang et al. (2019). Furthermore, two minor isotopologues \ch^33S^16O2 and \ch^16O^32S^18O have also been added to HITRAN from Huang et al. (2019).
The \chNH3 line list within the microwave region in HITRAN contains the inversion transitions, pure rotational transitions, their hot bands, as well as analogous transitions of the minor isotopologue \ch^15NH3. The inversion mode of \ch^14NH3 dominates the microwave region with a maximum at around 0.8 cm-1 (24 GHz). Similarly, transitions between the two inverted forms of the vibration are centered around 35 cm-1, in HITRAN, these transitions are provided by Pearson (2000). Additional pure rotational lines and a number of hot bands are included in HITRAN from the reanalysis of \chNH3 by Down et al. (2013). Moreover, in HITRAN2020 selected lines belonging to \ch^14NH3 have been added from the ExoMol CoYuTe line list (Coles et al., 2019) after the MARVEL process was applied to energy levels (described in Furtenbacher et al. (2020)). The inversion band for the \ch^15NH3 molecule is also included in HITRAN based on the CDMS database (Müller et al., 2005; Endres et al., 2016) and (taking isotopic abundance into account) is approximately three orders of magnitude weaker than the principal isotopologue near 0.8 cm-1. Additional, \ch^15NH3 line position data comes from the work of Canè et al. (2019) who investigate the = 1, 2 and = 1 bending states of \ch^15NH3. Also, some intensity data of \ch^15NH3 comes from the work of Yurchenko (2015) who generated a theoretical room-temperature line list.
Finally, with regards to \chPH3, the data available in the microwave range primarily originates from the CDMS database (Müller et al., 2005; Endres et al., 2016) and includes the weak inversion spectral lines and stronger rotational lines of \chPH3.
Relevant Broadening Parameters in HITRAN
Historically, HITRAN contains “traditional” air- and self-broadening parameters for all transitions of each molecule, however in the last two editions the broadening by gases dominating planetary atmospheres have been introduced for many molecules. HITRAN data are commonly used by the planetary community, for example the Planetary Spectrum Generator (PSG) (Villanueva et al., 2018) enables users to calculate opacities using the available broadening species from HITRAN. This sections details the additional broadening parameters, which are applicable for planetary atmospheres, for \chSO2, \chNH3, and \chPH3. Here, line broadening by \chX is denoted , with a temperature dependence , and a line shift denoted (e.g., , , and refer to the \chH2-broadening parameters).
Additional broadening parameters for \chNH3 are provided in HITRAN for \chH2, \chHe, \chCO2 (Wilzewski et al., 2016) and \chH2O (Tan et al., 2019). HITRAN collates broadening data through a detailed process of validation and studies; the work done in Wilzewski et al. (2016) gave rise to the inclusion of \chH2, \chHe and \chCO2 broadening of \chNH3 in HITRAN. The \chNH3 broadened by \chCO2 data could potentially be relevant for Venusian conditions due to the recent tentative identification of \chNH3 on Venus by Mogul et al. (2021) from the re-examination of the Pioneer Venus Large Probe Neutral Mass Spectrometer. As discussed by Wilzewski et al. (2016), the \chNH3-\chH2 and \chNH3-\chHe broadening parameters in different vibrational bands were studied quite extensively in several peer-reviewed publications. Overall, the broadening coefficients by \chH2 and He exhibited a strong dependence on the rotational quantum numbers ( and ). Each of the broadening parameters in HITRAN have been fitted to a rotationally-dependent empirical function proposed by Nemtchinov (2004). The data in HITRAN for shifting of \chNH3 lines by \chHe were obtained from peer-reviewed works and incorporated into HITRAN after detailed analysis and verification. The shifts are known to exhibit both rotational and vibrational dependence. The data in HITRAN for shifting of \chNH3 lines by \chH2 and \chHe were obtained from peer-reviewed works and incorporated into HITRAN after detailed analysis and verification. Limited extrapolations were applied, keeping in mind strong vibrational dependence.
H2O vapor is one of the most effective broadener’s when compared to the other species in this work. It was noted by Steffes et al. (2017) that \chH2O vapor broadens the absorption spectrum of \chNH3 about five times more than the equivalent amount (by volume) of molecular \chH2, and about nine times as much as \chHe. In the work by Tan et al. (2019), the \chH2O vapor pressure‐broadening parameters (and their temperature‐dependent exponents) were evaluated for the species \chCO2, \chN2O, \chCO, \chCH4, \chO2, \chNH3 and \chH2S from both experimental and theoretical studies. The \chH2O broadening data in the literature are substantially scarcer than that for \chH2 and \chHe. Nevertheless, available measurements were used to create semi-empirical models to populate the entire line lists of the aforementioned molecules into the HITRAN database with relevant parameters (Tan et al., 2019). In many cases the \chH2, \chHe, \chCO2 and \chH2O broadening data in HITRAN is based on a combination of theoretical and experimental values, distinctions between isotopologues were made whenever the necessary data were available in the literature. Otherwise, it was assumed that non-deuterated minor isotopologues have the same foreign broadening coefficients as the principal isotopologue (Wilzewski et al., 2016). Note that there have been laboratory studies on the influence of pressure-broadening from \chCH4 on \chNH3 in the microwave region. These comparisons are not conducted in this work, partly due to the lack of \chCH4 broadening data on \chNH3 inversion lines. Also, due to relatively low abundance of \chCH4 in the atmosphere of Jupiter (0.2% by volume), its effect on the microwave spectrum, which is observed by the Juno MWR, will be minimal (Chinsomboon and Steffes, 2012).
Wilzewski et al. (2016) noted that the \chCO2-broadening parameters of \chSO2 in HITRAN2016 were based on a rudimentary approximation due to extreme lack of data at that time. In brief, the value corresponding to one measurement of a single transition (Krishnaji, 1963) was used to derive a scale factor from comparison to the value for the same transition. Additionally, the HITRAN2016 broadening data used a constant 0.75 value for the temperature dependence of \chSO2 broadened by \chCO2 and the pressure shift was also not accounted for and instead given a constant value of zero (Wilzewski et al., 2016). Nevertheless, it was found by Lincowski et al. (2021) that the HITRAN2016 \chCO2 broadening data of \chSO2 were broadly consistent with laboratory results from Bellotti and Steffes (2015).
For HITRAN2020, the \chSO2-\chCO2 broadening data were updated based on the experimental measurements from Borkov et al. (2019) and Ceselin et al. (2017). Furthermore, extrapolated (beyond laboratory measurements) broadening, temperature dependence, and line shift values were applied by Dudaryonok and Lavrentieva (2018) to transitions where broadening data were not directly available. This process has provided unique \chCO2 broadening, temperature dependence and pressure induced line shift (which was previously not available in HITRAN) data to every \chSO2 transition. A full in-depth analysis as to the validity of the new \chSO2-\chCO2 broadening data are available in (Dudaryonok and Lavrentieva, 2018) and there it was found that the uncertainty between the applied theoretical values from experimental measurements are less than 8%. Needless to say, the updated \chSO2-\chCO2 broadening data from Dudaryonok and Lavrentieva (2018) are expected to give even better performance than that of HITRAN2016.
The \chH2 and \chHe broadening data for \chPH3 were added for HITRAN2020 and described in Tan et al. (2022). The \chPH3-\chH2 broadening is based on an empirical polynomial fit to experimental data and the \chPH3-\chHe broadening data have been obtained from a linear fit to available experimental data.
Line Shape Calculations
The line shape used for spectral calculations in the microwave region is extremely important. This is particularly true for \chNH3 because of the inversion mode, which provides a large number of densely packed, low-frequency transitions. Symmetric line shapes, including Lorentzian and Voigt profiles fail to reproduce the opacities of microwave absorbing species at very low frequencies (Rayer, 2020). Consequently, as part of this work, widely-used asymmetric line shape profiles have been added to HAPI.
Van Vleck and Weisskopf (1945) used a simple derivation from the Debye (1929) and Lorentz (1915) theories of line-broadening for a harmonic oscillator, with a special focus on the microwave region. The Van Vleck & Weisskopf spectral intensity at (in cm-1) can be written as
|
|
(2) |
where is the unperturbed line position in cm-1 and is the speed-averaged line-width in cm-1/atm.
The Van Vleck & Weisskopf (VVW) line shape is applicable to most microwave absorbing species, but was initially created and compared to the inversion spectrum of \chNH3 to act as a more compatible line shape, since the asymmetry allows it to better model the complicated spectrum. Following this study, Fröhlich (1946) reached the same conclusion as Van Vleck and Weisskopf (1945), that the well-known Lorentz formula for the shape of a spectral line is not sufficient for the microwave spectra of \chNH3, except at frequencies close to the resonance frequency. Thus, Fröhlich (1946) adapted the VVW theory to account for harmonic oscillators. Additionally, Anderson (1949) created a generalized theory of collision broadening to predict line widths in the microwave and IR regions, their results showed successful comparisons with experiments of self-broadened \chNH3 in the microwave region. It was not until Birnbaum and Maryott (1953) that it was determined that the VVW line shape inadequately accounted for low-frequency wings of the \chNH3 inversion lines. In particular, Birnbaum and Maryott (1953) found the VVW line shape is 40% too weak at 0.094 cm-1 and is also not comparable at 0.31 cm-1 when evaluated alongside experimental measurements at pressures of 0.06-0.39 atm and temperatures from 261-373 K.
An alternative asymmetric line shape in the microwave region is the formalism derived by Gross (1955). The Gross line shape formula resulted in a model for a friction-damped oscillator and is written as
|
|
(3) |
where and are the same parameters as described in equation (2). The polarization hypothesized by Gross (1955) is reached as a result of kinematic motion between collisions. Although, both the VVW and Gross line shapes converge at the line center, the Gross line shape sheds light on the processes responsible for the shapes of the rotational spectral lines in gases in the microwave region.
Finally, Ben-Reuven (1966) developed a line shape calculation for reproducing the unique shape of the strong inversion spectra of \chNH3. Ben-Reuven (1966) derived a new formula for the shape of resonance lines, as a function of frequency and pressure, which takes into account the special effect of collision-induced transitions between the upper and the lower levels of the line. This Ben-Reuven line shape is given as
|
|
(4) |
where and are the same parameters as described in equation (2), and the additional terms correspond to a line coupling parameter () and a line shift term () proportional to the gas density. The Ben-Reuven (BR) line shape is similar to the VVW line shape with the addition of a coupling element () and a pressure shift term () (Hoffman et al., 2001). With both and set to zero, the BR line shape reverts to that of VVW.
When calculating spectra with HAPI, the user can choose whichever line shape they desire at any wavenumber range. A flexibility that allows users to test these differences in line shape calculations and determine the best fit choices for their particular spectrum. For low frequency transitions in most molecules, a suitable asymmetric line shape is required, such as the VVW line shape, and for rotational lines, the Gross line shape. However, the inversion mode of \chNH3 makes this molecule a special case, requiring the BR line shape that contains additional terms for line coupling and line shifts. An example of the line shape comparisons in the microwave region for \chNH3 can be seen in Fig. 1.

The line coupling element within the BR calculation is not provided in HITRAN and had to be fit to laboratory data within this work, the parameter varies by broadener type. The parameter was constrained by considering only the experimental data involving pure \chNH3 gas, it was found to be a value of 0.35 cm-1/atm. Similarly, was constrained by fitting to the \chNH3 broadened by \chH2O experimental data and was found to be 0.12 cm-1/atm. The same process was executed for determining , utilizing the \chNH3 broadened by \chH2 experimental data to obtain a value of 0.06 cm-1/atm. Finally, was fitted to the \chNH3 broadened by \chHe laboratory data and was found to be 0.01 cm-1/atm.
For the rotational lines of self-broadened \chNH3, a different single parameter (denoted in the codes) was implemented for every rotational transition and was fitted to laboratory data to obtain a value of 0.1 cm-1/atm. This additional parameter was used because there is less line mixing in the rotational and roto-vibrational spectral lines due to their reduced line density when compared to the inversion transitions. The final free parameter to fit was the coefficient of the temperature dependence of the line coupling parameter (). A value of =0.55 was determined after many comparisons to experimental measurements at temperatures ranging from 200-500 K. These values are recommended while using the BR calculation for the \chNH3 microwave spectra.
It can be seen in Fig. 1 that a symmetric line shape (e.g., Voigt) is insufficient for these transitions, and can lead to a significant overestimate in intensity of the low frequency side of the inversion lines (0.8 cm-1), and a corresponding underestimate on the high frequency side, and for the VVW line shape the problem is reversed. Additionally, in Fig. 1 it is evident that the Gross line shape is also too low in intensity on the higher frequency side of the inversion peak. Overall, as can be seen in Fig. 1, the BR line shape corresponds closest with available laboratory measurements and therefore is the proper line shape to use when simulating the inversion of \chNH3 under Jovian conditions in the microwave.
A Voigt line shape significantly overestimates low frequency opacity of \chSO2, as shown in Fig. 2. The Gross line shape slightly overestimates the opacity of \chSO2 for the same region, however above 1 cm-1 the asymmetric line shapes begin to converge upon one another. In Fig. 2 the line shape that coincides closest with available laboratory opacities at all pressures, is the BR line shape (with the parameter set to zero). It was found in this work that the VVW line shape applies \chCO2 pressure-induced line shifts poorly at higher pressure conditions. Unlike \chNH3 and \chPH3 where there are no shifts of broadening parameters included, for \chSO2 there are pressure-induced \chCO2 line shifts which must be accounted for correctly. The BR line shape includes a shift parameter within its line shape calculation () which properly applies the \chCO2 line shifts at higher pressure conditions. Therefore, in this work, for all \chSO2 broadened by \chCO2 calculations the BR line shape is used with .
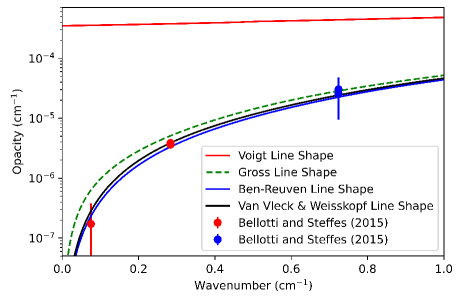
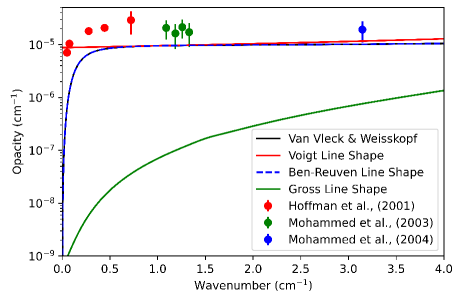
Fig. 3 demonstrates how different line shape calculations simulate \chPH3 spectra. It is apparent in the figure that the Gross line shape, underestimates the opacity of \chPH3 at low frequencies. Note that the VVW line shape and the BR line shape calculations are identical and therefore appear on top of one another in the figure. This is due to the lack of fitted line coupling terms () and of pressure-induced shifts () due to pressure of \chH2 and \chHe within the BR calculation. With these parameters set to zero the BR function reduces to VVW. In the case of \chNH3 the line coupling terms per broadener are fit to specific values and this causes a distinct difference between the BR and VVW line shapes. In the case of \chSO2 there are \chCO2 line shifts included within the \chCO2 broadening parameters for the \chSO2 molecule, which causes a slight difference between the BR and VVW line shapes in Fig. 2. Previous works which utilized a VVW line shape for modeling the opacity of \chPH3 within the microwave region include Mohammed and Steffes (2004, 2003); Hoffman et al. (1999, 2001). In this work, the VVW line shape is chosen for \chPH3 calculations.
Results
The following comparisons to laboratory measurements are used to demonstrate the efficacy of HAPI to calculate opacities under Jovian and Venusian-like atmospheric conditions. These results include calculated spectra of \chNH3, \chSO2 and \chPH3 using line parameters from HITRAN2020. Each spectrum is calculated using HAPI and the microwave line shapes (e.g., Van Vleck & Weisskopf, Ben-Reuven) presented in this work. The calculated spectra have been compared to available experimental opacities with error bars taken from the cited text in order to validate the accuracy of the HAPI calculations. Environmental conditions and mixture concentrations vary throughout the comparisons and the spectral regions are dependent on the conditions of the experimental observations. For each comparison, the lower panel depicts the residuals from the available laboratory measurements to the HAPI calculated opacities and serve as additional quantitative evidence of HAPI’s excellent performance. Additional comparisons are provided in the supplementary materials section in conjunction with publication of this work in the Monthly Notices of the Royal Astronomical Society (MNRAS).
\chNH3 Comparisons
Fig. 4 demonstrates the effect of a variety of broadening parameters on the microwave spectrum of \chNH3 at a range of temperatures and pressures. Each comparison shows HAPI’s Ben-Reuven (1966) calculation and modeling performance at different spectral ranges compared to experimental opacities and available corresponding opacity models (Devaraj et al., 2014, 2011; Steffes and Jenkins, 1987; Joiner and Steffes, 1991). In Fig. 4 (a) it can be seen that the laboratory measurements toward lower frequencies of the inversion peak coincide with the calculated spectrum from HAPI. The corresponding residuals demonstrate how the HAPI calculation consistently provides the best match to observation. This result can be attributed in part to the robust \chH2O broadening data in HITRAN for \chNH3. In Fig. 4 (b) laboratory opacities for gas mixture concentrations of \chNH3 broadened by \chH2 and \chHe are shown, these are the major constituents in Jupiter’s atmosphere. In Fig. 4 (c) the spectral region at higher frequencies, beyond the primary \chNH3 inversion peak, is shown. The HAPI calculated opacities once again provide the smallest residuals for these conditions, suggesting that not only is HITRAN data consistent with laboratory measurements within the inversion mode but this continues up to the higher frequencies where comparisons are available (5 cm-1). The accuracy of HAPI calculations in Fig. 4 (b) and (c) can be attributed to accurate \chH2 and \chHe broadening values and updates provided by HITRAN2020. Further comparisons for the opacity of \chNH3 at a range of pressures (0.17-13.80 atm), temperatures (193-501.31 K), and mixtures (containing \chH2, \chHe, and \chH2O) are provided in the supplementary material in conjunction with publication of this work in the Monthly Notices of the Royal Astronomical Society (MNRAS).
(a)  (b)
(b) 
|
(c) 
|
\chSO2 Comparisons
Fig. 5 displays the use of the \chCO2 broadening parameters on the microwave spectrum of \chSO2 at various environmental conditions. Each figure includes the HAPI calculated opacity (using the BR line shape) compared to the available laboratory opacities (Bellotti and Steffes, 2015; Steffes et al., 2015). In these comparisons two HAPI spectra are generated using HITRAN2020 and HITRAN2016, respectively. The differences demonstrate improvements that the new \chCO2 broadening data have made in the microwave region. In Fig. 5 (a) the pressure and temperature conditions are very high. Therefore, excellent performance under these circumstances suggest that HITRAN data can be used to accurately calculate \chSO2 opacities at relatively high pressure and temperature conditions. In Fig. 5 (b) the spectral range is at higher frequencies and the HAPI calculated spectrum compares well to the laboratory opacities in this region. Fig. 5 (c) is similar to Fig. 5 (b) except it is at a lower pressure and therefore the underlying transitions are more apparent in the spectrum. As can be seen in Fig. 5 (c), at a lower pressure the improvement in the residuals between HITRAN2020 and HITRAN2016 is clearly distinct. The excellent performance of the HAPI calculations in these comparisons can be attributed to the updated \chCO2 broadening parameters. Further comparisons for the opacity of \chSO2 at a range of pressures (0.02-89.66 atm), temperatures (295-505 K), and mixtures (containing \chCO2 and \chN2) are provided in the supplementary material in conjunction with publication of this work in the Monthly Notices of the Royal Astronomical Society (MNRAS).
(a)  (b)
(b) 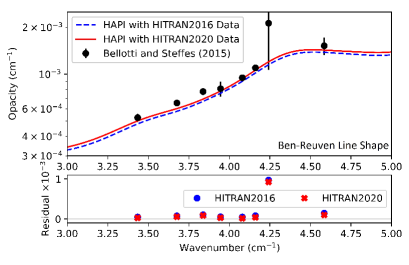
|
(c) 
|
\chPH3 Comparisons
Fig. 6 displays the spectrum of \chPH3 in the region of the inversion mode. Unlike \chNH3, the inversion spectrum of \chPH3 has never been observed despite of many attempts (Sousa-Silva et al., 2016). This is due to \chPH3 having a larger mass and a higher inversion energy barrier than its analogue \chNH3 (Sousa-Silva et al., 2016) which conversely inverts easily at very low frequencies. Despite these findings Hoffman et al. (2001) discovered that previous attempts to approximate the opacity contribution of \chPH3 prior to the first 1 00 line was largely underestimated. Therefore, even though the \chPH3 inversion spectrum is very weak, this does not negate the necessity to include the available low frequency spectroscopic data when calculating \chPH3 spectra in the microwave.
From the comparisons in Fig. 6 the HAPI calculated spectra often remain within the error bars of the laboratory measurements (Hoffman et al., 2001; Mohammed and Steffes, 2003, 2004), except at the lowest frequencies. This close correlation to laboratory opacities is in part due to the use of the VVW line shape as well as the recently added \chH2 and \chHe broadening parameters for \chPH3 (Tan et al., 2022). In Fig. 6 (a) the gas mixtures in each data set are identical and the three laboratory experiments fall within 1.67 K and 0.07 atm. In Fig. 6 (b) the gas mixtures in each data set are identical and the three experimental measurements fall within 3.0 K and 0.006 atm. The laboratory opacities have a more consistent trend due to the measurements from Hoffman et al. (2001) exhibiting less intensity variation than that of the other \chPH3 comparisons. This decrease in variability of the laboratory opacities allowed for the best residual between HAPI’s calculation and the available laboratory data. In Fig. 6 (c) the gas mixtures in each data set are identical and the three experimental opacities fall within 2.67 K and 0.023 atm. A further comparison for the opacity of \chPH3 at a pressure of 0.986 atm, temperature of 295.33 K and a mixture containing 82.6% \chH2 and 9.2% \chHe is provided in the supplementary material in conjunction with publication of this work in the Monthly Notices of the Royal Astronomical Society (MNRAS).
(a) 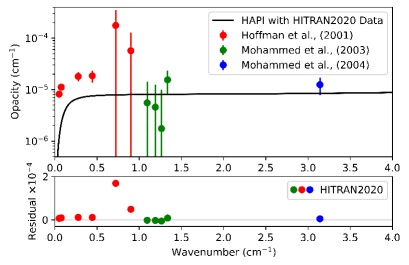 (b)
(b) 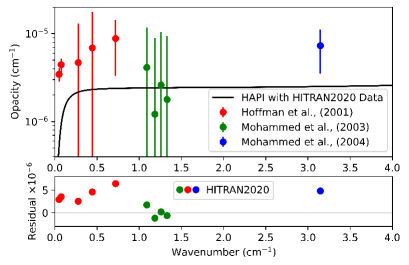
|
(c) 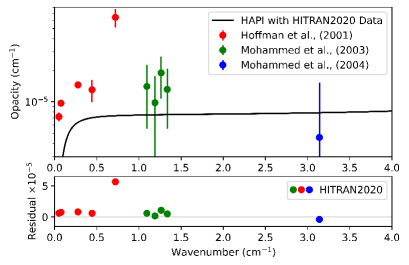
|
Discussion
After detailed comparisons between laboratory measured opacities and HAPI calculated opacities of \chNH3 and \chSO2 in the microwave region, it was shown that the HAPI calculated opacities (using HITRAN2020 data) are able to reproduce experimental observations up to temperatures of 600 K and pressures up to 100 atm. With that, one should note that typically it is not recommended to use HITRAN data for calculations up to these limits, as many transitions that would have non-negligible contributions to the high-temperature spectra (due to thermal population of the higher-lying ro-vibrational energy levels) will be missing. Moreover, if one would want to use line-by-line data from HITRAN in the infrared part of the spectrum, 600 K may be too high to accurately reproduce the spectrum. In general, at higher temperature users are suggested to use the high-temperature molecular spectroscopic database (HITEMP) at https://hitran.org/hitemp/ which contains substantially more transitions. Unfortunately, \chNH3, \chPH3 and \chSO2 are not yet in HITEMP, but efforts are underway to combine validated experimental and ab initio data (see for instance how this was done for \chCH4 (Hargreaves et al., 2020)) to add the high-temperature line lists for these molecules.
Upon implementation of the VVW line shape for \chSO2 opacity, its overall performance showed distinct issues upon comparisons with laboratory data at pressures greater than 4 atm. Although within the microwave region at pressures less than 4 atm, the VVW line shape performed well upon comparison with laboratory data. Fig. 7 parallels Fig. 5 in the results section with the primary difference being that the VVW line shape calculations are used to simulate the HITRAN2020 data in order to see their effect. Fig. 7 includes the HAPI calculated opacity (using the VVW line shape) compared to the available laboratory opacities (Bellotti and Steffes, 2015; Steffes et al., 2015). In these comparisons two HAPI spectra are generated using HITRAN2020 and HITRAN2016 data, respectively. Note that in HITRAN2016 the \chCO2 shifts were set to a value of zero for all transitions. In Fig. 7 (a) at high pressure it is evident that the inclusion of the \chCO2-induced line shifts increase the calculated opacity of the spectra, which therefore causes a poor-fit to the laboratory data. In Fig. 7 (b) and (c) at lower pressures the HITRAN2020 spectra are visibly unchanged when \chCO2 pressure-induced line shifts are included. The VVW line shape (equation 2) does not explicitly include line shifts and it was applied in HAPI the same way shifts are added to the Voigt profile. This apparently fails at high pressures. The BR line shape (equation 4) incorporates the line shifts better for microwave calculations at high pressures. However, one should keep in mind that the shifts in HITRAN are not based on the fit of spectral lines with the BR line shape. Ideally they should be and the line-coupling parameter () should be fit to high-resolution spectra when possible. In this work is not fit due to the limited pressure data available in the literature between 4 and 30 atm in the microwave region. It may not be too dramatic of an effect as the density of rotational lines of \chSO2 is much less than in the inversion spectrum of \chNH3 and the line mixing effect would be less pronounced.
(a) 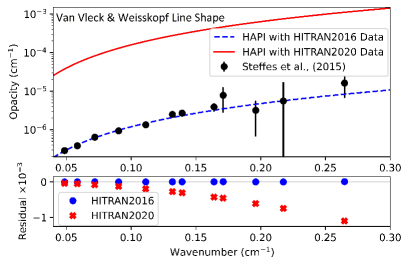 (b)
(b) 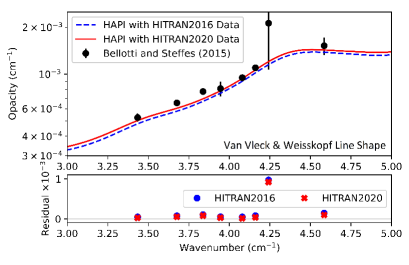
|
(c) 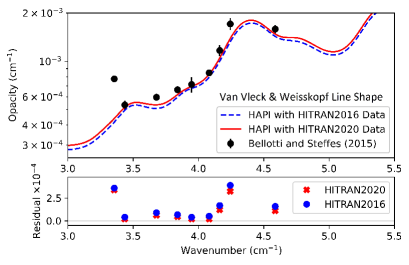
|
Initial comparisons to the \chNH3 experimental works indicated that the self-broadening of the \chNH3 transition at 4.67463 cm-1 was too large in HITRAN2016. Following these comparisons, the value for self-broadening was reduced from 0.437 cm-1/atm to 0.250 cm-1/atm in HITRAN. The evidence for this choice is given in Fig. 4 (c) where the strong correlation between the calculated HAPI spectrum and the laboratory opacities from Devaraj et al. (2011) for the 4.67 cm-1 region is evident in both the upper and lower panels. In this work it has been demonstrated that HITRAN broadening data can be used as is to calculate the opacities of \chNH3, \chSO2 and \chPH3.
In calculation of opacities with HAPI, this work took into account the collision induced absorption (CIA) data from HITRAN in comparisons against laboratory data. However, when plotting \chH2-\chH2 collision complexes (originating from (Abel et al., 2011; Fletcher et al., 2018)) under high pressures and temperatures, their intensity and overall influence on the microwave opacity of \chNH3 and \chPH3 were negligible. The inversion spectrum of \chNH3 in the microwave region is exceptionally strong in intensity and therefore dominated any inclusion of \chH2 collision induced absorption data. Conversely, the weak \chPH3 inversion spectrum was predicted to be affected by the inclusion of CIA data. However, it was determined that the inclusion of \chH2-\chH2 collision complexes added no significant absorption to the \chPH3 comparisons. Similarly, for \chSO2 this work included \chCO2 collision complexes within the comparisons. However, \chSO2 has many dense spectral transitions within the microwave region and these effects dominate any inclusion of \chCO2 collision complexes at low pressure conditions. During \chSO2 opacity calculations, at higher pressures it was found that when CIA was included, it simulates too much opacity contribution (compared to what is seen in laboratory data). \chCO2-\chCO2 CIA data (originating from Gruszka and Borysow (1997)) could be applied more appropriately within the \chSO2 calculations if the Ben-Reuven line-coupling coefficient was fitted properly. However, in this work, there is not enough laboratory data at pressures between 4 and 30 atm within the literature, in order to properly fit the line-coupling coefficient.
A potential issue that did not manifest itself in the comparisons of this work, is that both HITRAN and the \chNH3 opacity models currently assume a temperature dependence of the widths to be a single power law (equation 1), which is known to be insufficient over a wide range of temperatures (Gamache and Vispoel, 2018). As described in Stolarczyk et al. (2020), the HITRAN database has plans to adapt the double power law representation proposed by Gamache and Vispoel (2018). In the present work however, a single power law was capable of sufficiently modeling the experimental observations up to 600 K. Additionally, it is likely that secondary collisions become relevant at very high pressures. However, in these test cases this effect was not pronounced enough to limit the quality of our fit to laboratory data. The pressures used in calculating opacities are taken from the experimental data and represent “effective” ideal gas pressures calculated from \chH2 equation of state. Indeed, at very high pressures the compression of the gas causes departures from the ideal gas (Devaraj et al., 2014).
Additional comparisons between HAPI and available \chNH3 and \chSO2 laboratory data, that are not already included in the main paper, are provided as supplementary material in conjunction with publication of this work in the Monthly Notices of the Royal Astronomical Society (MNRAS). Overall, these additional comparisons encompass more environmental conditions, gas mixture concentrations, spectral regions and they further demonstrate the excellent results attainable from HITRAN data by using HAPI. In particular, these comparisons were made possible by using new microwave line shape calculations with the HAPI program. These new calculations are in a Python programming script that is designed to be used along with HAPI (Kochanov et al., 2016). Use of these line shapes are recommended for calculations in the microwave region where the calculation includes frequencies near 0 cm-1.
Conclusions
It is well understood that the microwave emission spectrum of Jupiter’s troposphere reflects the abundance and distribution of constituents such as \chNH3, \chH2O vapor, and aqueous \chNH3 clouds (Janssen et al., 2005). Thus, the microwave absorption properties of \chNH3 and \chNH3 broadened by \chH2, \chHe and \chH2O, are essential for further understanding of these constituents under Jovian conditions. Many extensive laboratory studies have previously been conducted on the microwave opacity of \chNH3 and \chH2O vapor (i.e., Steffes and Jenkins, 1987; Joiner et al., 1989; Joiner and Steffes, 1991; Mohammed and Steffes, 2003, 2004; Hanley et al., 2009; Devaraj et al., 2011, 2014; Bellotti et al., 2016), which have been used for a series of opacity models. This present work utilizes the aforementioned laboratory measurements to conduct a thorough validation of HITRAN2020 data and new broadening parameters by using the HITRAN application programming interface (HAPI). This work serves to provide HITRAN users with efficient microwave line shape calculations and demonstrate HAPI’s efficacy to model opacities under Jovian conditions as a test case.
The discovery of \chPH3 on Venus, along with \chPH3 identified as a potential bio-marker, has been controversial with many re-analyses (e.g. Akins et al. (2021); Snellen et al. (2020)) of the Greaves et al. (2021b) observations. This has created a heightened interest to study the Venusian atmosphere in the search for \chPH3 (Hasan et al., 2021). Additionally, several re-analyses of the \chPH3 detection on Venus have suggested that \chSO2 could account for the signal (Villanueva et al., 2021; Lincowski et al., 2021). Due to the fact that many of the re-analyses have utilized HITRAN \chSO2-\chCO2 broadening data to account for their observations (Villanueva et al., 2021; Lincowski et al., 2021), the potential effects of new HITRAN \chSO2-\chCO2 broadening data have been investigated in this work. From our \chSO2 comparisons it is evident that the HITRAN2020 \chSO2-\chCO2 broadening data performs better than that of HITRAN2016. On one hand this is no surprise given that the HITRAN2016 data were based off of a single measurement from 1963 (Krishnaji, 1963), on the other hand the HITRAN2016 results are still quite satisfactory and therefore unlikely to undermine conclusions of Lincowski et al. (2021); Villanueva et al. (2021). The results from the \chPH3 test case comparisons demonstrate that the \chPH3 microwave spectrum is very weak at low frequencies. This is due to \chPH3 having a larger mass and a higher inversion energy barrier than its analogue \chNH3 (Sousa-Silva et al., 2016) which conversely inverts easily at very low frequencies. Additionally, for accurate analyses of \chPH3 detections on Venus, there is a need for measurements of \chPH3 broadened by \chCO2, which is currently not available in the literature.
The line shape codes utilized in this work (Ben-Reuven, 1966; Gross, 1955; Van Vleck and Weisskopf, 1945) are available as supplementary material in conjunction with publication of this work in the Monthly Notices of the Royal Astronomical Society (MNRAS) and will also be incorporated into the future version of HAPI, HAPI 2.0. Excellent agreement with experimental opacities in these test cases shows that using HAPI with a Ben-Reuven (1966) line shape allows one to accurately calculate the opacity of \chNH3 under Jovian conditions and \chSO2 under Venusian conditions. Similarly, the opacity of \chPH3 can be calculated under Venusian conditions in this work by using a Van Vleck and Weisskopf (1945) line shape.
This work has made hundreds of comparisons to laboratory measurements and corresponding opacity models, the majority of which have proven HAPI’s efficacy at modeling \chNH3, \chSO2 and \chPH3 in the microwave region. The test cases presented in this work emphasize that HAPI is available to serve as an additional tool in modeling molecular opacities under diverse planetary conditions. This is made possible by utilizing an expansive and well updated spectroscopic database, new broadening data and a sophisticated Python application to enable complicated spectra calculations for planetary atmospheres. HAPI also allows users extensive options in calculating spectra with their desired functions and outputs, which HITRANonline also provides.
Overall, HITRAN and HAPI can be used towards modeling spectra of different molecules in atmospheres with different concentrations of dominant gases, including exoplanetary atmospheres.
Acknowledgments and Funding
This work was carried out in the framework of enhancing capabilities of the HITRAN database towards modeling of planetary atmospheres supported through NASA PDART grants NNX16AG51G and 80NSSC20K1059. We acknowledge Amadeo Bellotti, who provided the most recent unified \chNH3 opacity model and corresponding laboratory data, referenced in this work as ”Private Communication”. We respectfully acknowledge Artem Finenko who assisted with testing the inclusion of collision induced absorption data into this works comparisons. We also wish to acknowledge Roman Kochanov, for his help with the HAPI libraries.
Conflicts of Interest
The authors declare that they have no known competing financial interests or personal relationships that could have appeared to influence the work reported in this paper. The funders had no role in the design of the study; in the collection, analyses, or interpretation of data; in the writing of the manuscript, or in the decision to publish the results.
Bibliography
References
- Abel et al. (2011) Abel, M., Frommhold, L., Li, X., Hunt, K.L.C., 2011. Collision-Induced Absorption by H¡sub¿2¡/sub¿ Pairs: From Hundreds to Thousands of Kelvin. The Journal of Physical Chemistry A 115, 6805–6812. URL: http://pubs.acs.org/doi/abs/10.1021/jp109441f, doi:10.1021/jp109441f.
- Akins et al. (2021) Akins, A.B., Lincowski, A.P., Meadows, V.S., Steffes, P.G., 2021. Complications in the ALMA Detection of Phosphine at Venus. The Astrophysical Journal 907, L27. doi:10.3847/2041-8213/abd56a.
- Anderson (1949) Anderson, P.W., 1949. Pressure Broadening in the Microwave and Infra-Red Regions. Physical Review 76, 647–661. doi:10.1103/PhysRev.76.647.
- Atreya et al. (1995) Atreya, S.K., Edgington, S.G., Trafton, L.M., Caldwell, J.J., Noll, K.S., Weaver, H.A., 1995. Abundances of ammonia and carbon disulfide in the Jovian stratosphere following the impact of comet Shoemaker-Levy 9. Geophysical Research Letters 22, 1625–1628. doi:10.1029/95GL01718.
- Atreya et al. (2003) Atreya, S.K., Mahaffy, P.R., Niemann, H.B., Wong, M.H., Owen, T.C., 2003. Composition and origin of the atmosphere of Jupiter - an update, and implications for the extrasolar giant planets. Planetary and Space Science 51, 105–112. doi:10.1016/S0032-0633(02)00144-7.
- Bains et al. (2020) Bains, W., Petkowski, J.J., Seager, S., Ranjan, S., Sousa-Silva, C., Rimmer, P.B., Zhan, Z., Greaves, J.S., Richards, A.M.S., 2020. Phosphine on Venus Cannot be Explained by Conventional Processes. arXiv e-prints , arXiv:2009.06499.
- Bellotti (2020) Bellotti, A., 2020. Laboratory measurements of the opacity of ammonia from Bellotti et al., (2016) via private communication.
- Bellotti and Steffes (2015) Bellotti, A., Steffes, P.G., 2015. The millimeter-wavelength sulfur dioxide absorption spectra measured under simulated Venus conditions. Icarus 254, 24–33. doi:10.1016/j.icarus.2015.03.028.
- Bellotti et al. (2016) Bellotti, A., Steffes, P.G., Chinsomboom, G., 2016. Laboratory measurements of the 5-20 cm wavelength opacity of ammonia, water vapor, and methane under simulated conditions for the deep jovian atmosphere. Icarus 280, 255–267. doi:10.1016/j.icarus.2016.07.013.
- Ben-Reuven (1966) Ben-Reuven, A., 1966. Impact Broadening of Microwave Spectra. Physical Review 145, 7–22. doi:10.1103/PhysRev.145.7.
- Birnbaum and Maryott (1953) Birnbaum, G., Maryott, A.A., 1953. Absorption in the Low-Frequency Wing of the NH3 Inversion Spectrum. The Journal of Chemical Physics 21, 1774–1777. doi:10.1063/1.1698661.
- Bolton et al. (2017) Bolton, S.J., Adriani, A., Adumitroaie, V., Allison, M., Anderson, J., Atreya, S., Bloxham, J., Brown, S., Connerney, J.E.P., DeJong, E., Folkner, W., Gautier, D., Grassi, D., Gulkis, S., Guillot, T., Hansen, C., Hubbard, W.B., Iess, L., Ingersoll, A., Janssen, M., Jorgensen, J., Kaspi, Y., Levin, S.M., Li, C., Lunine, J., Miguel, Y., Mura, A., Orton, G., Owen, T., Ravine, M., Smith, E., Steffes, P., Stone, E., Stevenson, D., Thorne, R., Waite, J., Durante, D., Ebert, R.W., Greathouse, T.K., Hue, V., Parisi, M., Szalay, J.R., Wilson, R., 2017. Jupiter’s interior and deep atmosphere: The initial pole-to-pole passes with the Juno spacecraft. Science 356, 821–825. doi:10.1126/science.aal2108.
- Bolton et al. (2021) Bolton, S.J., Levin, S., Guillot, T., Li, C., Kaspi, Y., Orton, G., Wong, M.H., Oyafuso, F., Allison, M., Arballo, J., et al., 2021. Microwave observations reveal the deep extent and structure of jupiter’s atmospheric vortices. Science 374, 964–968. doi:10.1126/science.abf1015.
- Bolton et al. (2019) Bolton, S.J., Levin, S., Janssen, M., Oyafuso, F.A., Zhang, Z., Arballo, J.K., Li, C., Wong, M.H., Orton, G., 2019. Initial Results of Juno’s Microwave Imaging of Jupiter’s Atmosphere at Multiple Depths, in: AGU Fall Meeting Abstracts, pp. P21G–3455.
- Borkov et al. (2019) Borkov, Y.G., Lyulin, O.M., Petrova, T.M., Solodov, A.M., Solodov, A.A., Deichuli, V.M., Perevalov, V.I., 2019. CO2-broadening and shift coefficients of sulfur dioxide near 4 m. Journal of Quantitative Spectroscopy and Radiative Transfer 225, 119–124. doi:10.1016/j.jqsrt.2018.12.030.
- Canè et al. (2019) Canè, E., Di Lonardo, G., Fusina, L., Tamassia, F., Predoi-Cross, A., 2019. The v2 = 1, 2 and v4 = 1 bending states of 15NH3 and their analysis at experimental accuracy. The Journal of Chemical Physics 150, 194301. doi:10.1063/1.5088751.
- Ceselin et al. (2017) Ceselin, G., Tasinato, N., Puzzarini, C., Pietropolli Charmet, A., Stoppa, P., Giorgianni, S., 2017. CO2-, He- and H2-broadening coefficients of SO2 for 1 band and ground state transitions for astrophysical applications. Journal of Quantitative Spectroscopy and Radiative Transfer doi:10.1016/j.jqsrt.2017.02.018.
- Chinsomboon and Steffes (2012) Chinsomboon, G., Steffes, P.G., 2012. Laboratory Measurements of the 5-20 cm Wavelength Opacity of Ammonia Pressure-Broadened by Methane under Jovian Conditions, in: AAS/Division for Planetary Sciences Meeting Abstracts #44, p. 412.28.
- Coles et al. (2019) Coles, P.A., Yurchenko, S.N., Tennyson, J., 2019. ExoMol molecular line lists - XXXV. A rotation-vibration line list for hot ammonia. Monthly Notices of the Royal Astronomical Society 490, 4638–4647. doi:10.1093/mnras/stz2778.
- De Biévre et al. (1984) De Biévre, P., Gallet, M., Holden, N.E., Barnes, I.L., 1984. Isotopic Abundances and Atomic Weights of the Elements. Journal of Physical and Chemical Reference Data 13, 809–891. doi:10.1063/1.555720.
- Debye (1929) Debye, P., 1929. Polare Molekeln. Leipzig, Verlag von S. Hirzel.
- Devaraj et al. (2014) Devaraj, K., Steffes, P.G., Duong, D., 2014. The centimeter-wavelength opacity of ammonia under deep jovian conditions. Icarus 241, 165–179. doi:10.1016/j.icarus.2014.06.017.
- Devaraj et al. (2011) Devaraj, K., Steffes, P.G., Karpowicz, B.M., 2011. Reconciling the centimeter- and millimeter-wavelength ammonia absorption spectra under jovian conditions: Extensive millimeter-wavelength measurements and a consistent model. Icarus 212, 224–235. doi:10.1016/j.icarus.2010.12.010.
- Down et al. (2013) Down, M.J., Hill, C., Yurchenko, S.N., Tennyson, J., Brown, L.R., Kleiner, I., 2013. Re-analysis of ammonia spectra: Updating the HITRAN 14NH3 database. Journal of Quantitative Spectroscopy and Radiative Transfer 130, 260–272. doi:10.1016/j.jqsrt.2013.05.027.
- Dudaryonok and Lavrentieva (2018) Dudaryonok, A.S., Lavrentieva, N.N., 2018. Theoretical estimation of SO2 line broadening coefficients induced by carbon dioxide in the 150-300 K temperature range. Journal of Quantitative Spectroscopy and Radiative Transfer 219, 360–365. doi:10.1016/j.jqsrt.2018.08.022.
- Encrenaz et al. (2020) Encrenaz, T., Greathouse, T.K., Marcq, E., Widemann, T., Bézard, B., Fouchet, T., Giles, R., Sagawa, H., Greaves, J., Sousa-Silva, C., 2020. A stringent upper limit of the PH3 abundance at the cloud top of Venus. Astronomy & Astrophysics 643, L5. doi:10.1051/0004-6361/202039559.
- Endres et al. (2016) Endres, C.P., Schlemmer, S., Schilke, P., Stutzki, J., Müller, H.S.P., 2016. The Cologne Database for Molecular Spectroscopy, CDMS, in the Virtual Atomic and Molecular Data Centre, VAMDC. Journal of Molecular Spectroscopy 327, 95–104. doi:10.1016/j.jms.2016.03.005, arXiv:1603.03264.
- Evdokimova et al. (2021) Evdokimova, D., Belyaev, D., Montmessin, F., Korablev, O., Bertaux, J.L., Verdier, L., Lefèvre, F., Marcq, E., 2021. The Spatial and Temporal Distribution of Nighttime Ozone and Sulfur Dioxide in the Venus Mesosphere as Deduced From SPICAV UV Stellar Occultations. Journal of Geophysical Research (Planets) 126, e06625. doi:10.1029/2020JE006625.
- Fletcher et al. (2018) Fletcher, L.N., Gustafsson, M., Orton, G.S., 2018. Hydrogen Dimers in Giant-planet Infrared Spectra. The Astrophysical Journal Supplement Series 235, 24. URL: http://stacks.iop.org/0067-0049/235/i=1/a=24?key=crossref.cdd84a95e712269eab7fa6fa7ce52e60, doi:10.3847/1538-4365/aaa07a.
- Fletcher et al. (2009) Fletcher, L.N., Orton, G.S., Teanby, N.A., Irwin, P.G.J., 2009. Phosphine on Jupiter and Saturn from Cassini/CIRS. Icarus 202, 543--564. doi:10.1016/j.icarus.2009.03.023.
- Fletcher et al. (2021) Fletcher, L.N., Oyafuso, F.A., Allison, M., Ingersoll, A., Li, L., Kaspi, Y., Galanti, E., Wong, M.H., Orton, G.S., Duer, K., Zhang, Z., Li, C., Guillot, T., Levin, S.M., Bolton, S., 2021. Jupiter’s Temperate Belt/Zone Contrasts Revealed at Depth by Juno Microwave Observations. Journal of Geophysical Research (Planets) 126, e06858. doi:10.1029/2021JE006858.
- Fox (2012) Fox, J.L., 2012. The ionospheric source of the red and green lines of atomic oxygen in the Venus nightglow. Icarus 221, 787--799. doi:10.1016/j.icarus.2012.09.007.
- Fröhlich (1946) Fröhlich, H., 1946. Shape of Collision-Broadened Spectral Lines. Nature 157, 478. doi:10.1038/157478a0.
- Furtenbacher et al. (2020) Furtenbacher, T., Coles, P.A., Tennyson, J., Yurchenko, S.N., Yu, S., Drouin, B., Tóbiás, R., Császár, A.G., 2020. Empirical rovibrational energy levels of ammonia up to 7500 cm-1. Journal of Quantitative Spectroscopy and Radiative Transfer 251, 107027. doi:10.1016/j.jqsrt.2020.107027.
- Gamache and Vispoel (2018) Gamache, R.R., Vispoel, B., 2018. On the temperature dependence of half-widths and line shifts for molecular transitions in the microwave and infrared regions. Journal of Quantitative Spectroscopy and Radiative Transfer 217, 440--452. doi:10.1016/j.jqsrt.2018.05.019.
- Garvin (2021) Garvin, J., 2021. Deep Atmosphere Venus Investigation of Noble gases, Chemistry, and Imaging Plus (DAVINCI+): Discovering a New Venus via a Flyby, Probe, Orbiter Mission, in: 43rd COSPAR Scientific Assembly. Held 28 January - 4 February, p. 442.
- Gordon et al. (2022) Gordon, I.E., Rothman, L.S., Hargreaves, R.J., Hashemi, R., Karlovets, E.V., Skinner, F.M., Conway, E.K., Hill, C., Kochanov, R.V., Tan, Y., Wcisło, P., Finenko, A.A., Nelson, K., Bernath, P.F., Birk, M., Boudon, V., Campargue, A., Chance, K.V., Coustenis, A., Drouin, B.J., Flaud, J.M., Gamache, R.R., Hodges, J.T., Jacquemart, D., Mlawer, E.J., Nikitin, A.V., Perevalov, V.I., Rotger, M., Tennyson, J., Toon, G.C., Tran, H., Tyuterev, V.G., Adkins, E.M., Baker, A., Barbe, A., Canè, E., Császár, A.G., Dudaryonok, A., Egorov, O., Fleisher, A.J., Fleurbaey, H., Foltynowicz, A., Furtenbacher, T., Harrison, J.J., Hartmann, J.M., Horneman, V.M., Huang, X., Karman, T., Karns, J., Kassi, S., Kleiner, I., Kofman, V., Kwabia--Tchana, F., Lavrentieva, N.N., Lee, T.J., Long, D.A., Lukashevskaya, A.A., Lyulin, O.M., Makhnev, V.Y., Matt, W., Massie, S.T., Melosso, M., Mikhailenko, S.N., Mondelain, D., Müller, H.S.P., Naumenko, O.V., Perrin, A., Polyansky, O.L., Raddaoui, E., Raston, P.L., Reed, Z.D., Rey, M., Richard, C., Tóbiás, R., Sadiek, I., Schwenke, D.W., Starikova, E., Sung, K., Tamassia, F., Tashkun, S.A., Vander Auwera, J., Vasilenko, I.A., Vigasin, A.A., Villanueva, G.L., Vispoel, B., Wagner, G., Yachmenev, A., Yurchenko, S.N., 2022. The HITRAN2020 molecular spectroscopic database. J. Quant. Spectrosc. Radiat. Transfer 277, 107949. doi:10.1016/j.jqsrt.2021.107949.
- Greaves et al. (2021a) Greaves, J.S., Richards, A.M.S., Bains, W., Rimmer, P.B., Sagawa, H., Clements, D.L., Seager, S., Petkowski, J.J., Sousa-Silva, C., Ranjan, S., Drabek-Maunder, E., Fraser, H.J., Cartwright, A., Mueller-Wodarg, I., Zhan, Z., Friberg, P., Coulson, I., Lee, E., Hoge, J., 2021a. Addendum: Phosphine gas in the cloud deck of Venus. Nature Astronomy 5, 726--728. doi:10.1038/s41550-021-01423-y.
- Greaves et al. (2021b) Greaves, J.S., Richards, A.M.S., Bains, W., Rimmer, P.B., Sagawa, H., Clements, D.L., Seager, S., Petkowski, J.J., Sousa-Silva, C., Ranjan, S., Drabek-Maunder, E., Fraser, H.J., Cartwright, A., Mueller-Wodarg, I., Zhan, Z., Friberg, P., Coulson, I., Lee, E., Hoge, J., 2021b. Phosphine gas in the cloud decks of Venus. Nature Astronomy 5, 655--664. doi:10.1038/s41550-020-1174-4.
- Gross (1955) Gross, E.P., 1955. Shape of Collision-Broadened Spectral Lines. Physical Review 97, 395--403. doi:10.1103/PhysRev.97.395.
- Gruszka and Borysow (1997) Gruszka, M., Borysow, A., 1997. Roto-Translational Collision-Induced Absorption of CO2for the Atmosphere of Venus at Frequencies from 0 to 250 cm-1, at Temperatures from 200 to 800 K. Icarus 129, 172--177. doi:10.1006/icar.1997.5773.
- Guillot et al. (2019) Guillot, T., Stevenson, D., Li, C., Atreya, S., Ingersoll, A., Bolton, S., 2019. Storms and the distribution of ammonia in Jupiter’s atmosphere, in: EPSC-DPS Joint Meeting 2019, pp. EPSC--DPS2019--1142.
- Guillot et al. (2020) Guillot, T., Stevenson, D.J., Atreya, S.K., Bolton, S.J., Becker, H.N., 2020. Storms and the Depletion of Ammonia in Jupiter: I. Microphysics of ‘‘Mushballs’’. Journal of Geophysical Research (Planets) 125, e06403. doi:10.1029/2020JE006403.
- Haider et al. (2018) Haider, S.A., Bhardwaj, A., Shanmugam, M., Goyal, S.K., Sheel, V., Pabari, J., Prasad Karanam, D., 2018. Indian Mars and Venus Missions: Science and Exploration, in: 42nd COSPAR Scientific Assembly, pp. B4.1--10--18.
- Hanley et al. (2009) Hanley, T.R., Steffes, P.G., Karpowicz, B.M., 2009. A new model of the hydrogen and helium-broadened microwave opacity of ammonia based on extensive laboratory measurements. Icarus 202, 316--335. doi:10.1016/j.icarus.2009.02.002.
- Hargreaves et al. (2020) Hargreaves, R.J., Gordon, I.E., Rey, M., Nikitin, A.V., Tyuterev, V.G., Kochanov, R.V., Rothman, L.S., 2020. An Accurate, Extensive, and Practical Line List of Methane for the HITEMP Database. The Astrophysical Journal Supplement Series 247, 55. doi:10.3847/1538-4365/ab7a1a, arXiv:2001.05037.
- Hasan et al. (2021) Hasan, P., Arun, K., Kiren, O.V., Sivaram, C., 2021. The Phosphine Controversy: Is it Phosphine? Is There Life on Venus? Astrobiology Newsletter No. 1 14, 4--17. doi:10.13140/RG.2.2.13819.23847.
- Hashemi et al. (2020) Hashemi, R., Gordon, I.E., Tran, H., Kochanov, R.V., Karlovets, E.V., Tan, Y., Lamouroux, J., Ngo, N.H., Rothman, L.S., 2020. Revising the line-shape parameters for air- and self-broadened CO2 lines toward a sub-percent accuracy level. Journal of Quantitative Spectroscopy and Radiative Transfer 256, 107283. doi:10.1016/j.jqsrt.2020.107283.
- Hoffman et al. (1999) Hoffman, J.P., Steffes, P.G., DeBoer, D.R., 1999. NOTE: Laboratory Measurements of Phosphine’s Microwave Opacity: Implications for Planetary Radio Science. Icarus 140, 235--238. doi:10.1006/icar.1999.6158.
- Hoffman et al. (2001) Hoffman, J.P., Steffes, P.G., DeBoer, D.R., 2001. Laboratory Measurements of the Microwave Opacity of Phosphine: Opacity Formalism and Application to the Atmospheres of the Outer Planets. Icarus 152, 172--184. doi:10.1006/icar.2001.6622.
- Huang et al. (2019) Huang, X., Schwenke, D.W., Lee, T.J., 2019. Quantitative validation of Ames IR intensity and new line lists for 32/33/34S16O2, 32S18O2 and 16O32S18O. Journal of Quantitative Spectroscopy and Radiative Transfer 225, 327--336. doi:10.1016/j.jqsrt.2018.11.039.
- Ingersoll et al. (2017) Ingersoll, A.P., Adumitroaie, V., Allison, M.D., Atreya, S., Bellotti, A.A., Bolton, S.J., Brown, S.T., Gulkis, S., Janssen, M.A., Levin, S.M., Li, C., Li, L., Lunine, J.I., Orton, G.S., Oyafuso, F.A., Steffes, P.G., 2017. Implications of the ammonia distribution on Jupiter from 1 to 100 bars as measured by the Juno microwave radiometer. Geophysical Research Letters 44, 7676--7685. doi:10.1002/2017GL074277.
- Janssen et al. (2005) Janssen, M.A., Hofstadter, M.D., Gulkis, S., Ingersoll, A.P., Allison, M., Bolton, S.J., Levin, S.M., Kamp, L.W., 2005. Microwave remote sensing of Jupiter’s atmosphere from an orbiting spacecraft. Icarus 173, 447--453. doi:10.1016/j.icarus.2004.08.012.
- Janssen et al. (2017) Janssen, M.A., Oswald, J.E., Brown, S.T., Gulkis, S., Levin, S.M., Bolton, S.J., Allison, M.D., Atreya, S.K., Gautier, D., Ingersoll, A.P., Lunine, J.I., Orton, G.S., Owen, T.C., Steffes, P.G., Adumitroaie, V., Bellotti, A., Jewell, L.A., Li, C., Li, L., Misra, S., Oyafuso, F.A., Santos-Costa, D., Sarkissian, E., Williamson, R., Arballo, J.K., Kitiyakara, A., Ulloa-Severino, A., Chen, J.C., Maiwald, F.W., Sahakian, A.S., Pingree, P.J., Lee, K.A., Mazer, A.S., Redick, R., Hodges, R.E., Hughes, R.C., Bedrosian, G., Dawson, D.E., Hatch, W.A., Russell, D.S., Chamberlain, N.F., Zawadski, M.S., Khayatian, B., Franklin, B.R., Conley, H.A., Kempenaar, J.G., Loo, M.S., Sunada, E.T., Vorperion, V., Wang, C.C., 2017. MWR: Microwave Radiometer for the Juno Mission to Jupiter. Space Science Reviews 213, 139--185. doi:10.1007/s11214-017-0349-5.
- Joiner and Steffes (1991) Joiner, J., Steffes, P.G., 1991. Modeling of Jupiter’s millimeter wave emission utilizing laboratory measurements of ammonia (NH3) opacity. Journal of Geophysical Research 96, 17,463--17,470. doi:10.1029/91JE01740.
- Joiner et al. (1989) Joiner, J., Steffes, P.G., Jenkins, J.M., 1989. Laboratory measurements of the 7.5-9.38-mm absorption of gaseous ammonia (NH3) under simulated jovian conditions. Icarus 81, 386--395. doi:10.1016/0019-1035(89)90059-6.
- Karman et al. (2019) Karman, T., Gordon, I.E., van der Avoird, A., Baranov, Y.I., Boulet, C., Drouin, B.J., Groenenboom, G.C., Gustafsson, M., Hartmann, J.M., Kurucz, R.L., Rothman, L.S., Sun, K., Sung, K., Thalman, R., Tran, H., Wishnow, E.H., Wordsworth, R., Vigasin, A.A., Volkamer, R., van der Zande, W.J., 2019. Update of the HITRAN collision-induced absorption section. Icarus 328, 160--175. doi:10.1016/j.icarus.2019.02.034.
- Kochanov et al. (2019) Kochanov, R.V., Gordon, I.E., Rothman, L.S., Shine, K.P., Sharpe, S.W., Johnson, T.J., Wallington, T.J., Harrison, J.J., Bernath, P.F., Birk, M., Wagner, G., Le Bris, K., Bravo, I., Hill, C., 2019. Infrared absorption cross-sections in HITRAN2016 and beyond: Expansion for climate, environment, and atmospheric applications. Journal of Quantitative Spectroscopy and Radiative Transfer 230, 172--221. doi:10.1016/j.jqsrt.2019.04.001.
- Kochanov et al. (2016) Kochanov, R.V., Gordon, I.E., Rothman, L.S., Wcisło, P., Hill, C., Wilzewski, J.S., 2016. HITRAN Application Programming Interface (HAPI): A comprehensive approach to working with spectroscopic data. Journal of Quantitative Spectroscopy and Radiative Transfer 177, 15--30. doi:10.1016/j.jqsrt.2016.03.005.
- Krasnopolsky et al. (2013) Krasnopolsky, V., Belyaev, D., Gordon, I., Li, G., Rothman, L., 2013. Observations of D/H ratios in H2O, HCl, and HF on Venus and new DCl and DF line strengths. Icarus 224, 57--65. URL: http://linkinghub.elsevier.com/retrieve/pii/S0019103513000705, doi:10.1016/j.icarus.2013.02.010.
- Krishnaji (1963) Krishnaji, Chandra, S., 1963. Molecular Interaction and Linewidth of the Asymmetric Molecule SO2. II. SO2-CO2 Collisions. The Journal of Chemical Physics 38, 1019--1021. doi:10.1063/1.1733747.
- Larson et al. (1977) Larson, H.P., Treffers, R.R., Fink, U., 1977. Phosphine in Jupiter’s atmosphere: the evidence from high-altitude observations at 5 micrometers. Astrophysical Journal 211, 972--979. doi:10.1086/155009.
- Lellouch et al. (2006) Lellouch, E., Bézard, B., Strobel, D.F., Bjoraker, G.L., Flasar, F.M., Romani, P.N., 2006. On the hcn and co2 abundance and distribution in jupiter’s stratosphere. Icarus 184, 478--497. doi:10.1016/j.icarus.2006.05.018.
- Levin et al. (2019) Levin, S., Adumitroaie, V., Allison, M.D., Arballo, J.K., Atreya, S.K., Becker, H.N., Bolton, S.J., Brown, S.T., Connerney, J.E.P., Guillot, T., Gulkis, S., Hodges, A.L., Ingersoll, A.P., Janssen, M.A., Li, C., Li, L., Lunine, J.I., Misra, S., Orton, G.S., Oyafuso, F.A., Santos-Costa, D., Sarkissian, E., Steffes, P.G., Waite, J. H., J., Zhang, Z., 2019. Jupiter As Seen By The Juno Microwave Radiometer: A Progress Report, in: AGU Fall Meeting Abstracts, pp. P44A--03.
- Li et al. (2017) Li, C., Ingersoll, A., Janssen, M., Levin, S., Bolton, S., Adumitroaie, V., Allison, M., Arballo, J., Bellotti, A., Brown, S., Ewald, S., Jewell, L., Misra, S., Orton, G., Oyafuso, F., Steffes, P., Williamson, R., 2017. The distribution of ammonia on Jupiter from a preliminary inversion of Juno microwave radiometer data. Geophysical Research Letters 44, 5317--5325. doi:10.1002/2017GL073159.
- Lincowski et al. (2021) Lincowski, A.P., Meadows, V.S., Crisp, D., Akins, A.B., Schwieterman, E.W., Arney, G.N., Wong, M.L., Steffes, P.G., Parenteau, M.N., Domagal-Goldman, S., 2021. Claimed Detection of PH3 in the Clouds of Venus Is Consistent with Mesospheric SO2. The Astrophysical Journal 908, L44. doi:10.3847/2041-8213/abde47.
- Lorentz (1915) Lorentz, H.A., 1915. The width of spectral lines. Koninklijke Nederlandse Akademie van Wetenschappen Proceedings Series B Physical Sciences 18, 134--150.
- Marcq et al. (2021) Marcq, E., Amine, I., Duquesnoy, M., Bézard, B., 2021. Evidence for SO2 latitudinal variations below the clouds of Venus. Astronomy & Astrophysics 648, L8. doi:10.1051/0004-6361/202140837.
- Mills et al. (2007) Mills, F.P., Esposito, L.W., Yung, Y.L., 2007. Atmospheric composition, chemistry, and clouds. Washington DC American Geophysical Union Geophysical Monograph Series 176, 73--100. doi:10.1029/176GM06.
- Mogul et al. (2021) Mogul, R., Limaye, S.S., Way, M.J., Cordova, J.A., 2021. Venus’ Mass Spectra Show Signs of Disequilibria in the Middle Clouds. Geophysical Research Letters 48, e91327. doi:10.1029/2020GL091327.
- Mohammed and Steffes (2003) Mohammed, P.N., Steffes, P.G., 2003. Laboratory measurements of the Ka-band (7.5 mm to 9.2 mm) opacity of phosphine (PH3) and ammonia (NH3) under simulated conditions for the Cassini-Saturn encounter. Icarus 166, 425--435. doi:10.1016/j.icarus.2003.09.003.
- Mohammed and Steffes (2004) Mohammed, P.N., Steffes, P.G., 2004. Laboratory measurements of the W band (3.2 mm) properties of phosphine (PH3) and ammonia (NH3) under simulated conditions for the outer planets. Journal of Geophysical Research (Planets) 109, E07S13. doi:10.1029/2003JE002201.
- Müller et al. (2005) Müller, H.S.P., Schlöder, F., Stutzki, J., , Winnewisser, G., 2005. The Cologne Database for Molecular Spectroscopy, CDMS: a useful tool for astronomers and spectroscopists. Journal of Molecular Structure 742, 215--227. doi:10.1016/j.molstruc.2005.01.027.
- Naumenko and Horneman (2019) Naumenko, O.V., Horneman, V.M., 2019. 32S16O2 line list via private communication.
- Nemtchinov (2004) Nemtchinov, V., 2004. Measurements of line intensities and half-widths in the 10-m bands of 14NH3. Journal of Quantitative Spectroscopy and Radiative Transfer 83, 243--265. doi:10.1016/S0022-4073(02)00354-0.
- Orton (2018) Orton, G., 2018. Latest Results on Jupiter’s Atmosphere and Radiation Belts from the Juno Microwave Radiometer, in: European Planetary Science Congress, pp. EPSC2018--204.
- Owen and Encrenaz (2003) Owen, T., Encrenaz, T., 2003. Element Abundances and Isotope Ratios in the Giant Planets and Titan. Space Science Reviews 106, 121--138. doi:10.1023/A:1024633603624.
- Pearson (2000) Pearson, J., 2000. 14NH3 rotational, , and -ground state prediction via private communication.
- Piccioni et al. (2008) Piccioni, G., Drossart, P., Zasova, L., Migliorini, A., Gérard, J.C., Mills, F.P., Shakun, A., García Muñoz, A., Ignatiev, N., Grassi, D., Cottini, V., Taylor, F.W., Erard, S., Virtis-Venus Express Technical Team, Ammannito, E., Barbis, A., Berlin, R., Bettanini, C., Boccaccini, A., Bonnello, G., Bouye, M., Capaccioni, F., Cardesin Moinelo, A., Carraro, F., Cherubini, G., Cosi, M., Dami, M., De Nino, M., Del Vento, D., Di Giampietro, M., Donati, A., Dupuis, O., Espinasse, S., Fabbri, A., Fave, A., Ficai Veltroni, I., Filacchione, G., Garceran, K., Ghomchi, Y., Giustini, M., Gondet, B., Hello, Y., Henry, F., Tosi, F., 2008. First detection of hydroxyl in the atmosphere of Venus. Astronomy and Astrophysics 483, L29--L33. doi:10.1051/0004-6361:200809761.
- Rayer (2020) Rayer, P.J., 2020. Pressure Broadening of Spectral Lines: The Theory of Line Shape in Atmospheric Physics. Cambridge University Press. doi:10.1017/9781108768825.
- Ridgway et al. (1976) Ridgway, S.T., Wallace, L., Smith, G.R., 1976. The 800 - 1200 inverse centimeter absorption spectrum of Jupiter. Astrophysical Journal 207, 1002--1006. doi:10.1086/154570.
- Sandor and Todd Clancy (2018) Sandor, B.J., Todd Clancy, R., 2018. First measurements of ClO in the Venus atmosphere - Altitude dependence and temporal variation. Icarus 313, 15--24. doi:10.1016/j.icarus.2018.04.022.
- Sandor et al. (2010) Sandor, B.J., Todd Clancy, R., Moriarty-Schieven, G., Mills, F.P., 2010. Sulfur chemistry in the Venus mesosphere from SO 2 and SO microwave spectra. Icarus 208, 49--60. doi:10.1016/j.icarus.2010.02.013.
- Snellen et al. (2020) Snellen, I.A.G., Guzman-Ramirez, L., Hogerheijde, M.R., Hygate, A.P.S., van der Tak, F.F.S., 2020. Re-analysis of the 267 GHz ALMA observations of Venus. No statistically significant detection of phosphine. Astronomy & Astrophysics 644, L2. doi:10.1051/0004-6361/202039717.
- Sousa-Silva et al. (2020) Sousa-Silva, C., Seager, S., Ranjan, S., Petkowski, J.J., Zhan, Z., Hu, R., Bains, W., 2020. Phosphine as a Biosignature Gas in Exoplanet Atmospheres. Astrobiology 20, 235--268. doi:10.1089/ast.2018.1954.
- Sousa-Silva et al. (2016) Sousa-Silva, C., Tennyson, J., Yurchenko, S.N., 2016. Communication: Tunnelling splitting in the phosphine molecule. The Journal of Chemical Physics 145, 091102. doi:10.1063/1.4962259.
- Steffes et al. (2017) Steffes, P.G., Hanley, T.R., Karpowicz, B.M., Devaraj, K., Noorizadeh, S., Duong, D., Chinsomboon, G., Bellotti, A., Janssen, M.A., Bolton, S.J., 2017. High-Precision Laboratory Measurements Supporting Retrieval of Water Vapor, Gaseous Ammonia, and Aqueous Ammonia Clouds with the Juno Microwave Radiometer (MWR). Space Science Reviews 213, 187--204. doi:10.1007/s11214-016-0265-0.
- Steffes and Jenkins (1987) Steffes, P.G., Jenkins, J.M., 1987. Laboratory measurements of the microwave opacity of gaseous Ammonia (NH3) under simulated conditions for the Jovian atmosphere. Icarus 72, 35--47. doi:10.1016/0019-1035(87)90116-3.
- Steffes et al. (2015) Steffes, P.G., Shahan, P., Christopher Barisich, G., Bellotti, A., 2015. Laboratory measurements of the 3.7-20 cm wavelength opacity of sulfur dioxide and carbon dioxide under simulated conditions for the deep atmosphere of Venus. Icarus 245, 153--161. doi:10.1016/j.icarus.2014.09.012.
- Stolarczyk et al. (2020) Stolarczyk, N., Thibault, F., Cybulski, H., Jóźwiak, H., Kowzan, G., Vispoel, B., Gordon, I.E., Rothman, L.S., Gamache, R.R., Wcisło, P., 2020. Evaluation of different parameterizations of temperature dependences of the line-shape parameters based on ab initio calculations: Case study for the HITRAN database. Journal of Quantitative Spectroscopy and Radiative Transfer 240, 106676. doi:10.1016/j.jqsrt.2019.106676.
- Tan et al. (2019) Tan, Y., Kochanov, R.V., Rothman, L.S., Gordon, I.E., 2019. Introduction of Water-Vapor Broadening Parameters and Their Temperature-Dependent Exponents Into the HITRAN Database: Part I CO2, N2O, CO, CH4, O2, NH3, and H2S. Journal of Geophysical Research (Atmospheres) 124, 11,580--11,594. doi:10.1029/2019JD030929.
- Tan et al. (2022) Tan, Y., Skinner, F.M., Samuels, S., Hargreaves, R.J., Hashemi, R., Gordon, I.E., 2022. H2, He, and CO2 pressure-induced parameters for the HITRAN database. Part II: Line lists of CO2, N2O, CO, SO2, OH, OCS, H2CO, HCN, PH3, H2S and GeH4. Astrophysical Journal Supplement Series Submitted. Submitted.
- Van Vleck and Weisskopf (1945) Van Vleck, J.H., Weisskopf, V.F., 1945. On the Shape of Collision-Broadened Lines. Reviews of Modern Physics 17, 227--236. doi:10.1103/RevModPhys.17.227.
- Vandaele (2020) Vandaele, A.C., 2020. Composition and Chemistry of the Neutral Atmosphere of Venus. Oxford Research Encyclopedia of Planetary Science. Edited by Peter Read et al. ISBN: 978-0-190-64792-6. Oxford University Press , 4doi:10.1093/acrefore/9780190647926.013.4.
- Vandaele et al. (2017) Vandaele, A.C., Korablev, O., Belyaev, D., Chamberlain, S., Evdokimova, D., Encrenaz, T., Esposito, L., Jessup, K.L., Lefèvre, F., Limaye, S., Mahieux, A., Marcq, E., Mills, F.P., Montmessin, F., Parkinson, C.D., Robert, S., Roman, T., Sandor, B., Stolzenbach, A., Wilson, C., Wilquet, V., 2017. Sulfur dioxide in the Venus atmosphere: I. Vertical distribution and variability. Icarus 295, 16--33. doi:10.1016/j.icarus.2017.05.003.
- Villanueva et al. (2021) Villanueva, G.L., Cordiner, M., Irwin, P.G.J., de Pater, I., Butler, B., Gurwell, M., Milam, S.N., Nixon, C.A., Luszcz-Cook, S.H., Wilson, C.F., Kofman, V., Liuzzi, G., Faggi, S., Fauchez, T.J., Lippi, M., Cosentino, R., Thelen, A.E., Moullet, A., Hartogh, P., Molter, E.M., Charnley, S., Arney, G.N., Mandell, A.M., Biver, N., Vandaele, A.C., de Kleer, K.R., Kopparapu, R., 2021. No evidence of phosphine in the atmosphere of Venus from independent analyses. Nature Astronomy 5, 631--635. doi:10.1038/s41550-021-01422-z.
- Villanueva et al. (2018) Villanueva, G.L., Smith, M.D., Protopapa, S., Faggi, S., Mandell, A.M., 2018. Planetary Spectrum Generator: An accurate online radiative transfer suite for atmospheres, comets, small bodies and exoplanets. Journal of Quantitative Spectroscopy and Radiative Transfer 217, 86--104. doi:10.1016/j.jqsrt.2018.05.023, arXiv:1803.02008.
- Weidenschilling and Lewis (1973) Weidenschilling, S.J., Lewis, J.S., 1973. Atmospheric and cloud structures of the Jovian planets. Icarus 20, 465--476. doi:10.1016/0019-1035(73)90019-5.
- Wilzewski et al. (2016) Wilzewski, J.S., Gordon, I.E., Kochanov, R.V., Hill, C., Rothman, L.S., 2016. H2, He, and CO2 line-broadening coefficients, pressure shifts and temperature-dependence exponents for the HITRAN database. Part 1: SO2, NH3, HF, HCl, OCS and C2H2. Journal of Quantitative Spectroscopy and Radiative Transfer 168, 193--206. doi:10.1016/j.jqsrt.2015.09.003.
- Yurchenko (2015) Yurchenko, S.N., 2015. A theoretical room-temperature line list for 15NH3. Journal of Quantitative Spectroscopy and Radiative Transfer 152, 28--36. doi:10.1016/j.jqsrt.2014.10.023.
- Zasova (2021) Zasova, L., 2021. Venera-D: a potential Roscosmos-NASA mission to explore Venus’ atmosphere, surface, interior and plasma environment, in: 43rd COSPAR Scientific Assembly. Held 28 January - 4 February, p. 251.