Exploring dust growth in the episodic WCd system WR140
Abstract
The wind collision region (WCR) in a colliding wind binary (CWB) is a particularly violent place, as such, it is surprising that it is also a region where significant quantities of interstellar dust can form. In extreme cases, approximately 30% of the total mass loss rate of a system can be converted into dust. These regions are poorly understood, as observation and simulation of these systems are difficult. In our previous paper we simulated dust growth in CWB systems using an advected scalar model and found our model to be suitable for qualitative study. For this paper we simulated the periodic dust forming CWB (WCd) system WR140 with our dust model, to determine how dust growth changes over the systems periastron passage. We found that dust production increases significantly at periastron passage, which is consistent with IR emission of the surrounding dusty shell. We also find that the dust production rate of the system decreases rapidly as the stars recede from each other, though the rate of decrease is significantly lower than the rate of increase during periastron passage. This was found to be due to strong cooling and its associated thermal instabilities, resulting in cool, high-density pockets of gas in the WCR where dust forms. The WCR also shows a degree of hysteresis, resulting in a radiative post-shock flow even when the stars are separated enough for the region to behave adiabatically.
keywords:
stars: Wolf-Rayet – methods: numerical – binaries: general – ISM: dust1 Introduction
Dust formation in massive star binary systems is a particularly fascinating subject. Considering the immense photon fluxes and strong shocks involved, these systems should not form dust at all, and yet in some systems all evidence points to the contrary. Colliding wind binary (CWB) systems were first hypothesised to explain highly luminous and variable x-ray emission in systems such as V444 Cyg and Vel (Prilutskii & Usov, 1976). These extremely bright emissions were found to be due to stellar wind collision with shock velocities of the order . The variability in x-ray emission can be explained if the phenomena occurs due to the orbit of a binary system, such as the Wind Collision Region (WCR) being occluded by the outflowing stellar winds and being occluded by the stars themselves. The system can also have an eccentric orbit, changing the shock strength as the orbital separation, , varies. Despite this dust-hostile environment, CWB systems containing a Wolf-Rayet carbon phase star (WC) have been observed producing copious quantities of dust (so-called WCd systems; see Williams (1995)). These systems typically convert around of the stellar wind into dust a short time after wind collision; in more prolific systems such as WR104 up to of the Wolf-Rayet (WR) outflow is converted into dust (Lau et al., 2020). This corresponds to dust production rates on the order of , rivalling other profuse dust producing phenomena such as AGB stars.
WCd systems can be sub-categorised further, into persistent, variable and episodic dust forming systems. Persistent systems, such as WR104 (Tuthill et al., 1999), produce dust at a constant rate, and as such produce extreme quantities of dust, as well as well-defined pinwheel patterns if the system is viewed face-on. Episodic systems, meanwhile, only produce dust for a limited period before entering a period of dormancy; this pattern is cyclical, and is predictably periodic. A good example of such an episodic system is WR140 (Williams et al., 1990), the subject of this paper. Variable systems have some characteristics of these two sub-types, having a distinct variability without a period of dust producing dormancy, such as WR98a (Monnier et al., 1999).
Whether a system is persistent, variable or episodic is based on the system’s orbital eccentricity. Highly eccentric systems appear to form episodic systems, with the “active” dust production period occurring immediately after periastron passage, and a relatively short time thereafter. Meanwhile, persistent and variable systems have been observed to have more circular orbits, suggesting that the effect of a change in system separation distance, , has a role in dust formation. The initial mechanism behind dust formation is not well understood. Whilst nascent amorphous carbon dust grain cores can condense within the photosphere of WC7-9 stars, these grain cores would be vaporised by the UV flux of both stars. However, within the WCR these grains appear to flourish. Observations of these systems show that infrared excess in wavelengths associated with amorphous grains is detected almost exclusively within the post-shock WCR (Soulain et al., 2018). Observations also indicate that dust formation occurs rapidly and close to the system, this requires strong radiative cooling for the immediate-post shock temperature to reduce from to (Williams et al., 1987; Williams et al., 1990).
As such, dust formation appears to be encouraged in the WCR through a multitude of factors:
-
•
Strong radiative cooling produces clumps of cool, high density gas where dust can rapidly grow.
-
•
The high density of the post-shock WCR results in a high collision rate between carbon atoms and dust grains.
-
•
The high density also shields nascent dust grains from the bulk of the UV emission from the stars.
-
•
The rapid cooling in the immediate post-shock environment reduces gas-grain sputtering.
The dust formation can also be influenced by orbital separation, velocity shear and momentum ratio imbalance between the winds, producing variability on the timescale of a single orbit, or .
| Persistent | Variable | Episodic | ||||
|---|---|---|---|---|---|---|
| Total | Example | Total | Example | Total | Example | |
| WC4 | 1 | WR19 | 0 | — | 0 | — |
| WC5 | 0 | — | 0 | — | 1 | WR47C |
| WC6 | 1 | WR124-10 | 0 | — | 0 | — |
| WC7 | 3 | WR102-22 | 0 | — | 4 | WR140 |
| WC8 | 6 | WR13 | 1 | WR48a | 3 | WR122-14 |
| WC9 | 45 | WR104 | 6 | WR98a | 1 | WR75-11 |
| Total | 56 | 7 | 9 | |||
WCd systems are comparatively rare. Out of 106 confirmed WR binaries, only 9 are categorised as episodic WCd systems (Table 1). As these systems have a typical distance on the order of , observation of WCds is difficult. Whilst these systems can be observed and the dusty WCR can be resolved, observation of the innermost, immediate post-shock dust forming region is not possible at this distance. As such, numerical simulation is necessary to determine dust formation in WCd systems. A contemporary example of such simulations is Hendrix et al. (2016), though the evolution of dust grains through cooling, growth and sputtering was not performed. In this paper we present a numerical simulation of the archetypical episodic WCd system WR140 with a co-moving dust model simulating grain growth and sputtering through gas-grain collisions. This simulation covers a temporal slice of the orbit of WR140 from phase to , or the period immediately prior to and after periastron passage. We will discuss our methodology in Section 2, with a particular emphasis on our dust model in Subsection 2.2. Afterwards we will discuss the simulation and WR140 system parameters, as well as our data collection techniques in Section 3. Finally, we will discuss our results and conclude in Sections 4 and 5.
2 Methodology
The periodic dust forming system WR140 was simulated using a fork of the Athena++ hydrodynamical code (Stone et al., 2020). A series of modifications were implemented to simulate binary system orbits, stellar wind outflows and dust evolution. These simulations were conducted in 3D in a Cartesian co-ordinate system. The code solves a Riemann problem at each cell interface to determine the time-averaged values at the zone interfaces, and then solves the equations of hydrodynamics:
| (1a) | ||||
| (1b) | ||||
| (1c) | ||||
where is the total specific energy (), is the gas density, is the internal energy density, is the gas pressure and is the gas velocity. In order to simulate radiative losses, the parameter is included, which is the energy loss rate per unit volume from the fluid due to gas and dust cooling.
Spatial reconstruction using a piecewise linear method was performed, while the simulation was run with one of two numerical integrators, depending on the system stability. The integrators used were a 3rd order accurate Runge-Kutta integrator (rk3), as well as a 4th order accurate, 5-stage, 3 storage register strong stability preserving Runge-Kutta integrator (ssprk5_4; Ruuth & Spiteri (2005)). The ssprk5_4 integrator was found to be approximately 60% slower, but significantly more stable.
Several passive scalars are utilised to model wind mixing and dust evolution, which are transported by the fluid. For a given scalar, , the scalar is advected through the following equation:
| (2) |
where is the scalar quantity. The scalar quantities tracked in this model are:
As there is no diffusion coefficient in Eq. 2, these quantities can be interpreted as explicitly co-moving with the fluid.
Stellar winds are simulated by modifying the density, , momentum, , and energy, in a small region around both stars. Winds flow from this “remap” region at the stars wind terminal velocity, . Remap zone parameters are calculated with the formulae
| (3a) | ||||
| (3b) | ||||
| (3c) | ||||
where is the cell pressure (), is the wind temperature, is the mean molecular mass, is the mass of a hydrogen atom, is the wind velocity as it flows radially from the center of the “remap zone” and is the distance from the current cell to the centre of the remap zone. This method produces radially out-flowing winds from the star with an expected density and velocity.
Line driving and wind acceleration effects are not simulated; instead, winds are instantaneously accelerated to their terminal velocity. Gravitational forces are not calculated as the winds are assumed to be travelling in excess of the system escape velocity. In the case of systems with a very small orbital separation this could result in collision with a higher than anticipated wind velocity. Therefore, calculating the line driving force would be a useful addition in the future when simulating close-orbit persistent dust forming systems such as WR104.
Athena++ utilises Message Passing Interface (MPI) parallelism. The numerical problem is broken into blocks, which are distributed between processing nodes on a High Performance Compute (HPC) cluster. The block size is variable, but for this simulation a block size of cells in was found to be optimal. Static mesh refinement is used to increase the effective resolution of the simulation. A region around the orbital path of the stars in the simulation is refined to a higher resolution, with gradual de-refinement as a function of distance from this refinement region. This refinement is covered in more detail in Section 3.2.
2.1 Radiative cooling
Cooling is simulated via the removal of thermal energy from a cell at each time-step. A cooling rate for radiative emission from the stellar winds, , is calculated and integrated using a sub-stepping Euler method. The number of sub-steps is determined by the estimated cooling timescale of the cell. Cooling is calculated via individual lookup tables from each wind. These lookup tables contain the normalised emissivity, at a logarithmically spaced series of temperatures from to . The cooling rate is determined for a cell by calculating the cell temperature and estimating using linear interpolation between the nearest emissivity values in the lookup table. As the two winds have significantly different abundances and can be thoroughly mixed in the WCR, we calculate an emissivity value for gas in a particular cell with the equation
| (4) |
where is the wind “colour”, or mixing fraction, where 1 is a pure WR wind and 0 is a pure OB wind. , is then calculated through the equation
| (5) |
where is the gas density and is the mass of hydrogen. The lookup table was generated by mixing a series of cooling curves from a MEKAL calculation of elemental gasses (Mewe et al., 1995). These curves were combined based on the elemental abundances in the WC (Sander et al., 2012) and OB (Anders & Grevesse, 1989) winds. To save calculation time, temperatures between are set to as they are assumed to be either rapidly cooling or a part of the stellar wind outside of the WCR. A minimum temperature of is defined by the simulation, is it is assumed that a radiating post-shock wind will tend to the temperature of the pre-shock wind, .
2.2 Dust model
In order to simulate dust evolution in WR140 a passive scalar dust model that simulates dust growth and destruction is included in the simulation. The dust model operates on passive scalars, and as such simulates dust that is co-moving with the stellar wind. Two scalars are used to describe dust in a cell, , the grain radius in microns, and , the grain dust-to-gas mass ratio
| (6) |
where is the dust density in the cell. A number of assumptions are made in this dust model; for instance, the dust grains in the model are spherical, with a uniform density. Dust grains are assumed to have a single size for each grid cell. The number density of grains varies in the simulation volume, however the ratio of the grain number density is fixed and constant throughout the simulation. As such, this model does not simulate grain fracturing. Additional mechanisms for dust formation and destruction could also be implemented such as grain-grain agglomeration and photoevaporation. A multi-fluid model with drag force coupling could also be implemented, however this is beyond the scope of this paper.
Dust grows through grain accretion using formulae described by Spitzer (2008) where dust grains grow via low-velocity collisions with surrounding carbon atoms, causing them to accrete onto the surface of the dust grain. Carbon is removed from the gas, reducing the cell gas density, while the corresponding dust density increases. This ensures that mass is preserved in the simulation. Assuming a single average grain size the rate of change in the grain radius in a cell due to accretion, , is given by the equation:
| (7) |
where is the grain sticking factor, is the carbon density (), is the Maxwell-Boltzmann RMS velocity for carbon (), is the Boltzmann constant and is the grain bulk density. The rate of change in the mass of a single grain due to accretion, , is calculated with the formula:
| (8) |
A bulk density approximating that of amorphous carbon grains () is used for this simulation.
Dust destruction through gas-grain sputtering is calculated using the Draine & Salpeter (1979) prescription. Within a flow of gas number density a dust grain of radius has a grain lifespan, of:
| (9) |
This value is based on an average lifetime of carbon grains in an interstellar shock with a temperature of (Tielens et al., 1994; Dwek et al., 1996). From this we find a rate of change in the grain radius due to sputtering of
| (10) |
The rate of change in the mass of a single dust grain due to sputtering, , can then be calculated with a similar formula to the rate of change in grain mass due to accretion:
| (11) |
The change in dust density is then calculated through the equation
| (12) |
where is the dust grain number density.
Cooling via emission of photons from dust grains is also included in this model. The rate of cooling is calculated using the uncharged grain case of the prescription described in Dwek & Werner (1981). Grains are collisionally excited by collisions with ions and electrons, causing them to radiate. Similarly to the gas/plasma emission model used, the emitted photons are not re-adsorbed by the WCR medium, causing energy to be removed from the simulation. This therefore makes the assumption that the WCR is optically thin to far-infrared photons, which is observationally correct (Monnier et al., 2007; Soulain et al., 2018; Callingham et al., 2019). The grain heating rate, , in for a dust grain is calculated with the formula:
| (13) |
where is the gas number density, is the mass of the incident particle in AMU, is the grain radius in microns, is the temperature of the ambient gas, and is the effective grain heating factor. Individual heating rates for hydrogen, helium, carbon, nitrogen and oxygen are calculated, in order to calculate the total ion collisional heating, :
| (14) |
The effective grain heating factor for each element is calculated via the equation:
| (15) |
where is the critical energy required for the particle to penetrate the dust grain (Table 2). The rate of heating due to electron-grain collisions, , is similar to Eq. 13. The grain heating factor for electron collisions, , is calculated via an approximation rather than the exact calculation in the case of baryonic matter. is estimated through the following conditions:
| (16) | ||||||
| otherwise, |
where . This approximation differs from the integration method by less than 8% while being 3 orders of magnitude faster. Excitation due to grain-grain collisions were not modelled, due to the limitations of the passive scalar model. In order to calculate the change in energy due to dust cooling, we find the radiative emissivity for dust, , to be
| (17) |
and added to the gas/plasma energy loss rate, such that the total energy loss rate is:
| (18) |
| Particle | |
|---|---|
| H | |
| He | |
| C | |
| N | |
| O |
3 System parameters
We have previously simulated WCd systems in the form of a parameter space exploration, in order to discern which wind and orbital parameters are influential on the dust growth rates (Eatson et al., 2022). It was determined that the primary factors of dust growth in a WCd system were the mass loss rates, , and wind terminal velocities, , for each star, as well as the orbital separation, . In particular, it was found that imbalances between the wind velocity produced Kelvin-Helmholtz (KH) instabilities due to a shear in the winds. Slower winds were found to be more radiative in the post-shock WCR flow, cooling to temperatures suitable for dust formation. This was found to influence the dust growth rate by as much as six orders of magnitude through a factor of four variation of the WR wind terminal velocity. We also found that increasing significantly reduced the dust production rate, due to less radiative cooling and less shock compression as the out-flowing winds became less dense with distance. In the case of WCd systems with eccentric orbits, the separation distance can vary significantly. In the case of WR140, varies by a factor of 19 from apastron to periastron. This is hypothesised to be the primary cause of dust production variability within episodic systems. The pre-shock velocity can also vary somewhat due to radiative inhibition and orbital motion.
In order to understand the structure and dynamics of the CWB system we must define some important parameters, such as the wind momentum ratio, , which is defined as:
| (19) |
As decreases we find that the wind becomes more imbalanced. In the case of WR+OB CWB systems we find that the WR stars wind typically dominates the WCR. Assuming that there is no radiative inhibition (Stevens & Pollock, 1994) or radiative braking (Gayley et al., 1997), we can approximate the WCR to a conical region with an opening angle about the contact discontinuity:
| (20) |
to a relatively high degree of accuracy (Eichler & Usov, 1993). Another important value for determining the nature of the WCR is the cooling parameter, , which is the ratio of the time taken for the shocked wind to completely cool to the time taken for the wind to escape the shocked region:
| (21) |
where is the wind terminal velocity in units of , is the separation distance in units of and is the wind mass loss rate in units of (Stevens et al., 1992). As decreases, the structure of the WCR becomes more influenced by cooling. If , the WCR is completely dominated by radiative cooling, while if , the WCR behaves adiabatically. If the WCR is highly radiative the total compression can be significantly greater than the adiabatic limit of 4 for a gas, which facilitates dust production. Finally, we define a maximum dust production rate of the system, , assuming a 100% conversion rate of WR wind in the WCR into dust. The fraction of the WR wind that is passed through the WCR is given by the equation:
| (22) |
where is the opening angle of the WR shock front (, see Pittard & Dawson (2018)). is then calculated with the formula
| (23) |
where is the carbon mass fraction in the WR star.
3.1 WR140 parameters
WR140 was simulated in this paper as it is an archetypical example of an episodic WCd system. The system has an extremely eccentric orbit, which significantly affects the cooling parameter as the orbit progresses, and is also observed in detail. Both stellar winds are expected to be accelerated to close to their terminal wind velocities before they collide (Lamers & Cassinelli, 1999).
Recent improved estimations of the orbital parameters of WR140 by Thomas et al. (2021) were used to calculate the orbit for these simulations, while the mass loss rate, and the wind terminal velocity were taken from Williams et al. (1990) (see Table 3). A typical wind composition for WC stars was assumed for the Wolf-Rayet star, while a solar abundance was assumed for the OB star (Table 4).
| Parameter | Value | Citation |
|---|---|---|
| Thomas et al. (2021) | ||
| Thomas et al. (2021) | ||
| Thomas et al. (2021) | ||
| 0.8993 | Thomas et al. (2021) | |
| Williams et al. (1990) | ||
| Williams et al. (1990) | ||
| Williams et al. (1990) | ||
| Williams et al. (1990) | ||
| 0.031 | Calculated | |
| 2.12 | Calculated |
3.2 Simulation parameters
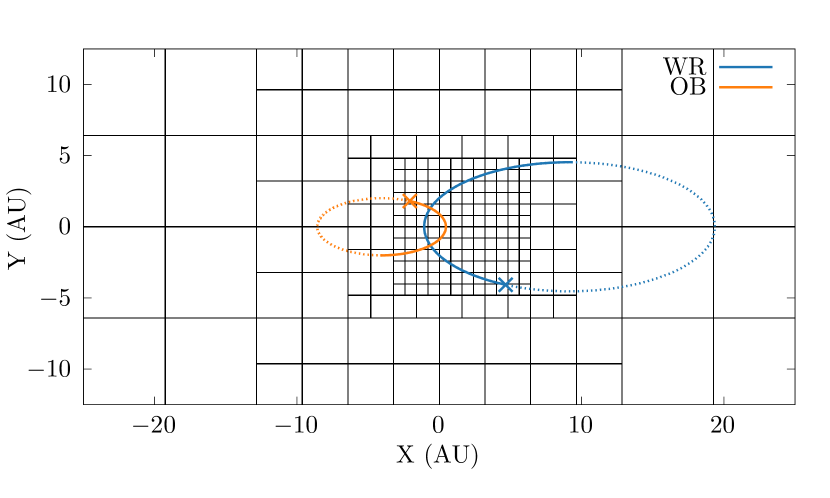
A domain of was used for this simulation, with a coarse (0th level) grid resolution of cells in the XYZ domain. The simulation has 4 refinement levels, corresponding to an effective resolution of cells and a cell size of . At periastron passage this results in cells between the stars, which was found to be enough to adequately resolve the WCR. This simulation has an XYZ aspect ratio of 8:8:1 in order to reduce processing time, as the bulk of dust formation was expected to occur a short distance from the WCR. A section of the systems orbit, corresponding to an orbital phase of was simulated. This represents year section of the systems orbit, and is the orbital period where much of the dust forms - prior to and shortly after periastron passage (Crowther, 2003). Fig. 1 shows the orbit overlaid onto the statically refined numerical grid. The area of maximum refinement is around the orbital paths of the stars from , in order to ensure that the stars and the apex of the WCR are maximally refined. Prior to periastron passage the rk3 integrator was used for its speed, but increasing numerical instability as the stars grew closer resulted in this proving untenable, and it was switched to ssprk5_4 for the remainder of the simulation.
During periastron passage the average time-step was found to reduce by an order of magnitude, resulting in a corresponding increase to simulation time. At the most numerically complex portion of the simulation, a Courant number of had to be used instead of the initial value of , in order to preserve numerical stability.
3.3 Data collection
Simulation data was exported as HDF5 files at regular time intervals. 3D meshes were collected every increment of , while 2D slices in the XY plane were collected every increment of . These HDF5 files contain the primitive variables of the simulation: gas density, , gas pressure, , and wind velocity components, , and . The scalars governing the dust properties were also stored for each cell, in particular the dust-to-gas mass ratio, . The volume-weighted totals of all parameters of interest were also collected, such as the average values for the dust production rate within the WCR, .
4 Results
| Parameter | Mean | Maximum |
|---|---|---|
| () | ||
| () | ||
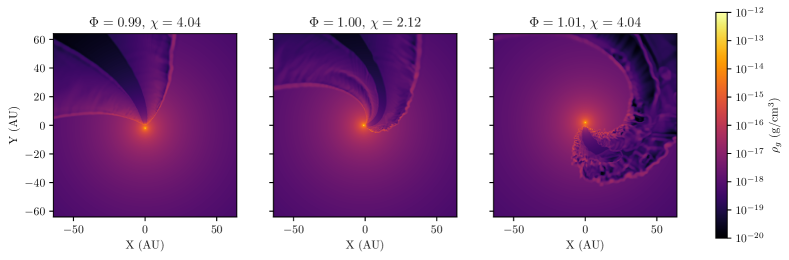
We observe that as the system approaches periastron passage, the WCR temperature decreases and the WCR on the whole becomes radiatively dominated. Instability appears on the leading shock prior to and during periastron passage. Similarly to what was observed in our previous paper, the leading shock typically has more instability, as it sweeps through the WR stellar wind. After the periastron passage, both the leading and trailing shock display instabilities. We observe that these instabilities persist for some time after periastron passage, even when the value of suggests that the wind interaction region should be behaving adiabatically. This is curious, and is further discussed in more detail in Section 4.1.
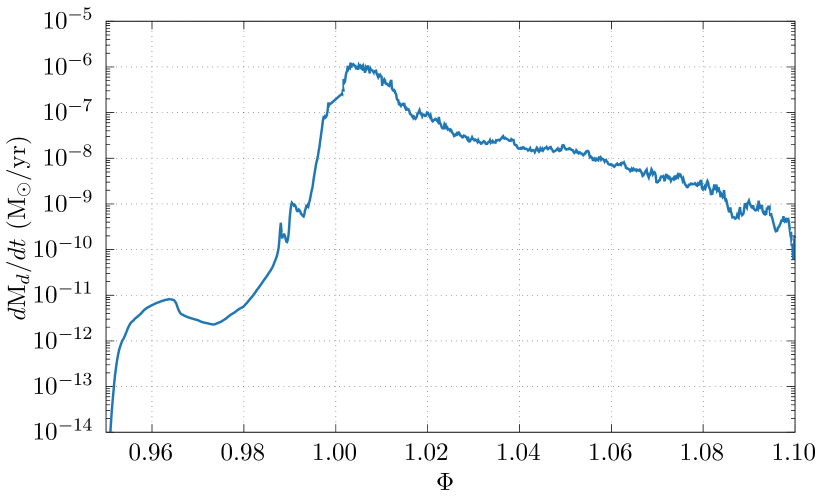
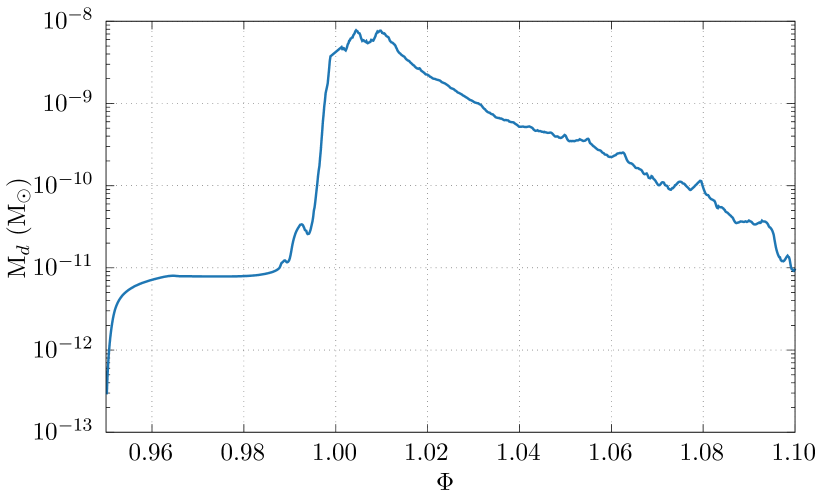
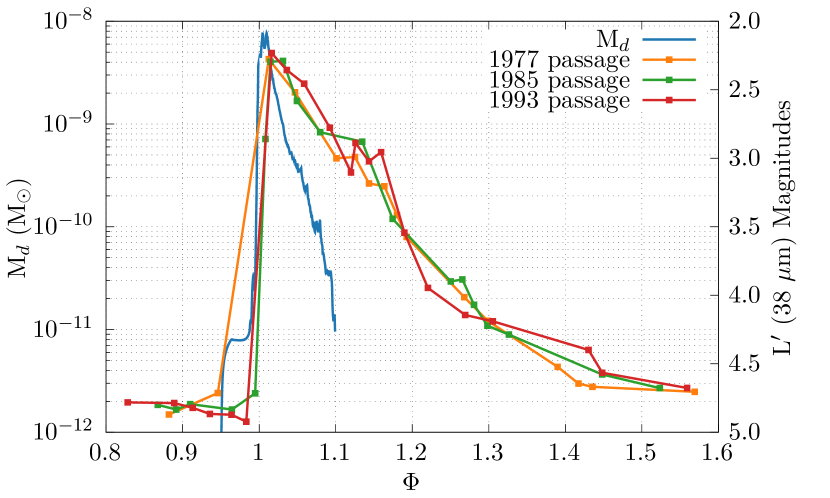
Dust growth was found to be consistent with previous uses of this particular dust model, and well below the theoretical maximum dust formation rate, . After an initial adjustment phase lasting until , the dust production rate rapidly increased as the stars approached periastron passage, peaking at (Fig. 2). This maximum dust production rate of is sensible, but incredibly prodigious. We find peak conversion efficiency of gas into dust of in the WCR compared to the theoretical maximum dust production rate described in Eq. 23, as well as a total conversion efficiency of throughout the entire system (assuming a total mass loss rate of ). The majority of dust () is produced within the WCR, with only a very small amount being produced outside the WCR. Most, if not all of this dust is produced near to the apex of the WCR shock, with dust growth being less prevalent further away from this apex. The dust produced outside of the WCR is likely an artefact of the initial injection of dust into the simulation. After reaching this maximum value, the dust production rate steadily decreases as the stars recede from each other. Assuming this decrease in dust production rate is steady, dust production reaches a pre-periastron level of by , giving us an active dust production period of . This is consistent with photometry of WR140 (Crowther, 2003) – the photometry magnitude sharply increases over the first year – and suggests our model can qualitatively assess dust production rates of episodic WCd systems. This is reflected in the overall dust mass of the simulation (Fig. 3), as well as in infrared observations of WR140, where the infrared emission due to dust rapidly reaches a maximum value after periastron passage, and slowly relaxes to a minimum value. In the case of Fig. 3 we observe a double peak structure between and . At the peak rate of dust formation over this period, we would observe a dust mass in the simulation approaching if dust destruction were not included in the simulation. As such, we can infer that the peak structure is due to a pronounced increase in the dust destruction rate as the post-shock density and temperature are at their highest during the systems periastron passage.
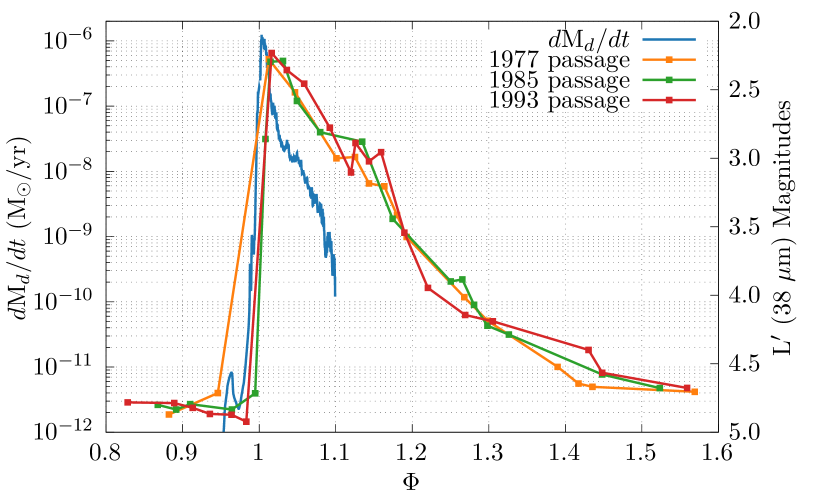
Fig. 4 compares the dust production rate in the simulation and available photometry of WR140, we observe that the dust production rate of the simulation drops in a similar manner to the drop in dust emission in the system after periastron passage. Whilst the rate of decay of dust production rate is much faster than the rate of decay of luminance, this is not a direct comparison – dust is still capable of radiating after leaving the region of the WCR where dust growth occurs most intensely. Fig. 5 shows a similar result, though the dust mass reduces significantly faster as the dust rapidly traverses through the simulation and off and out of the numerical domain. This asymmetry in the time-dependent change in infrared luminosity implies the existence of several factors for suppression and encouragement of dust formation than just the change in orbital separation distance. These results are also in agreement with more contemporary research by Pollock et al. (2021) which notes a similar sharp increase in K-band flux and x-ray column density a short time after periastron passage. This increase in flux and column density corresponds to the rapid production of dust grains, which subsequently cool as they recede from the shock region. Furthermore, Pollock et al. (2021) notes that x-ray cooling becomes less influential, and instead transitions to an optical cooling regime shortly after periastron passage, indicating a rapid rate of cooling in the immediate post-shock environment.
The evolution of dust in this system would result in the formation of an expanding cloud of dust every time the system passes periastron, with no contiguous spiral pattern forming, due to the lengthy “dormant” period occurring shortly after periastron passage. This is consistent with observations of WR140, where these disconnected clouds are observed (Williams et al., 2009). We find an average dust production rate of over the entire simulation, and a change in the dust production rate by approximately five orders of magnitude over the course of the simulation. This fits our understanding of an episodic dust forming WCd system, with an extremely clear “active” period followed by a slow tapering off of dust production as the system approaches the “dormant” period. Our value for the dust-to-gas mass ratio within the system appears to be sensible, while our average dust production rate is significantly higher. This is due to the limited temporal sample of the simulation. We would find a significantly lower average dust production rate over the course of a full orbit due to more sampling of the system over the “dormant” period. We can compare our results to the estimated dust yields from Lau et al. (2020), which found an average dust production rate of throughout an entire orbit of WR140. Extrapolating our results with a dust production period of we find an average dust production rate of over the total orbit. This is within an order of magnitude of the estimated dust production rate from Lau et al. (2020), though indicates that the model requires additional work in order to perform quantitative analysis of these systems – which is in line with our conclusions in our previous paper.
4.1 Instabilities
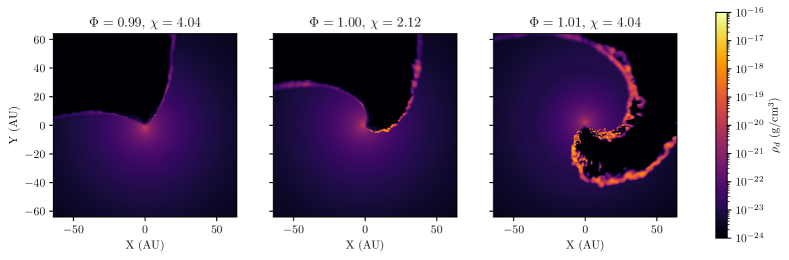
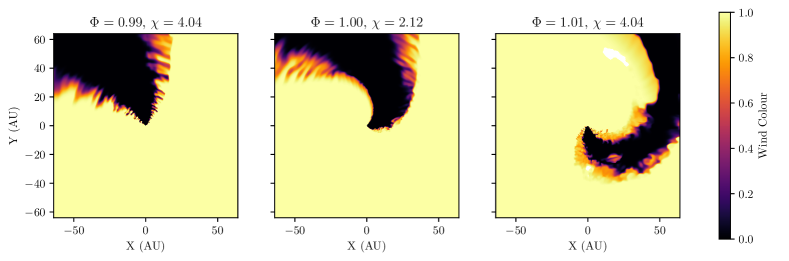
As can be seen in Fig. 6, after periastron passage the post-shock WCR region transitions from a smooth adiabatic wind to a highly radiative wind dominated by radiative, thin-shell instabilities. As the WCR becomes increasingly radiative, dust growth drastically increases, with the bulk of dust production occurring within the high density regions produced by these instabilities. However these clumpy pockets of gas do not exhibit significant dust growth beyond from the simulation barycentre, with concentrations of dust remaining approximately constant (Fig. 7). KH instabilities can also be present, and have been observed to result in significantly increased dust formation (Eatson et al., 2022), the ratio of wind terminal velocities for WR140 is comparatively low. Therefore, radiative instabilities are the primary motivator driving dust formation in WR140. By the end of the simulation at , the WCR is still somewhat dominated by instabilities, with an elevated dust production rate even though the cooling parameter has increased significantly to , which would normally imply adiabatic behaviour. Whilst the dust production rate has reduced significantly, there is still a significantly greater growth rate than at the start of the simulation (after advection). Clearly the transition from radiative back to adiabatic behaviour has a degree of latency, with instabilities still driving the structure of the WCR long after an adiabatic flow should have re-established. Such behaviour was first reported by Pittard (2009) and leads to hysteresis in the x-ray emission (Pittard & Parkin, 2010). This is the key physics responsible for the asymmetric dust growth rate about periastron. It seems that once instabilities form in the WCR, they are somewhat difficult to stop - and cause oblique shocks, with lower post-shock temperature and ultimately stronger cooling than expected. The amount of wind being mixed in the WCR also significantly increases after periastron passage, which would be conducive to the formation of complex organic molecules on the surface of the dust grains (Fig. 8). Whilst this is beyond the scope of the current work, evolution of dust grains from WCd systems on longer time and length scales would be an enlightening avenue of research.
4.2 Influence of varying wind velocity on dust production
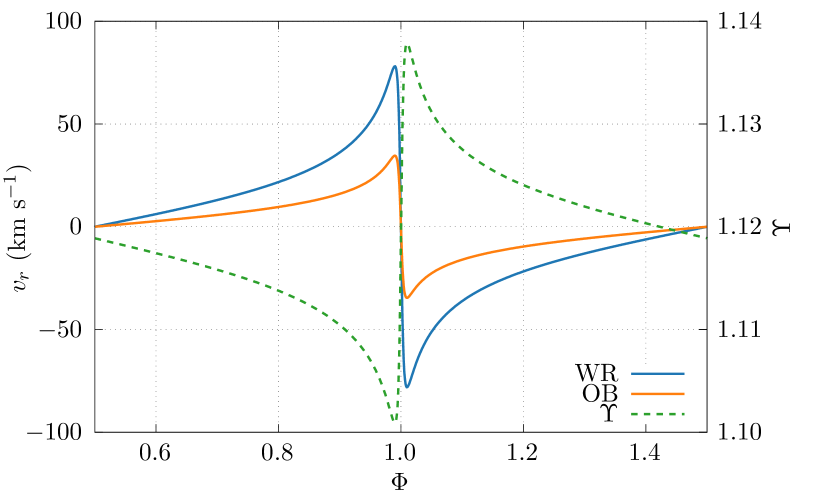
As we have previously discussed, varying the wind terminal velocity for both stars in a simulation can result in significant changes in the dust production rate. This is theorised to be due to the increased cooling in the WCR caused by slower winds, as well as through KH instabilities driven by a wind velocity shear (if the wind terminal velocities are significantly different, see Stevens et al. (1992)). Previous work on this subject considered systems with circular orbits (Eatson et al., 2022), where the pre-shock velocities are constant over the orbit of the system. However, in the case of a system with an eccentric orbit (such as WR140), the outflow velocity for each wind, as well as their ratio, can markedly vary over the systems orbit. As the stars approach periastron, the radial velocity, , for each star rapidly changes from a maximum value to a minimum, as the stars approach and then swing past one another (Fig. 9). This causes a rapid change in the pre-shock velocity for both winds. This then influences the amount of radiative cooling in the post-shock wind, suppressing radiative cooling pre-periastron and inciting it post-periastron; leading to changes in the dust production rate. While the change in wind velocity is relatively small (with the wind velocity varying by as much as 6% over the course of an orbit) it still impacts the cooling of the system, and can vary by as much as a factor of 1.26 in the case of WR140.
The rate of dust production is also affected by the presence of a large wind velocity ratio, , where:
| (24) |
As the mass of each star is different, the change in radial velocity differs for each star, causing a variability in the velocity ratio and therefore velocity shear. Previous research with dust models suggests that a strong velocity shear drives an increased dust production rate. We find that the maximum velocity shear occurs at (Fig. 9), around the same time where the dust growth rate is at a maximum; this is consistent with our previous work. This change in velocity shear may therefore be another factor behind the increased dust growth of WR140 post-periastron.
We also note that in reality there could be significant change in the pre-shock velocity of the O wind due to the WCR encroaching into the acceleration region during periastron (Sugawara et al., 2015).
5 Summary
Despite only simulating a limited section of the orbit of WR140, we have made a number of insights into the behaviour of the system. We find a significant degree of change in the dust production rate as a direct consequence of the changing orbital separation of the system. This is related to the change in the behaviour of the post-shock WCR wind, which goes from a smooth adiabatic wind to a clumpy, high density wind dominated by instabilities ideal for dust growth. It is particularly interesting to note that the system does not revert to behaving adiabatically as quickly as expected. This suggests that the post-shock WCR condition of the system is dependent on additional factors, instead of being solely due to . One of the factors on this delayed return to the adiabatic state is potentially due to the orbital motion of the stars themselves. As the stars approach each other at periastron, the radial velocity of the stars adds velocity to the wind beyond the outflow velocity, resulting in higher wind collision velocities, which encourages adiabatic behaviour in the post-shock flow. The inverse is true as the stars recede from one another: the effective wind velocity for both stars is reduced, which encourages cooling and the formation of instabilities in the WCR. Furthermore, an increased wind velocity ratio occurs after periastron due to the orbital dynamics which can drive KH instabilities.
Acknowledgements
This work was undertaken on ARC4, part of the High Performance Computing facilities at the University of Leeds, UK. We would also like to thank P. A. Crowther for his work on the Galactic Wolf-Rayet Catalogue (http://pacrowther.staff.shef.ac.uk/WRcat). Finally, we would like to thank the academic referee for their extremely helpful review.
Data Availability
The data underlying this article are available in the Research Data Leeds Repository, at https://doi.org/XXXX.
References
- Anders & Grevesse (1989) Anders E., Grevesse N., 1989, Geochimica et Cosmochimica Acta, 53, 197
- Callingham et al. (2019) Callingham J. R., Tuthill P. G., Pope B. J. S., Williams P. M., Crowther P. A., Edwards M., Norris B., Kedziora-Chudczer L., 2019, Nat. Astron., 3, 82
- Crowther (2003) Crowther P. A., 2003, Astrophys. Space Sci., 285, 677
- Draine & Salpeter (1979) Draine B. T., Salpeter E. E., 1979, ApJ, 231, 77
- Dwek & Werner (1981) Dwek E., Werner M. W., 1981, ApJ, 248, 138
- Dwek et al. (1996) Dwek E., Foster S. M., Vancura O., 1996, ApJ, 457, 244
- Eatson et al. (2022) Eatson J. W., Pittard J. M., Van Loo S., 2022, arXiv:2204.07397 [astro-ph]
- Eichler & Usov (1993) Eichler D., Usov V., 1993, ApJ, 402, 271
- Fahed et al. (2011) Fahed R., et al., 2011, MNRAS, 418, 2
- Gayley et al. (1997) Gayley K. G., Owocki S. P., Cranmer S. R., 1997, ApJ, 475, 786
- Hendrix et al. (2016) Hendrix T., Keppens R., van Marle A. J., Camps P., Baes M., Meliani Z., 2016, MNRAS, 460, 3975
- Lamers & Cassinelli (1999) Lamers H. J., Cassinelli J. P., 1999, Introduction to Stellar Winds. Cambridge University Press
- Lau et al. (2020) Lau R. M., Eldridge J. J., Hankins M. J., Lamberts A., Sakon I., Williams P. M., 2020, ApJ, 898, 74
- Mewe et al. (1995) Mewe R., Kaastra J., Liedahl D., 1995, Legacy, 6, 16
- Monnier et al. (1999) Monnier J. D., Tuthill P. G., Danchi W. C., 1999, ApJ, 525, L97
- Monnier et al. (2007) Monnier J. D., Tuthill P. G., Danchi W. C., Murphy N., Harries T. J., 2007, ApJ, 655, 1033
- Pittard (2009) Pittard J. M., 2009, MNRAS, 396, 1743
- Pittard & Dawson (2018) Pittard J. M., Dawson B., 2018, MNRAS, 477, 5640
- Pittard & Parkin (2010) Pittard J. M., Parkin E. R., 2010, MNRAS, 403, 1657
- Pollock et al. (2021) Pollock A. M. T., et al., 2021, The Astrophysical Journal, 923, 191
- Prilutskii & Usov (1976) Prilutskii O. F., Usov V. V., 1976, Soviet astron., 20, 2
- Rosslowe & Crowther (2015) Rosslowe C. K., Crowther P. A., 2015, MNRAS, 447, 2322
- Ruuth & Spiteri (2005) Ruuth S. J., Spiteri R. J., 2005, SIAM J. Numer. Anal., 42, 974
- Sander et al. (2012) Sander A., Hamann W.-R., Todt H., 2012, Astronomy & Astrophysics, 540, A144
- Soulain et al. (2018) Soulain A., et al., 2018, A&A, 618, A108
- Spitzer (2008) Spitzer L., 2008, Physical Processes in the Interstellar Medium. John Wiley & Sons
- Stevens & Pollock (1994) Stevens I. R., Pollock A. M. T., 1994, MNRAS, 269, 226
- Stevens et al. (1992) Stevens I. R., Blondin J. M., Pollock A. M. T., 1992, ApJ, 386, 265
- Stone et al. (2020) Stone J. M., Tomida K., White C. J., Felker K. G., 2020, ApJS, 249, 4
- Sugawara et al. (2015) Sugawara Y., et al., 2015, Publ Astron Soc Jpn Nihon Tenmon Gakkai, 67, 121
- Thomas et al. (2021) Thomas J. D., et al., 2021, MNRAS, 504, 5221
- Tielens et al. (1994) Tielens A. G. G. M., McKee C. F., Seab C. G., Hollenbach D. J., 1994, ApJ, 431, 321
- Tuthill et al. (1999) Tuthill P. G., Monnier J. D., Danchi W. C., 1999, Nature, 398, 487
- Williams (1995) Williams P. M., 1995, in van der Hucht K. A., Williams P. M., eds, , Wolf-Rayet Stars: Binaries, Colliding Winds, Evolution: Proceedings of the 163rd Symposium of the International Astronomical Union, Held in La Biodola, Elba, Italia, May 2–6, 1994. Springer Netherlands, Dordrecht, pp 335–345, doi:10.1007/978-94-011-0205-6_79
- Williams et al. (1987) Williams P. M., van der Hucht K. A., Thé P. S., 1987, A&A, 182, 91
- Williams et al. (1990) Williams P. M., van der Hucht K. A., Pollock A. M. T., 1990, MNRAS, 243, 662
- Williams et al. (2009) Williams P. M., et al., 2009, MNRAS, 395, 1749
- Williams et al. (2015) Williams P. M., Crowther P. A., van der Hucht K. A., 2015, MNRAS, 449, 1834