Deep simultaneous limits on optical emission from FRB 20190520B by 24.4 fps observations with Tomo-e Gozen
Abstract
We conduct 24.4 fps optical observations of repeating Fast Radio Burst (FRB) 20190520B using Tomo-e Gozen, a high-speed CMOS camera mounted on the Kiso 105-cm Schmidt telescope, simultaneously with radio observations carried out using the Five-hundred-meter Aperture Spherical radio Telescope (FAST). We succeeded in the simultaneous optical observations of 11 radio bursts that FAST detected. However, no corresponding optical emission was found. The optical fluence limits as deep as 0.068 Jy ms are obtained for the individual bursts (0.029 Jy ms on the stacked data) corrected for the dust extinction in the Milky Way. The fluence limit is deeper than those obtained in the previous simultaneous observations for an optical emission with a duration ms. Although the current limits on radio–optical spectral energy distribution (SED) of FRBs are not constraining, we show that SED models based on observed SEDs of radio variable objects such as optically detected pulsars, and a part of parameter spaces of theoretical models in which FRB optical emission is produced by inverse-Compton scattering in a pulsar magnetosphere or a strike of a magnetar blastwave into a hot wind bubble, can be ruled out once a similar fluence limit as in our observation is obtained for a bright FRB with a radio fluence Jy ms.
1 Introduction
A Fast Radio Burst (FRB) is a transient astronomical object observed at 1 GHz frequency with a typical duration of several milliseconds, whose origin is not yet known (e.g., Lorimer et al., 2007; Thornton et al., 2013). Roughly 600 FRB sources have been discovered so far, among which more than 20 FRB sources are known to produce bursts repeatedly (repeating FRBs), while other FRB sources do not show any repetition (non-repeating FRBs). FRBs have large dispersion measures (hereafter DMs) that exceed the expected amounts within the Milky Way (MW) in their direction. Their large DMs suggest that FRBs are extragalactic objects. Although various theoretical models have been proposed (e.g., Totani, 2013; Kashiyama et al., 2013; Popov & Postnov, 2013; Falcke & Rezzolla, 2014; Cordes & Wasserman, 2016; Zhang, 2017, see Platts et al. 2019 for a review), observational evidence that confirms or rejects those models is still lacking.
Majority of the currently known FRBs have been discovered by widefield radio telescopes with typical localization accuracy of 10 arcmin, and hence it is challenging to identify their counterparts or host galaxies in most of the cases. Currently, identifications of FRB host galaxies, and hence distance measurements that are independent of DM, have been achieved only for 20 FRBs among the 600 FRBs. Distances of other FRBs are estimated from their DMs assuming that the DMs in excess of the expected MW component arise mostly from the inter-galactic medium (IGM), and considered to be widely distributed over a redshift range –2. In cases where a host galaxy of an FRB is known, the distance estimate from their DMs are mostly consistent with the redshifts of the host galaxies (Macquart et al., 2020), however, there is a case of FRB 20190520B (also referred as FRB 190520B) in which the DM indicates much larger distance than inferred from the redshift (Niu et al., 2021).
Discovery of a counterpart of a mysterious astronomical object in other observational passband often revolutionize our understanding on the nature of the object. No clear transient counterpart of an FRB has been found in any wavelength despite the counterpart searches carried out in various passbands and timescales (e.g., Petroff et al., 2015; Niino et al., 2018; Tominaga et al., 2018), except the case of FRB 200428A, an FRB like burst from a galactic magnetar SGR 1935+2154 (The CHIME/FRB Collaboration et al., 2020; Bochenek et al., 2020), which was detected simultaneously with an extraordinary X-ray flare from the same magnetar (Ridnaia et al., 2021). Recently, Li et al. (2022) reported that an optical transient event AT2020hur spatially coincided with repeating FRB 180916B within 1 arcsec, although it is not clear weather AT2020hur is an emission from the same object as the repeating FRB source.
A few pulsars are detected both in radio and optical (e.g., Danilenko et al., 2011). It is possible that FRBs have optical emission if they are produced by a similar emission mechanism as that of pulsars, which, in itself, is still poorly understood. Yang et al. (2019, hereafter Y19) has shown that an detectable optical emission that accompanies an FRB can be produced by inverse-Compton scattering (IC). It is also possible that a blastwave from a magnetar cause a bright optical flare when it collides into a hot wind bubble produced by a previous flare (Beloborodov, 2020, hereafter B20). The existence of complex magneto-ionic environments near a few repeating FRBs, which possibly supports the blastwave scenario, has been indicated by the analysis of observed frequency-dependent polarization (Feng et al., 2022). However, search for an optical FRB counterpart on a timescale that is comparable to the timescale of an FRB is especially challenging because most of the existing observing facilities require longer observing timescale than a few seconds (see e.g., Andreoni et al., 2020; Xin et al., 2021; Kilpatrick et al., 2021, for searches of an optical emission from an FRB on longer timescales).
There is a few optical upper limits with a sub-second timescale that were obtained simultaneously with several radio bursts from FRB 121102, i.e. the first repeating FRB source discovered, using telescopes equipped with an electron-multiplying CCD camera which enables observations in a sub-second time resolution (Hardy et al., 2017; Karpov et al., 2019) or using gamma-ray Cherenkov telescopes as optical facilities (MAGIC Collaboration et al., 2018). However no optical counterpart has been detected so far. Furthermore, a search of optical emission from other repeating FRBs with a sub-second timescale is missing despite the growing number of repeating FRB sources discovered.
In this paper, we present searches for optical emission from repeating FRB 20190520B with a 24.4 fps observation using a high-speed CMOS camera, Tomo-e Gozen (Sako et al., 2018), mounted on the Kiso 105-cm Schmidt telescope, which are conducted simultaneously with radio observations by the Five-hundred-meter Aperture Spherical radio Telescope (FAST). In section 2, we describe our observation and data analysis. In section 3, we investigate optical data that corresponds to the arrival time of the radio bursts detected during the observations, and discuss upper limits on the optical fluences of the bursts obtained by our observation. We summarize our conclusion in section 4.
2 Observations
Repeating FRB 20190520B was discovered with FAST (Nan et al., 2011; Li et al., 2013). The initial detection was obtained during a drift-scan on 2019 May 20, as part of the Commensal Radio Astronomy FAST Survey (CRAFTS, Li et al., 2018). Subsequent sub-arcsecond localization was obtained in July, 2020 with the Karl G. Jansky Very Large Array (VLA). FRB 20190520B is characterized by its large DM cm-3 pc compared to the redshift of the host galaxy , and the association with a compact persistent radio source (Niu et al., 2021). The large DM indicates the DM component that arise from gas in the host galaxy reaches cm-3 pc, which is nearly an order of magnitude higher than that in other FRB host galaxies and overwhelms the IGM component which can be used as a distance indicator. To investigate optical emission component of the bursts from FRB 20190520B, we conduct optical monitoring observations of the FRB using Tomo-e Gozen, simultaneously with observations of the same FRB by FAST.
We observed FRB 20190520B on the nights of 2020 August 4, 6, 14, and 16, using Tomo-e Gozen. Although the highest frame rate Tomo-e Gozen can achieve with full-frame readout ( pixels) is 2 fps, higher frame rate can be achieved with partial-frame readout. For the observations of FRB 20190520B, we achieve a frame rate of 24.4 fps with 40.9 ms integration in each frame, with a partial readout of pixels in each sensor ( arcmin2 with a pixel scale of 1.189 arcsec/pix) with the long side oriented in the East-West direction. Output data are written as 3D FITS files with each file containing a series of 1000 frames. The time gaps between the frames are as short as 0.1 ms, however there is a longer time gap of 1 sec in every 1000 frames (41 sec) during which the data is written to a FITS file.
We do not use a filter for the observations, and the observing passband is determined by the spectral response function of the CMOS sensors, which covers a wavelength range 370–730 nm with a peak at 500 nm (Kojima et al., 2018). The timestamps of the Tomo-e Gozen data are GPS-synchronized, and have an accuracy of ms. Subtraction of bias and dark, and flat-fielding have been performed in a standard manner. The calibration data is obtained at the beginning of each night. A dark+bias image is generated by stacking 4500 frames (40.9 ms/frame) for each night, and each flat image is generated by stacking 180 dome-flat frames (1 sec/frame).
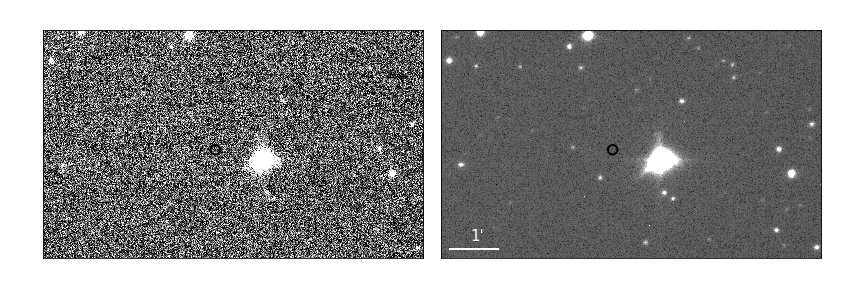
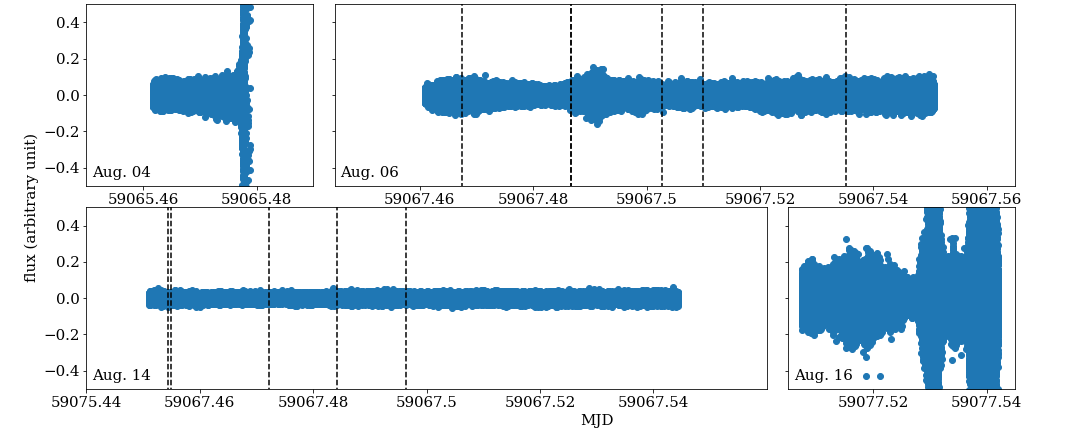
A single frame image (40.9 ms exposure) and a stacked image of 1000 frames of the arcmin2 field around FRB 20190520B are shown in figure 1. No object is detected at the coordinate of FRB 20190520B. We perform forced photometry at the coordinate in each frame. The lightcurve obtained by the forced photometry is shown in figure 2. The arrival times of the radio bursts at the solar system barycenter are reported in Niu et al. (2021). We convert the timestamps of the optical data to the time at the barycenter using the software package astropy (Astropy Collaboration et al., 2013), in order to compare them with the arrival time of the radio bursts.
Here we perform an approximated photometric calibration of all optical data, using a nearby bright star V* V1042 Sco located at 1 arcmin west of FRB 20190520B as a photometric standard. We assume that the flux of V* V1042 Sco does not vary during observation in each day, although V* V1042 Sco is known to be a pulsating K-type giant with a variability amplitude mag and a period of days (Watson et al., 2006; Alfonso-Garzón et al., 2012). We perform more accurate calibration of the data that correspond to the arrival times of the radio bursts in the next section. The observing condition was good on the night of August 14, while it was slightly cloudy on August 6. The conditions were unstable on the nights of August 4 and 16. Significant signal is not found above the noise level in the optical lightcurve.
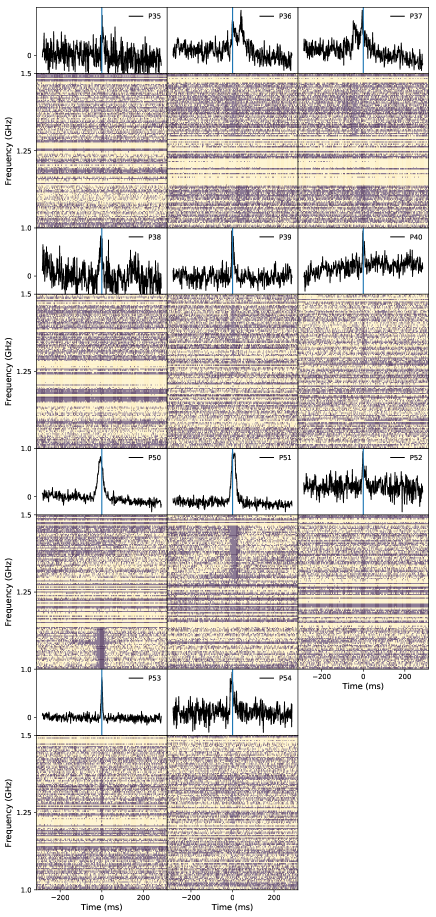
FAST detected 6 and 5 radio bursts during the simultaneous observations on August 6 and 14, respectively. In order to examine the optical image frames that corresponds to the arrival times of the radio bursts, we correct the DM effect on the arrival times that are reported at 1.5 GHz assuming the best estimate DM in each day as presented in Niu et al. (2021). The DM corrected arrival times of the radio bursts and their dynamic spectra are shown in figure 2 and figure 3, respectively.
3 Optical data at the arrival times of the radio bursts
3.1 Photometric calibration
In order to perform photometric calibration of the optical data that correspond to the arrival times of the radio bursts independently of the variable star V* V1042 Sco, we use stars in the Pan-STARRS1 catalog (Chambers et al., 2016, PS1) around the FRB 20190520B coordinate in the magnitude range as photometric standards. We perform photometry of the stars on stacked images of all frames contained in each FITS file (1000 frames), assuming that the photometric zeropoint does not vary during an exposure for 1000 frames, i.e. 41 sec. We use an aperture radius of 6 arcsec while the typical seeing size of the images is full width at half maximum (FWHM) 3–4 arcsec. The typical 5 limiting magnitudes of the stacked images are and 18.8 during the observations on August 6 and 14, respectively.
To correct for the difference of passbands between Tomo-e Gozen and PS1, we compute broad band colors of the template stellar spectra provided by Kesseli et al. (2017), by convoluting the template spectra with the spectral response functions of the CMOS sensors equipped in Tomo-e Gozen, and the , , band filters of PS1. We perform 2 dimensional second order polynomial fit of the broad band colors of the spectral templates with color as a function of and colors, where represents apparent magnitude in the Tomo-e Gozen passband. The result of the fitting is , and the standard deviation of the fitting residuals is 0.025 mag.
We compute the expected of the stars around FRB 20190520B using the , , band magnitudes provided in the PS1 catalog and the color correlation derived above. We determine photometric zeropoints within each exposure comparing the photometric counts in the stacked images with the expected . The typical standard deviations of the zeropoint fit residuals are 0.10 mag and 0.05 mag on August 6 and 14, respectively, which we consider as the uncertainty of the photometric calibration.
3.2 Limits on optical fluences of the bursts
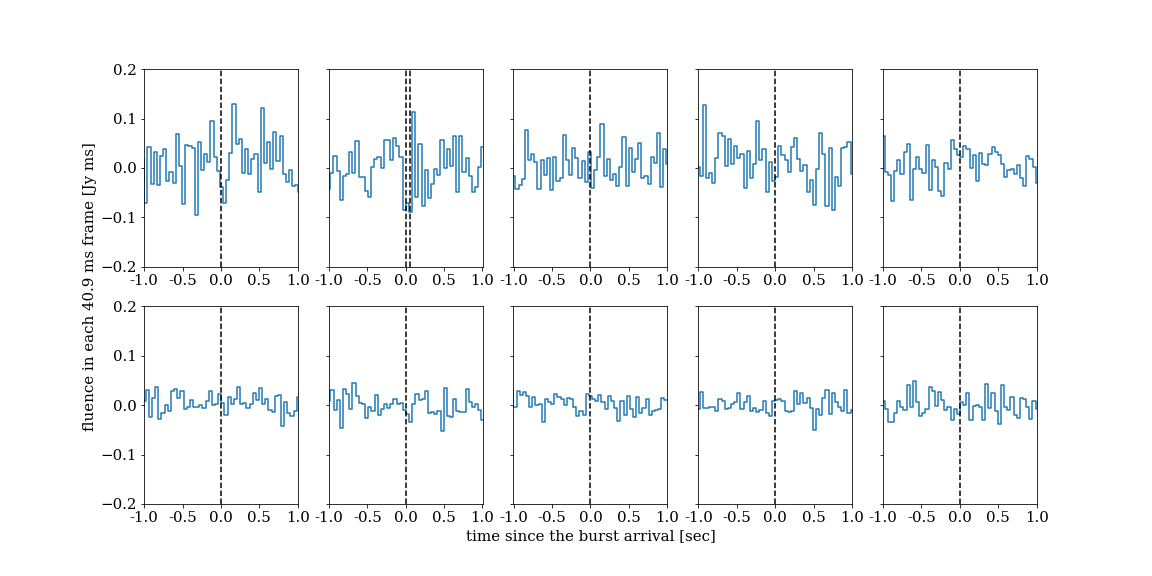
The photometrically calibrated optical lightcurve around the radio burst arrival times are shown in figure 4. Any significant excess of optical flux is not found within sec of the burst arrival times. The limits on the optical fluences in the frames that correspond to the burst arrival times are estimated by performing point spread function (PSF) photometry at 1000 random positions in each frame, assuming Gaussian PSFs with FWHM arcsec on August 6, and 3.8 arcsec on August 14. We note that the data is read out from the CMOS sensor in a rolling shutter scheme, and hence the readout time is different in different positions in a single frame. We identify the frames corresponding to the burst arrival times using the readout time at the position of the FRB in each image.
The 5 optical limits obtained with Tomo-e Gozen span 16.6–15.7 (or 0.86–1.88 mJy) which corresponds to the fluence range of 0.035–0.077 Jy ms with the integration time of 40.9 ms without correction for dust extinction. We stack the 11 frames that correspond to the burst arrival times in order to constrain the averaged optical flux of the 11 bursts, and obtain optical upper limit of (0.36 mJy) corresponding to the fluence of 0.015 Jy ms. We also stack frames and frames around the frames corresponding to the burst arrival times, i.e. 11 frames (0.45 sec) and 51 frames (2.1 sec) for each of the 11 bursts, in order to investigate optical fluence on longer timescales. By stacking the 121 frames and the 561 frames for the 11 bursts, we obtain fluence limits of 0.067 Jy ms and 0.176 Jy ms on the timescales of 0.45 sec and 2.1 sec, respectively. We allow duplicate frames in the stacking when multiple radio bursts are detected within the timescale considered.
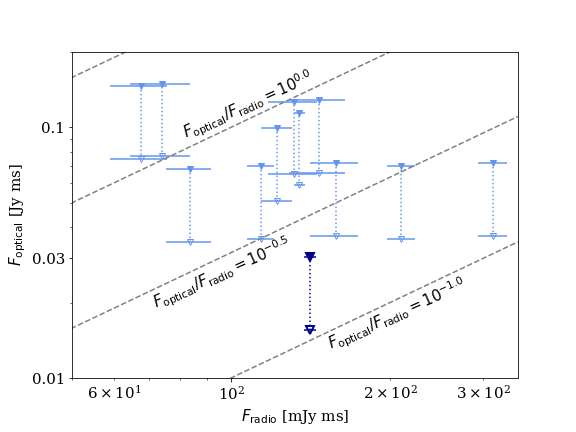
The color excess in the MW in the direction of FRB 20190520B is based on the color excess map by Schlafly & Finkbeiner (2011, https://www.ipac.caltech.edu/doi/ned/10.26132/NED5). We estimate the extinction in the Tomo-e Gozen passband () assuming flat spectrum of a source as where is the spectral response function of the CMOS sensors and is the extinction law derived by Cardelli et al. (1989), and obtain . Corrected for the extinction in the MW, the optical fluence limits are 0.068–0.149 Jy ms for individual bursts, 0.029 Jy ms for the stacked data, and 0.13 (0.34) Jy ms on the timescale of 0.45 (2.1) sec. The optical fluence limits are shown in figure 5 as a function of radio fluence of each burst with and without the correction.
It is also possible that optical emission from FRB 20190520B is affected by the dust extinction within the host galaxy of the FRB. Although the host galaxy dust extinction along the line-of-sight to the FRB is not known, the averaged extinction in the host galaxy can be estimated from the flux ratio of the emission lines in the Balmer series. The host galaxy of FRB 20190520B is a dwarf galaxy with high specific star formation rate (Niu et al., 2021). Spectroscopic observation of the host galaxy revealed erg cm-2s-1, and erg cm-2s-1 corrected for the MW dust extinction (Ocker et al. 2022; Tsai et al., in prep.).
Assuming the intrinsic line ratio of and the extinction law derived by Calzetti et al. (2000) which is often used for an actively star forming galaxy, the estimated color excess is in the rest frame of the host galaxy which corresponds to in the observer frame. However, we note that FRB 20190520B is located 1.3 arcsec offset ( 5 kpc) from the center of the host galaxy, and the spatial structure of the emission lines in the host galaxy is not resolved in the spectroscopic observation. Hence the line-of-sight dust extinction to FRB 20190520B might be different from the extinction estimated from the Balmer lines.
3.3 Comparison to the previous simultaneous limits in optical
MAGIC Collaboration et al. (2018) carried out a simultaneous multi-wavelength observation of repeating FRB 121102 using the Arecibo radio telescope and the MAGIC (Major Atmospheric Gamma Imaging Cherenkov) telescope, in which 5 radio bursts were detected. They put upper limits on the optical flux of the radio bursts using the Cherenkov telescope as an optical facility. By stacking the optical data around the burst arrival times, they achieved fluence limits of 0.0012, 0.0041, 0.012, and 0.017 Jy ms on timescales of 0.1, 1, 5, and 10 ms, respectively (5 in -band without correction for the dust extinction). The MW color excess in the direction of FRB 121102 is , which corresponds to the extinction of in -band. When correction for the dust extinction is applied, the fluence limit obtained by MAGIC is 0.025, 0.086, 0.25, and 0.36 Jy ms depending on the timescale.
Hardy et al. (2017) also carried out a simultaneous observation of FRB 121102, using the 100-m Effelsberg Radio Telescope and an electron-multiplying CCD camera, ULTRASPEC, mounted on the 2.4-m Thai National Telescope. They detected 13 radio bursts. Stacking the relevant optical image frames, they achieved the fluence limit of 0.046 Jy ms with a time resolution of ms at an observing wavelength of 767 nm without extinction correction. The MW color excess in the direction of FRB 121102 () corresponds to . Corrected for the MW dust extinction, the fluence limit is Jy ms.
Thus, our fluence limit from the stacked data, 0.029 Jy ms with the timescale of 40.9 ms, is deeper than the previous optical fluence limits for an optical emission with a timescale 0.1 ms which is typical of FRB durations in radio, while the observation by MAGIC puts a deeper limit for an emission with shorter duration. In the following sections, we discuss optical fluence limits corrected for dust extinction in the MW unless stated otherwise.
3.4 Optical to radio fluence ratio
Here we discuss the limits on optical emission relative to the fluence of the radio bursts. The 11 radio bursts detected by FAST during the simultaneous observations have radio fluences ranging 70–310 mJy ms (see Niu et al., 2021, for the properties of each burst), and the optical limit to radio fluence ratio is – for individual bursts (figure 5). Comparing the stacked optical limit ( Jy ms) to the averaged radio fluence of the bursts (0.141 Jy ms), we obtain .
The averaged radio fluence of the 5 radio bursts detected by Arecibo in MAGIC Collaboration et al. (2018) is 2 Jy ms, and hence their optical limit obtained from the stacked data, 0.025–0.36 Jy ms depending on the timescale considered (0.1–10 ms), corresponds to –. The median radio fluence of the radio bursts detected by the Effelsberg telescope in Hardy et al. (2017) is 0.6 Jy ms, with which their optical fluence limit of Jy ms corresponds to . Chen et al. (2020) also discussed of FRBs in a statistical way based on wide field surveys in various observing wavelength ranging from optical to gamma-ray, assuming that the functional form of the fluence distribution of FRBs remains unchanged in any wavelength. They found that in optical, although this limit is an average over a wide survey area and it is difficult to correct for the dust extinction.
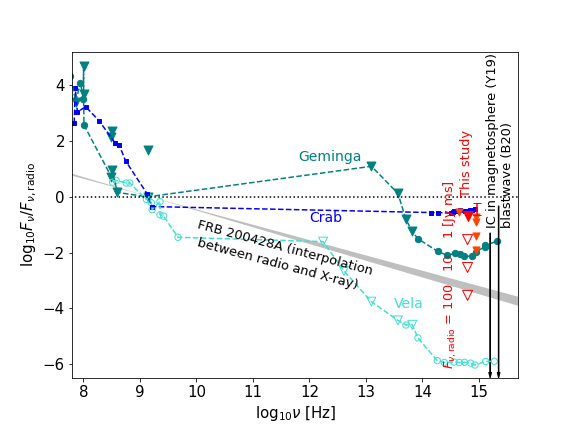
The fluences of the 11 radio bursts detected by FAST and discussed in this study are smaller than the typical fluence of FRBs detected by other radio telescopes, which is Jy ms, and the small radio fluence makes the limit on less constraining. However, if a similar limit on optical fluence is obtained for a brighter radio burst, the limit on may put more strict constraints on the spectral energy distribution (SED) of the burst. For example, in case that the optical fluence limit of Jy ms is obtained for a radio burst with radio fluence , 10, and 100 Jy ms, the limit on is , and , respectively. Radio bursts with Jy ms are indeed detected from several FRBs including repeating FRB 171019 (Shannon et al., 2018; Kumar et al., 2019). We compare the limits to theoretical and empirical models of an SED of a radio variable object below (figure 6).
It is difficult to robustly predict optical luminosity of a FRB as neither the origin nor the emission mechanism is known. However, it is possible that IC in a pulsar magnetosphere produce a short optical emission as bright as associated with an FRB as discussed in Y19. B20 also discussed that an optical emission of erg with a timescale sec can be produced when a blastwave from a magnetar impacts a hot wind bubble in the tail of a previous flare. Comparing the energy limit with the energy release of the brightest radio burst discussed in this study ( erg, Niu et al., 2021), the prediction of the blastwave model corresponds to . The current observational limits on obtained by the simultaneous observations are comparable to the brightest end of the possible range of optical emission predicted by the models. The parameter space of the models can be constrained once a similar limit on optical fluence as obtained in this study is achieved for a brighter radio burst.
We also consider detectability of optical emission from an FRB in cases where FRBs have similar SED to that of galactic pulsars that are detected in optical passbands. Among pulsars that are detected in optical, the Crab pulsar is known to have bright optical emission with when is measured at GHz (e.g., Bühler & Blandford, 2014). If an FRB typically has an SED which is similar to the Crab pulsar, our observations and some of the previous optical observations could have detected an FRB optical emission. Although other pulsars are fainter in optical, the Geminga has which can be detected with our observation for a radio burst with Jy ms. On the other hand, the Vela pulsar has , with which optical emission from an FRB would be difficult to detect.
The interpolation between the observed radio and X-ray fluences of FRB 200428A (a radio burst from a galactic magnetar SGR 1935+2154) is also considered as an SED template, although the spectral slope derived from the X-ray data alone does not agree with the interpolation (Ridnaia et al., 2021). The radio burst has fluence of 700 kJy ms and 1.5 MJy ms at 600 MHz and 1.4 GHz, respectively (The CHIME/FRB Collaboration et al., 2020; Bochenek et al., 2020). The X-ray flare that occurred simultaneously with FRB 200428A has fluence of 1 Jy ms at 100 keV (Ridnaia et al., 2021). By interpolating between the radio fluence at 600 MHz (1.4 GHz) and the X-ray fluence with a simple power-law, , we obtain () which can be detected in optical with our observation when Jy ms.
4 Conclusions
We have conducted 24.4 fps optical observations of FRB 20190520B simultaneously with the monitoring observation by FAST. 11 radio bursts are detected by FAST during the simultaneous observations, however no corresponding optical emission is found. The limits on optical emission within the image frames that correspond to the arrival times of the radio bursts are 0.068–0.149 Jy ms in terms of the fluence in the integration time of 40.9 ms, corrected for the foreground dust extinction in the MW. We also obtain the optical fluence limit of Jy ms by stacking the image frames that correspond to the radio bursts.
Our fluence limit is deeper than those obtained by the previous simultaneous observations with sub-second time resolution for an optical emission with a duration ms. Although the current limits on the optical to radio fluence ratio do not strictly constrain SED models of an FRB, some template SEDs based on optically detected pulsars and also a part of parameter spaces of the theoretical models of FRB optical emission by IC in a pulsar magnetosphere (Y19) and magnetar blastwave (B20) can be ruled out if a similar fluence limit as in our observation is obtained for a radio burst with Jy ms. With the progress in high-speed optical facilities and the discovery of various FRB sources, it is possible that optical emission from an FRB is found in the near future.
References
- Alfonso-Garzón et al. (2012) Alfonso-Garzón, J., Domingo, A., Mas-Hesse, J. M., & Giménez, A. 2012, A&A, 548, A79, doi: 10.1051/0004-6361/201220095
- Andreoni et al. (2020) Andreoni, I., Lu, W., Smith, R. M., et al. 2020, ApJ, 896, L2, doi: 10.3847/2041-8213/ab94a5
- Astropy Collaboration et al. (2013) Astropy Collaboration, Robitaille, T. P., Tollerud, E. J., et al. 2013, A&A, 558, A33, doi: 10.1051/0004-6361/201322068
- Beloborodov (2020) Beloborodov, A. M. 2020, ApJ, 896, 142, doi: 10.3847/1538-4357/ab83eb
- Bertin & Arnouts (1996) Bertin, E., & Arnouts, S. 1996, A&AS, 117, 393, doi: 10.1051/aas:1996164
- Bochenek et al. (2020) Bochenek, C. D., Ravi, V., Belov, K. V., et al. 2020, arXiv e-prints, arXiv:2005.10828. https://arxiv.org/abs/2005.10828
- Bühler & Blandford (2014) Bühler, R., & Blandford, R. 2014, Reports on Progress in Physics, 77, 066901, doi: 10.1088/0034-4885/77/6/066901
- Calzetti et al. (2000) Calzetti, D., Armus, L., Bohlin, R. C., et al. 2000, ApJ, 533, 682, doi: 10.1086/308692
- Cardelli et al. (1989) Cardelli, J. A., Clayton, G. C., & Mathis, J. S. 1989, ApJ, 345, 245, doi: 10.1086/167900
- Chambers et al. (2016) Chambers, K. C., Magnier, E. A., Metcalfe, N., et al. 2016, ArXiv e-prints. https://arxiv.org/abs/1612.05560
- Chen et al. (2020) Chen, G., Ravi, V., & Lu, W. 2020, ApJ, 897, 146, doi: 10.3847/1538-4357/ab982b
- Cordes & Wasserman (2016) Cordes, J. M., & Wasserman, I. 2016, MNRAS, 457, 232, doi: 10.1093/mnras/stv2948
- Danilenko et al. (2011) Danilenko, A. A., Zyuzin, D. A., Shibanov, Y. A., & Zharikov, S. V. 2011, MNRAS, 415, 867, doi: 10.1111/j.1365-2966.2011.18753.x
- Falcke & Rezzolla (2014) Falcke, H., & Rezzolla, L. 2014, A&A, 562, A137, doi: 10.1051/0004-6361/201321996
- Feng et al. (2022) Feng, Y., Li, D., Yang, Y.-P., et al. 2022, Science, 375, 1266, doi: 10.1126/science.abl7759
- Hardy et al. (2017) Hardy, L. K., Dhillon, V. S., Spitler, L. G., et al. 2017, MNRAS, 472, 2800, doi: 10.1093/mnras/stx2153
- Karpov et al. (2019) Karpov, S., Jelinek, M., & Štrobl, J. 2019, Astronomische Nachrichten, 340, 613, doi: 10.1002/asna.201913664
- Kashiyama et al. (2013) Kashiyama, K., Ioka, K., & Mészáros, P. 2013, ApJ, 776, L39, doi: 10.1088/2041-8205/776/2/L39
- Kesseli et al. (2017) Kesseli, A. Y., West, A. A., Veyette, M., et al. 2017, ApJS, 230, 16, doi: 10.3847/1538-4365/aa656d
- Kilpatrick et al. (2021) Kilpatrick, C. D., Burchett, J. N., Jones, D. O., et al. 2021, ApJ, 907, L3, doi: 10.3847/2041-8213/abd560
- Kojima et al. (2018) Kojima, Y., Sako, S., Ohsawa, R., et al. 2018, in Society of Photo-Optical Instrumentation Engineers (SPIE) Conference Series, Vol. 10709, High Energy, Optical, and Infrared Detectors for Astronomy VIII, ed. A. D. Holland & J. Beletic, 107091T, doi: 10.1117/12.2311301
- Kumar et al. (2019) Kumar, P., Shannon, R. M., Osłowski, S., et al. 2019, ApJ, 887, L30, doi: 10.3847/2041-8213/ab5b08
- Li et al. (2013) Li, D., Nan, R., & Pan, Z. 2013, in Neutron Stars and Pulsars: Challenges and Opportunities after 80 years, ed. J. van Leeuwen, Vol. 291, 325–330, doi: 10.1017/S1743921312024015
- Li et al. (2018) Li, D., Wang, P., Qian, L., et al. 2018, IEEE Microwave Magazine, 19, 112, doi: 10.1109/MMM.2018.2802178
- Li et al. (2022) Li, L., Li, Q.-C., Zhong, S.-Q., et al. 2022, arXiv e-prints, arXiv:2203.06994. https://arxiv.org/abs/2203.06994
- Lorimer et al. (2007) Lorimer, D. R., Bailes, M., McLaughlin, M. A., Narkevic, D. J., & Crawford, F. 2007, Science, 318, 777, doi: 10.1126/science.1147532
- Macquart et al. (2020) Macquart, J. P., Prochaska, J. X., McQuinn, M., et al. 2020, Nature, 581, 391, doi: 10.1038/s41586-020-2300-2
- MAGIC Collaboration et al. (2018) MAGIC Collaboration, Acciari, V. A., Ansoldi, S., et al. 2018, MNRAS, 481, 2479, doi: 10.1093/mnras/sty2422
- Nan et al. (2011) Nan, R., Li, D., Jin, C., et al. 2011, International Journal of Modern Physics D, 20, 989, doi: 10.1142/S0218271811019335
- Niino et al. (2018) Niino, Y., Tominaga, N., Totani, T., et al. 2018, PASJ, 70, L7, doi: 10.1093/pasj/psy102
- Niu et al. (2021) Niu, C. H., Aggarwal, K., Li, D., et al. 2021, arXiv e-prints, arXiv:2110.07418. https://arxiv.org/abs/2110.07418
- Ocker et al. (2022) Ocker, S. K., Cordes, J. M., Chatterjee, S., et al. 2022, arXiv e-prints, arXiv:2202.13458. https://arxiv.org/abs/2202.13458
- Petroff et al. (2015) Petroff, E., Bailes, M., Barr, E. D., et al. 2015, MNRAS, 447, 246, doi: 10.1093/mnras/stu2419
- Platts et al. (2019) Platts, E., Weltman, A., Walters, A., et al. 2019, Phys. Rep., 821, 1, doi: 10.1016/j.physrep.2019.06.003
- Popov & Postnov (2013) Popov, S. B., & Postnov, K. A. 2013, ArXiv e-prints. https://arxiv.org/abs/1307.4924
- Ridnaia et al. (2021) Ridnaia, A., Svinkin, D., Frederiks, D., et al. 2021, Nature Astronomy, 5, 372, doi: 10.1038/s41550-020-01265-0
- Sako et al. (2018) Sako, S., Ohsawa, R., Takahashi, H., et al. 2018, in Society of Photo-Optical Instrumentation Engineers (SPIE) Conference Series, Vol. 10702, Ground-based and Airborne Instrumentation for Astronomy VII, ed. C. J. Evans, L. Simard, & H. Takami, 107020J, doi: 10.1117/12.2310049
- Schlafly & Finkbeiner (2011) Schlafly, E. F., & Finkbeiner, D. P. 2011, ApJ, 737, 103, doi: 10.1088/0004-637X/737/2/103
- Shannon et al. (2018) Shannon, R. M., Macquart, J. P., Bannister, K. W., et al. 2018, Nature, 562, 386, doi: 10.1038/s41586-018-0588-y
- The CHIME/FRB Collaboration et al. (2020) The CHIME/FRB Collaboration, :, Andersen, B. C., et al. 2020, arXiv e-prints, arXiv:2005.10324. https://arxiv.org/abs/2005.10324
- Thornton et al. (2013) Thornton, D., Stappers, B., Bailes, M., et al. 2013, Science, 341, 53, doi: 10.1126/science.1236789
- Tominaga et al. (2018) Tominaga, N., Niino, Y., Totani, T., et al. 2018, PASJ, 70, 103, doi: 10.1093/pasj/psy101
- Totani (2013) Totani, T. 2013, PASJ, 65, L12, doi: 10.1093/pasj/65.5.L12
- Virtanen et al. (2020) Virtanen, P., Gommers, R., Oliphant, T. E., et al. 2020, Nature Methods, 17, 261, doi: 10.1038/s41592-019-0686-2
- Watson et al. (2006) Watson, C. L., Henden, A. A., & Price, A. 2006, Society for Astronomical Sciences Annual Symposium, 25, 47
- Xin et al. (2021) Xin, L. P., Li, H. L., Wang, J., et al. 2021, ApJ, 922, 78, doi: 10.3847/1538-4357/ac1daf
- Yang et al. (2019) Yang, Y.-P., Zhang, B., & Wei, J.-Y. 2019, ApJ, 878, 89, doi: 10.3847/1538-4357/ab1fe2
- Zhang (2017) Zhang, B. 2017, ApJ, 836, L32, doi: 10.3847/2041-8213/aa5ded