The Decoupled Kinematics of high-z QSO Host Galaxies and their Ly halos
Abstract
We present a comparison of the interstellar medium traced by [CII] (alma), and ionised halo gas traced by Ly (muse), in and around QSO host galaxies at . To date, 18 QSOs at this redshift have been studied with both muse and high–resolution alma imaging; of these, 8 objects display a Ly halo. Using datacubes matched in velocity resolution, we compare and contrast the spatial and kinematic information of the Ly halos and the host galaxies’ [Cii] (and dust-continuum) emission. We find that the Ly halos extend typically times beyond the interstellar medium of the host galaxies. The majority of the Ly halos do not show ordered motion in their velocity fields, whereas most of the [Cii] velocity fields do. In those cases where a velocity gradient can be measured in Ly, the kinematics do not align with those derived from the [Cii] emission. This implies that the Ly emission is not tracing the outskirts of a large rotating disk that is a simple extension of the central galaxy seen in [Cii] emission. It rather suggests that the kinematics of the halo gas are decoupled from those of the central galaxy. Given the scattering nature of Ly, these results need to be confirmed with JWST IFU observations that can constrain the halo kinematics further using the non–resonant H line.
tablenum
1 Introduction
High-redshift quasars (QSOs) present a unique opportunity to study some of the most extreme objects in the Universe, back to Gyr after the Big Bang. In these objects vast amounts of material are funnelled onto galaxies’ central supermassive black holes. This leads to accretion disks that shine with sufficiently high luminosities to allow their detection well into the epoch of reionisation (e.g. Mortlock et al. 2011, Bañados et al. 2018, Yang et al. 2020). At , several hundred QSOs have now been detected (e.g. Bañados et al. 2016, Jiang et al. 2016, Mazzucchelli et al. 2017) and it was recently discovered that some of these QSOs are surrounded by giant Ly halos. Drake et al. (2019) for instance presented deep muse observations of 5 QSOs at , and revealed that 4 of these objects displayed Ly halos comparable in extent and luminosity to their lower redshift counterparts at (e.g. Borisova et al. 2016, Arrigoni Battaia et al. 2019). This confirmed earlier evidence of Ly halos at based on long–slit spectroscopy and/or narrow–band imaging for both the radio–loud QSO J22280110 at (Roche et al. 2014, Zeimann et al. 2011), and J23290301 at (Goto et al. 2009, Willott et al. 2011, Goto et al. 2012 and Momose et al. 2018) and was later followed–up by Farina et al. (2019) who presented additional Ly halos as part of the muse snapshot survey “requiem”.
Contemporaneously, observations from alma have revealed the far–infrared (FIR) dust–continuum and [Cii] emission from the interstellar medium (ISM) in quasar host galaxies (Decarli et al., 2017). These observations confirmed earlier studies in that these objects are rich in gas and dust. Higher spatial–resolution observations from alma reaching resolution of pkpc, have been analysed in a series of papers: These observations revealed centrally–concentrated dust emission around the supermassive black holes (traced by FIR continuum emission; Venemans et al. 2020), and a diverse set of kinematics traced by [Cii] emission (Neeleman et al., 2021) broadly split into three categories of equal number; disturbed, dispersion–dominated, or smoothly rotating. The third paper, Novak et al. (2020), determined that both [Cii] and dust continuum morphologies can be described with a two–component model consisting of a central steep component and an extended component of shallower gradient. While for the compact components the FIR continuum emission is more compact than the [Cii], the extended components of both tracers extend over similar scales.
Despite the growing wealth of information now available for these objects, we have few constraints on the flow of gas into– and around QSO host galaxies, and also the mechanisms governing the supply of pristine gas available to their rapidly–accreting supermassive black holes. Indeed it is a long–standing question for simulations how the cold gas which is funnelled along filaments connects to– and feeds galaxies. Some numerical simulations have suggested that large Ly halos will trace high angular-momentum gas as it is accreted (e.g Stewart et al. 2011 and Stewart et al. 2013) — observational evidence for this scenario is found in Prescott et al. (2015), where the authors report large-scale rotation of a collapsing gas structure. To date, no further rotation of gas in emission on this scale has been presented in the literature. It is prudent then, to compare and contrast available datasets, to gain insights on the relationship between the kinematics of the ISM inside QSO host galaxies and extended Ly halos tracing ionised gas around them (likely to be connected to the circumgalactic medium; CGM e.g. Drake et al. 2019, Farina et al. 2019).
| Object | RA | DEC | z | L[CII] | LFIR | LLyα | d[CII] | dFIR | dLyα |
|---|---|---|---|---|---|---|---|---|---|
| (ICRS) | (ICRS) | 10 | 10 | erg s-1 | pkpc | pkpc | pkpc | ||
| J0129-0035 | 022.4938 | -0.5944 | 5.7788 | 1.920.07 | 4.760.11 | 1e+42 | 1.74 0.17 | 1.10 0.06 | - |
| J1044-0125 | 161.1377 | -1.4172 | 5.7846 | 1.640.21 | 5.480.22 | 1e+42 | 1.88 0.58 | 0.94 0.12 | - |
| P007+04 | 007.0274 | 04.9571 | 6.0015 | 1.580.09 | 4.520.11 | 2e+42 | 1.30 0.23 | 0.65 0.11 | - |
| P009-10 | 009.7355 | -10.4317 | 6.0040 | 9.070.66 | 7.130.69 | 9e+42 | 4.04 0.57 | 3.03 0.46 | 20.40 2.15 |
| J2054-0005 | 313.5271 | -0.0874 | 6.0389 | 3.080.14 | 6.200.19 | 1e+42 | 1.37 0.11 | 0.79 0.06 | - |
| J2100-1715 | 315.2279 | -17.2561 | 6.0807 | 1.310.14 | 1.120.16 | 1e+42 | 1.67 0.45 | 1.30 0.00 | - |
| J2318-3029 | 349.6379 | -30.4927 | 6.1456 | 2.220.12 | 6.290.14 | 1e+42 | 1.24 0.11 | 0.75 0.06 | - |
| P359-06 | 359.1352 | -6.3831 | 6.1719 | 2.620.13 | 1.600.15 | 3.3e+43 | 2.10 0.22 | 1.88 0.28 | 20.09 2.12 |
| P065-26 | 065.4085 | -26.9544 | 6.1871 | 1.710.17 | 2.800.23 | 6.6e+43 | 4.33 0.95 | 1.10 0.39 | 20.07 2.11 |
| P308-21 | 308.0416 | -21.2340 | 6.2355 | 3.370.19 | 2.450.16 | 8.8e+43 | 3.14 0.56 | 3.20 0.56 | 30.64 3.23 |
| J0100+2802 | 015.0543 | 28.0405 | 6.3269 | 3.760.17 | 2.920.18 | 5e+42 | 2.41 0.55 | 1.84 0.44 | - |
| J025-33 | 025.6822 | -33.4627 | 6.3373 | 5.650.22 | 5.310.24 | 3e+42 | 2.06 0.17 | 1.28 0.11 | - |
| P183+05 | 183.1124 | 05.0926 | 6.4386 | 7.150.32 | 10.530.36 | 6e+42 | 3.29 0.27 | 2.14 0.11 | - |
| J2318-3113 | 349.5765 | -31.2296 | 6.4429 | 1.590.14 | 0.790.17 | 2e+42 | 3.32 0.71 | 2.57 1.65 | - |
| P036+03 | 036.5078 | 03.0498 | 6.5405 | 3.380.09 | 5.770.12 | 3.8e+43 | 1.96 0.11 | 0.89 0.05 | 19.44 2.05 |
| P231-20 | 231.6577 | -20.8336 | 6.5869 | 3.530.30 | 9.990.34 | 1.1e+44 | 1.02 0.11 | 0.55 0.05 | 29.69 3.13 |
| P323+12 | 323.1382 | 12.2986 | 6.5872 | 1.450.19 | 0.530.27 | 2.01e+44 | 2.04 0.54 | 0.59 0.00 | 45.52 4.79 |
| J0305-3150 | 046.3205 | -31.8488 | 6.6139 | 5.900.36 | 12.300.44 | 8e+42 | 2.70 0.22 | 1.60 0.11 | 12.60 1.33 |
In this work we examine QSOs observed with high-resolution alma configurations to compare and contrast the bright, central emission from the host galaxies (the core-like component reported in Novak et al. 2020 and examined in Venemans et al. 2020) to observations of the same QSOs with muse as part of the requiem survey (Farina et al., 2019) which have reported the presence/absence of Ly halos (tracing gaseous reservoirs) down to surface-brightness limits of erg s-1 cm-2 arcsec-2 over a 1 arcsec2 aperture. This paper proceeds as follows: in Section 2 we describe the observations and datasets compiled for this work; in Section 3 we present [Cii] and Ly channel maps and moment maps of our targets. In Section 4 we discuss our findings and comment on our targets individually. Finally, in Section 5 we summarise our findings.
Throughout this work we assume a CDM cosmology with , and H km s-1 Mpc-1. In this cosmology, 1 ″ = 5.71 pkpc at . All velocities, wavelengths and frequencies refer to vacuum values.
2 Observations and Sample Selection
2.1 Sample Selection
We draw our sample from a total of 18 sources that represent the overlap between the high–resolution alma [Cii] imaging survey published in Venemans et al. (2020) and the muse requiem survey (Farina et al., 2019). We list the full sample in Table 1, before defining a subset where a Ly halo detection has been made in Drake et al. (2019) or Farina et al. (2019). The sample with robust detections in both datasets amounts to 8 objects.
2.2 MUSE Data
muse data cubes are taken from the requiem survey (Farina et al., 2019), in order to homogenise the reduction process across all objects. Farina et al. (2019) define the Ly halo as a 3D structure of connected voxels of significance 2 after smoothing the PSF–subtracted datacube in the spatial and spectral directions with kernels of ″and Å. The study also provide moment maps for the Ly halos, with a velocity zero point that refers to the flux–weighted centroid of the voxels included in the mask. For the purpose of this work, we require moment maps centred on systemic velocity, and so we utilise additional data products released with requiem to construct our own maps as described in Section 3.1.
2.3 ALMA Data
alma data cubes of the continuum–subtracted [CII] emission line are taken from Decarli et al. (2017), Venemans et al. (2019) and Venemans et al. (2020). The data have been re–imaged with natural weighting to maximise sensitivity to any extended emission, and sampled with a velocity width of 30MHz per channel to match the velocity width of a single layer of the (slightly oversampled) muse datacube ( km s-1). All data cubes were observed in the local standard of rest (LSRK) velocity frame.
3 Results
3.1 Moment Maps
As we require the velocity fields (moment 1) to describe ionised gas motion relative to the systemic velocity of the host galaxy (defined as the [Cii] redshift), we utilise two data-products released with the requiem survey; the PSF-subtracted datacubes, and the 3D mask cubes to reconstruct the 3D Ly halo as defined in Farina et al. (2019). With these cubes we then re-compute moment maps relative to systemic velocity, using the method applied in Drake et al. (2020).
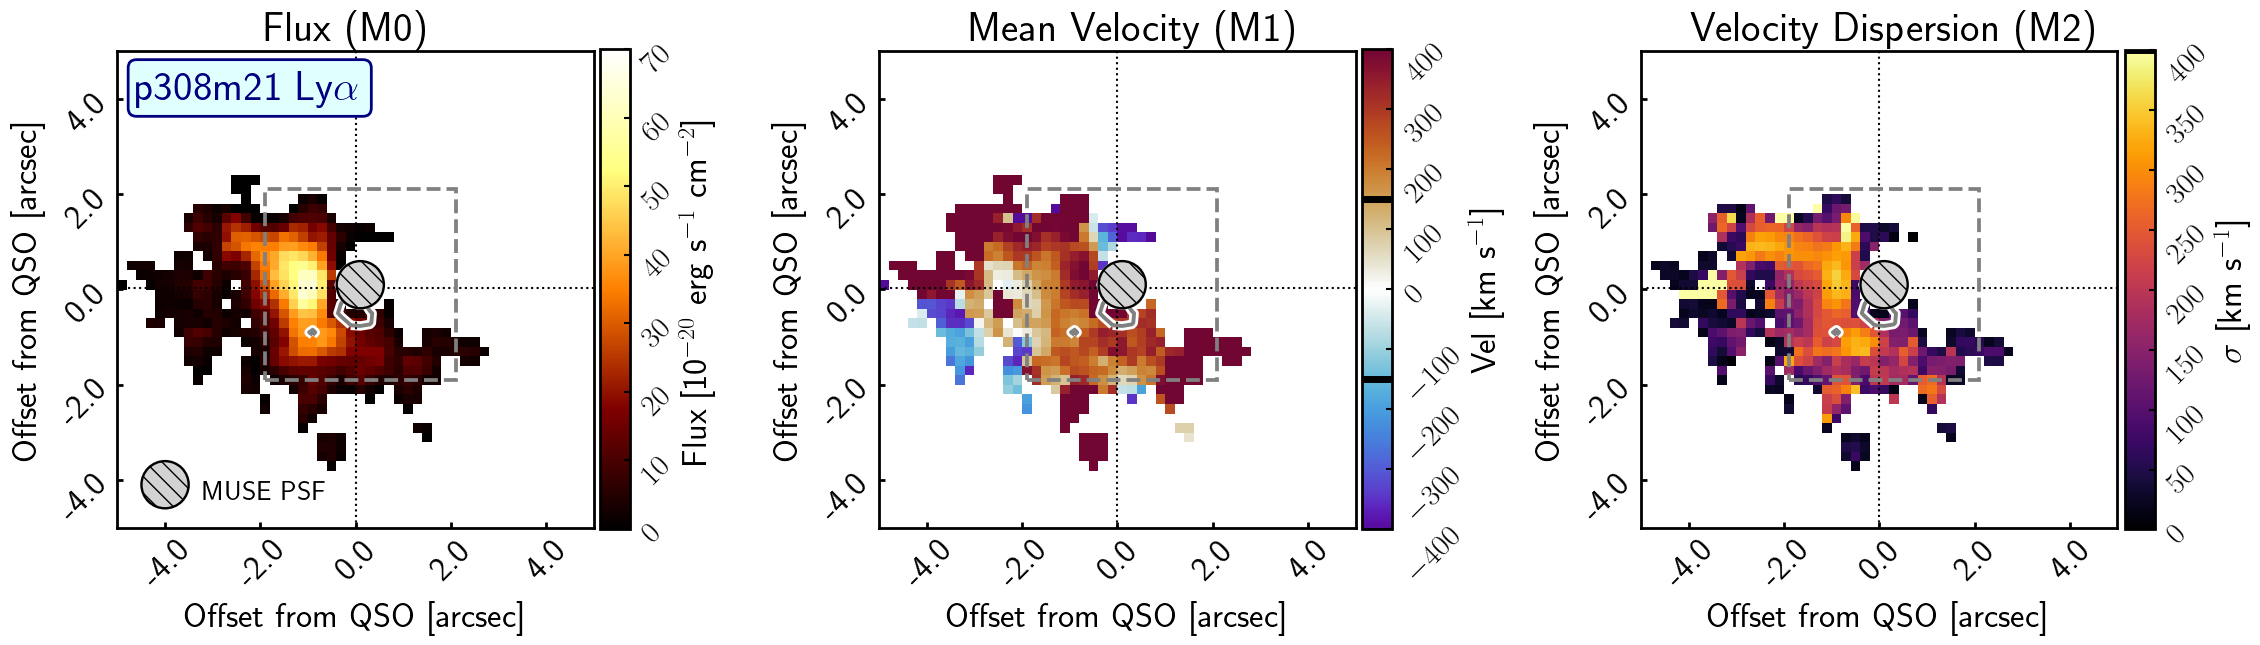
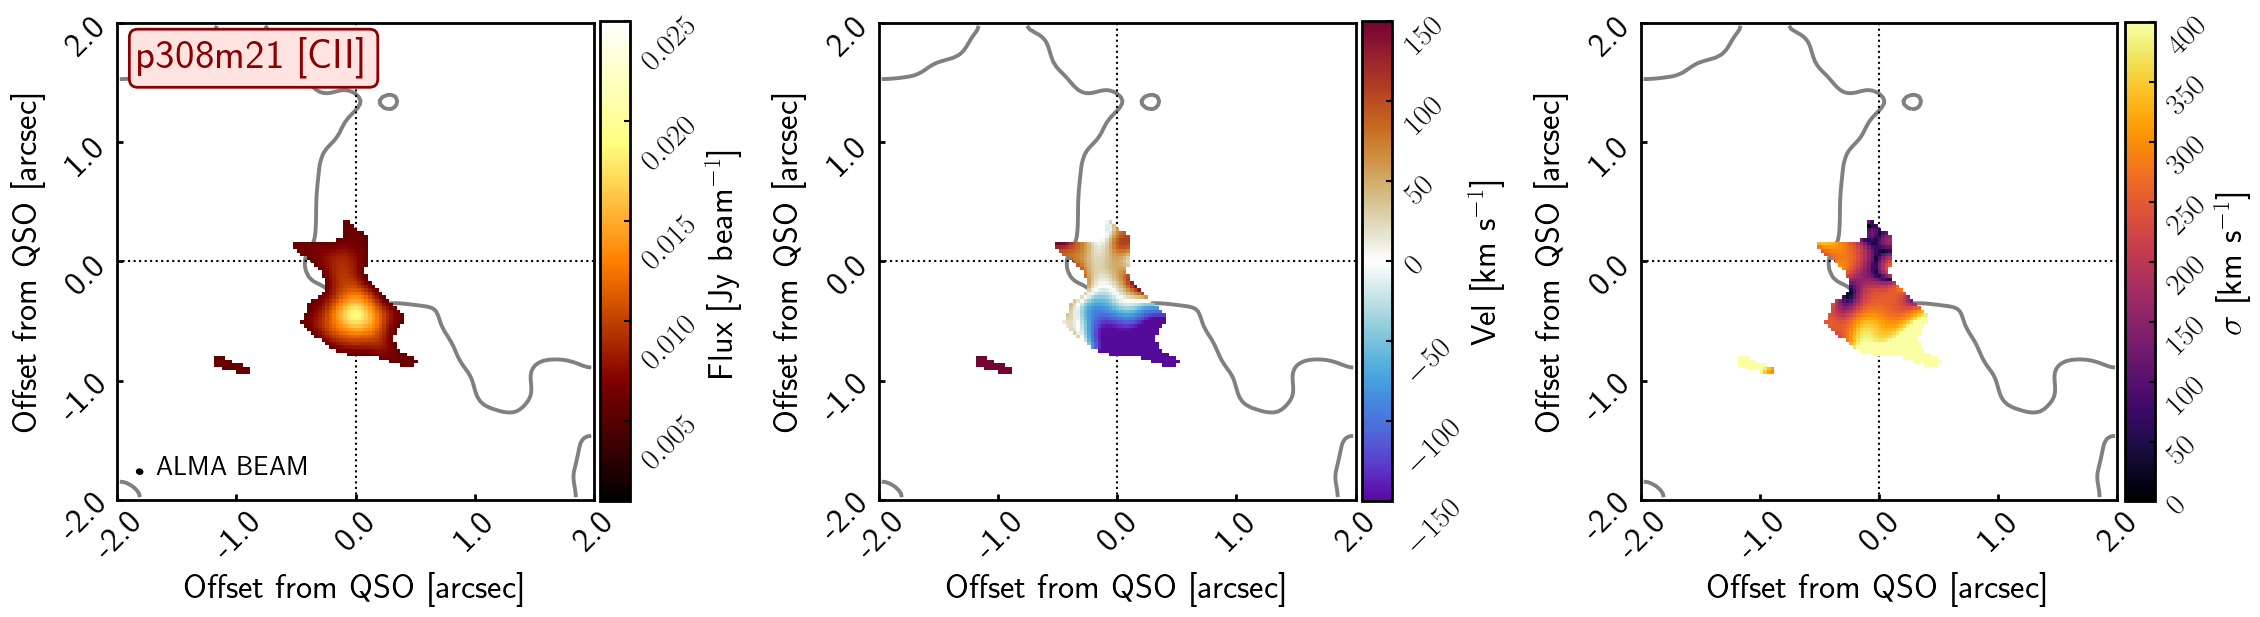
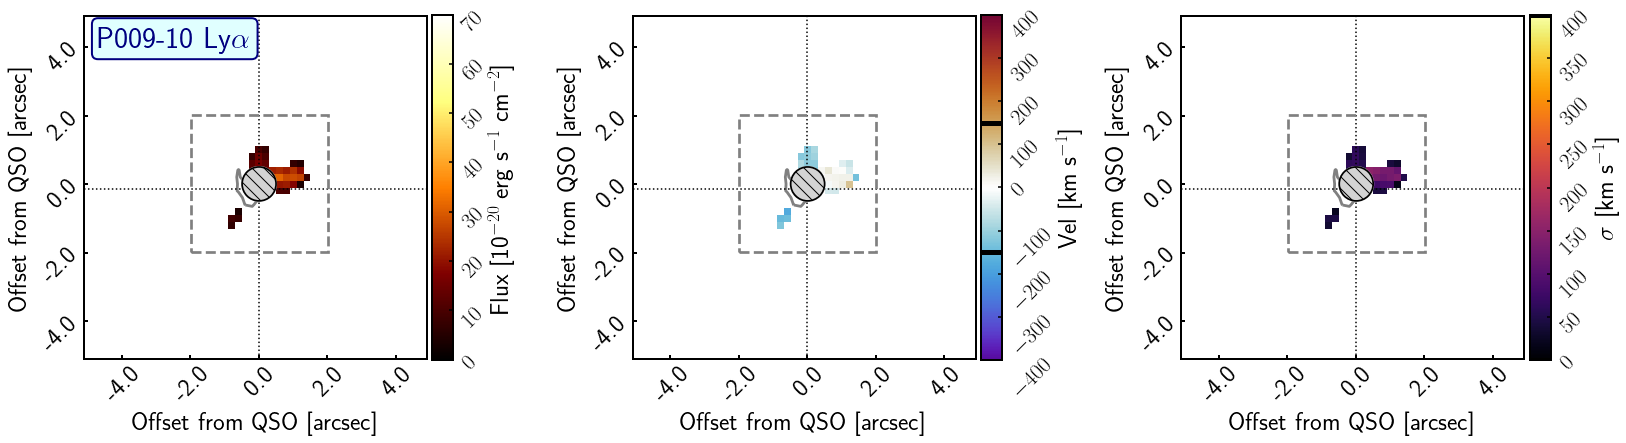
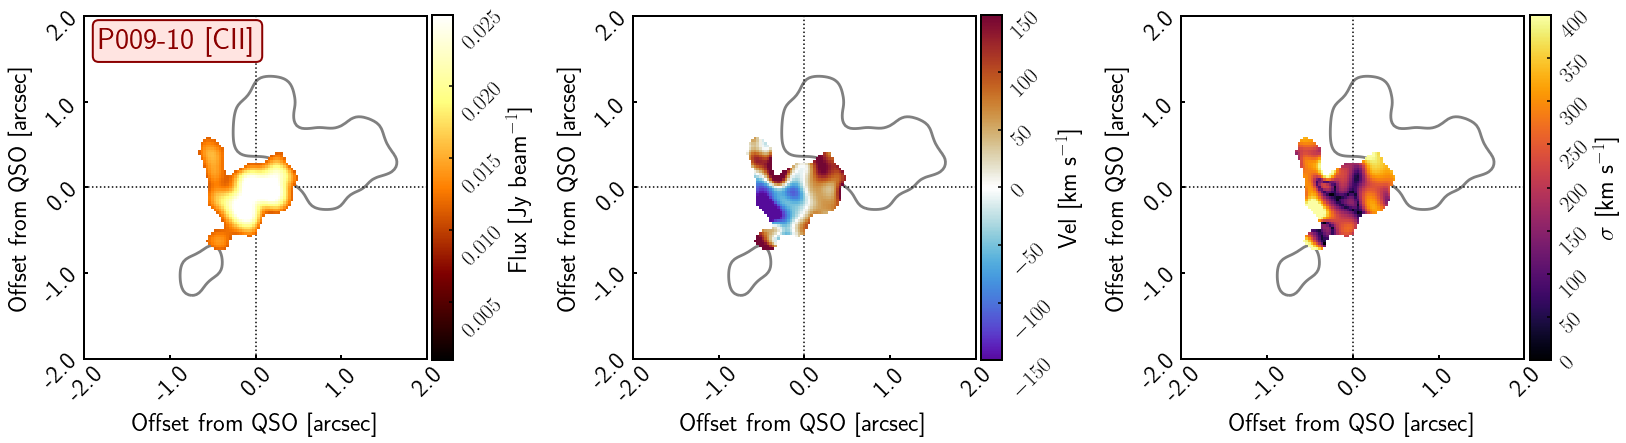
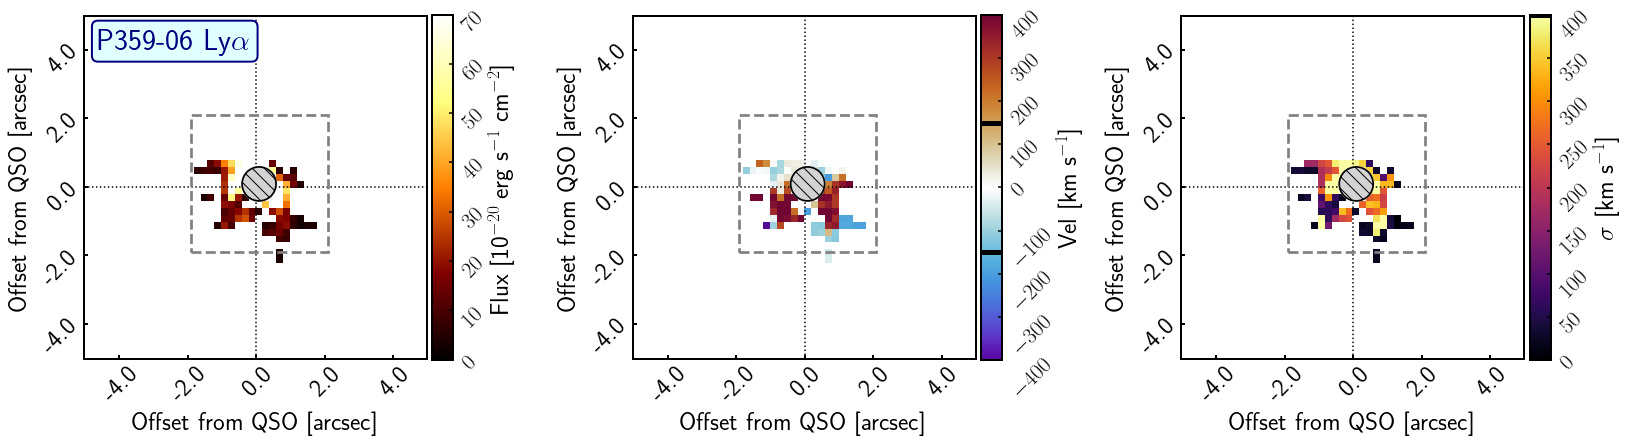
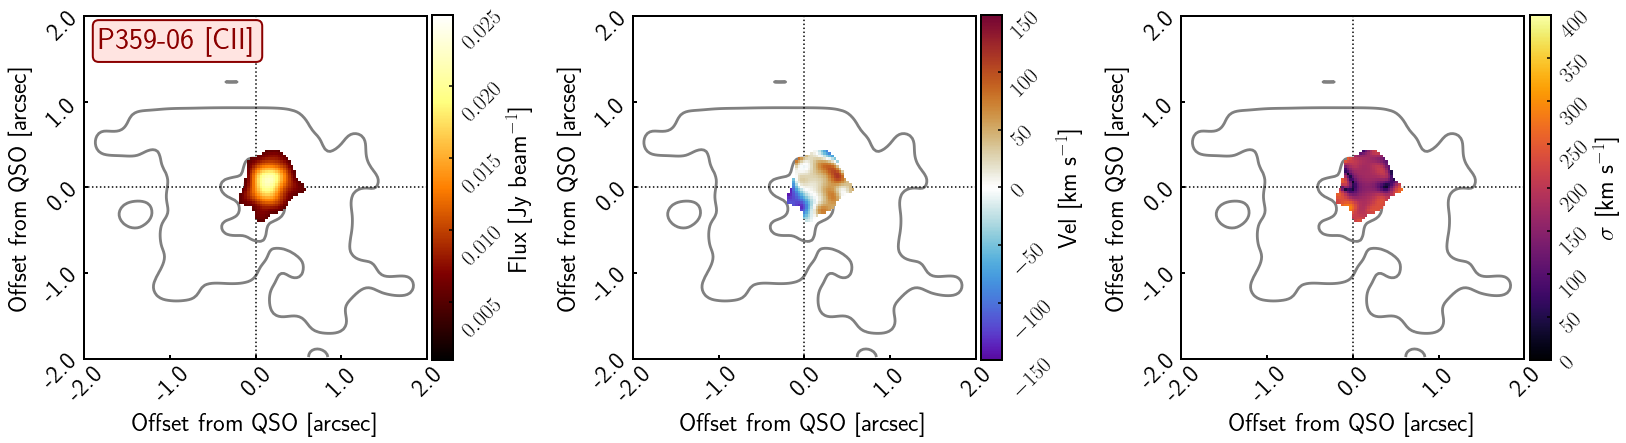
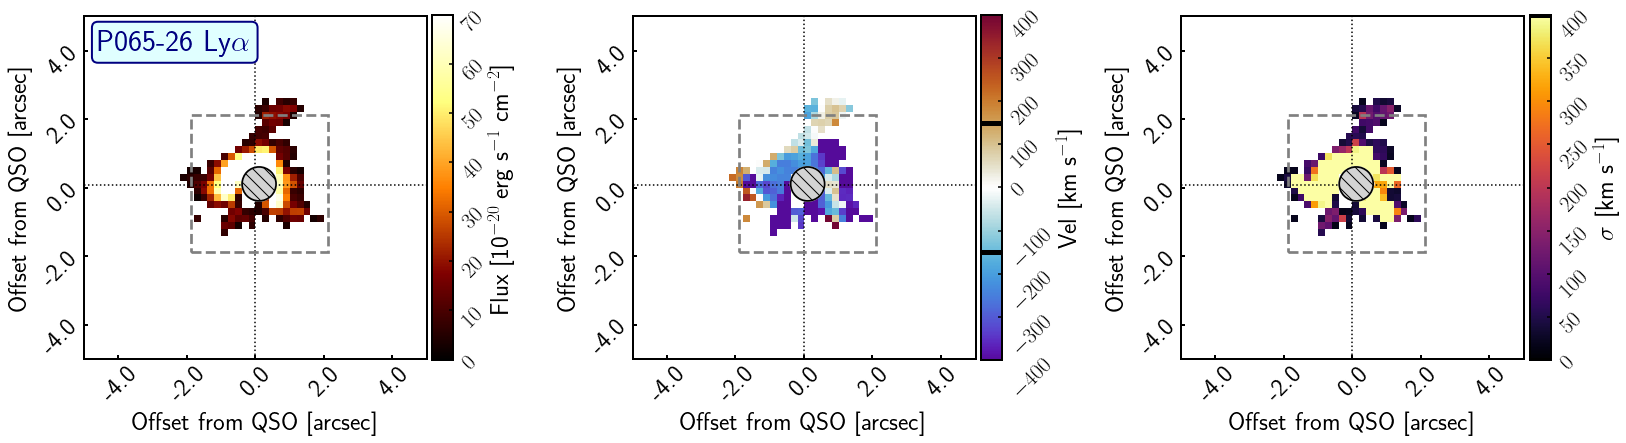
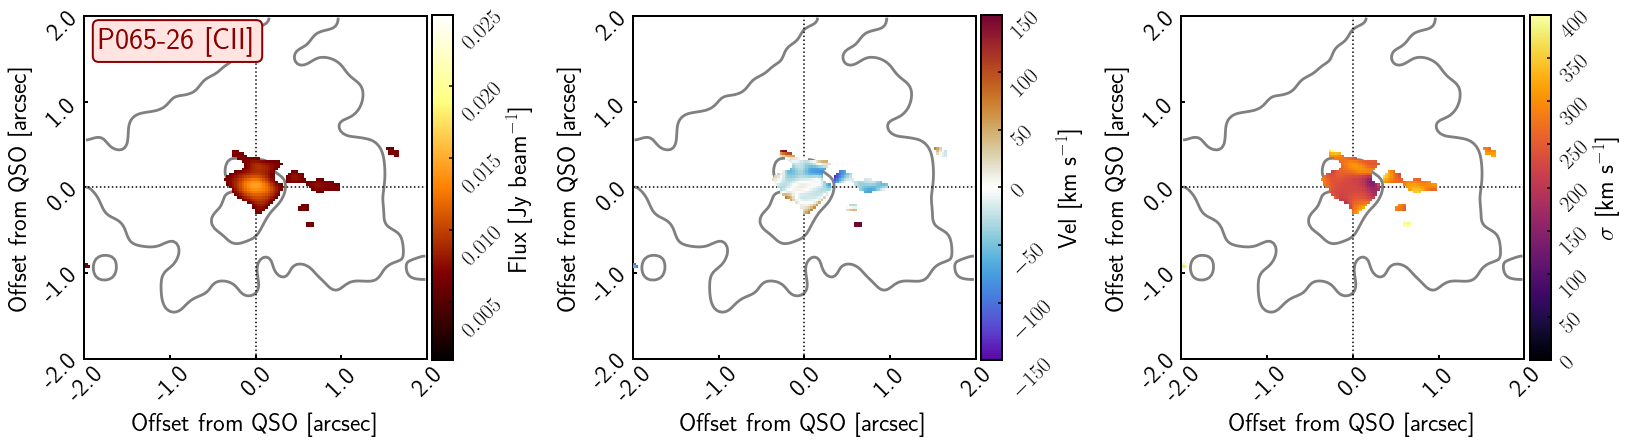
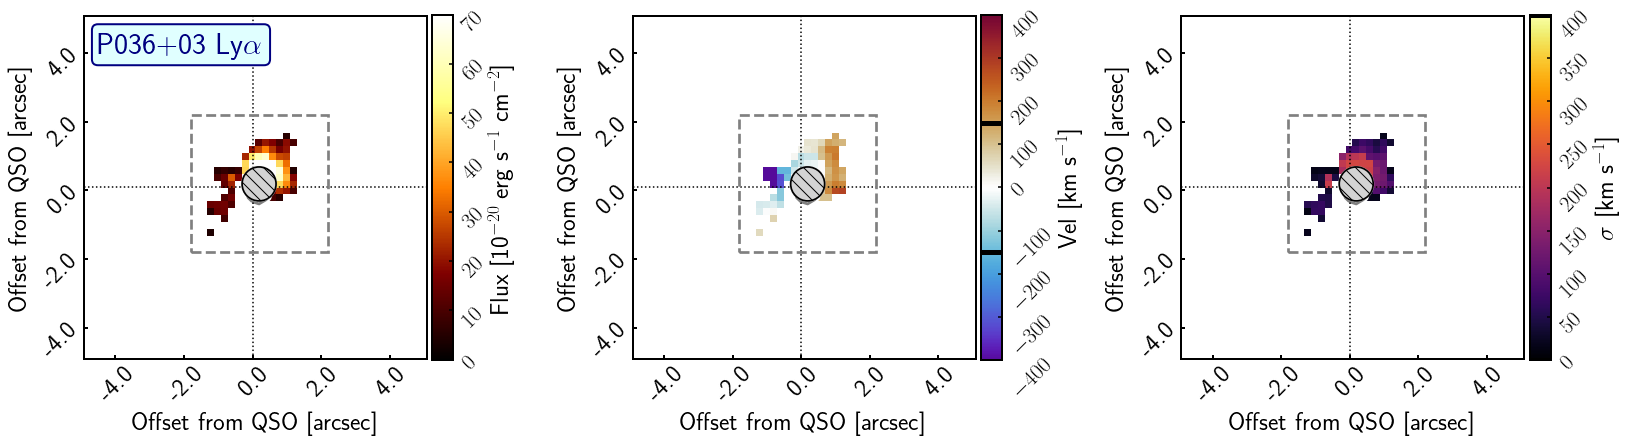
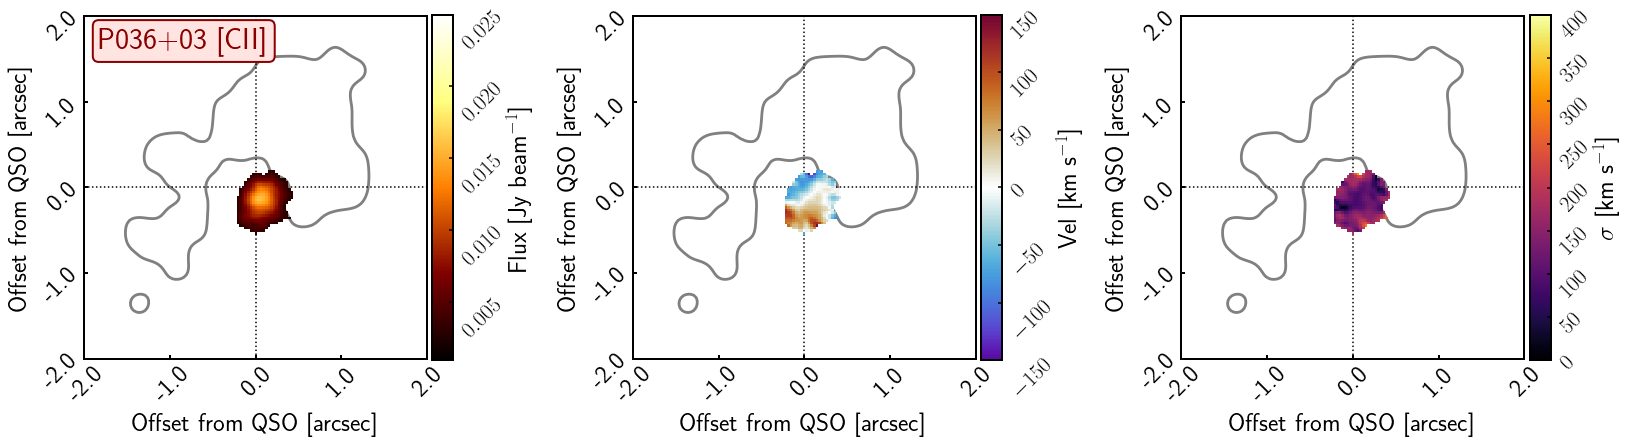
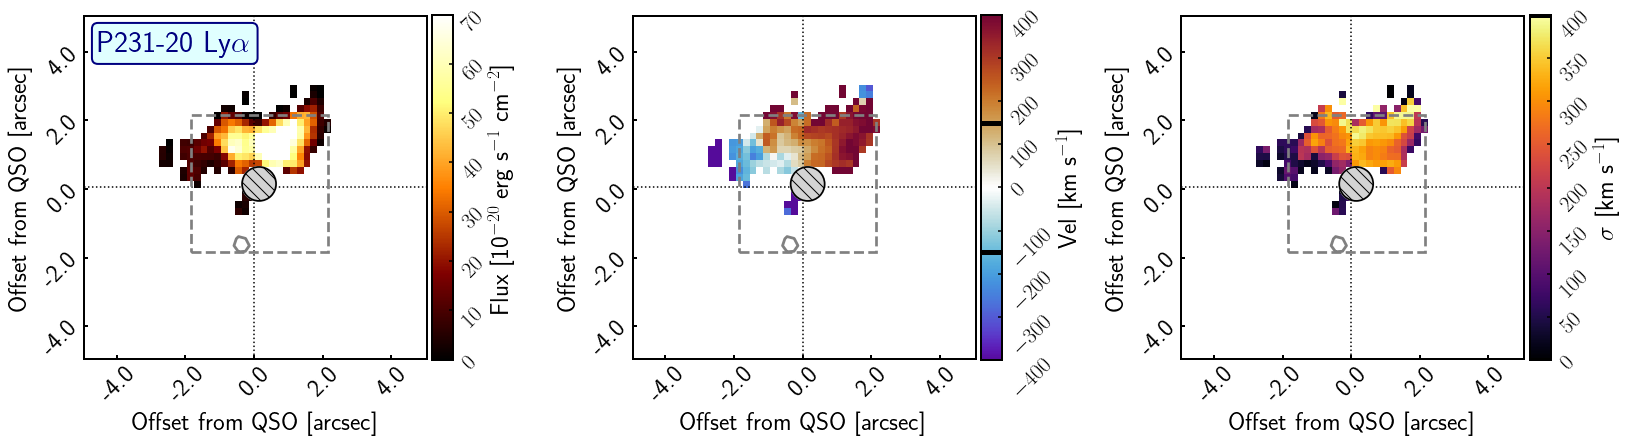
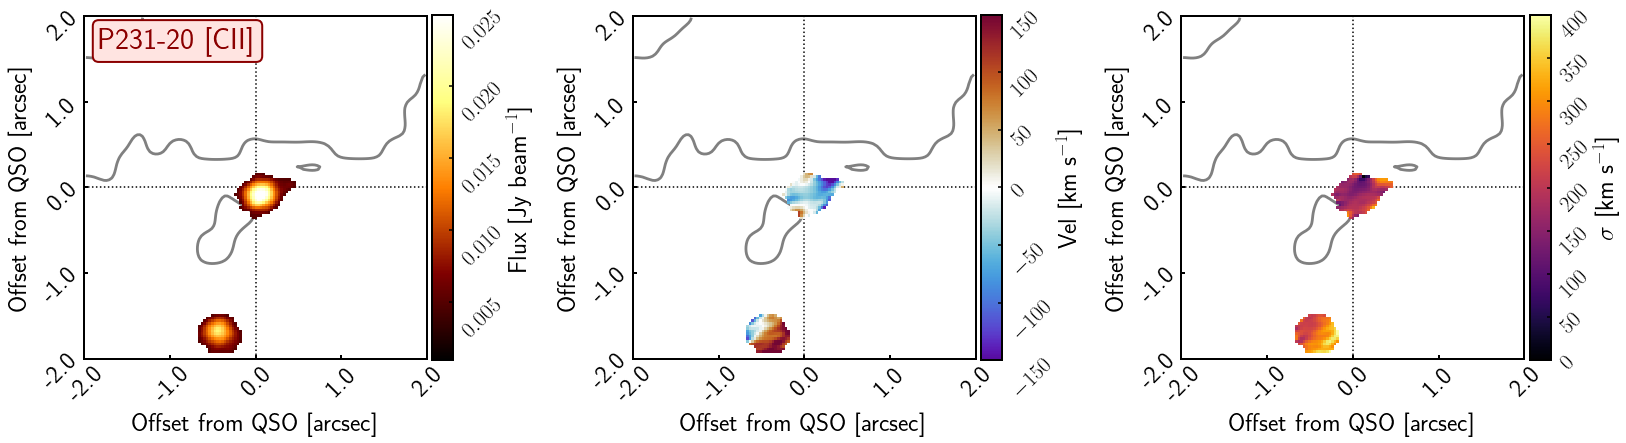
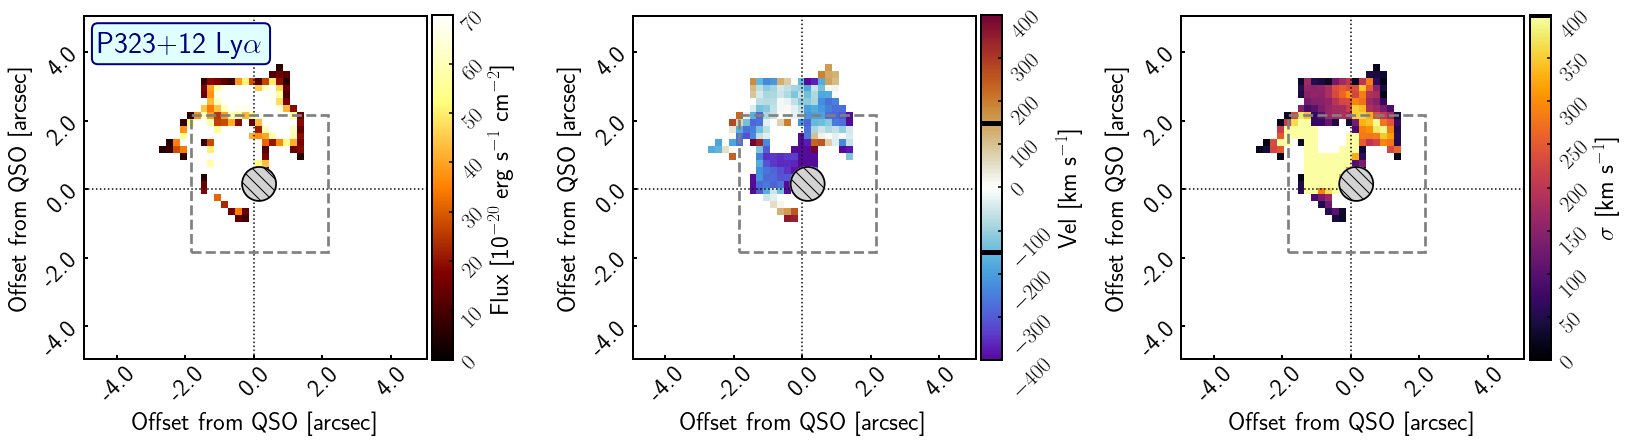
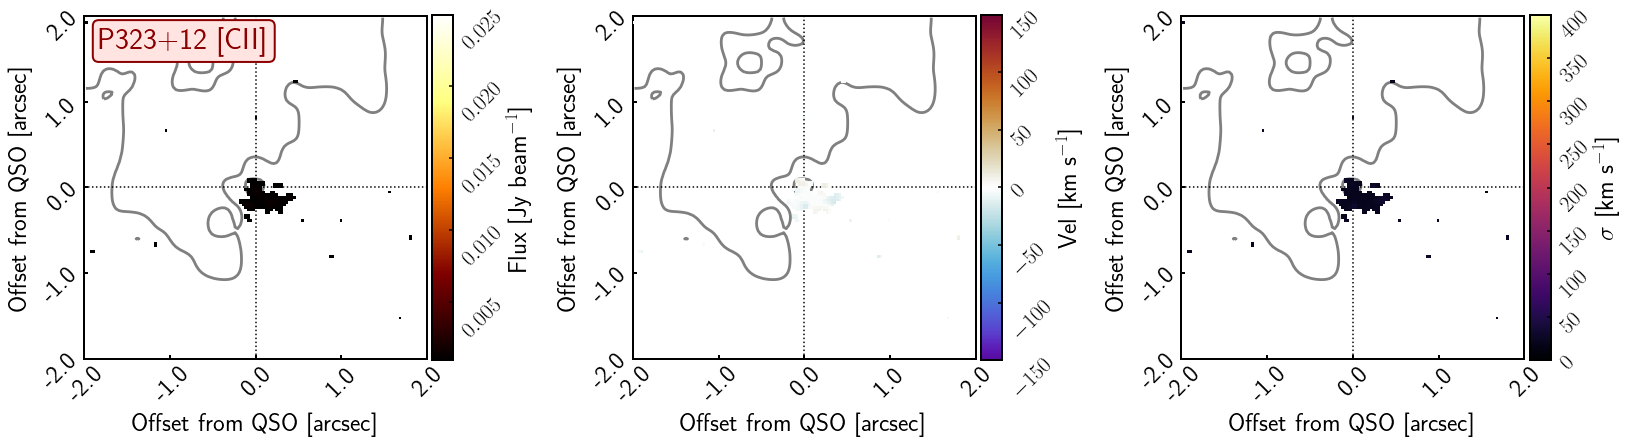
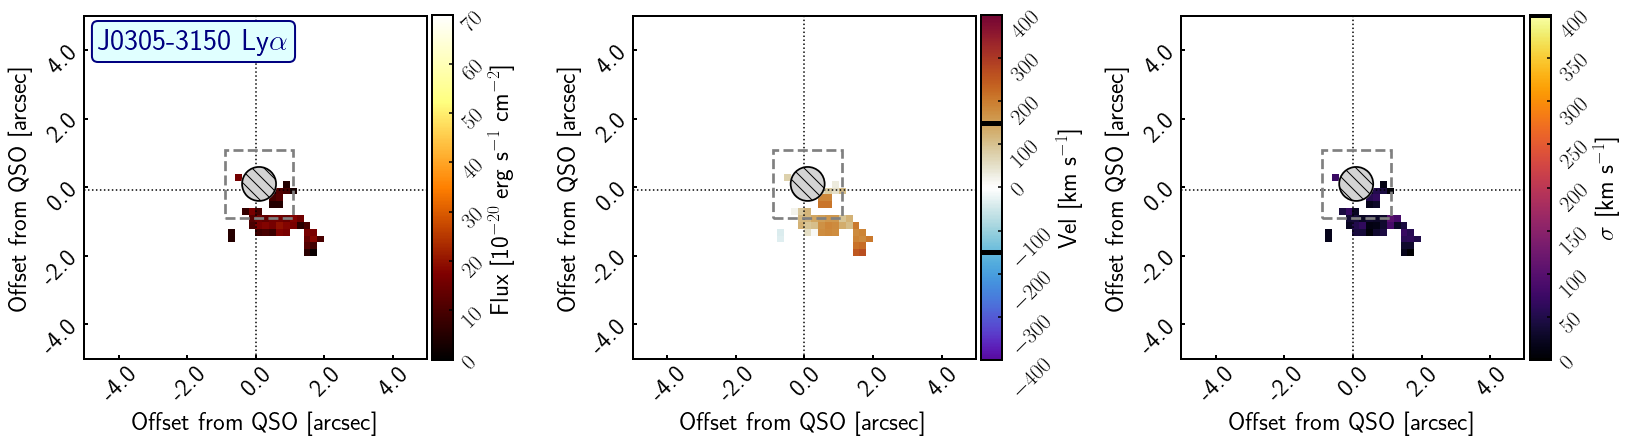
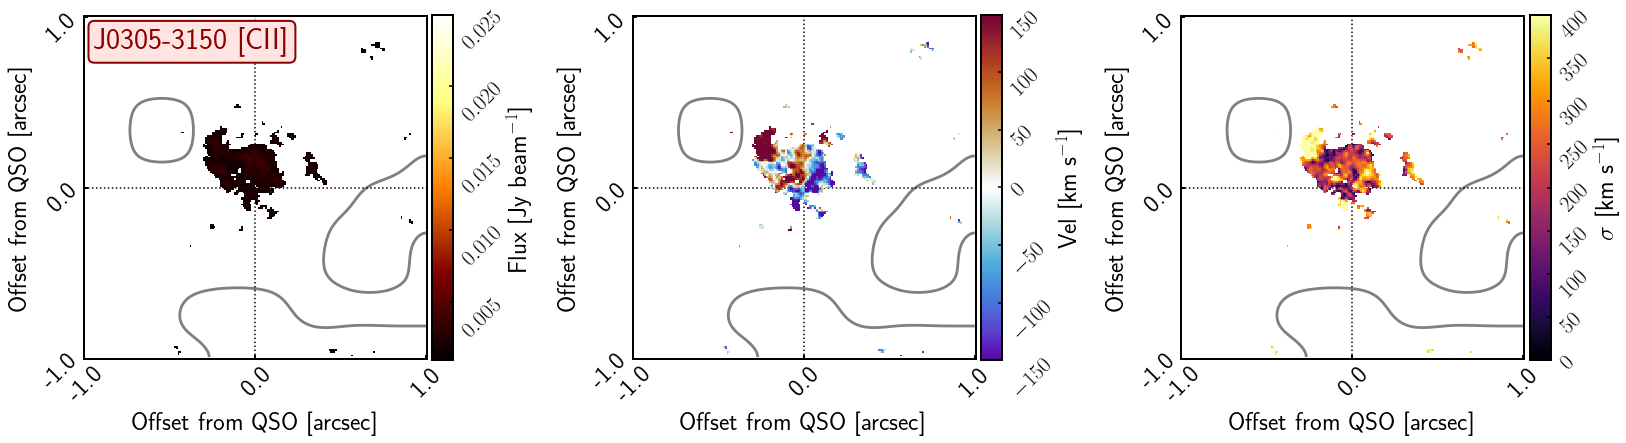
In Figure 1 we show an example of the Ly and [Cii] moment maps, for P. Maps for the full sample can be found in the figure set available in the online journal. The three columns of panels present the zeroth moment (total flux), the first moment (velocity field) and the second moment (a measure of the velocity dispersion), respectively. The upper row of panels focuses on the Ly halo in cutouts of 10″ a side, while the lower panels present [Cii] emission originating in the quasar host galaxy in panels which zoom–in to 4″ a side.
An immediate take-away from this comparison is the relative sizes of the extended halo gas traced by Ly, and the more compact [Cii] emission which traces the host galaxy. Typically, the extent of the [Cii] emission is encompassed within the region of 1″diameter, which corresponds to the region of the Ly emission that is subject to complex residuals due to the PSF–subtraction (here, this region is masked on the Ly images). We will return to size comparison in Section 4.1 where measurements for the full sample will be considered.
The central columns of Figure 1 depicting the velocity fields of the emission demonstrate a general feature of the data: There is no obvious coherence between the velocity field of the host galaxy, and that of the extended ionised gas for any of the 8 objects. We will discuss this further in Section 4.2. We also note that a comparison of the general velocity shifts is presented in section 5.1.1. and figure 5 of Farina et al. (2019).
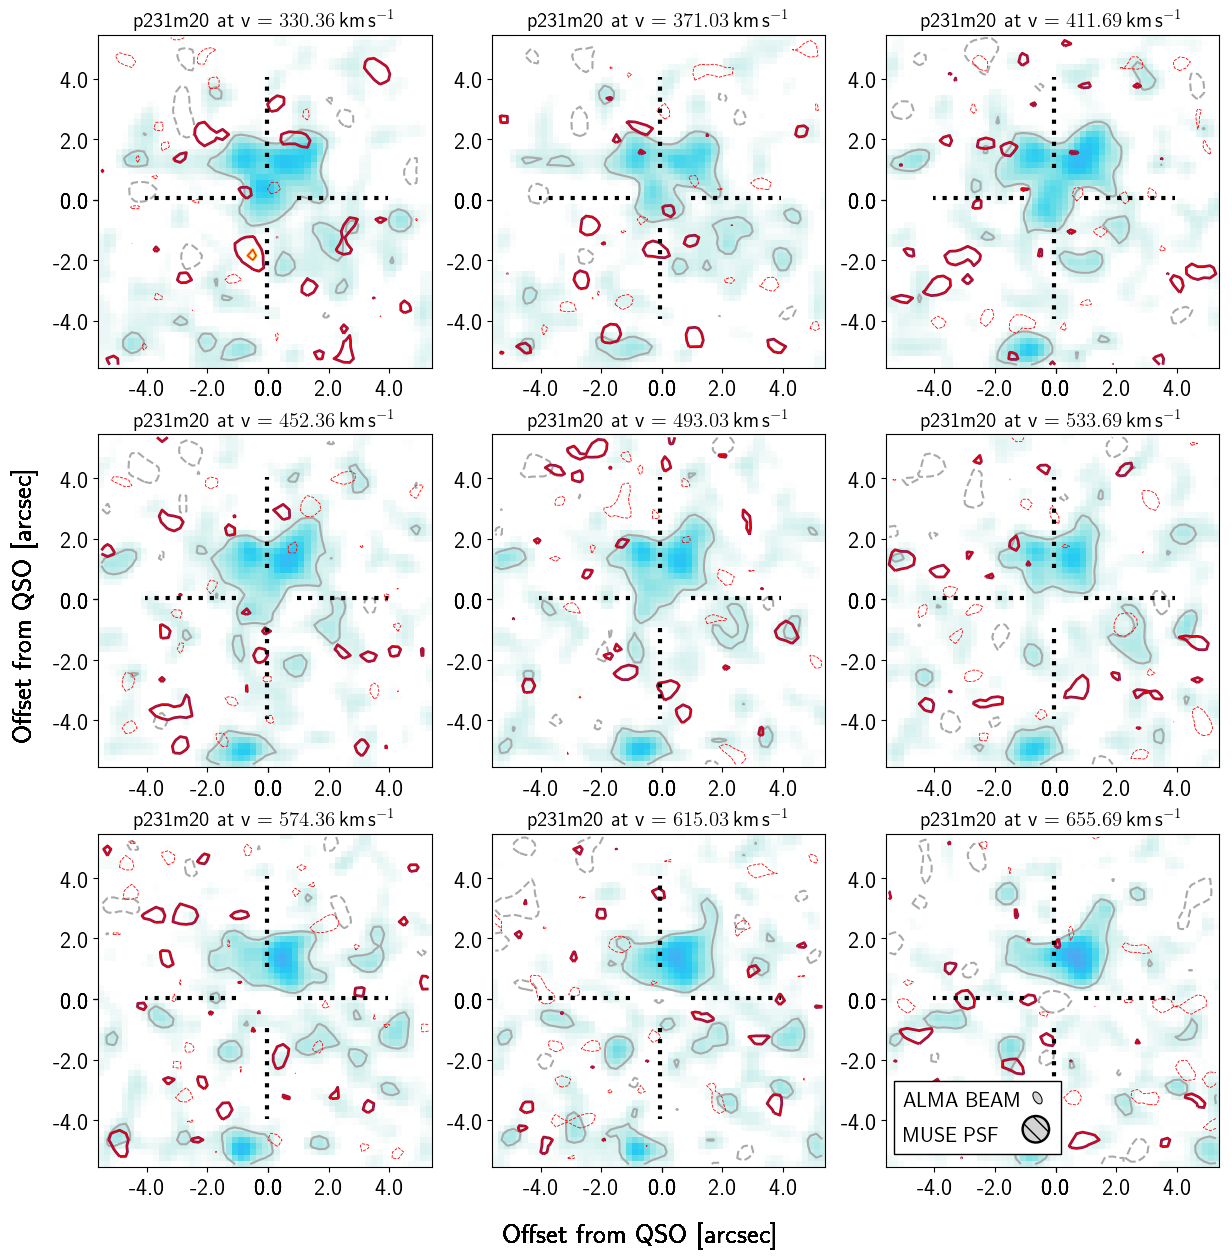
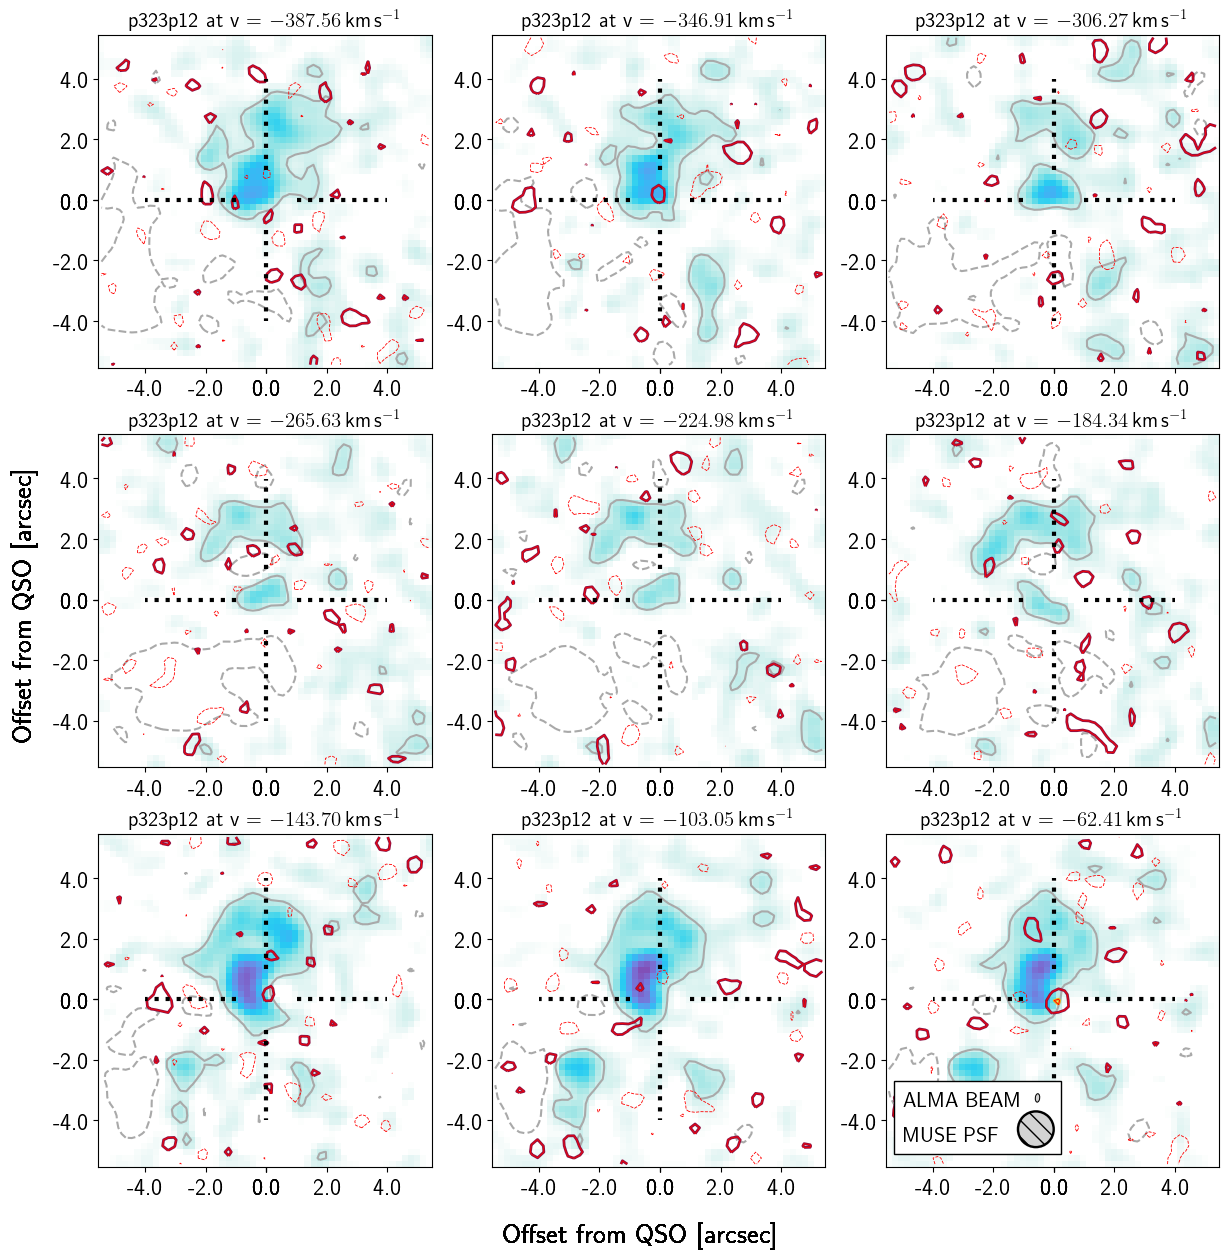
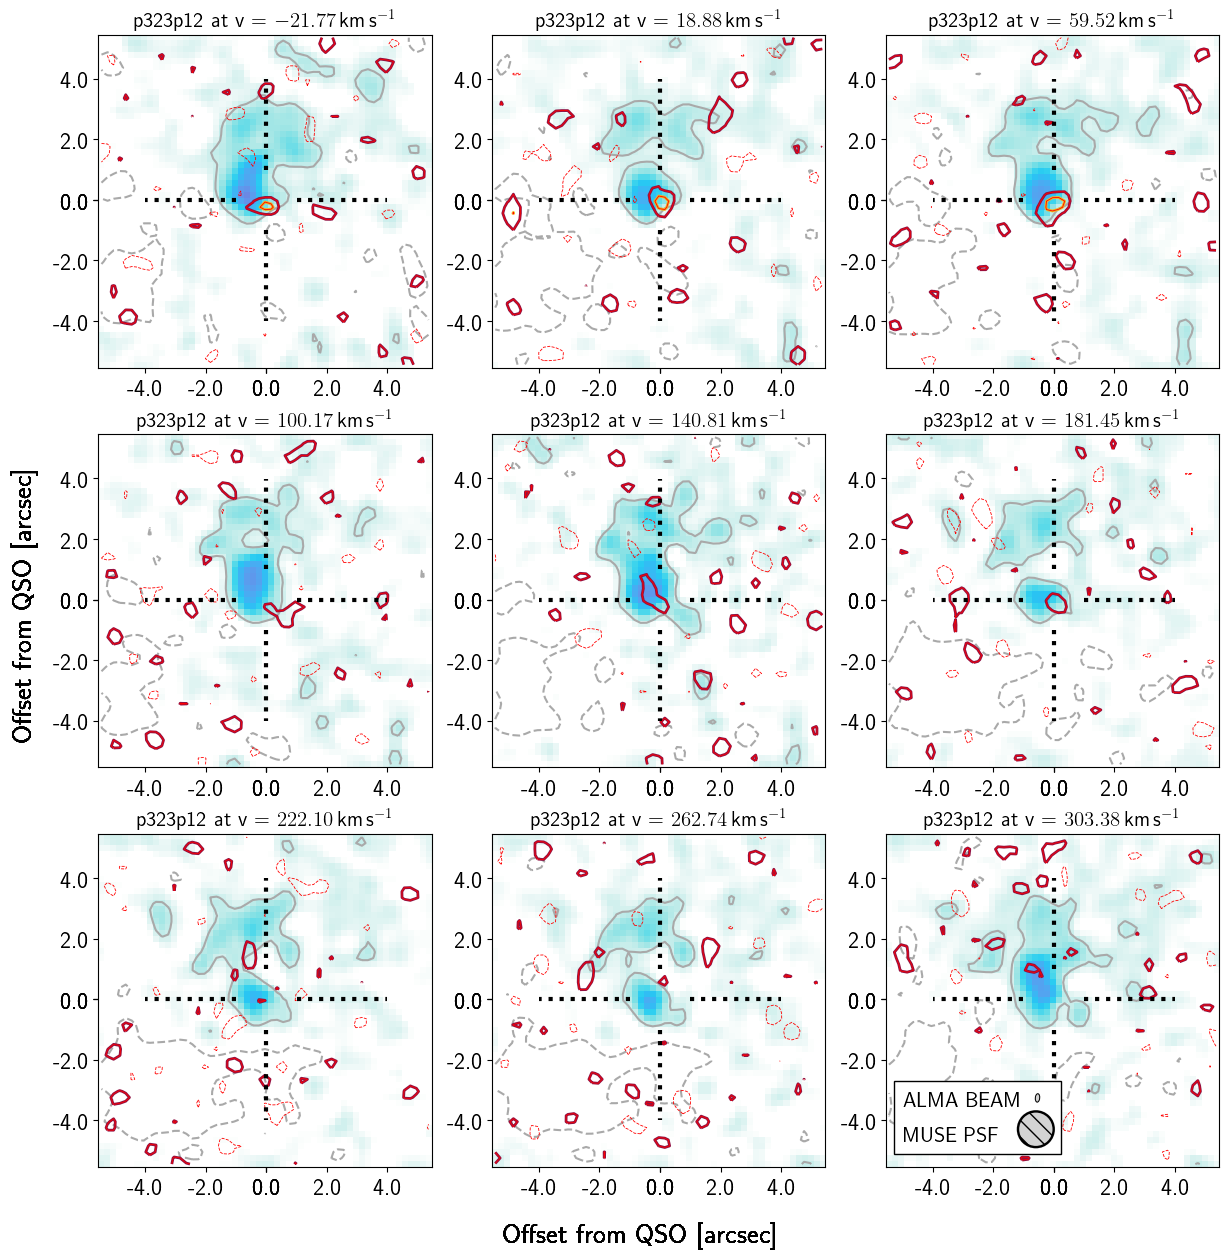
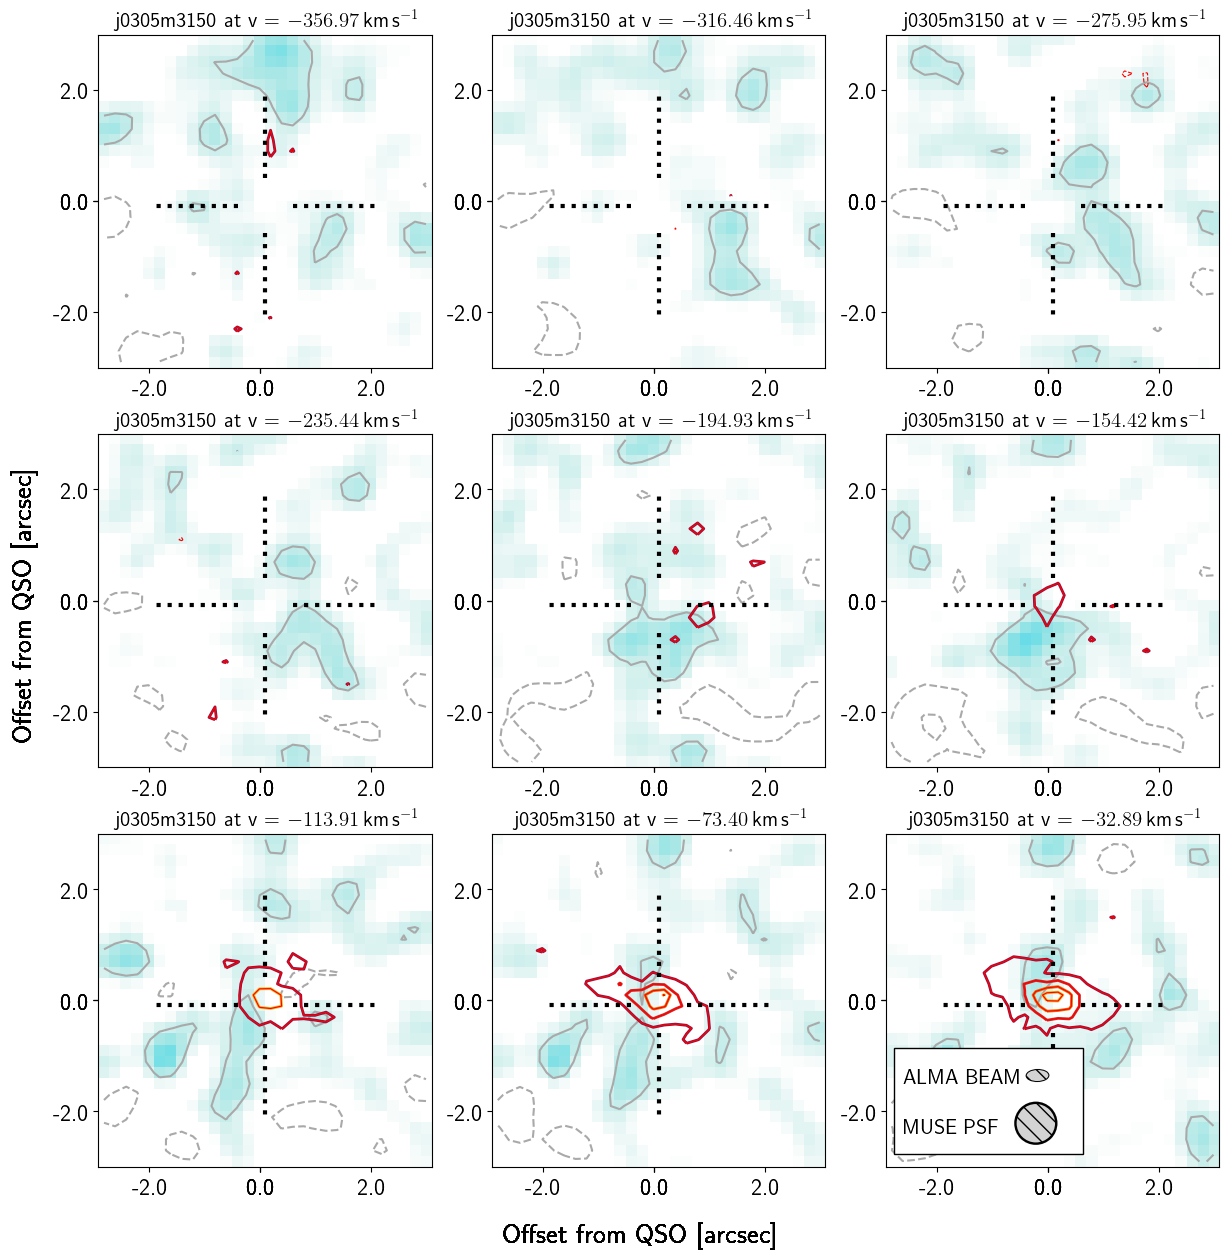
3.2 Channel Maps
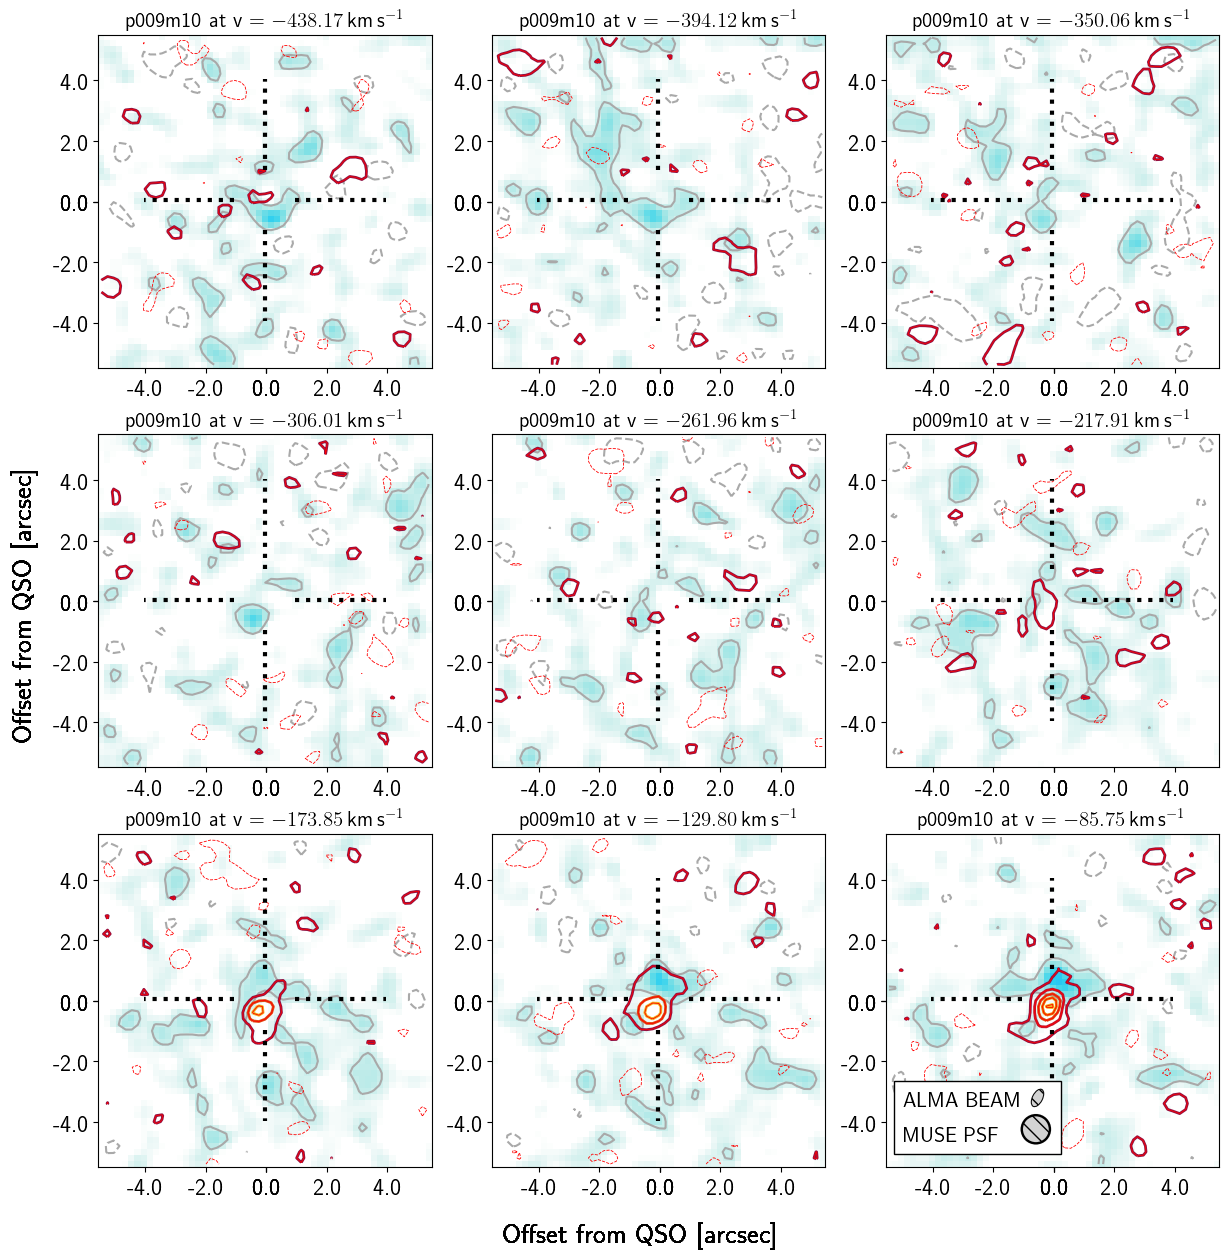
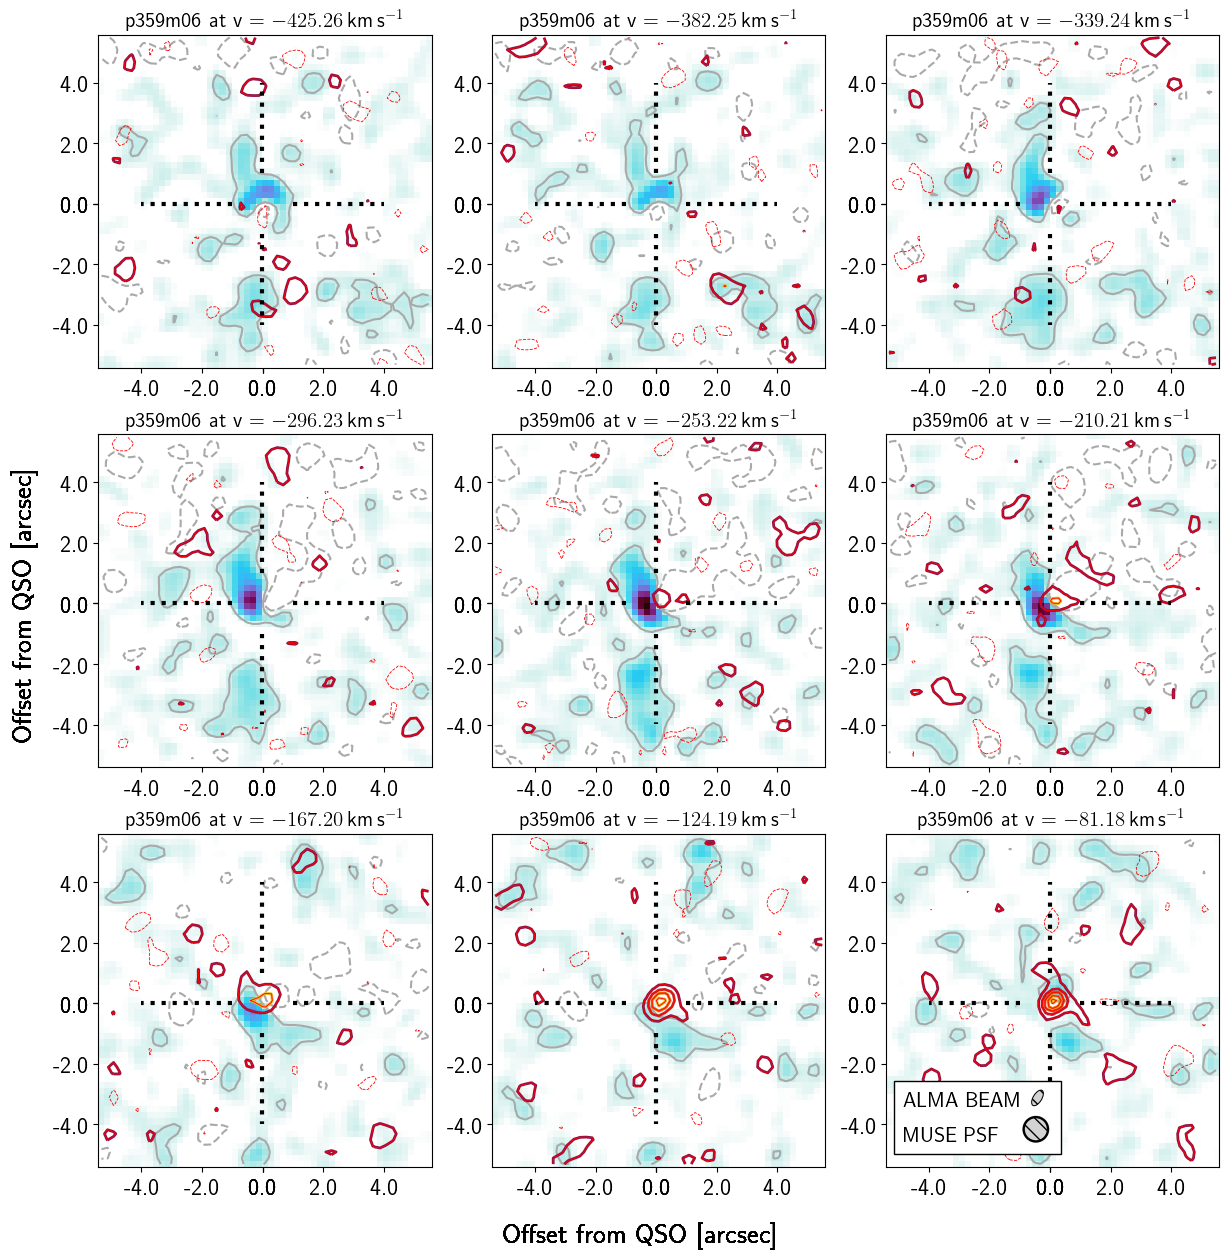
In addition to the moment analysis of gas kinematics for each object, we include in the Appendix a series of channel maps comparing Ly and [Cii] emission for each QSO. In every case, the Ly extends over a much greater velocity range than the more compact [Cii] emission, and the maps emphasise again the extent of the gaseous ionised halo gas compared to the cold gas in the host galaxy.
4 Discussion
4.1 Size Comparison
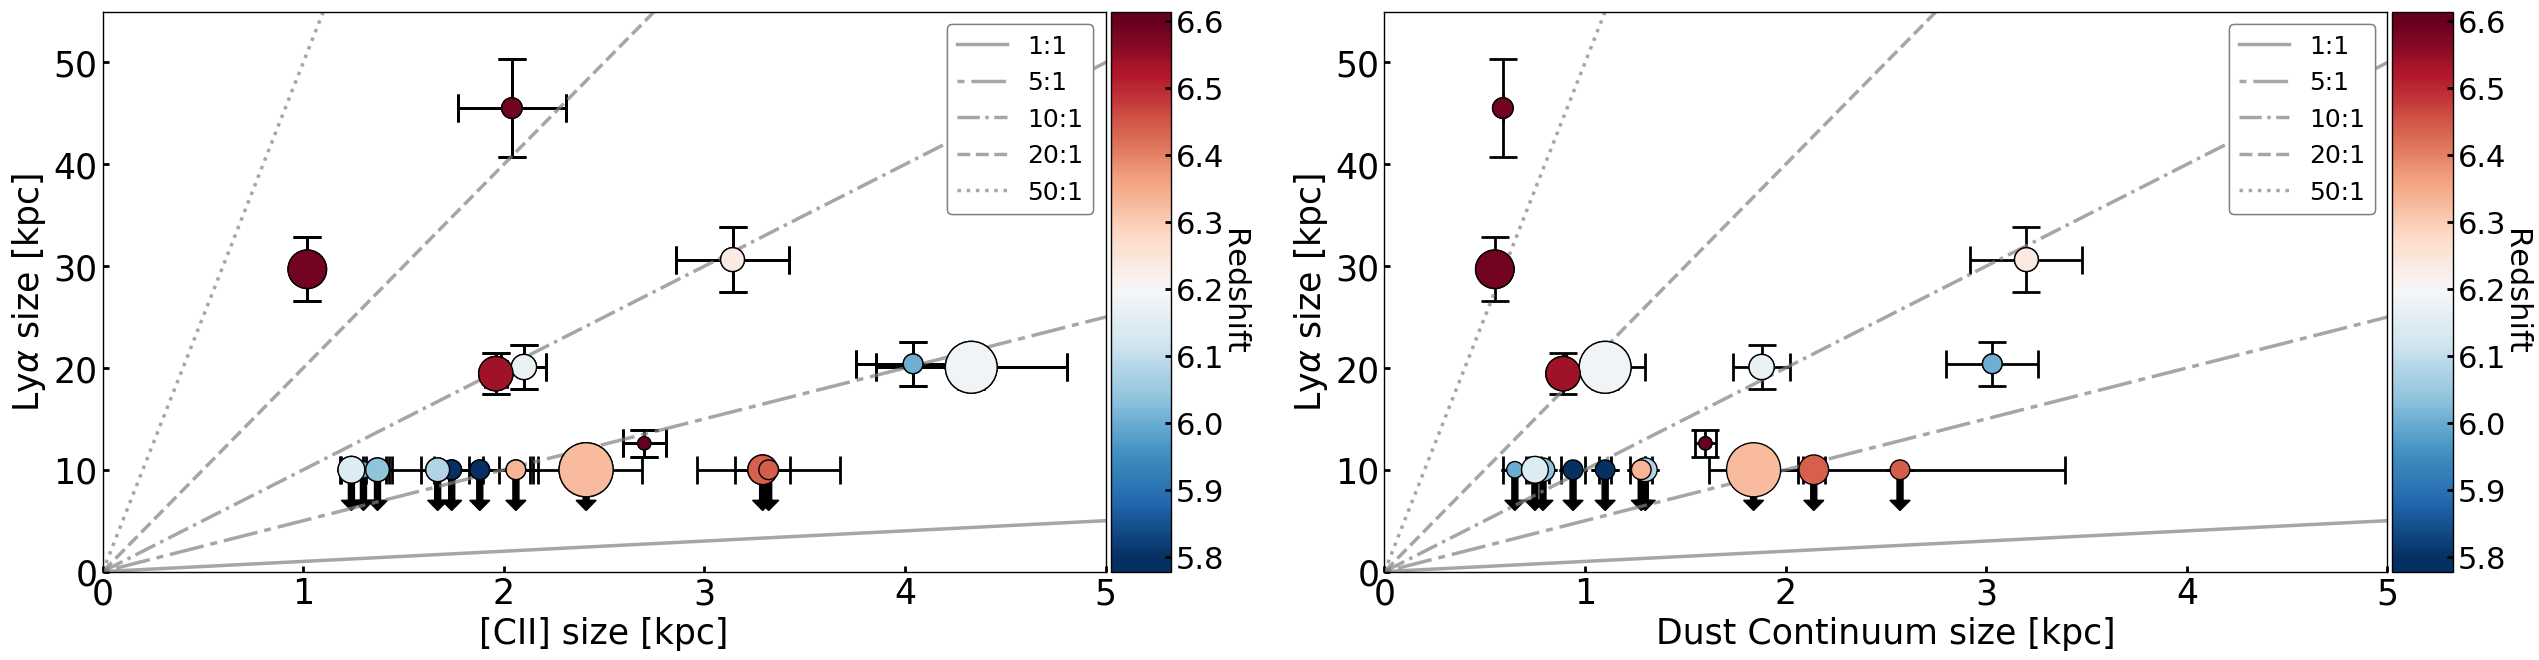
In Figure 2 we compare the sizes of the [Cii] and FIR continuum emission to that of the Ly halo. The adopted size measurements are listed in Table 1. For the Ly size we take the surface–brightness–dimming corrected size from Farina et al. (2019) (their method 4) for consistency of method across all objects and redshifts. For the [Cii] and FIR sizes we take values from Venemans et al. (2020), where sizes from the casa task imfit are provided using a 2D fit. In this work we take the geometric average of these two measurements as the effective [Cii] or FIR extent.
The two panels show on the x-axes the [Cii] size (left–hand side) and FIR dust continuum (right–hand size) against the Ly extend on the y–axes. As was evident from Figure 1 the Ly halos are significantly more extended than the [Cii] (and also dust continuum) emission. This is because the [Cii] emission primarily traces photo–dominated regions within the host galaxy, meanwhile, the extended Ly emission traces the extended ionized gas surrounding the central host galaxy.
Ly halo sizes fall anywhere between and times larger than the [Cii] sizes. P, at shows the smallest Ly halo, times larger than its extended [Cii] which stretches pkpc. At the other end of the scale, P, at has a Ly halo extending times further than its compact [Cii] emission which is measured at pkpc. In the right-hand panel we confirm that the FIR (tracing the dust continuum) is smaller than the [Cii] size (e.g. see Novak et al. (2020) for a detailed analysis of [Cii] and FIR dust continuum sizes). The Ly halos range between and times larger than the dust continuum. Much as for the [Cii] comparison, P exhibits the lowest size ratio of , and again, P exhibits the largest size ratio of . Interestingly, in the FIR, P, moves up the ranking, and exhibits the second largest size ratio . Additional information is encoded in the figure, using QSO redshift to colour the data points, and scaling the size of each point by the QSO’s SMBH mass (taken from Schindler et al. 2020). No correlation is seen between MBH and any of the size measures (Ly, [Cii], or FIR), nor with the ratio of Ly halo size to host-galaxy tracer size. A Kendall’s rank correlation test (accounting for upper limits) shows that there is no evidence for a correlation between the [CII]/FIR and Ly halo sizes.
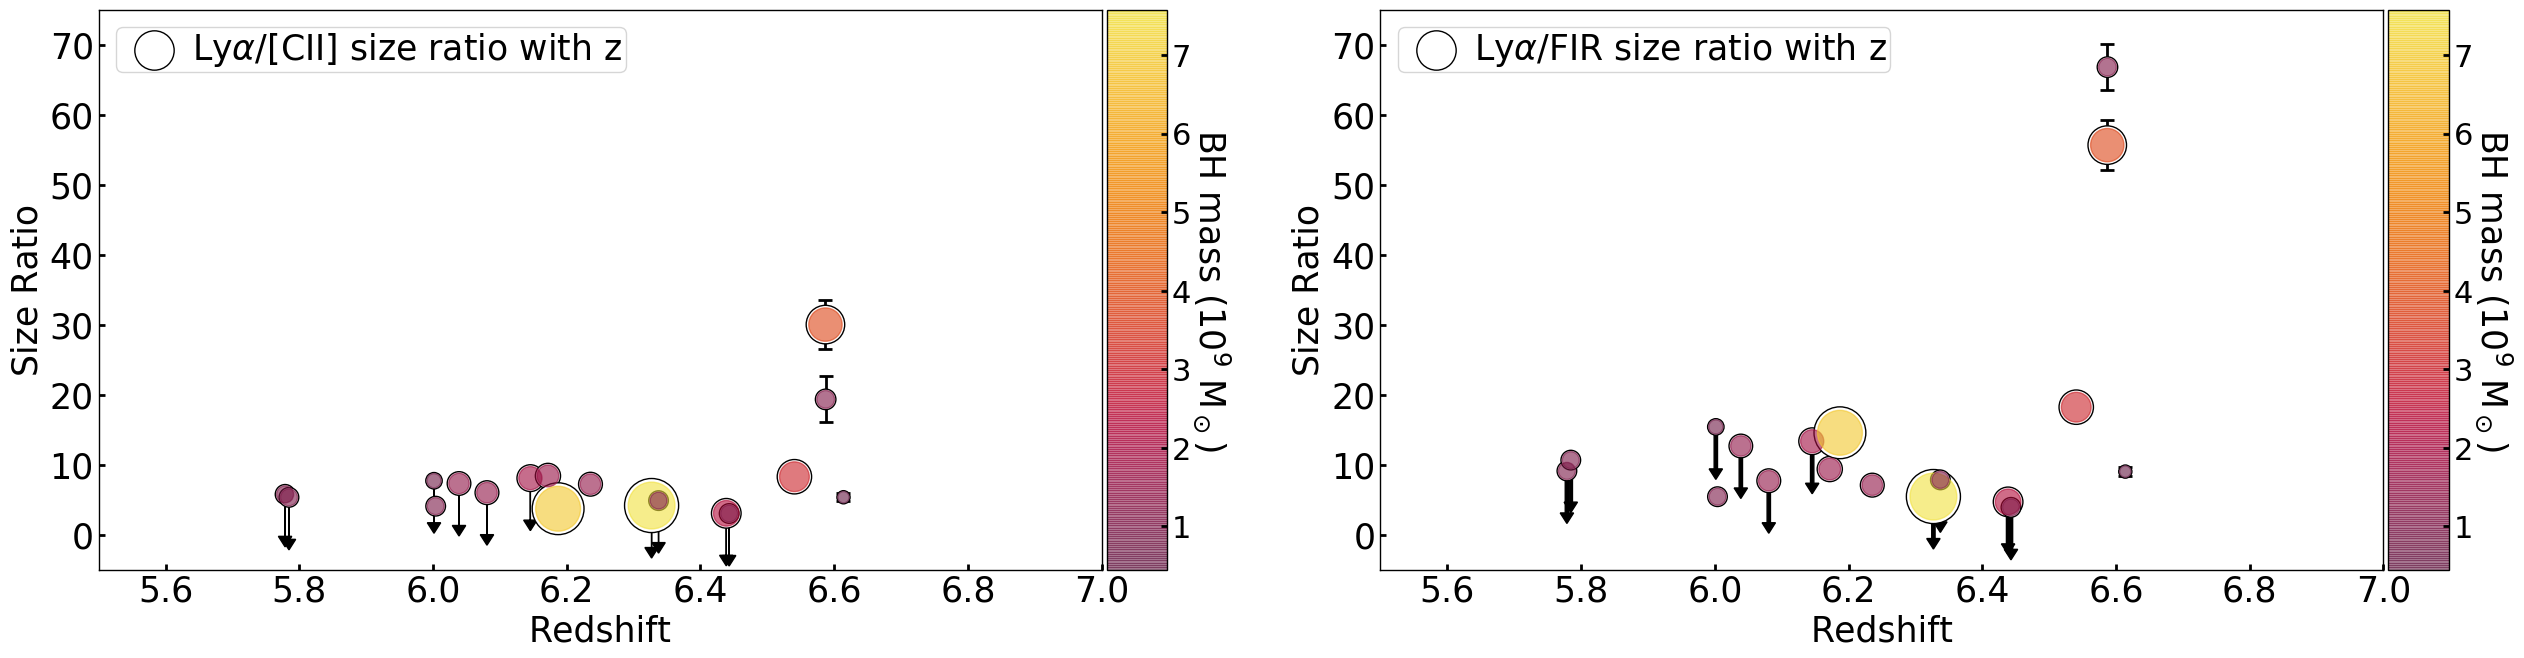
In Figure 3 we consider the ratio of sizes between the Ly halo and the two tracers of the galaxy’s ISM as a function of redshift. Neither the Ly/[Cii] size, nor the Ly/FIR size shows any correlation with redshift ( with , and with respectively) - this implies no evolution of the size ratio across our redshift range.
4.2 Kinematic Comparison
We now compare the overall kinematics of the ISM in the host galaxy, traced by [Cii], with the larger–scale kinematics as traced by the Ly line. The underlying question is whether the bulk motion between the two tracers is the same, i.e. if they trace the same gravitationally bound structure. We acknowledge that the gas kinematics traced by Ly are difficult to interpret due to the complex radiative transfer of Ly photons that may prevent a clear kinematic signature.
By comparing the [Cii] velocity fields to those of the Ly line we find, to first order, no evidence for coherent rotation between these two tracers. In many cases this is due to the fact that the Ly velocity field does not show a clear velocity gradient. The [Cii], on the other hand, does indeed show such a velocity gradient in the majority of sources (Neeleman et al., 2021). There are three cases, discussed in detail below, where we see a clear gradient in the velocity field of the Ly halos, these are P, P, and P. In the notes below, we use the commonly–adopted definition of the position angle (P.A.) – the angle measured from North, counter–clockwise, to the receding part of the emission.
4.2.1 Notes on the Kinematics of Individual Objects
4.2.2 P
Given the asymmetric extended [Cii] emission, Venemans et al. (2020) speculate that P may be in the process of merging with another source. Examining the moment maps in Figure 1, P’s elongation in [Cii] aligns with the orientation of the Ly halo. In terms of kinematics, a velocity gradient is seen along the [Cii] emission, meanwhile an obvious gradient in the Ly halo is absent.
4.2.3 P
The [Cii] emission from P is surrounded by a Ly halo. The kinematics of P in [Cii] show a velocity gradient approximately from east to west (P.A. of , Neeleman et al. (2021)), meanwhile the kinematic structure of the surrounding Ly halo does not appear to be aligned, with a mild gradient from north to south and additional blue–shifted emission in the southern outskirts.
4.2.4 P
Venemans et al. (2020) note that the [Cii] morphology of P is extended and disturbed. The Ly halo surrounds the [Cii], with a marginal extension towards the north. The kinematics show no obvious velocity gradient across the structure, but simply patches of mildly blue– and red–shifted emission. In contrast, the entirety of the Ly halo appears to be blue-shifted by a few hundred km s-1.
4.2.5 P
P is extended in both [Cii] and Ly emission. The [Cii] emission has been extensively studied in Decarli et al. (2019) with high resolution imaging. The authors argue that the extended tails of [Cii] emission are due to the tidal stripping of a satellite galaxy. In the moment maps, we see that the Ly halo is much larger still than the extended [Cii]. The peak of the Ly emission is north-easterly from the peak in [Cii] which is centred on the QSO position. The [Cii] emission from the QSO host galaxy shows a velocity gradient in the south-north direction. The Ly halo meanwhile is red-shifted across almost the entirety of the structure, except for the very outskirts of the halo in the east.
4.2.6 P
P shows a relatively compact [Cii] morphology, and a Ly halo extending towards the north. The [Cii] emission shows a gradient from north to south (P.A. , Neeleman et al. (2021)), meanwhile the Ly halo shows a gradient that is approximately perpendicular to this (from east to west, with an approximate P.A. of ). P presents the most striking contrast between the halo and ISM velocity fields of the objects studied here.
4.2.7 P
P has a gas-rich companion detected in [Cii], presented in Decarli et al. (2017) 9 kpc south of the QSO, and a second, fainter, companion, presented in Neeleman et al. (2019). The [Cii] emission that is associated with the quasar is compact, and Neeleman et al. (2021) report a position angle of . The Ly halo is present prominently towards the north of the QSO. There is a pronounced velocity gradient in the east - west direction across the Ly halo, with a position angle of approximately .
4.2.8 P
P shows very compact and faint [Cii] emission. In contrast, its Ly halo is bright, and is one of the more extended of the sample. The [Cii] kinematics do not show a velocity gradient, and the majority of the Ly halo is blue-shifted.
4.2.9 J
J was first presented in Venemans et al. (2016), and supplemented with very high resolution data in Venemans et al. (2020), resolving scales of pc. The Ly halo was the first halo reported with muse, presented in Farina et al. (2017). Neither the [Cii] emission, nor the Ly halo are particularly luminous. In terms of kinematics, the [Cii] displays a clear gradient from the south west to the north east. The Ly halo within which it is embedded is red-shifted in its entirety, extending mainly to the south.
5 Summary
We have presented a comparison of Ly and [Cii] emission of a sample of 8 QSOs at , using muse and alma datacubes matched in velocity resolution. The [Cii] emission traces the extent and kinematics of the interstellar medium of the QSO host–galaxy, whereas the Ly emission traces the extent and kinematics of the ionised gaseous halos that surround the quasar hosts.
We find that the Ly halo sizes are typically times larger than the extent of the [Cii] that is associated with the host galaxy (and times larger than the host galaxy’s dust continuum emission). A comparison of the kinematics has proven more difficult, as the majority of the Ly halos do not show ordered motion in their velocity fields. In those three cases where a kinematic P.A. can be determined in the respective Ly halos, their velocity fields are not aligned with that of the [CII] emission. In other words, we find not a single case where the rotational signature associated with the host galaxy extends to the Ly halo. This suggests that the Ly emission is not simply tracing the outskirts of a large rotating disk structure that is a simple extension of the central structure seen in [Cii] (and dust) emission. It rather suggests that the kinematics of the halo gas are decoupled from those of the interstellar medium in the host galaxies’ disks.
Connecting the kinematics of [Cii] and Ly remains a challenge, in particular in the presence of companions and/or asymmetries in the gas distribution. An additional caveat is that, given its highly scattering nature, the Ly emission line is not an ideal tracer for gas kinematics. While we do not think this should affect our ability to detect rotational signatures at large galacto-centric radii, a confirmation of our results will have to await observations of the sources with the NIRSpec IFU on–board the James Webb Space Telescope. Ideally, a large sample of isolated sources is required, to investigate the general case of cosmological accretion using the H emission line, allowing a direct and unambiguous comparison of the halo kinematics to those of the host galaxy in [Cii].
Appendix A Moment Maps
We include here the full series of moment maps continuing as in Figure 1.
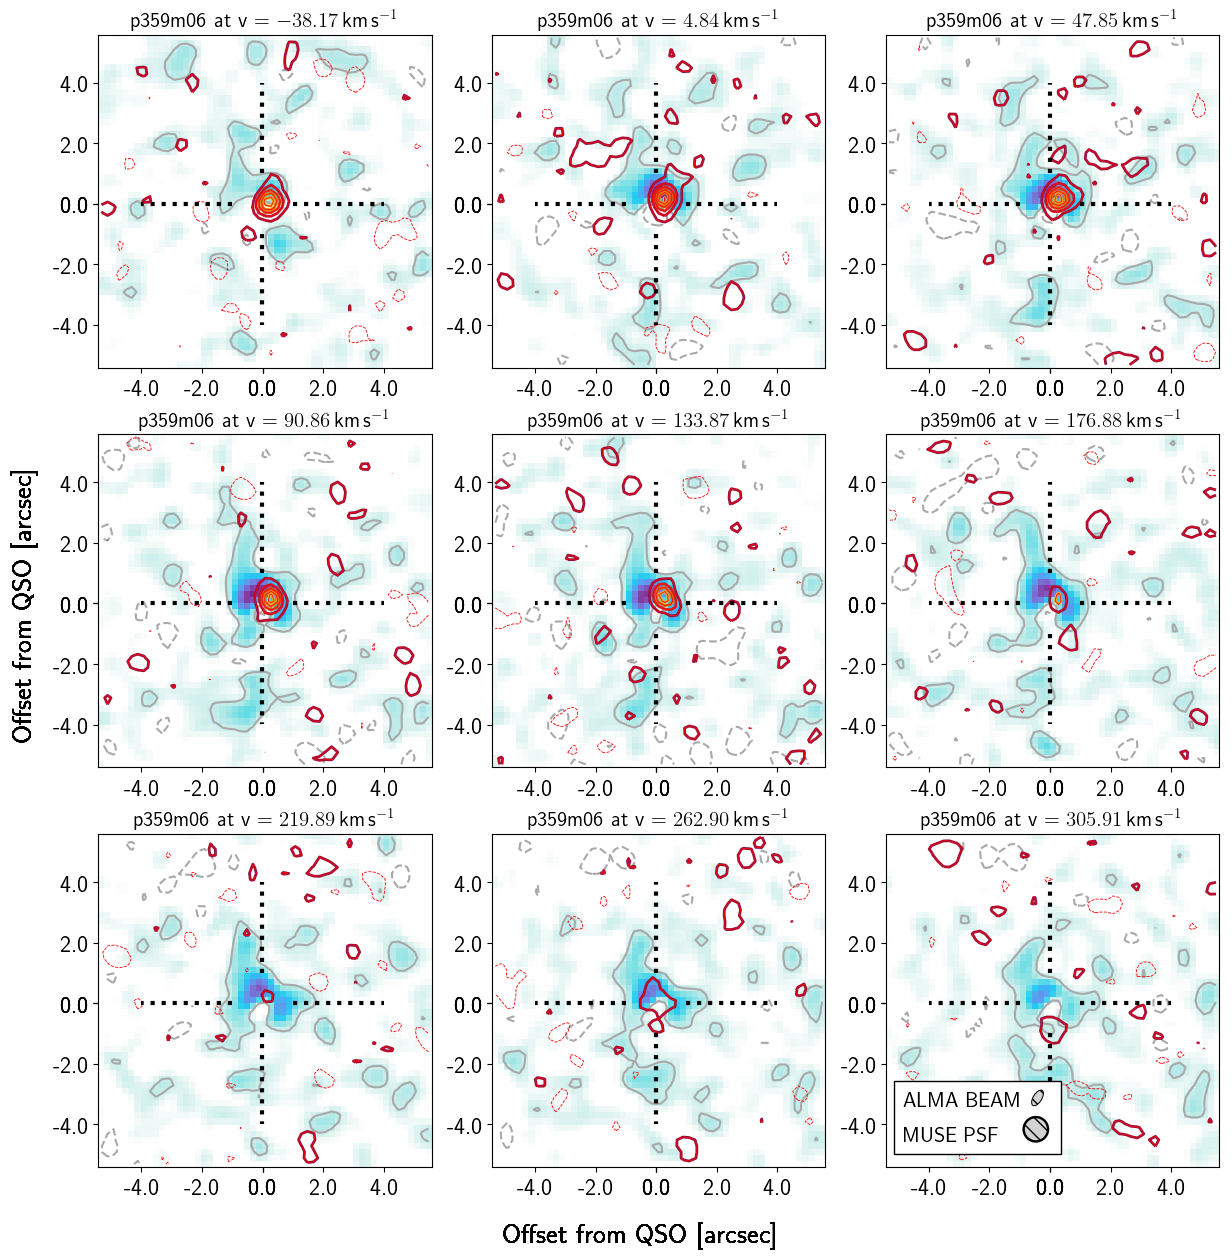
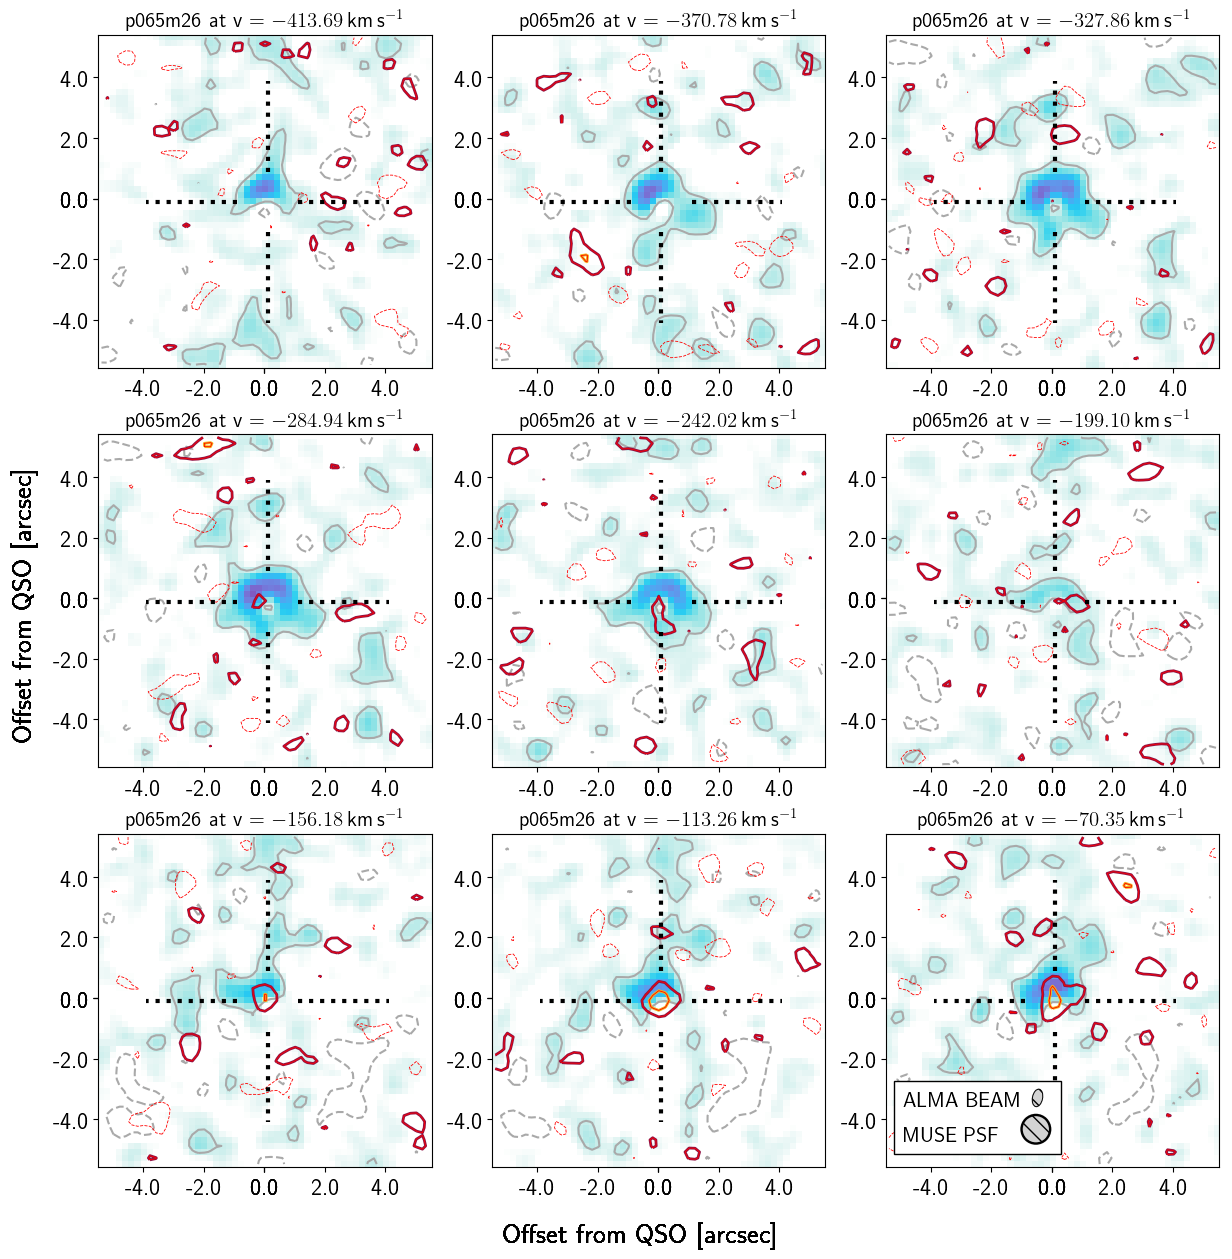
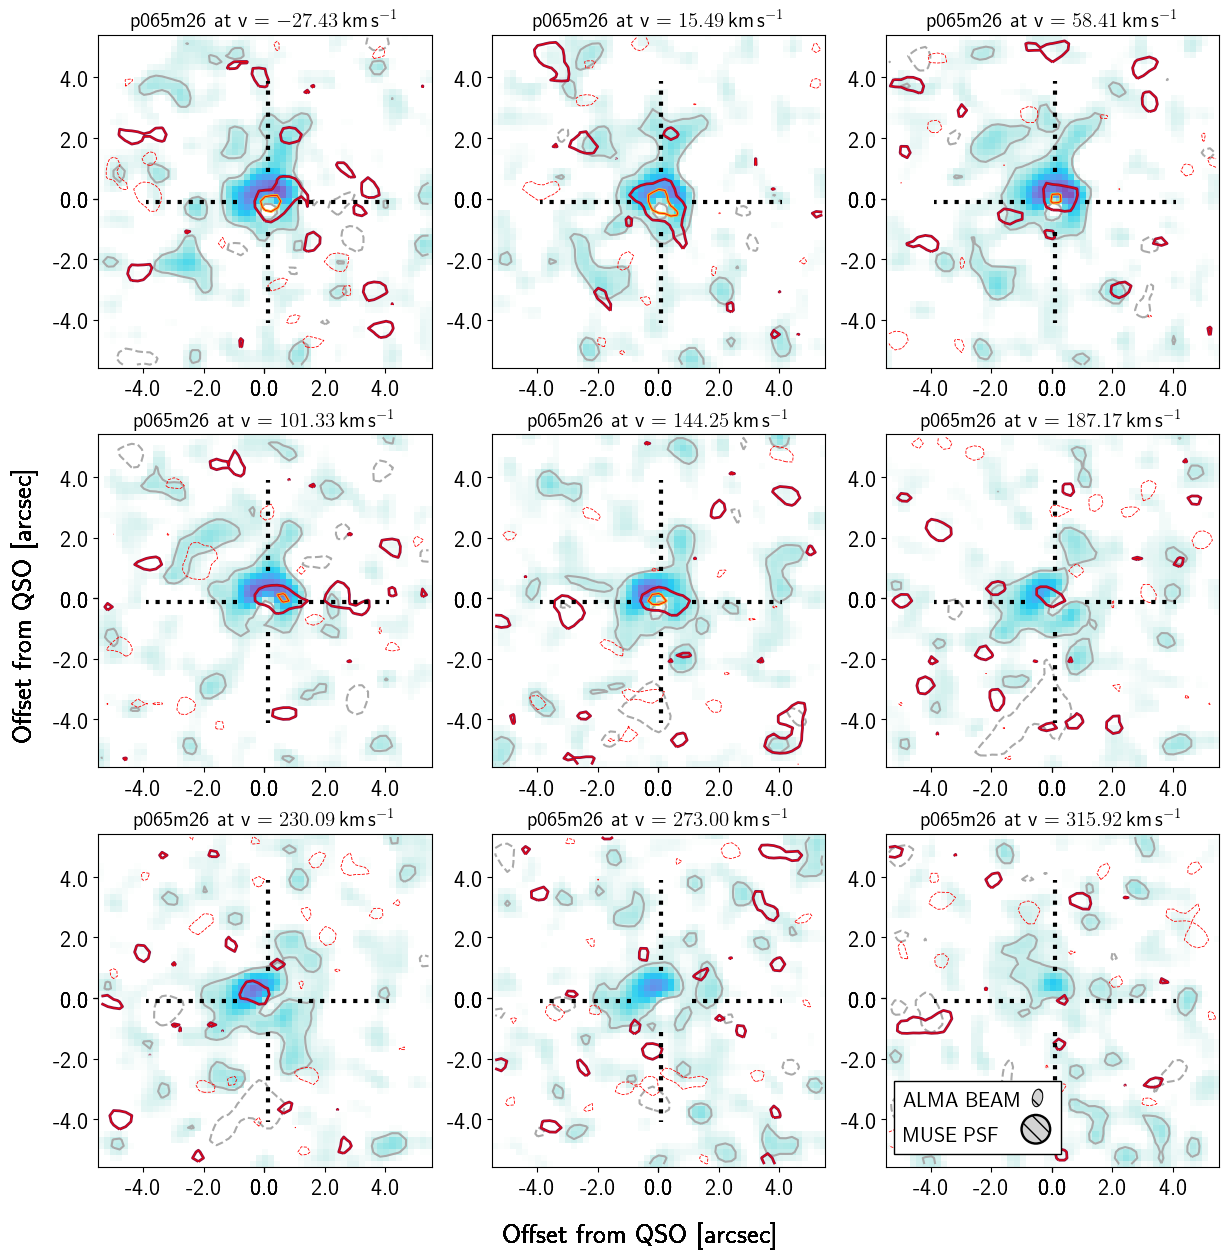
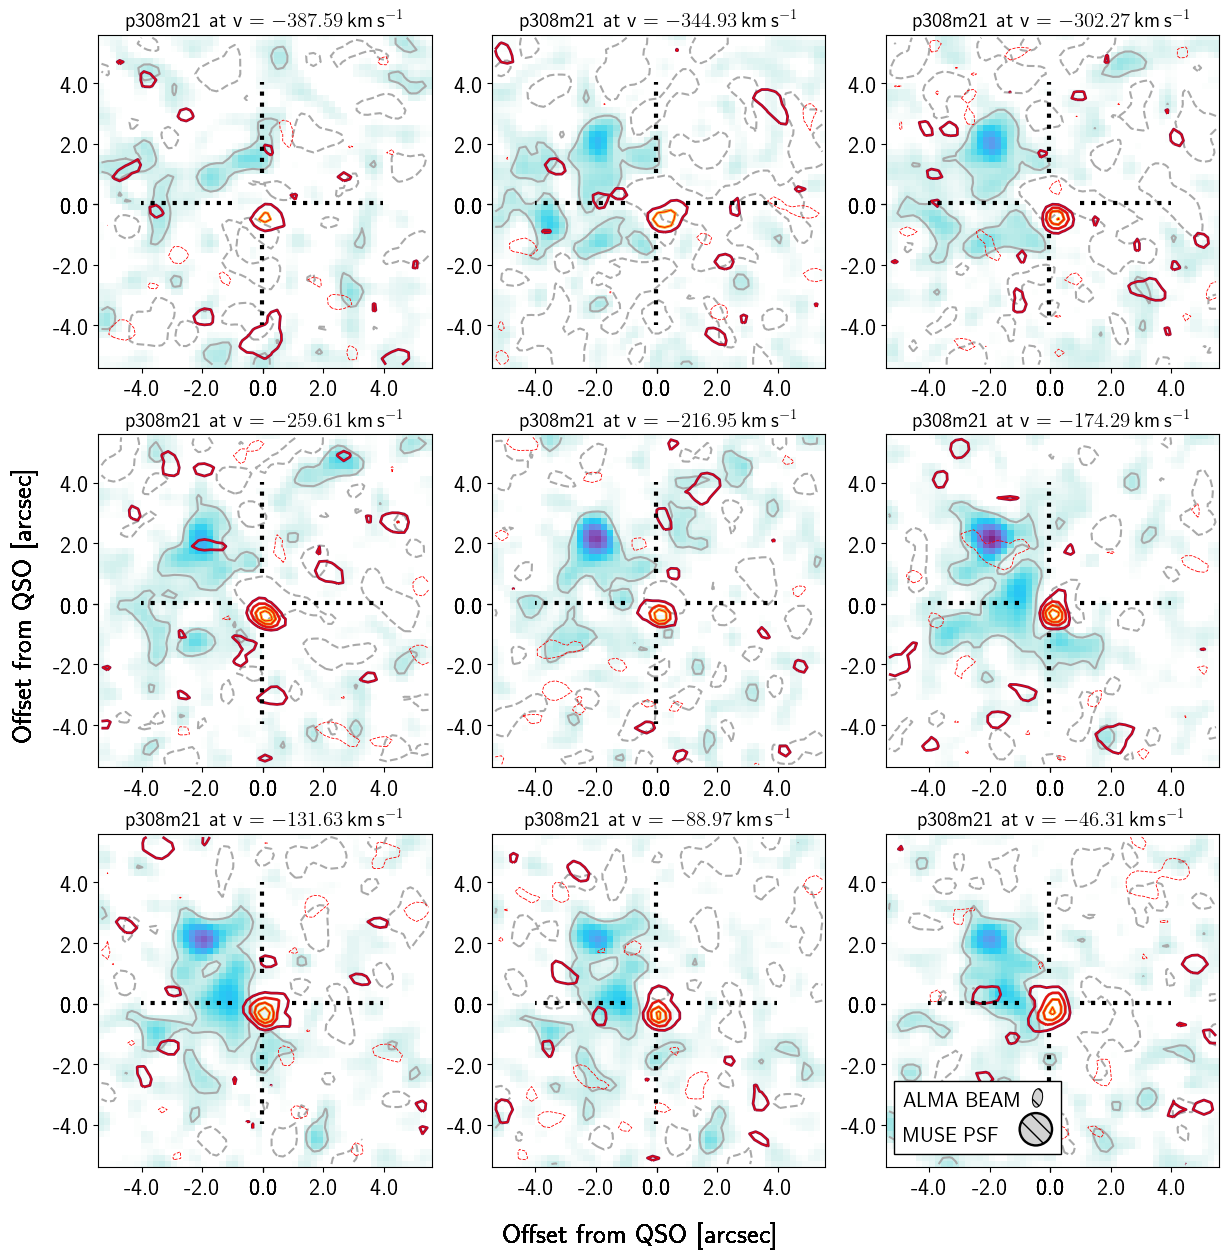
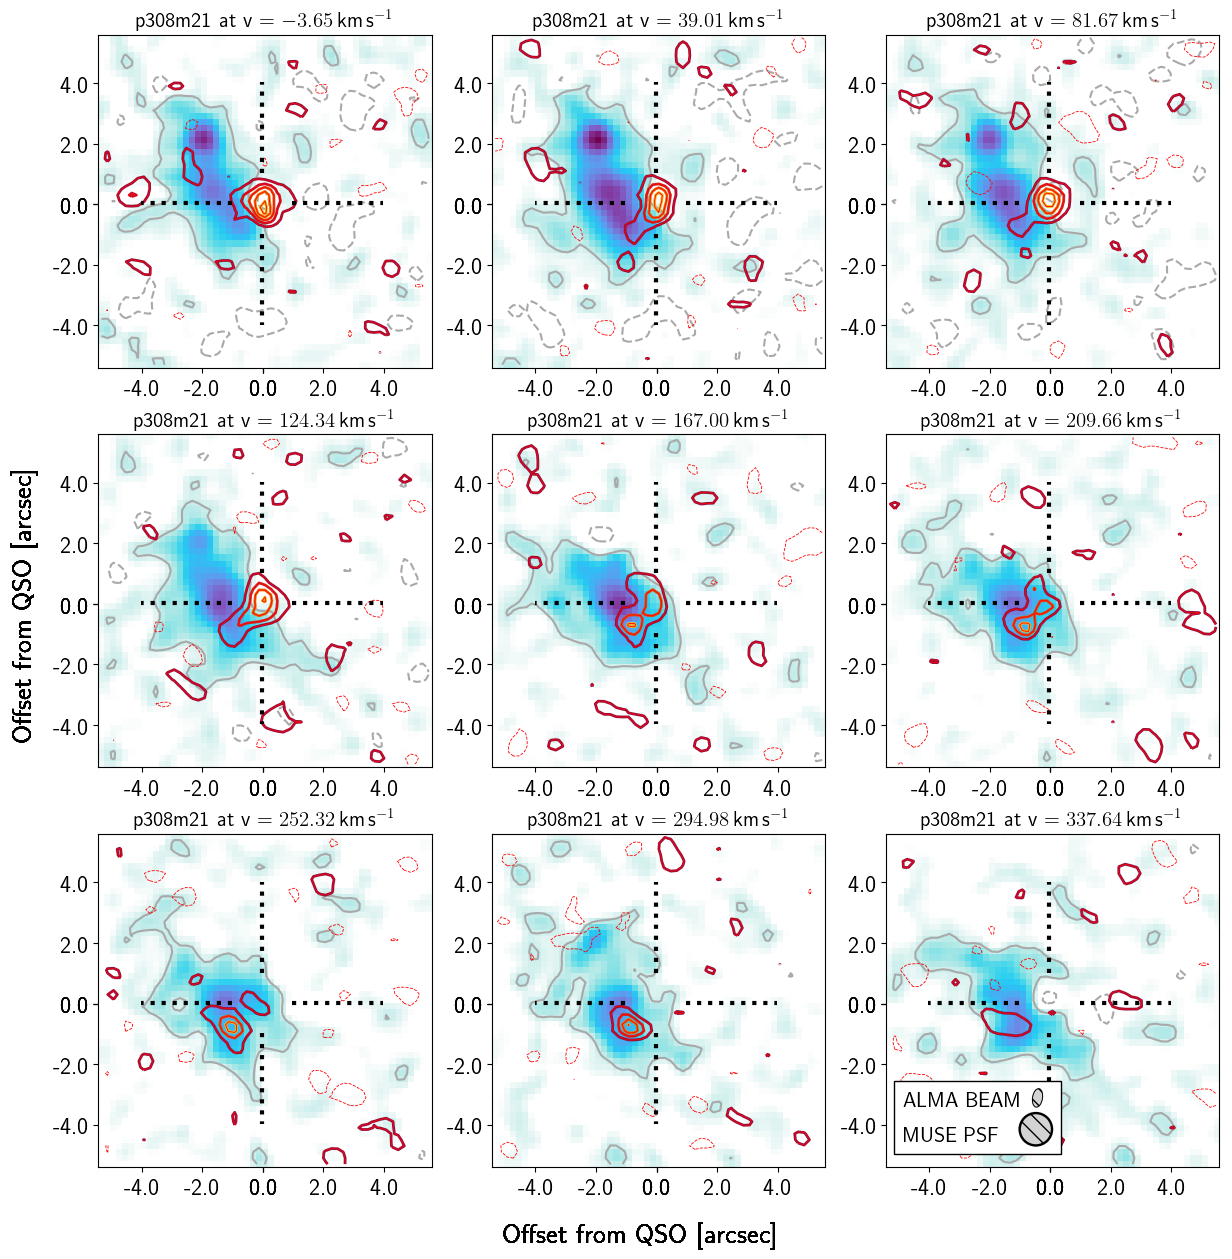
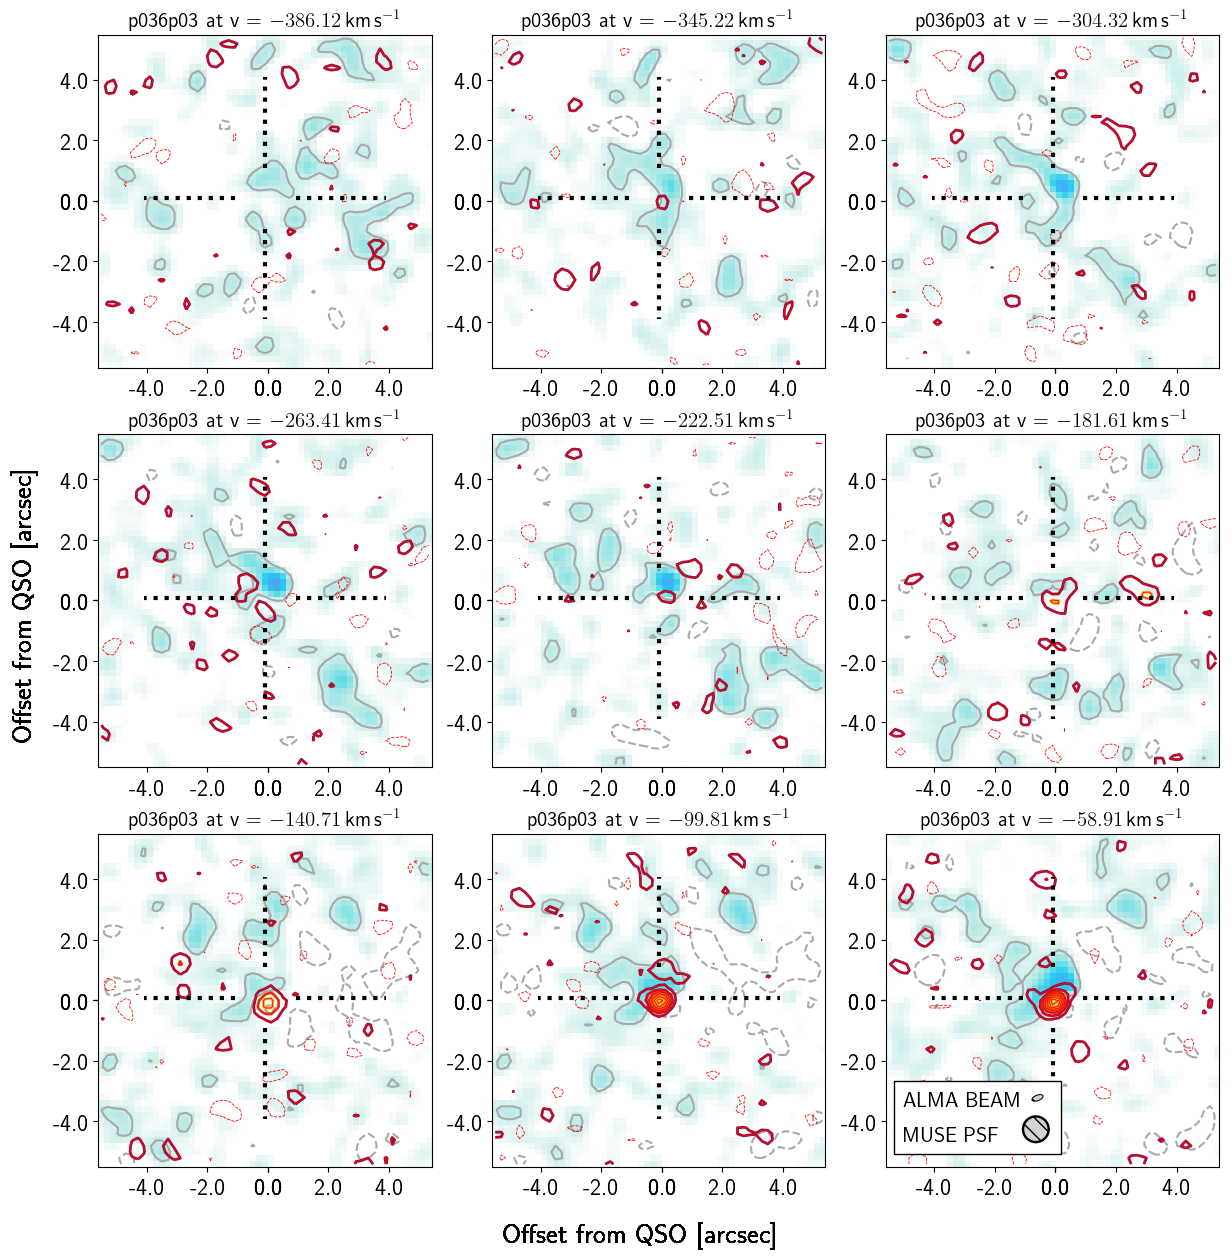
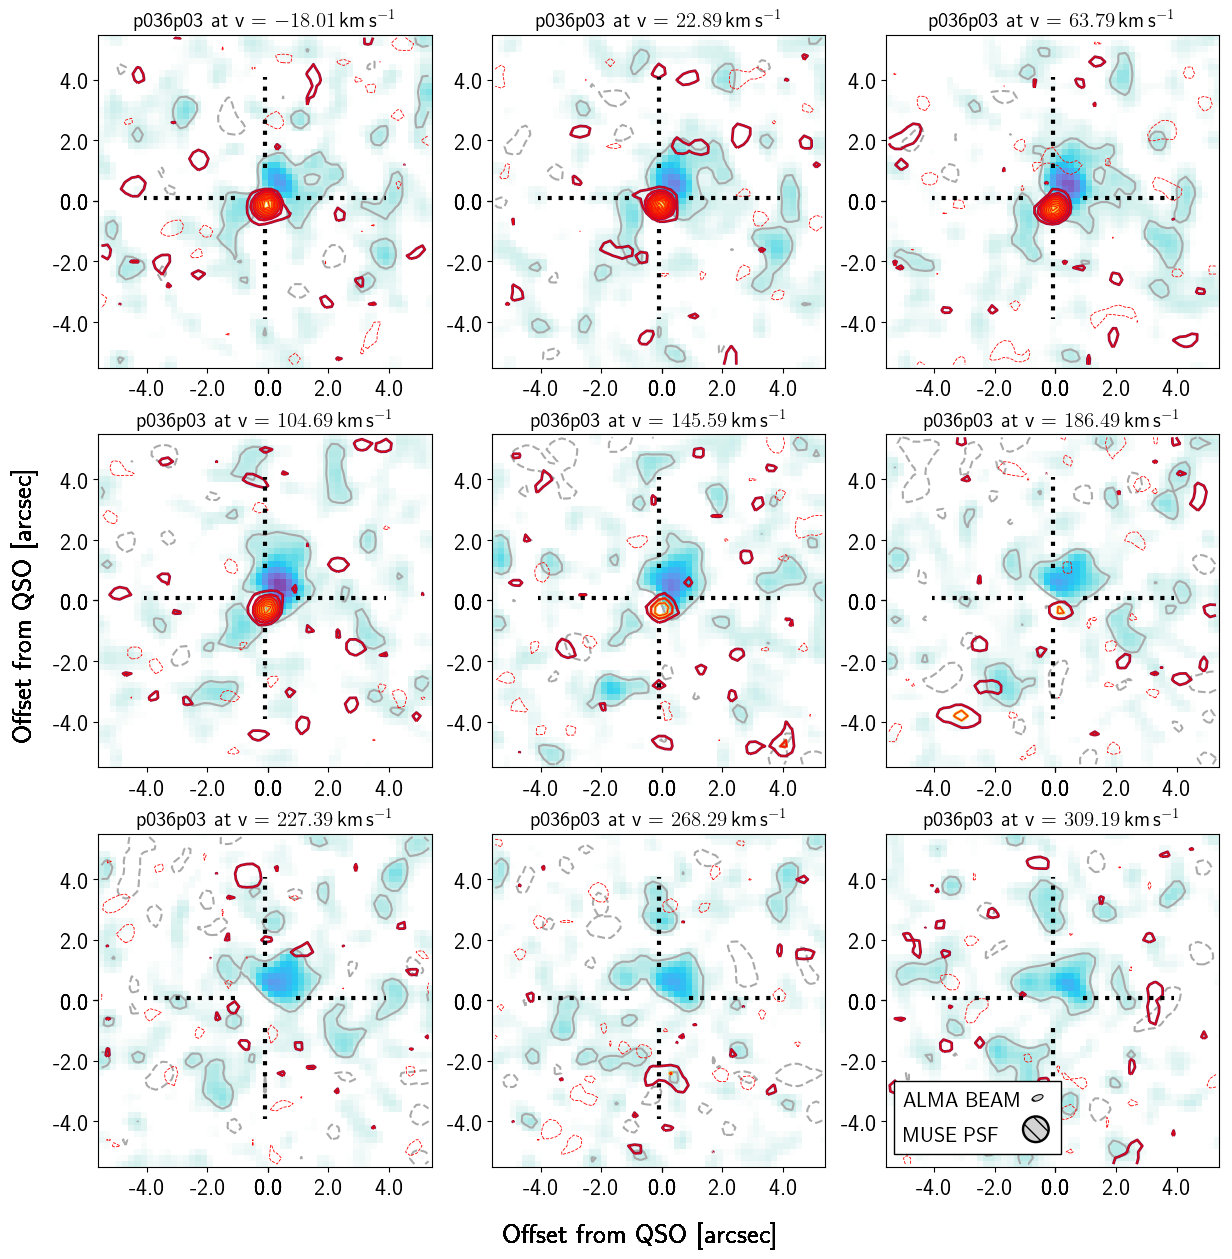
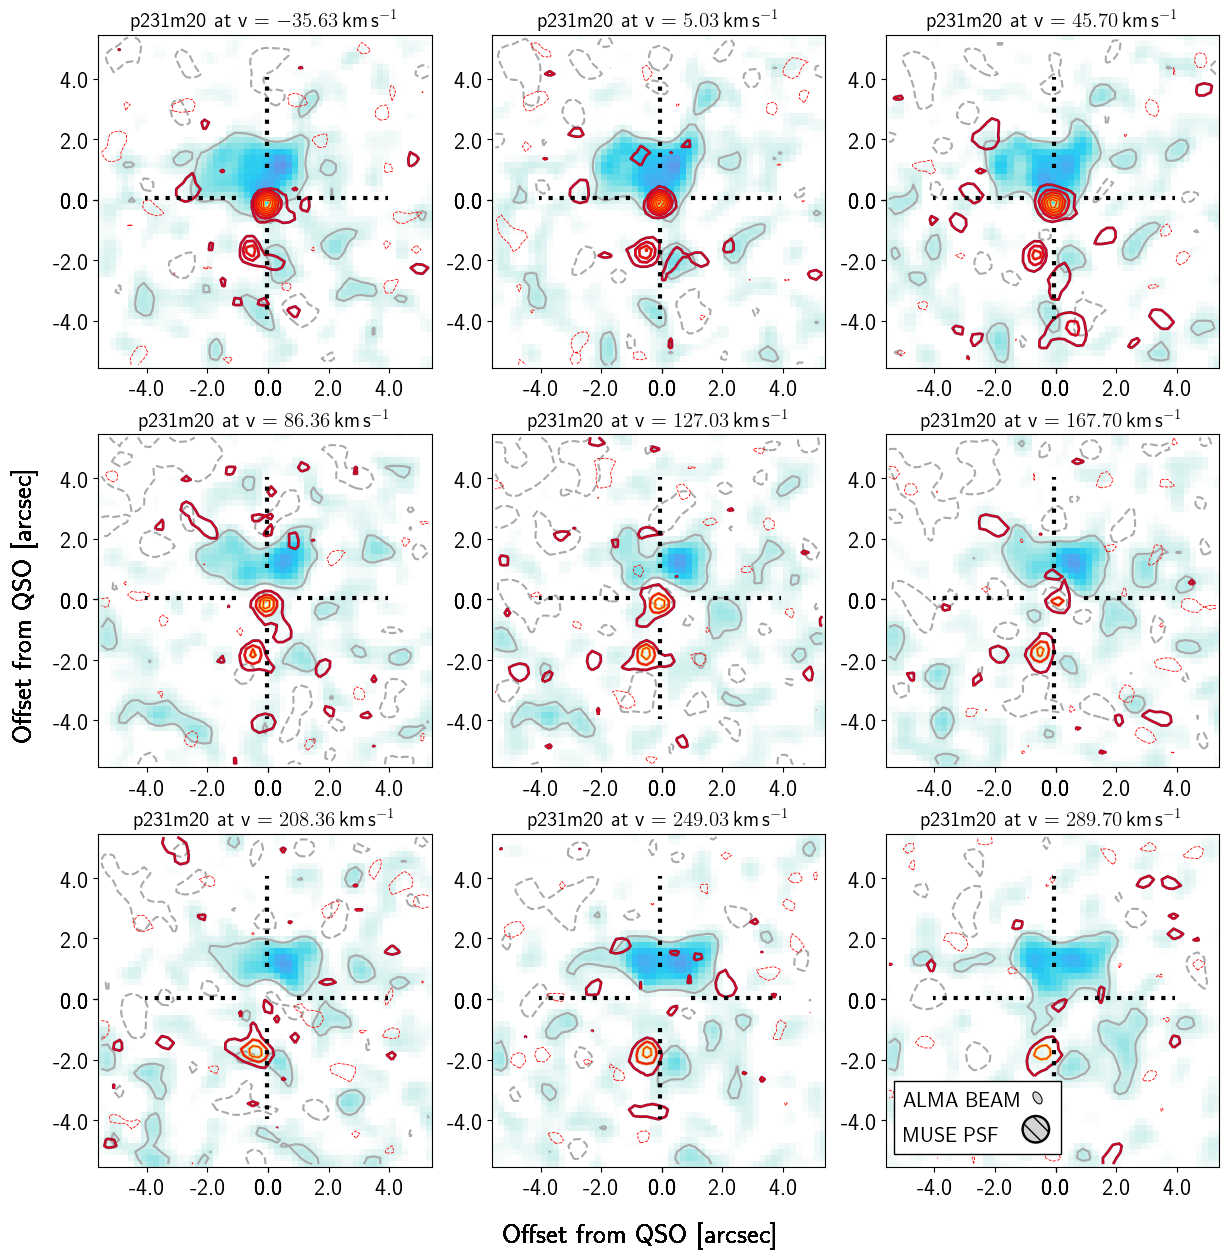
Appendix B Channel Maps of Ly and [Cii] Emission
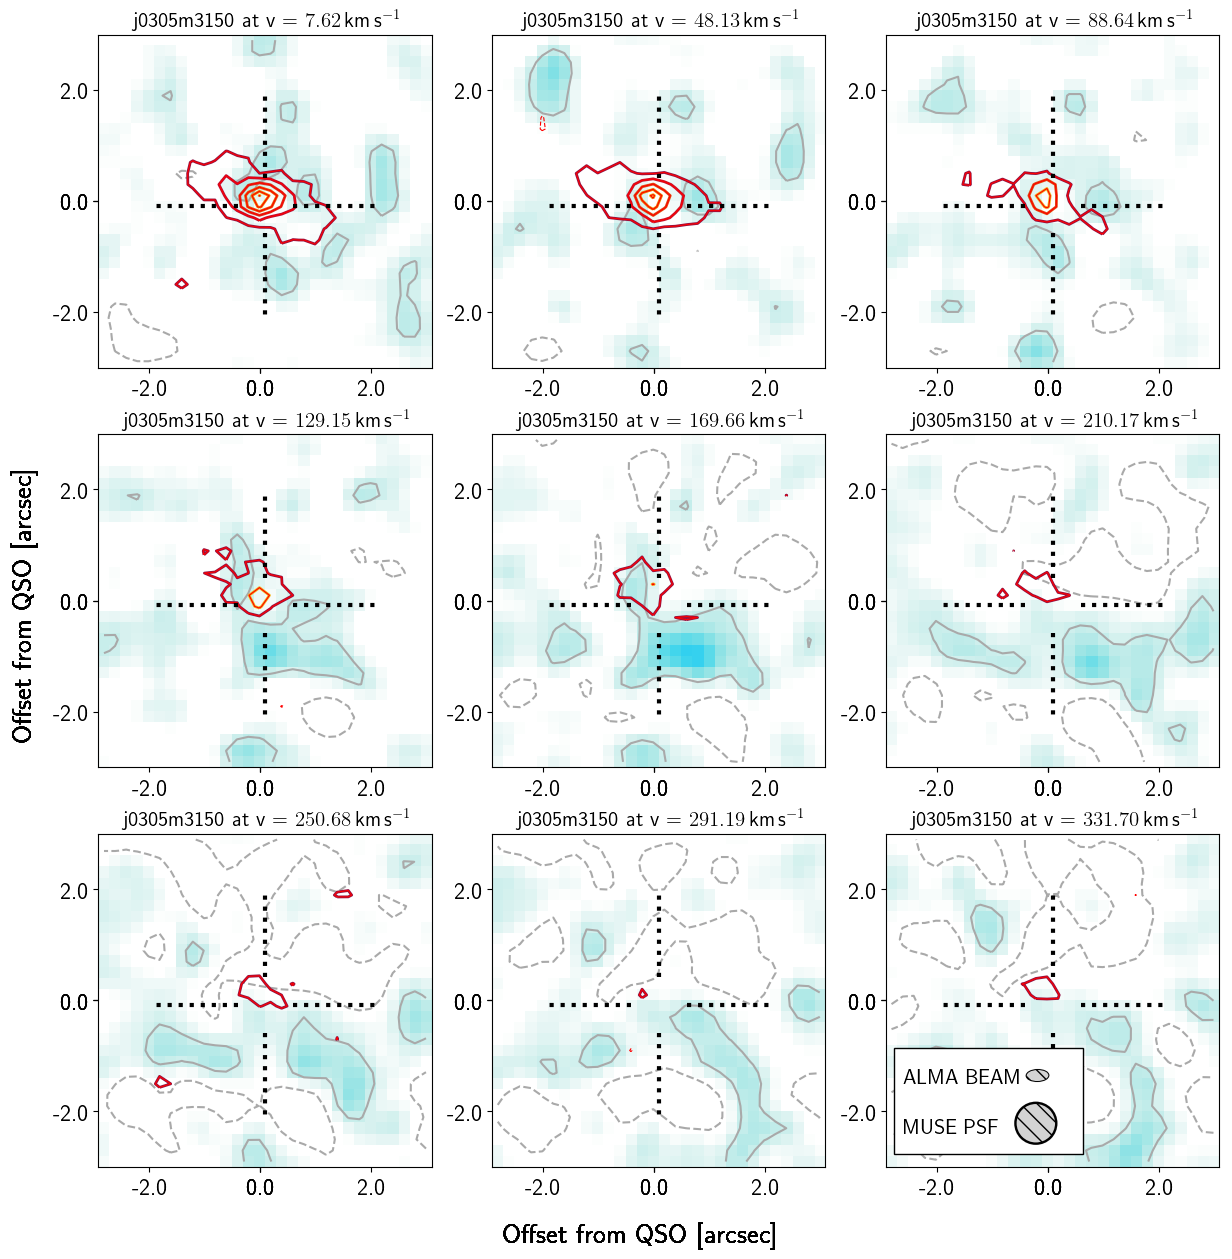
We include here a series of channel maps depicting emission from [Cii] in the QSO host galaxies, and Ly in the extended halos extracted at the same velocity. The [CII] emission in each panel is that arising in a single channel of 30MHz ( km s-1), in comparison, the Ly emission from the slightly over-sampled muse datacube is the sum across a Å wide window ( km s-1). All panels are cutouts of ″ a-side, with the exception of the highest redshift object, J where the very high resolution observations from alma dictate that we zoom in to panels of ″ a-side, and remove the masking of PSF residuals in the Ly image in order to see the host galaxy in [Cii] in these maps. Channel maps for the full sample can be found in the figure set available in the online journal (or in the Appendix on arXiv).

References
- Arrigoni Battaia et al. (2019) Arrigoni Battaia, F., Hennawi, J. F., Prochaska, J. X., et al. 2019, MNRAS, 482, 3162
- Bañados et al. (2016) Bañados, E., Venemans, B. P., Decarli, R., et al. 2016, The Astrophysical Journal Supplement Series, 227, 11
- Bañados et al. (2018) Bañados, E., Venemans, B. P., Mazzucchelli, C., et al. 2018, Nature, 553, 473
- Borisova et al. (2016) Borisova, E., Cantalupo, S., Lilly, S. J., et al. 2016, arXiv:1605.01422
- Decarli et al. (2017) Decarli, R., Walter, F., Venemans, B. P., et al. 2017, Nature Publishing Group, 545, doi:10.1038/nature22358
- Decarli et al. (2019) Decarli, R., Dotti, M., Bañados, E., et al. 2019, ApJ, 880, 157
- Drake et al. (2019) Drake, A. B., Farina, E. P., Neeleman, M., et al. 2019, ApJ, 881, 131
- Drake et al. (2020) Drake, A. B., Walter, F., Novak, M., et al. 2020, arXiv e-prints, arXiv:2007.14221
- Farina et al. (2017) Farina, E. P., Venemans, B. P., Decarli, R., et al. 2017, The Astrophysical Journal, 848, 78
- Farina et al. (2019) Farina, E. P., Arrigoni-Battaia, F., Costa, T., et al. 2019, ApJ, 887, 196
- Goto et al. (2009) Goto, T., Utsumi, Y., Furusawa, H., Miyazaki, S., & Komiyama, Y. 2009, Mon. Not. R. Astron. Soc, 400, 843
- Goto et al. (2012) Goto, T., Utsumi, Y., Walsh, J. R., et al. 2012, Mon. Not. R. Astron. Soc, 421, 77
- Jiang et al. (2016) Jiang, L., McGreer, I. D., Fan, X., et al. 2016, ApJ, 833, 222
- Mazzucchelli et al. (2017) Mazzucchelli, C., Bañados, E., Venemans, B. P., et al. 2017, arXiv:1710.01251
- Momose et al. (2018) Momose, R., Goto, T., Utsumi, Y., et al. 2018, MNRAS, 000, arXiv:1809.10916v1
- Mortlock et al. (2011) Mortlock, D. J., Warren, S. J., Venemans, B. P., et al. 2011, Nature, 474, 616
- Neeleman et al. (2019) Neeleman, M., Bañados, E., Walter, F., et al. 2019, ApJ, 882, 10
- Neeleman et al. (2021) Neeleman, M., Novak, M., Venemans, B. P., et al. 2021, arXiv e-prints, arXiv:2102.05679
- Novak et al. (2020) Novak, M., Venemans, B. P., Walter, F., et al. 2020, ApJ, 904, 131
- Prescott et al. (2015) Prescott, M. K. M., Martin, C. L., & Dey, A. 2015, ApJ, 799, 62
- Roche et al. (2014) Roche, N., Humphrey, A., & Binette, L. 2014, MNRAS, 443, 3795
- Schindler et al. (2020) Schindler, J.-T., Farina, E. P., Bañados, E., et al. 2020, ApJ, 905, 51
- Stewart et al. (2013) Stewart, K. R., Brooks, A. M., Bullock, J. S., et al. 2013, The Astrophysical Journal, 769, 74. https://doi.org/10.1088%2F0004-637x%2F769%2F1%2F74
- Stewart et al. (2011) Stewart, K. R., Kaufmann, T., Bullock, J. S., et al. 2011, The Astrophysical Journal, 738, 39. https://doi.org/10.1088%2F0004-637x%2F738%2F1%2F39
- Venemans et al. (2019) Venemans, B. P., Neeleman, M., Walter, F., et al. 2019, ApJ, 874, L30
- Venemans et al. (2016) Venemans, B. P., Walter, F., Zschaechner, L., et al. 2016, ApJ, 816, 37
- Venemans et al. (2020) Venemans, B. P., Walter, F., Neeleman, M., et al. 2020, ApJ, 904, 130
- Willott et al. (2011) Willott, C. J., Chet, S., Bergeron, J., & Hutchings, J. B. 2011, The Astronomical Journal, 142, arXiv:1109.4110v1
- Yang et al. (2020) Yang, J., Wang, F., Fan, X., et al. 2020, ApJ, 897, L14
- Zeimann et al. (2011) Zeimann, G., Richard L. White, Robert H. Becker, et al. 2011, The Astrophysical Journal,, 736