Diagnostics for PopIII galaxies and Direct Collapse Black Holes
in the early universe
Abstract
Forthcoming observational facilities will make the exploration of the early universe routine, likely probing large populations of galaxies at very low metallicities. It will therefore be important to have diagnostics that can solidly identify and distinguish different classes of objects in such low metallicity regimes. We use new photoionisation models to develop diagnostic diagrams involving various nebular lines. We show that combinations of these diagrams allow the identification and discrimination of the following classes of objects in the early universe: PopIII and Direct Collapse Black Holes (DCBH) in pristine environments, PopIII and DCBH embedded in slightly enriched ISM (), (metal poor) PopII and AGN in enriched ISM. Diagnostics involving rest-frame optical lines (that will be accessible by JWST) have a better discriminatory power, but also rest-frame UV diagnostics can provide very useful information. Interestingly, we find that metal lines such as [O iii] and Civ can remain relatively strong (about a factor of 0.1–1 relative H and Heii, respectively), even in extremely metal poor environments (), which could be embedding PopIII galaxies and DCBH.
keywords:
galaxies: formation – galaxies: evolution – galaxies: high-redshift – galaxies: nuclei – galaxies: active1 Introduction
Detecting galaxies hosting the very first generation of stars, formed out of the primordial, pristine gas, and often refereed to as PopIII stars, is one of the primary, ambitious goals of modern astrophysics. These galaxies are expected to be found between the end of the “dark ages” (z20–30) and the epoch of main re-ionisation (z7) (e.g. Abel et al., 2002; Bromm et al., 2002; Schneider et al., 2006; Jeon et al., 2015; Jaacks et al., 2018), although some models expect that clumps of unprocessed gas may lead to formation of PopIII even at z3 (Liu & Bromm, 2020). PopIII galaxies are expected to be very faint (low mass) and rare, since the chemical enrichment (hence the transition to PopII) proceeds very quickly (e.g. Tornatore et al., 2007; Jaacks et al., 2018).
Some claims of PopIII detection (Sobral et al., 2015) in a luminous Ly emitter, CR7, at were not confirmed by later analyses (Bowler et al., 2017; Shibuya et al., 2018). The expectation is that PopIII galaxies might be identified with the forthcoming generation of optical/near-IR observatories, especially the James Webb Space Telescope (JWST) and the Extremely Large Telescopes (ELTs), although their detectability strongly depends on the specific model and cosmological simulations and their assumptions (e.g. Stiavelli & Trenti, 2010; Pawlik et al., 2011; Inayoshi et al., 2018; Visbal et al., 2020; Vikaeus et al., 2021)
Another important class of primeval objects are the seeds of supermassive black holes at the center of primeval galaxies. The finding of hyper-massive black holes () already in place by z7.5, has triggered the development of numerous models and scenario about their formation and the nature of their progenitors, including massive stellar (PopIII) remnants accreting at super-Eddington rates, nuclear stellar clusters and the so-called Direct Collapse Black Holes (DCBHs), i.e. black holes with masses in the range of resulting from the putative direct collapse of massive gas clouds under specific conditions (e.g. Volonteri, 2012; Valiante et al., 2016; Inayoshi et al., 2020; Beckmann et al., 2019). Also in this case, some models expect that DCBH or other forms of supermassive black holes seeds may be detectable with the forthcoming generation of observing facilities (Volonteri et al. 2017; Valiante et al. 2018; Natarajan et al. 2017; Barrow et al. 2018; Habouzit et al. 2019; Whalen et al. 2020 and references therein). Some potential candidates of DCBHs have actually been suggested in the past based on broad-band photometry, but which still need spectroscopic confirmation (Pacucci et al., 2016). An interpretation of the nature of CR7 as primeval DCBH (Pacucci et al., 2017; Hartwig et al., 2016) has subsequently been questioned by subsequent analyses of this source (Bowler et al., 2017; Shibuya et al., 2018).
Various past studies have investigated what would be the properties of these classes of primeval objects and what would be their observational signatures. As a consequence of their higher temperature, PopIII stars are expected to have slopes bluer and ionising continua harder than later generation of (PopII) stars. Along with the lack of metals, these properties are expected to result into strong hydrogen and helium line emission and, in particular, strong Heii emission lines. Specifically, the presence of the Heii line, along with the absence of other metal lines, has been considered a signature of ISM photoionised by PopIII stars (e.g. Schaerer, 2003; Raiter et al., 2010; Inoue, 2011). CR7 was a notable example (Sobral et al., 2015), although the detection of Heii and the claim of PopIII was not confirmed by subsequent studies (Bowler et al. 2017; Shibuya et al. 2018; see also Sobral et al. 2019).
![[Uncaptioned image]](/html/2204.11870/assets/x1.png)
![[Uncaptioned image]](/html/2204.11870/assets/x2.png)
|
![[Uncaptioned image]](/html/2204.11870/assets/x3.png)
|
The spectroscopic properties of accreting DCBH or other supermassive black hole seeds have been investigated by various studies in terms of broad photometric properties (Volonteri et al., 2017; Valiante et al., 2018; Habouzit et al., 2019), however fewer studies have investigated their observational properties in terms of nebular emission lines (Pacucci et al., 2016, 2017; Hartwig et al., 2016). Generally this class of objects is expected to have properties similar to PopIII, i.e. blue continua, strong nebular lines, including strong Heii emission.
Despite the various efforts discussed above, past studies had several limitations. Many of them focused on the rest-frame ultra-violet (UV) diagnostics, which are those observable from ground at high-redshift; however, JWST will provide additional key information also on the rest-frame optical diagnostics. Previous studies have explored a limited range of physical parameters (e.g. in terms of ionisation parameter or shape of the ionising continuum). Moreover, past studies have generally provided the expected strength of the nebular lines in the case of PopIII stars, but have not really explored the possible range of line ratios that can be safely associated with PopIII, i.e. it is not yet clear, even in the case of detection of Heii, what are the limits on the other lines that can unambiguously identify PopIII stars. Previous studies have only explored the case of PopIII with no metals in the ISM. However, recent theoretical works expect that pockets of pristine gas might survive amid enriched ISM (Liu & Bromm, 2020), which might result into the formation of PopIII stars photoionising gas that emits some metal lines. Finally, given the similarity between PopIII stars and accreting DCBH in terms of ionising spectra, generally past studies have not attempted to identify diagnostics that might potentially discriminate between the two classes of sources.
In this study we make an effort to tackle these previous limitations. We develop new photoionisation models using different PopIII ionising continua, corresponding to different IMFs, and different physical conditions and explore what are the nebular emission lines, both in the rest-frame UV and in the rest-frame optical, and explore how different emission line ratios and equivalent widths (EWs) can distinguish among these different cases and also how safely they can separate PopII galaxies. We also explore the new scenario of (mildly) enriched ISM photoionised by PopIII stars. Moreover, we consider the case of gas photoionised by accreting DCBH and investigate whether this can be distinguished from the case of PopIII stars. We provide diagnostic diagrams that will be useful to disentangle these various cases, especially through spectroscopic follow-up of candidate PopIII and DCBH with the forthcoming new observational facilities.
| Models | PopIII galaxies | PopII galaxies | DCBHs |
| SED shape | |||
| Graph | Fig. 1(a) | Fig. 1(b) | Fig. 1(c) |
| Parameters | Salpeter IMF | BPASS, Binary, Kroupa IMF | Power-law Big Bump |
| – , – , | Upper mass: and | ||
| – | Zgas Z⋆ | Tbb (K) = 5e4, 1e5, 2e5 | |
| Zero-age | Myr and Myr (continuous) | ||
| Gas properties | |||
| Zgas | 0, 1e-5, 1e-4 | 1e-5, 1e-4, 1e-3 | 0, 1e-5, 1e-4, 1e-3 |
| (higher metallicities up to ( Z⊙)) | (higher metallicities up to ( Z⊙)) | ||
| From to with a step dex (down to for evolved galaxies) | |||
| (cm-3) | , , and | ||
2 Photoionisation models
We perform photoionisation models calculations by using Cloudy (version 13.05; Ferland et al. 1998; Ferland et al. 2013) to obtain spectroscopic predictions for primordial objects. We primarily model sources dominated by PopIII stellar populations and DCBH to find any difference in their spectroscopic features, which would allow distinguishing between the two populations. Moreover, we also consider evolved systems such as PopII galaxies as well as accreting supermassive black holes (AGNs) embedded in metal-enriched ISM, so to provide solid recipes for the identification of extremely metal-deficient systems and their discrimination from metal enriched systems.
We adopt similar procedures as detailed in Nakajima et al. (2018) to run the Cloudy calculations. Briefly as for the gas properties, we assume constant-density gas clouds with a plane-parallel geometry. We do not include any dust in the ionised cloud and no elements are considered depleted onto dust grains except for the models of PopII galaxies (see §2.2) and unless otherwise specified. At the zero metallicity, we adopt the primordial helium abundance given by Hsyu et al. (2020). In non-zero metallicities, all elements except nitrogen, carbon, and helium are taken to be primary nucleosynthesis elements. For carbon and nitrogen, we use forms given by Dopita et al. (2006) and López-Sánchez et al. (2012), respectively, to take into account their secondary nucleosynthesis production in the high-metallicity range. These prescriptions are based on observations of nearby Hii regions, and known to work for galaxies, on average (e.g., Steidel et al. 2016; Amorín et al. 2017; Hayden-Pawson et al. 2021). For helium, we use a form in Dopita et al. (2006) but slightly updated to be consistent with the latest primordial value (Hsyu et al., 2020). The ionisation state is regulated by ionisation parameter (), whose definition in Cloudy is the number of hydrogen-ionising photons to the total hydrogen density in a dimensionless form at the radius of the illuminated face of the plane-parallel cloud. The ionisation parameter is varied from up to an extreme value of with a step of dex on the logarithmic scale. A gas electron density of cm-3 is used as a fiducial value, but and cm-3 are also explored and presented in Appendix §A. We choose this range of gas density because (i) it is observed in ionised Hii regions of actively star-forming galaxies at (Shirazi et al., 2014; Sanders et al., 2016), and (ii) a high gas density of cm-3 is tantalisingly inferred in a galaxy (Oesch et al., 2016; Jiang et al., 2021). We adopt the same fiducial value and range of gas densities for DCBHs and AGNs, as a comparable densities are observed in the narrow-line regions of typical AGNs (e.g., Nagao et al. 2006; Dors et al. 2014; see also Kewley et al. 2013). Since there are not yet direct determinations of the gas electron density in the ionised regions surrounding DCBHs, we treat the gas density for the DCBH models in the same way as for the AGN models.
Three types of incident radiation field are considered here: PopIII galaxies, PopII galaxies, and DCBHs. Their ionising spectrum shapes are illustrated in Fig. 1, and their main parameters in Cloudy are summarised in Table 1. We give a detailed explanation for each of the models in the followings.
We note that single-cloud models, hence adopting a single value of the ionisation parameter and gas density, are only very rough approximations of the actual distribution of clouds properties in galaxies. More realistically, even within a single Hii region, although chemically homogeneous, emitting gas clouds span a broad range of ionisation parameter and density, each of them emitting optimally a subset of nebular lines. This is even more true when considering the integrated emission from an entire galaxy, which includes different kind of Hii regions. An accurate modelling would require combining photo-ionisation models with clouds spanning a broad range of ionisation parameter and density, and combining them to reproduce the observed nebular line ratios. Failure to do so results often in inferring metallicities which can be a factor of 2–3 different from the actual values (Marconi et al., in prep.). However, while we are aware of the limitations of single-cloud, single-ionisation parameter models, in this paper we are mostly interested in the overall trend of the diagnostics ratios over a range of metallicities spanning order of magnitudes, hence the effect of considering the contribution of multiple clouds with different ionisation parameters is secondary; moreover, at a given metallicity, we will show trends for different ionisation parameters, which may give an indication of the effects resulting from the contribution of different populations of clouds. In Appendix §A we also show photoionisation model results assuming gas densities different from the fiducial value. The results illustrate that different densities, and hence a potential variation of density in a system, do not alter the overall selection criteria and metallicity indicators that are derived based on the constant, fiducial density models as detailed below.
2.1 PopIII galaxies
We take three zero-metal stellar population models from Schaerer (2003) and Raiter et al. (2010) as SEDs of PopIII galaxies. They are calculated at zero-age with a Salpeter (1955) IMF, considering quite different mass ranges defined by the lower- and upper-mass cut-offs of IMF: – , – , and – . Their hard ionising spectra even above the He+-ionising potential ( eV) are presented in Fig. 1(a). As illustrated by Raiter et al. (2010), the most extreme model with the mass range from to reproduces well the most top-heavy IMFs by comparison with other existing models (e.g., Tumlinson 2006). Since recent theoretical studies indicate that extremely metal-poor stellar populations should be characterised by a top-heavy IMF (e.g., Hirano et al. 2015; Chon et al. 2021), more top-heavy than the present-day IMF such as Salpeter (1955) with – , our models would cover a reasonable range of IMF variations expected for PopIII galaxies. A broader range of top-heavy stellar IMF for PopIII galaxies (with different analytical forms) will be explored in a forthcoming, separate paper.
We consider the zero-metal ISM as well as slightly metal-enriched cases with Zgas and . The model calculations are stopped at the edge of the ionised nebular cloud, i.e., when the electron fraction, defined as the ratio of the number density of electrons to that of total hydrogen, falls below .
2.2 PopII galaxies
To identify sources with a PopIII stellar population and understand differences between more chemically-enriched systems, we need to also model PopII galaxies. We adopt SEDs of BPASS (v2.2.1; Eldridge et al. 2017; Stanway & Eldridge 2018) for modelling the ISM ionised by such PopII galaxies. BPASS models might be more appropriate for moderate/low metallicity systems and less appropriate for high metallicity systems. However, here we are exploring differences between the extremely low metallicity regimes (akin PopIII, near-pristine systems) and low/moderate metallicity (PopII) systems, so we believe that our choice of using the BPASS SEDs is appropriate. We use publicly available fiducial SEDs with binary evolution which are based on a Kroupa (2001) IMF with the two upper-mass cuts of and . We adopt a stellar age of Myr as fiducial models assuming continuous star formation to take into account contributions of hard ionising photons produced by massive Wolf-Rayet (WR) stars. In addition, the youngest stellar age of Myr is also considered as commonly adopted to model optical emission lines in Hii regions (e.g., Kewley & Dopita 2002). We adopt two different stellar ages primarily to discuss the EWs of emission lines. Usually EWs present the largest values when the stellar population is youngest (e.g., Jaskot & Ravindranath 2016; Nakajima et al. 2018), but it would not always be true for the Heii emission due to the contributions of WR stars at Myr after the onset of star formation. The shapes of ionising spectrum for the PopII models at Myr as well as those at Myr are shown in Fig. 1(b) with different stellar metallicities. For each metallicity, the SEDs at and Myr are almost identical at eV, but an enhanced production of high energy ionising photons ( eV) for the Myr model. The model calculations are terminated at the edge of the ionised cloud.
For each of the PopII models, we assume the stellar metallicity is matched to the gas-phase metallicity. This is a fair assumption as the enrichment of oxygen and other elements proceeds quickly, within less than 10 Myr (Maiolino & Mannucci, 2019). Although such a quick metal enrichment results in -enhanced abundance patterns with little iron enrichment, and hence a lower opacity in young stars for their oxygen abundance, as observationally inferred in star-forming galaxies at (Steidel et al., 2016; Cullen et al., 2019; Harikane et al., 2020), this would not significantly enhance the nebular emission strengths for the PopII models as compared to the PopIII model results. Anyway, we recall that the BPASS models adopted by us (and adequate for low metallicity systems) are already characterised by hotter atmospheres and a higher yield of ionising photons than classical, metal rich models. Moreover, we include dust physics in the PopII models as detailed in Nakajima et al. (2018), assuming the dust model and the depletion factors are unchanged but the dust abundance is scaled linearly with the gas-phase metallicity.

|
|
2.3 DCBHs
Our mock accreting DCBH incident radiation fields are generated by the Cloudy “AGN” continuum command. The function primarily consists of two components. One is the so-called a Big Bump component, and another is a power-law component in the high energy range reaching the X-ray band. We have decided to adopt this continuum template as the spectrum resulting from the accretion on primeval black holes is expected not to be much different from ‘standard’ AGN, though possibly with a broader range of the two components, as detailed below (Valiante et al. 2018, and M. Volonteri, priv. comm.). The Big Bump feature is known to appear in the UV to optical region and would trace thermal emission from an optically thick accretion disk, which feeds a massive black hole. It is parameterised by the temperature of the bump, Tbb, which is varied between T K, K, and K. The choice is based on the maximum temperature in the innermost region of the disc, T K for black holes with masses of following the approximation of keV (e.g., Yue et al. 2013). Because the temperature of the disc decreases from inside out such that , we adopt a wide parameter range to cover an effective temperature that would be expected in such an accreting disk around black holes with . It is still unclear though whether the lowest temperature can be achieved in DCBHs/AGNs (see §3). We note that the black hole mass range explored in this paper covers fairly well the theoretically suggested mass range of intermediate-mass black hole seeds, (Ferrara et al., 2014). The dex lower (higher) mass would increase (decrease) the maximum temperature by a factor of only (as ), which does not significantly impact the resulting diagnostics for the DCBH models.
We adopt the slope of the X-ray component with the default value, but change the power-law energy slope between the optical and X-ray bands, (Zamorani et al., 1981). The parameter corresponds to the power-law index , where , determined in the range of a few to a few thousand eV, and hereafter called for simplicity. We vary the value between , , and (see Elvis et al. 2002). The ionising spectrum shapes for the DCBH models are shown in Fig. 1(c).
We consider cases where these DCBHs are surrounded by pristine gas (zero metallicity) as well as mildly metal-enriched gas with , , , and much higher metallicities up to 111A solar chemical composition of Asplund et al. (2009) is assumed. . The model calculations are stopped when reaching a neutral column density of (Hi) cm-2, in accordance with the AGN models (Kewley et al., 2013).
We note that the direct emission of the accretion disc may be obscured along our line of sight by the presence of a dusty torus, i.e. a ‘type-2’ AGN configuration. While it is unlikely this happen in extremely metal poor systems, whose dust content is greatly reduced, we note this might be a caveat for the EW of the nebular lines, not their line ratios.
3 Results
3.1 Optical Diagnostics
3.1.1 Diagnostics involving only He and H optical lines
The rest-frame optical wavelength range will be observable for early galaxies with JWST. This section presents the photoionisation model predictions for some diagrams using the optical emission line fluxes and EWs that will be useful to identify PopIII galaxies and DCBHs.
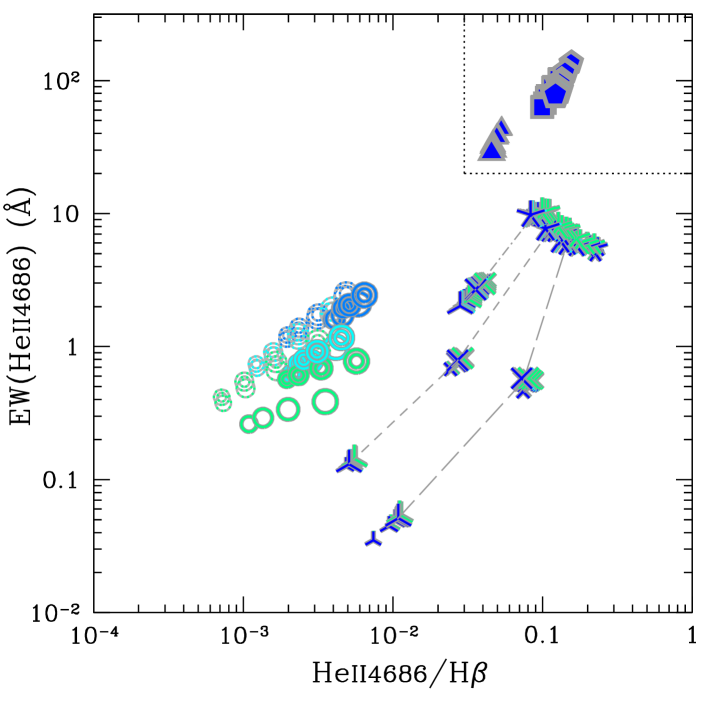
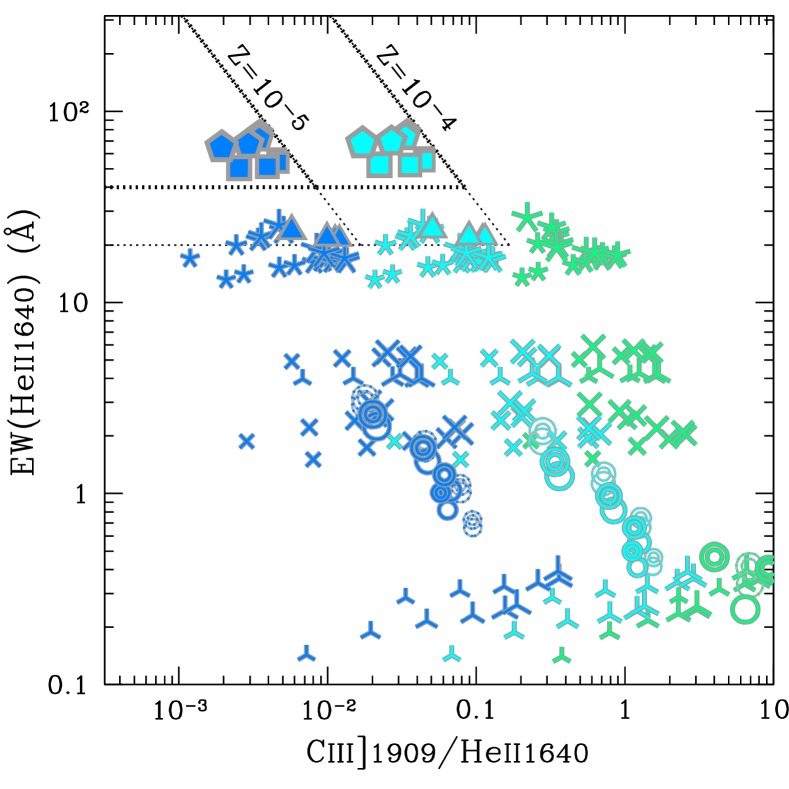
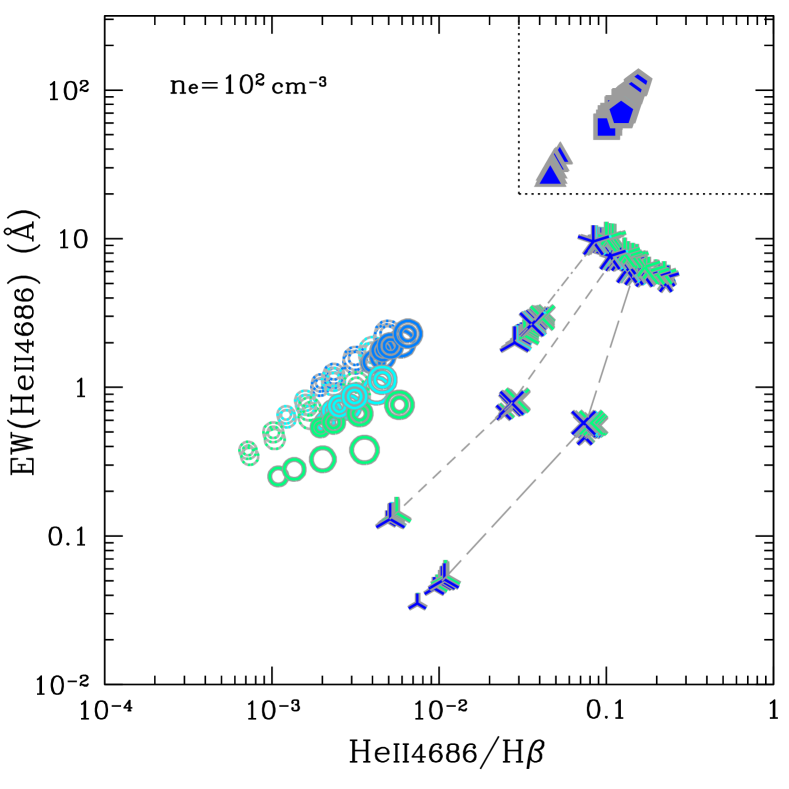
One of the key emission lines in the optical wavelength is Heii which is sensitive to the production of high energy ionising photons ( eV) and thus proposed to be useful to identify PopIII galaxies. Particularly interesting is the HeiiH ratio, as both of them are recombination lines with the same dependence on density and temperature, and their ratio is essentially traces the ratio of ionising photons at eV and at eV, hence the shape of the ionising spectrum, nearly independently of other quantities such as gas metallicity, ionisation parameter and density. The EW(Heii) has a similar diagnostic power, by giving an indication of the fraction of highly energetic photons relative to the optical, non-ionising photons, and hence a probe of the overall shape of the spectrum of the ionising sources.
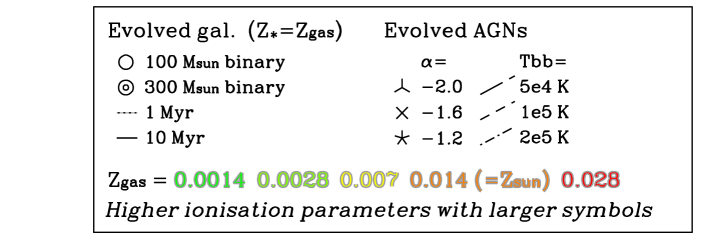
Fig. 2 presents a diagram using the key Heii observable quantities: EW(Heii) vs. HeiiH. The left panel show the primitive objects cases, i.e. zero or very low metallicity. Different colors show the metallicity level (with dark blue being zero metallicity). Solid symbols are PopIII with different IMFs. Empty symbols are PopII with different IMF and ages. Starred and cross symbols are for DCBHs. Symbols of increasing size correspond to larger ionisation parameters, both for ionisation by stellar populations and in the case of DCBH. The legend gives details of the different symbols and colors coding. The most interesting feature of this figure is that PopIII models are remarkably and distinctly positioned as having the strongest Heii emission, both in terms of EW and line ratios with respect to H, covering a completely different and disjoint region in the diagram as compared to the PopII models. The PopII models generally show a larger EW(Heii) at Myr than Myr but the difference becomes small at low-metallicity, possibly as a result of the the increase of continuum level and the increase of Heii emission at Myr, partly cancelling out each other. The different positions between the PopIII and PopII models on the diagram are clearly seen irrespective of the choice of stellar age for the PopII models. The DCBH models having the hardest ionising spectrum, with the largest power-law slope and the highest Tbb, present HeiiH ratios as large as those found in the PopIII models. However, a clear difference is seen in terms of EW(Heii), where PopIII models show a larger EW than the DCBH models. Although PopIII galaxies with an older stellar population present a decreased EW than illustrated in Fig. 2, the decrease would be within a factor of if the stellar age is younger than a few Myr (e.g., Schaerer 2003), and hence the diagram will remain useful to identify the primitive PopIII objects. We propose a selection criteria for identifying PopIII galaxies:
| (1) |
These limits are indicated by the dotted lines in Fig. 2. This diagram has some potential also in discriminating between different PopIII IMFs, with more top heavy IMFs being characterised by higher and higher . Appendix §A shows the same diagrams for different gas density models and illustrating that results and selection boundaries do not change significantly.
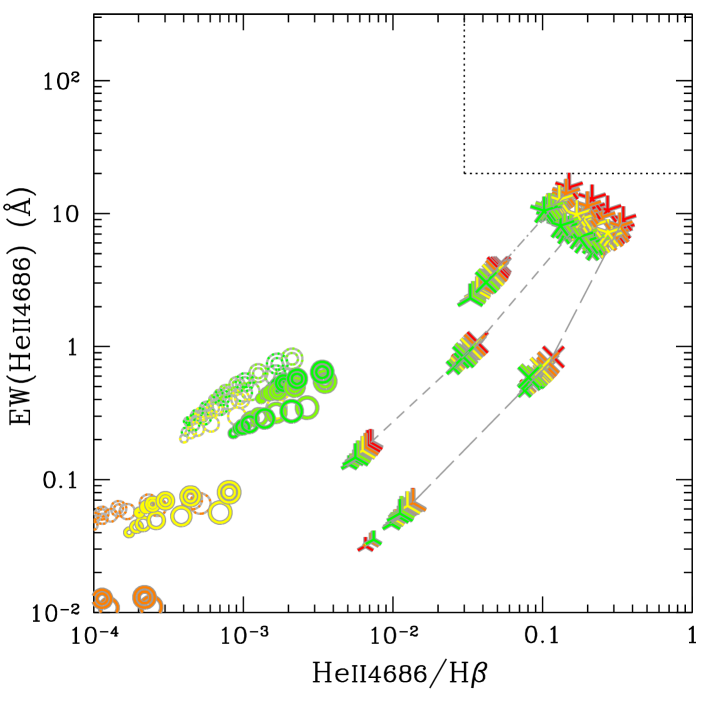
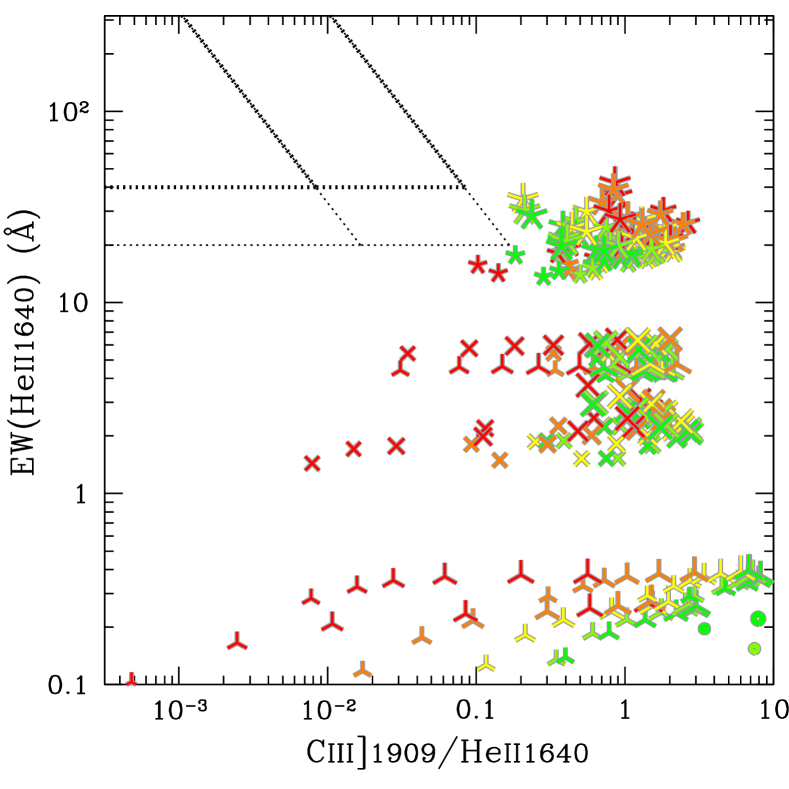
The right panel of Fig. 2 presents the same diagram for more chemically-evolved galaxies and AGNs. Symbols are the same as in the left panel and the color-coding shows different metallicities also in this case, although the metallicity range is shifted to much higher values than in the left panel. This panel illustrates that there is no contamination in the region of the PopIII galaxies on the diagram particularly for those with a top-heavy IMFs. Clearly this diagram can separate PopIII from PopII and from DCBH and evolved AGNs. However, it cannot distinguish between primeval DCBHs (in a zero/low metallicity environment) from more evolved AGNs living in a more metal enriched environment; disentangling these two classes of objects will require the inclusion of metal lines, as we will discuss later on.
It should be noted that various studies have found evidence for significant Heii nebular emission in populations of metal poor, dwarf star forming galaxies (e.g. Schaerer et al., 2019; Umeda et al., 2022). The observed equivalent width is about 1 Å, similar to what expected by our models in low metallicity regimes (especially if considering high ionisation parameters, which are indeed typically observed in low metallicity star forming galaxies). However, the HeiiH ratio observed in such low metallicity galaxies is often significantly higher () than predicted by our models. This is an issue that is faced also by other photoionisation models using stellar population templates (Senchyna et al., 2017; Senchyna et al., 2020; Chevallard et al., 2018; Umeda et al., 2022). Possible explanations that have been proposed include the contribution of X-ray binaries (e.g. Schaerer et al., 2019) and ultraluminous X-ray sources (Umeda et al., 2022), although other studies have argued against these explanations (Senchyna et al., 2020). Either of these scenarios implies the presence of an additional ionising spectral component associated with accretion on compact objects and, therefore, they are essentially equivalent to adding an AGN-like component, as indeed expected by our models. It should also be noted that the presence of AGN in a sizeable number of dwarf galaxies has been found by recent observations (e.g. Mezcua et al., 2016; Mezcua & Domínguez Sánchez, 2020; Schutte & Reines, 2022) and also suggested by recent theoretical work (Pacucci et al., 2021), so the high HeiiH ratio can actually be simply explained by the presence of AGN in many of them. However, regardless of the explanation, it remains true that the combination of high EW(Heii) and high HeiiH unambiguously identifies either PopIII or DCBH with a power law index .
We finally note that these are predictions for the Heii nebular lines. The stellar Heii emission associated with WR stars is not considered here. However, the latter, if present, should be clearly distinguishable from its broad profile (typically of the order of km s-1 or broader).
|
Other important emission lines are those associated with Hei, which should be observable even from zero-metallicity objects and can be useful to probe the ionising spectrum shape at the intermediate energy regime ( eV). Since these are primarily recombination lines, together with the Heii and hydrogen recombination lines, they would be in principle useful for determining the curvature of the ionising spectrum. However, the situation is not so simple in this case. Indeed, the relatively strong Hei recombination lines result from the cascades of Hei triplets, whose population/depopulation is affected by the collision effects (i.e., density and temperature) and the opacity properties of ISM (e.g., Izotov et al. 2014; Aver et al. 2015; Matsumoto et al. 2022). Yet, exploring the relative intensity of these lines is anyway useful.

|
|
|
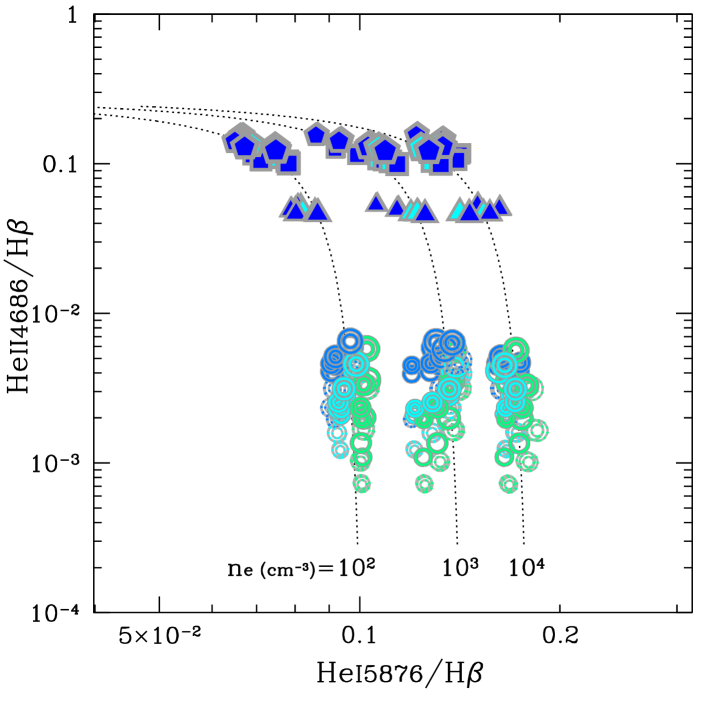
Among several Hei recombination emission lines in the optical wavelength, we firstly test with Hei as it is generally the strongest Hei line. We find, however, that the PopIII and DCBH models show a comparable HeiH ratio. Rather, the line ratio depends more on the gas density in the ISM. Fig. 3 shows a diagram of HeiH and HeiiH for the PopIII and PopII galaxies, varying the gas density from cm-3 to cm-3 in addition to the fiducial value of cm-3. Clearly the HeiH ratio increases with gas density (see also Aver et al. 2015). We therefore propose that this Hei diagram can be used to probe the gas density for metal-deficient galaxies and even for DCBHs, such that
| (2) | ||||
| (3) | ||||
| (4) |
This diagram can substitute the density indicators using the metal collisional excitation lines such as [O ii] and [S ii] which will probably not be available for primitive, extremely metal-poor sources. A caveat is that this diagram does not work accurately for chemically evolved galaxies and AGNs, because of the secondary dependence of the Hei emission on the gas temperature (and hence on the metallicity). For the evolved systems, the classical metal line ratios are preferred, as conventionally used for this purpose.
Next, we investigate a diagram using another Hei line at Å. Because Hei is the recombination lines resulting from a higher level than Hei, it can be less affected by ISM properties and depend more on the shape of ionising spectrum. Fig. 4 presents the diagram HeiH versus HeiiH. Although there is a certain amount of overlap between the PopIII galaxies and DCBHs on the diagram, some types of DCBHs can be indeed potentially disentangled from the region of overlap; specifically, objects meeting the following criteria
| (5) |
are most likely dominated by non-thermal hard ionising spectrum associated with accreting black holes. The separation is certainly less clear than in the diagram using the EW(Heii) (Fig.2), but the diagram in Fig. 4, which uses only line ratios, is not affected by the potential issue of nuclear obscuring torus that might result into an artificially higher EW of the lines.
Once again, more evolved AGNs can also fall on the same region on this diagram (as shown in the right panel) and it is hard to assess the metal-enrichment only based on the Hei diagram. One would need other diagrams using the metal lines as discussed below.
|
3.1.2 Diagnostics involving metal optical lines
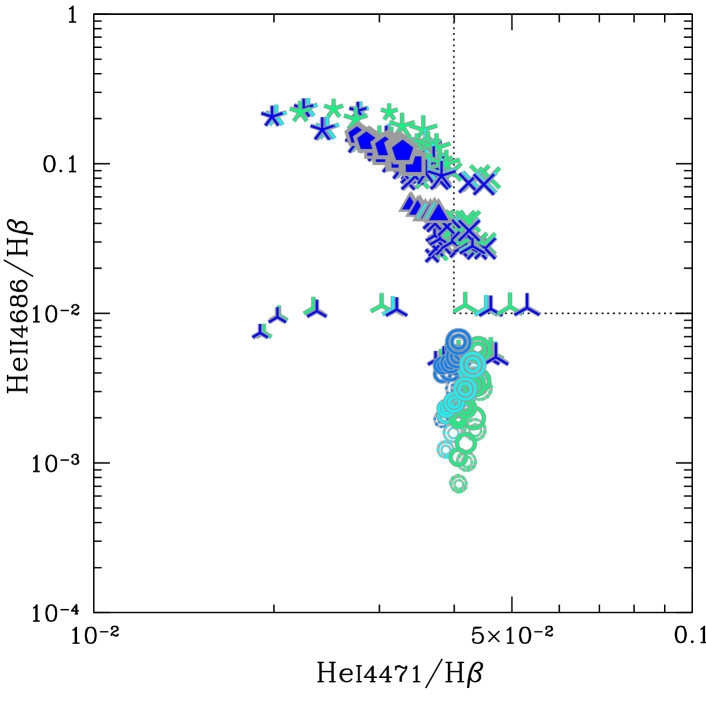
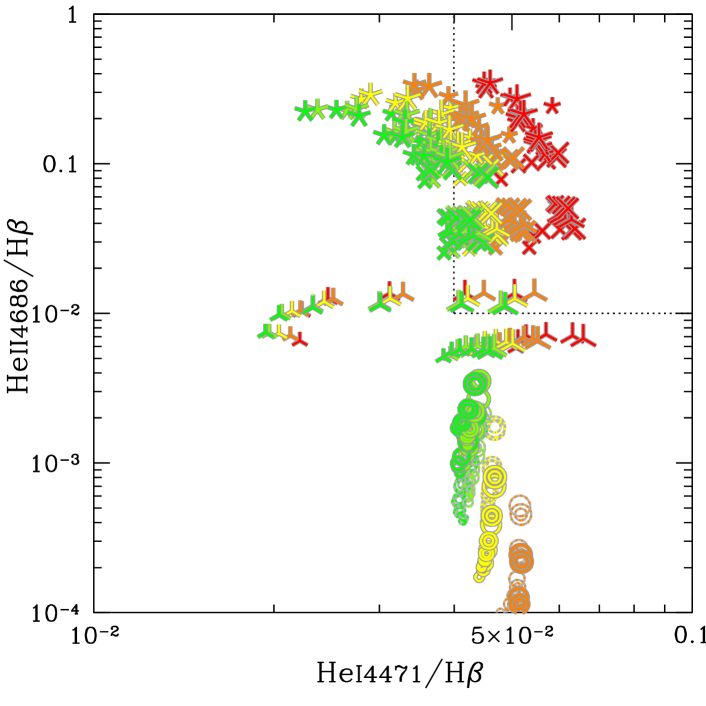
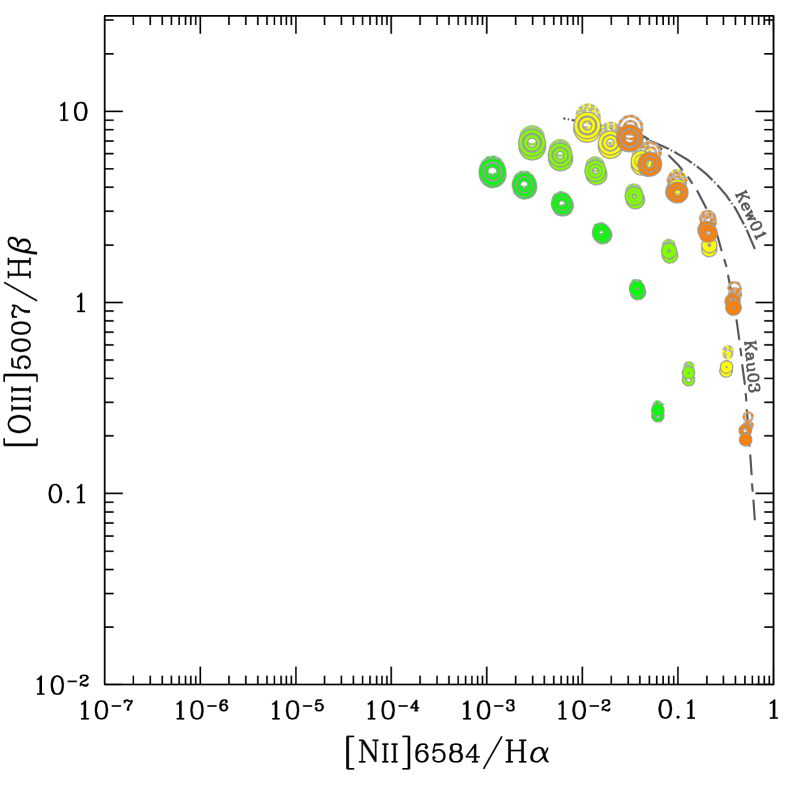
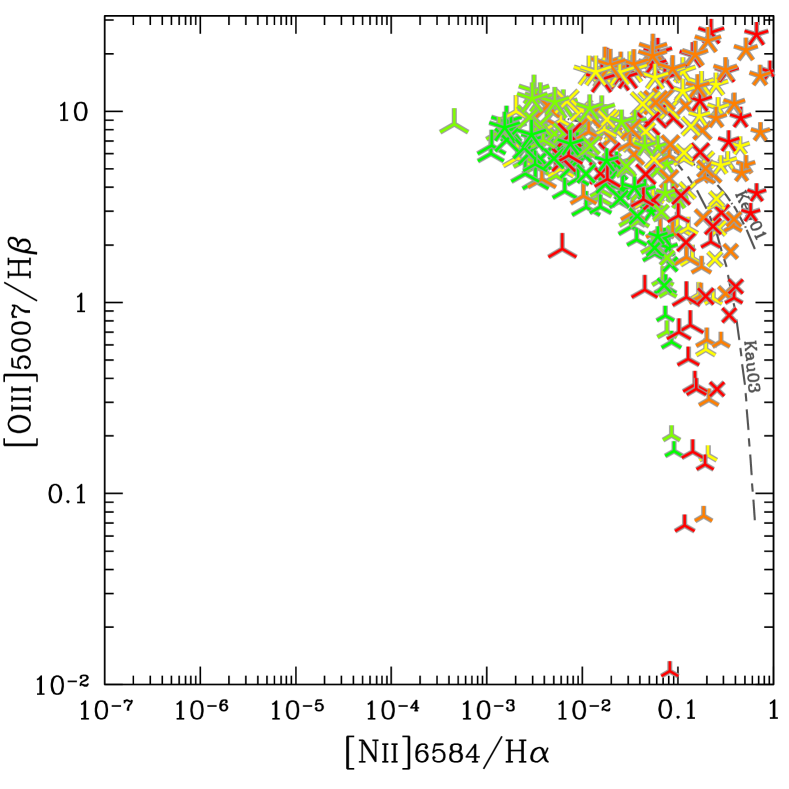
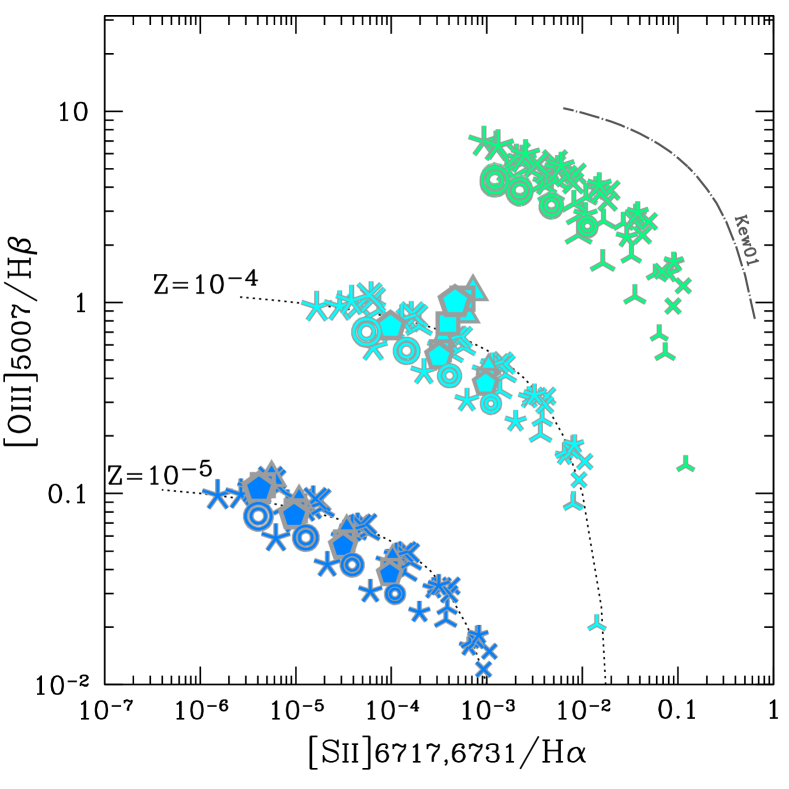
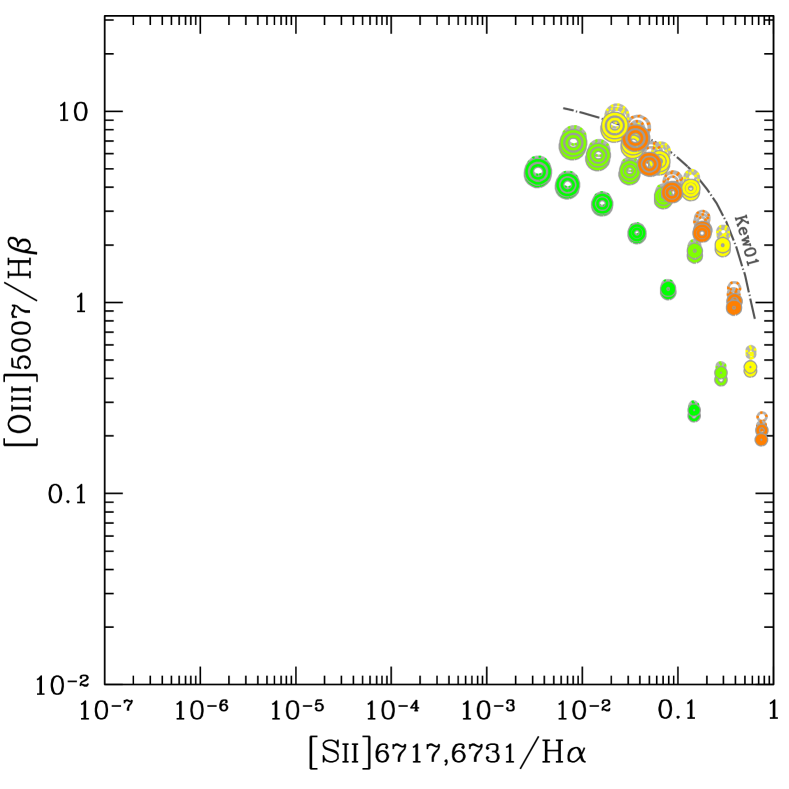
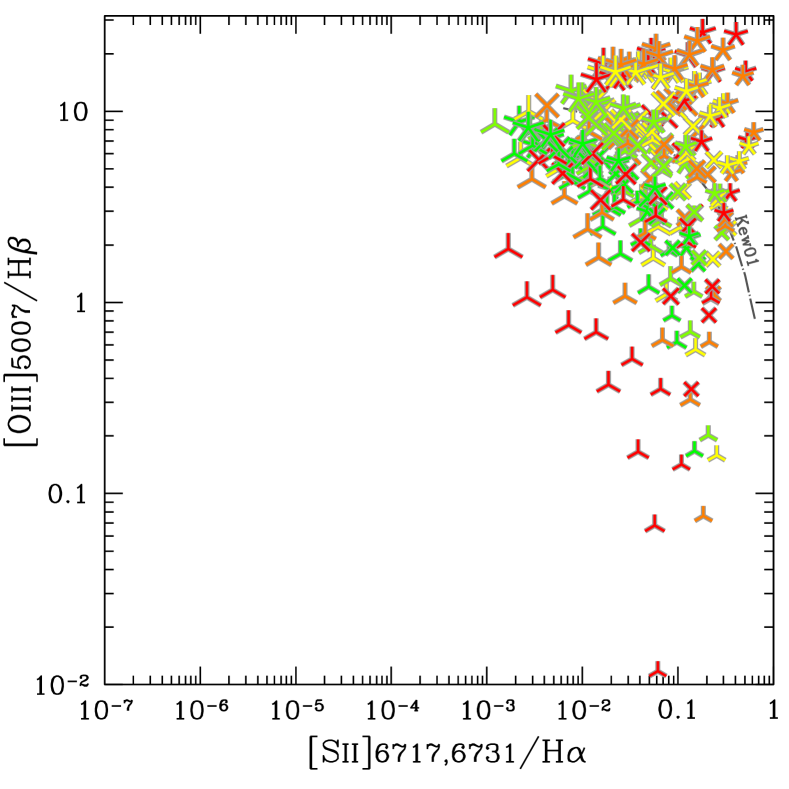
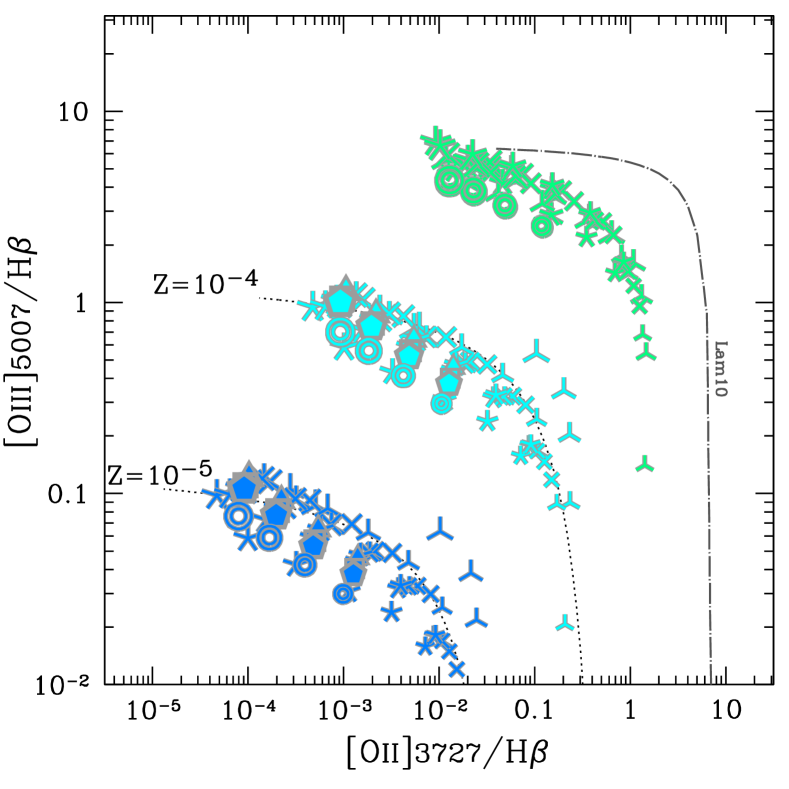
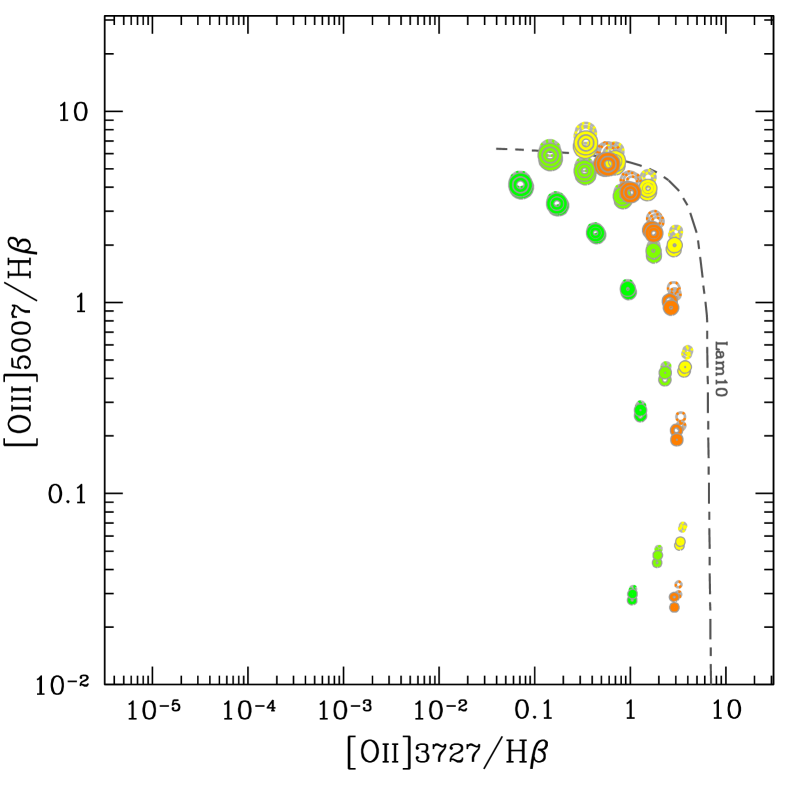
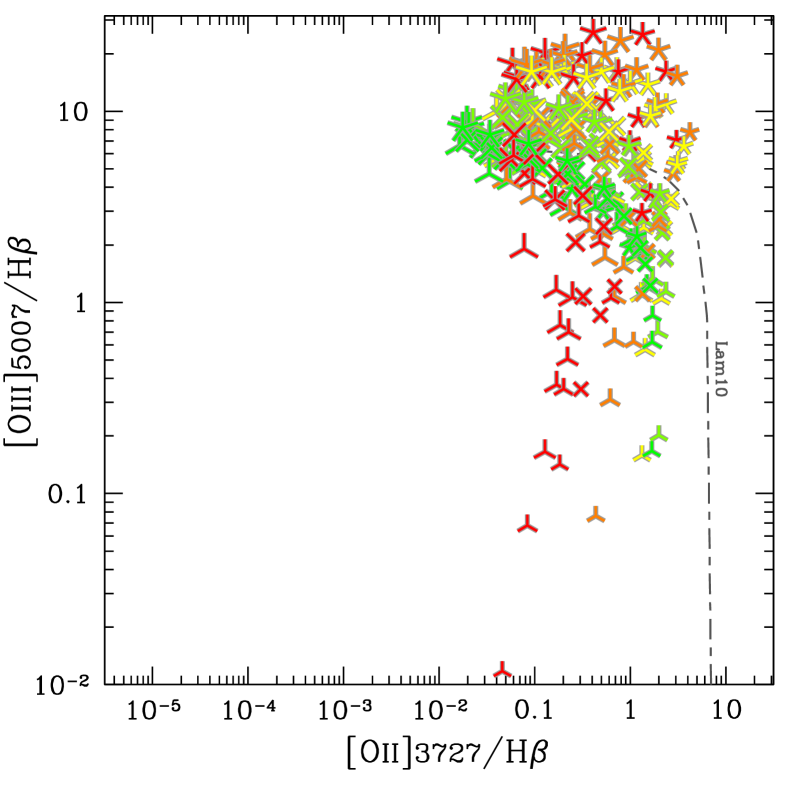
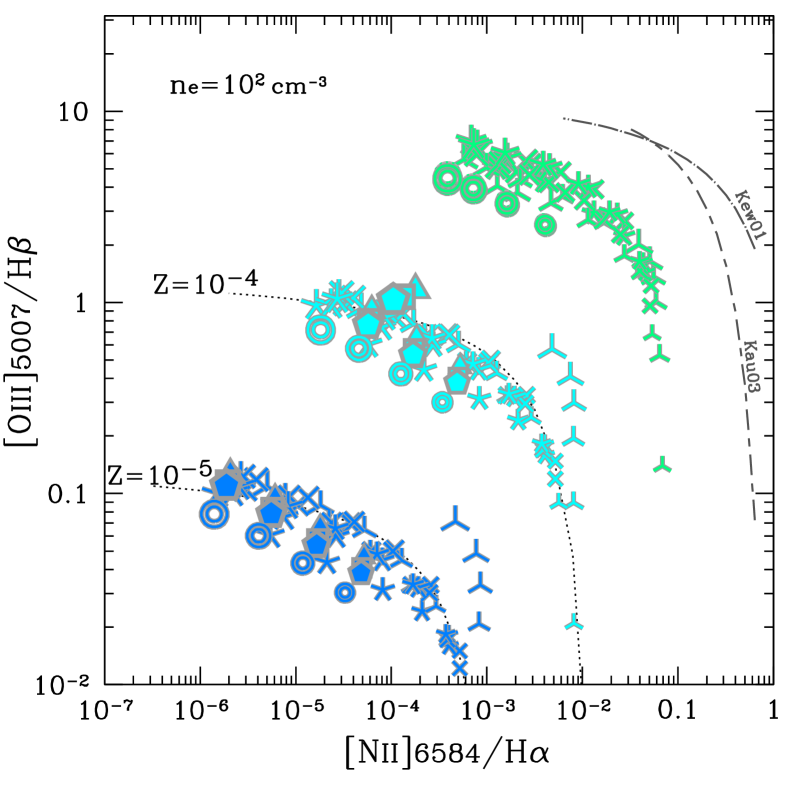
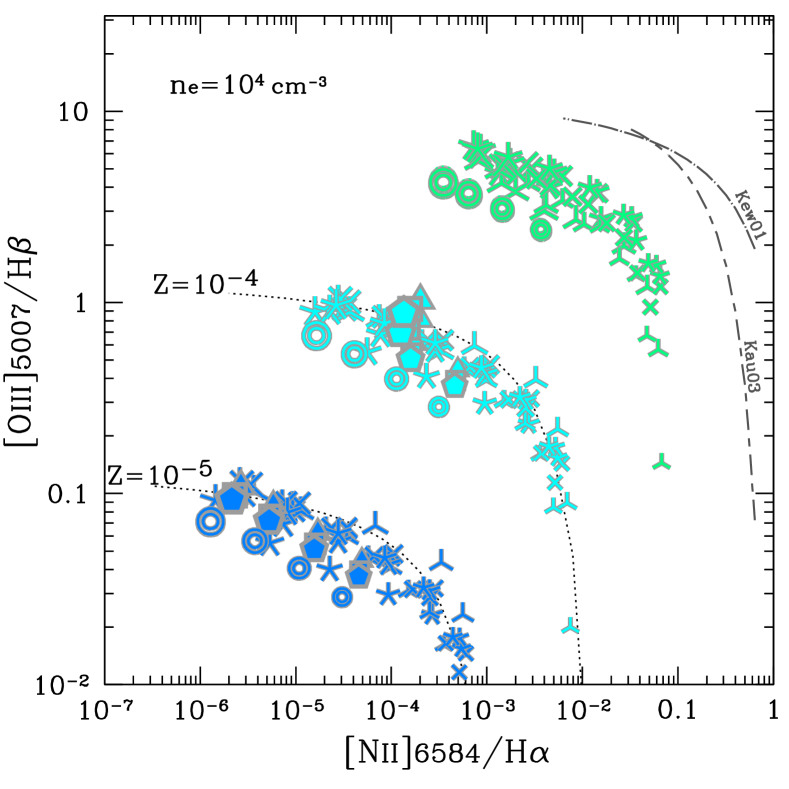
The diagrams discussed above, which use only the Hydrogen and Helium recombination lines, are useful to identify PopIII galaxies and DCBHs, but not sufficient to assess how much the surrounding ISM gas is chemically-enriched. Also, as already mentioned, DCBHs and more evolved AGNs, living in enriched ISM, would not be separable. To discriminate PopIII galaxies and DCBHs in a primitive environment from those embedded in a weakly, or even strongly, enriched ISM, optical metal lines are also needed. Fig. 5 presents three diagrams showing the line ratios of [O iii]H vs. [N ii]H (1st row), [O iii]H vs. [S ii]H (2nd row), and [O iii]H vs. [O ii]H (3rd row) 222[O ii] denotes the sum of the doublet: [O ii]. . The former two are commonly called BPT-diagrams (Baldwin et al., 1981) both widely used to separate AGNs from star-forming galaxies (e.g., Kewley et al. 2001; Kauffmann et al. 2003; Kewley et al. 2013). The left panel show the case for primeval, extremely metal-poor cases, the central panels show the case of evolved (significantly metal enriched) PopII galaxies, and the right panels show the case of chemically evolved AGNs.
In the central panels of the BPT-diagrams, we confirm that evolved star-forming galaxies follow or fall below the demarcation curves. We note that the BPT diagnostic line ratios are not significantly influenced by the choice of stellar age, and mostly governed by the youngest stellar population (see also Fig. 1b for the almost identical SEDs at and Myr for a given metallicity at eV). On the other hand as evidenced in the right panels, not all of the evolved AGN models are separable on the BPT-diagrams. AGNs with a gas-phase metallicity below Z Z⊙ can spill (and hence ‘contaminate’) into the star-forming galaxy region of the diagrams, as already indicated by Kewley et al. (2013). Moreover, the models with the least hard spectrum (), if they really exist, could not be classified as AGNs with the classical BPT diagnostics even with a super-solar metallicity gas. The diagram in the 3rd row makes use of the [O ii] and H emission in place of [N ii], [S ii], and H. This will become particularly useful when the wavelengths around H is not observationally available, e.g., for sources at with JWST/NIRSpec.
We note the evolved star-forming galaxy models in the middle panels of the [N ii] BPT-diagram shape a model grid consistent with Kewley et al. (2013) and other models results (e.g. Gutkin et al., 2016), and can reproduce the observed metallicity sequence of star-forming galaxies on the diagrams in the local universe (e.g., Maiolino et al. 2008; Curti et al. 2017; Curti et al. 2021), following the trend that the ionisation parameter typically gets larger in a more metal-deficient galaxy (e.g., Andrews & Martini 2013; Sanders et al. 2020; Nakajima et al. 2021 submitted). A similar but offsetted sequence toward a larger [O iii]H ratio is reported for galaxies in the [N ii] BPT-diagram (e.g., Steidel et al. 2014; Shapley et al. 2015; Strom et al. 2017). The sequence is also compatible with our model grid, although the physical origins of the evolution remain under debate (e.g., Curti et al. 2021).
We also note that the sequence for evolved AGN found by us is also broadly consistent with other AGN photoionisation models (e.g. Groves et al., 2006; Feltre et al., 2016).
In the extremely low-metallicity regime in the left panels, all the models of PopIII galaxies, PopII galaxies, and DCBHs follow a similar sequence for a given gas-phase metallicity with the ionisation condition varied. Although these optical metal-line diagrams have, therefore, no power to distinguish between the objects powered by different ionising sources in such a low metallicity regime below Z , they are very useful to infer the gas-phase metallicity, in a way similar to the strong line metallicity diagnostics (e.g., Maiolino & Mannucci 2019; Nakajima et al. 2021 submitted), but independently of the source of ionisation, and also allow the identification of sources that are not chemically-evolved at all.
Using the low-metallicity models found in the left panels, we define the average relationships as follows:
| (6) | ||||
| (7) | ||||
| (8) |
for a metallicity of , and
| (9) | ||||
| (10) | ||||
| (11) |
for .
Very interestingly, we note that the [O iii] line remains relatively strong (at the level of one tenth of H; see also Inoue 2011) even at extremely low metallicities, down to , probably as a consequence of the fact that even a small amount of oxygen rapidly makes its collisionally excited transitions good coolant of the ISM. Objects that fall below the curves are good candidates of PopIII galaxies or DCBHs just formed in a totally primitive environment. As mentioned, even galaxies at or can actually be hosting PopIII galaxies or DCBHs embedded in slightly enriched ISM. The EW(Heii) diagram (Fig.2) and the Hei diagram (Fig.4) will then be powerful to distinguish between the two ionising spectral shapes, i.e., PopIII stars vs. DCBHs.
3.2 UV Diagnostics
3.2.1 Diagnostics using only He and H UV lines
In this section we present the photoionisation model results for the UV emission lines. A major advantage of using the UV emission lines is that they are available for high-redshift galaxies even with the ground-based NIR instruments.
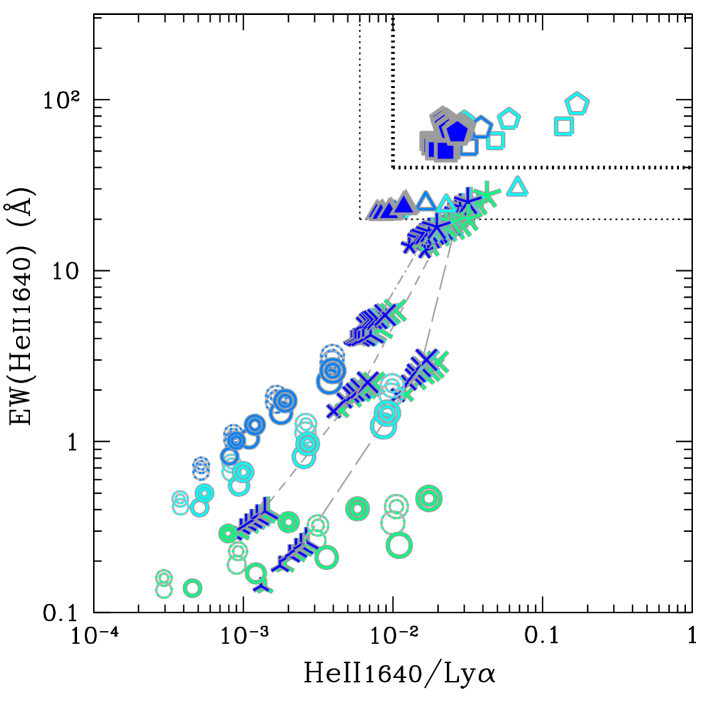
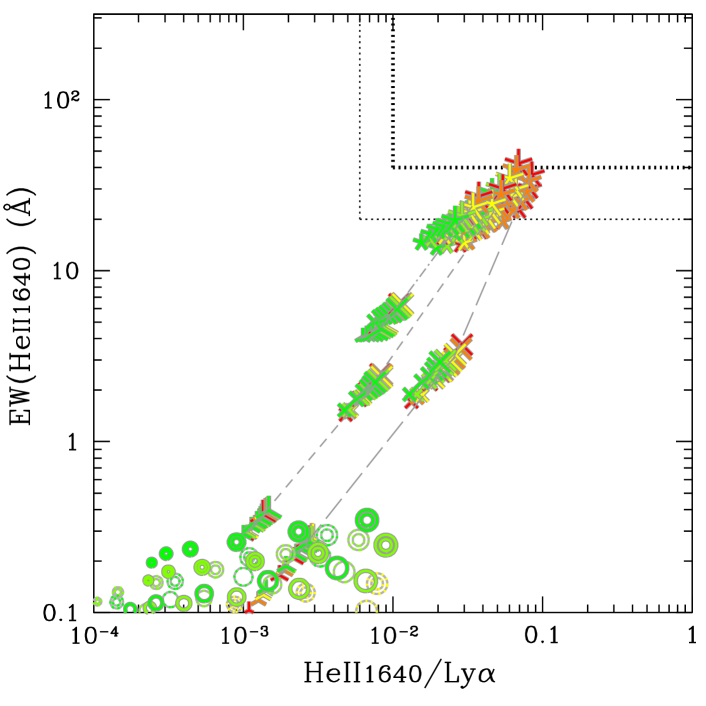
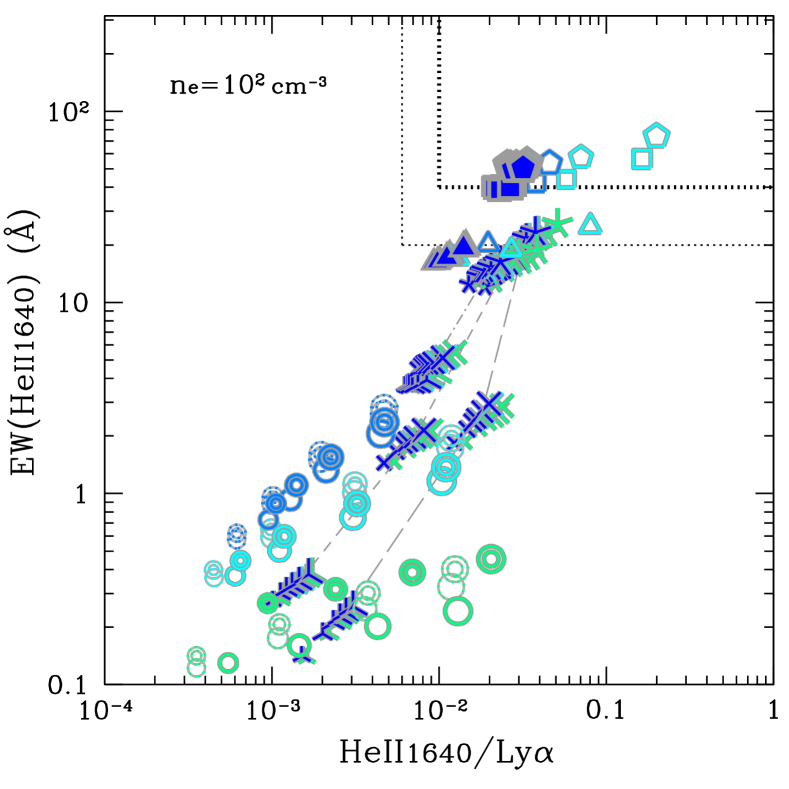
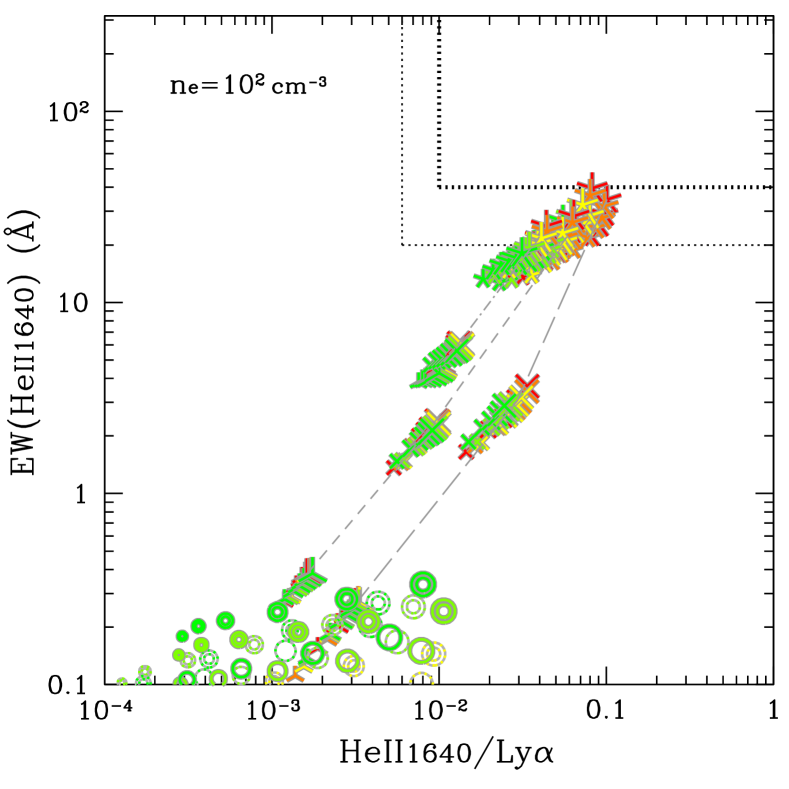
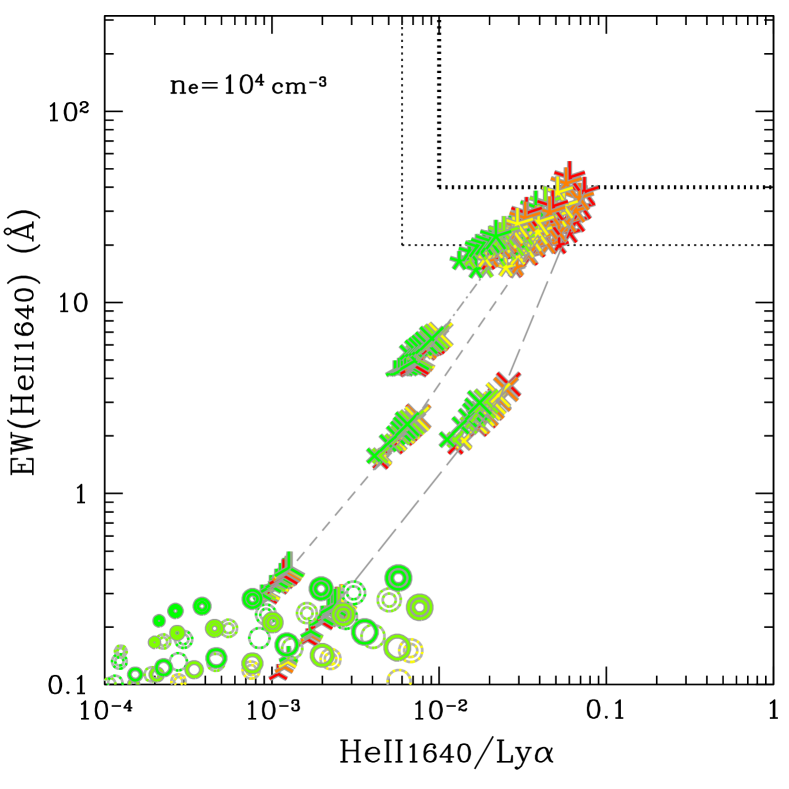
Fig. 6 focuses on the UV Heii emission at Å, showing EW(Heii) as a function of HeiiLy. One caveat is that the Ly strengths used here are simply predicted by our Cloudy models truncated at the edge of the ionised nebula (§2), and thus supposed to be the maximum value emitted from the cloud. Neutral hydrogen gas and dust in the systems would weaken the Ly emission. Indeed, the dust-included PopIII models supplementarily plotted in Fig. 6 (hollow triangles, squares and pentagons) show a weakened Ly and thus a higher HeiiLy ratio, even higher by a factor of for the Z models. EW(Heii) would also become enhanced if dust is included due to a weaker continuum level, but the effect is expected to be minor, by a factor of , as this is a secondary, differential effect. Ly would also be absorbed by the inter-galactic medium (IGM) at high redshift, in particular for sources at, or beyond, the reionisation epoch (). The HeiiLy ratios presented in Fig. 6 are therefore regarded as the lower-limits.
|
Using the predicted emission line strengths for the populations on this diagram, we propose the following selection criteria for selecting PopIII galaxies:
| (12) |
which are traced by thick dotted lines in Fig. 6. These are based on the top-heavy IMF models reaching the maximum mass-cut of which are located in a distinct region on this diagram. PopIII galaxies following such a top-heavy IMF, including the extreme one containing only massive stars of , are separable from the other population on this UV Heii diagram. The PopIII models with the moderate ( Salpeter) IMF, on the other hand, present a maximum EW(Heii) of Å, which is comparable to the predicted EWs for the hardest DCBH/AGN models, and hence indistinguishable from each other on this diagram. The criteria of Eq. (12) is thus optimised to identify PopIII galaxies and minimise contaminations by DCBHs. In order to build a more complete sample of PopIII galaxies with a certain contamination by DCBHs allowed, the following, less strict criteria can also be useful:
| (13) |
The choice of stellar age for the PopII models does not affect the PopIII selection
criterion on the diagram, as it was the case for the optical EW(Heii) diagnostic (Fig. 2).
In short, the UV Heii emission provides a good diagnostic to distinguish between
PopIII galaxies and DCBHs, although the optical Heii has a better and more sharp
discriminatory power.
|

|
3.2.2 Diagnostics using UV metal lines
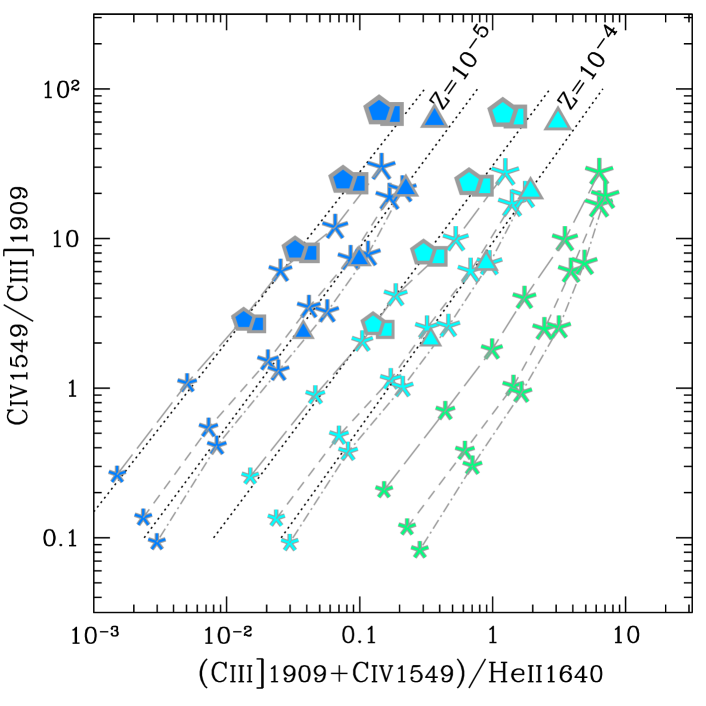
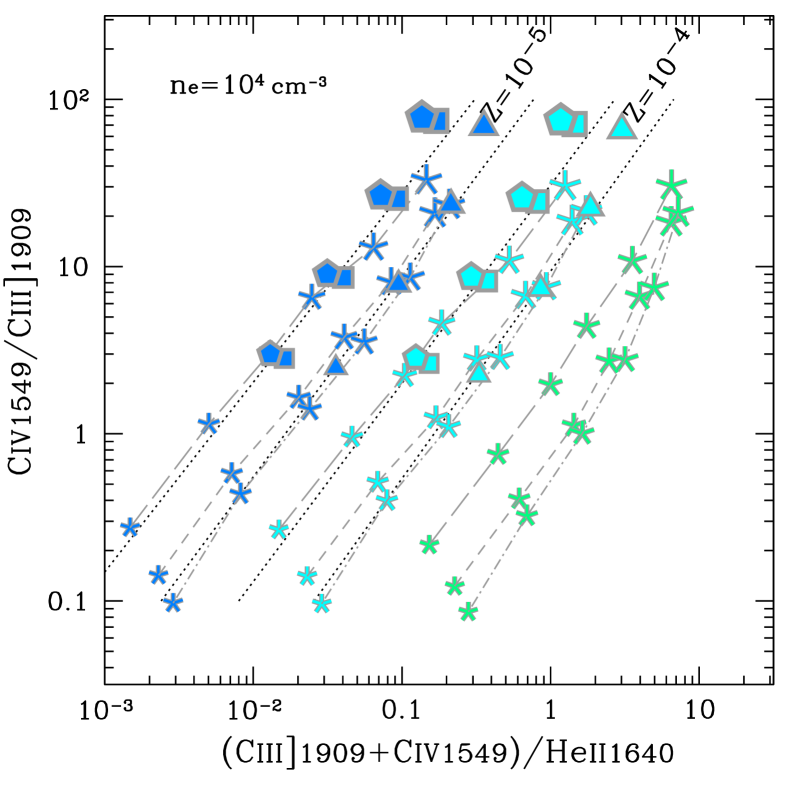
To diagnose the chemical enrichment of the ISM (even in the case of mildly enriched gas photoionised by PopIII stars) using the UV emission lines alone, we propose to combine Heii with the UV metal lines of [C iii], C iii] (hereafter their sum is referred to as Ciii], or simply Ciii]) and Civ (hereafter Civ, or Civ). Fig. 7 displays the diagram correlating the (Ciii]Civ)Heii ratio and the CivCiii] ratio, each of which is named C34 and C4C3, respectively. In the left panel, we only plot PopIII galaxies and the DCBH models with the hardest ionising spectrum () that are to be selected with the above EW(Heii) diagnostic (Eqs. 12 or 13). The C34-index is informative to probe the gas metallicity, although the secondary dependence on the ionisation condition is not negligible. The C4C3-index on the ordinate axis is then helpful to resolve the degeneracy and allows this diagram to infer the gas metallicity together with the ionisation parameter (see also, e.g., Nakajima et al. 2018).
The diagram indeed shows the power to diagnose the gas metallicity. Following the distributions of the models on the left diagram, we define two metallicity sequences for these primitive sources: Group A is for the PopIII galaxies with top-heavy IMF ( , (pentagons and squares) and DCBHs with T 5e4 K (star symbols connected with a long-dashed line), and another group (Group B) for the other models. Each group shapes a relatively tight sequence on this diagram for a given metallicity, with Group A showing a systematically stronger Heii and/or a higher CivCiii] ratio than Group B. The relationships are formulated as follows:
| (14) | ||||
| (15) |
to trace sources with Z , and
| (16) | ||||
| (17) |
for Z .
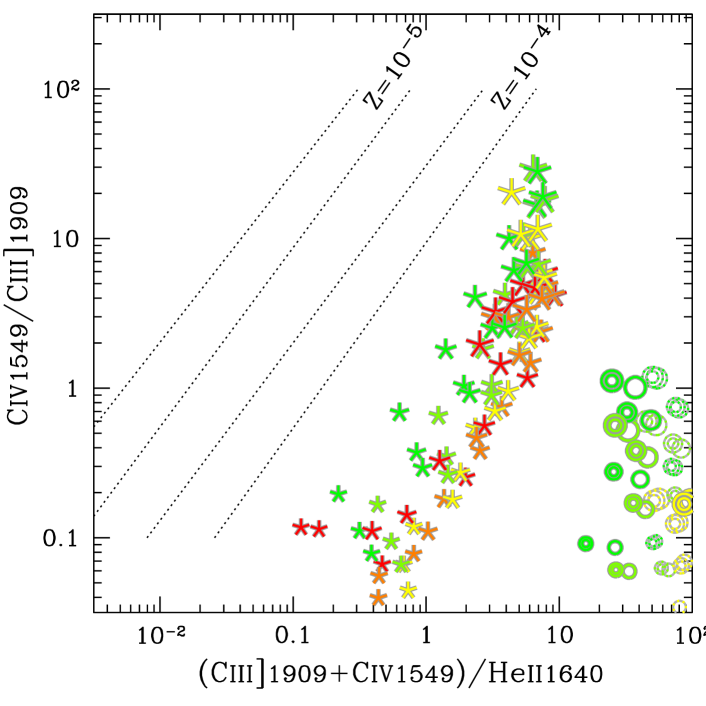
In the right panel of the same figure, metal-rich models of AGNs () and PopII galaxies are shown on the diagram. They present a larger C34 value, as expected, than the primitive sources for a given C4C3, and well apart from the and sequences above. The relationships thus provide a good measure of gas metallicity in such a low metallicity regime if all the necessary emission lines are available. Particularly, PopIII galaxies with top-heavy IMF would be robustly selected following the strict selection criterion (Eq. 12) and whose metallicity be inferred following the above relationships of Group A.
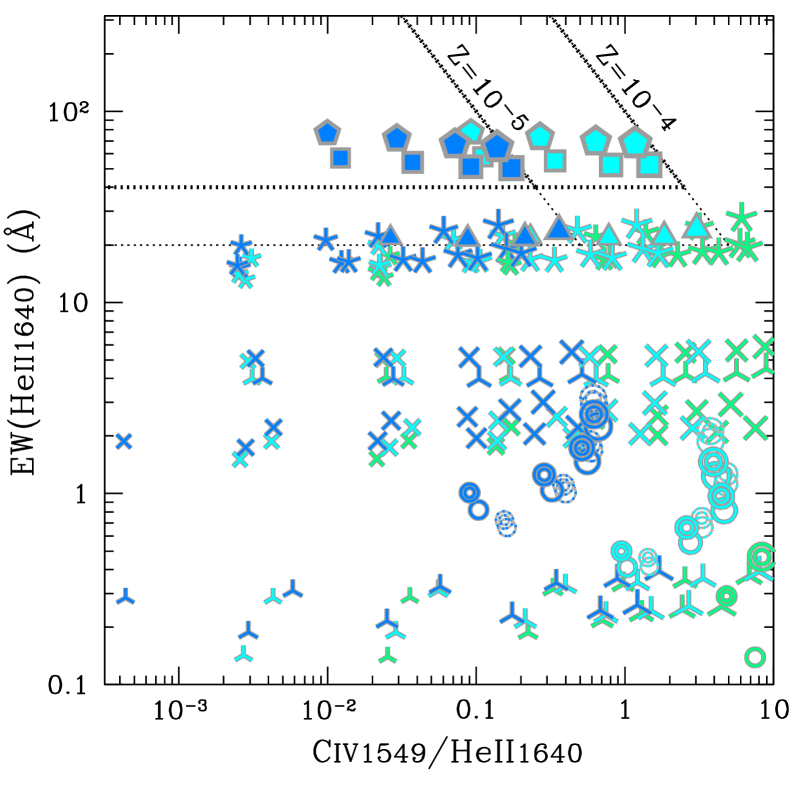
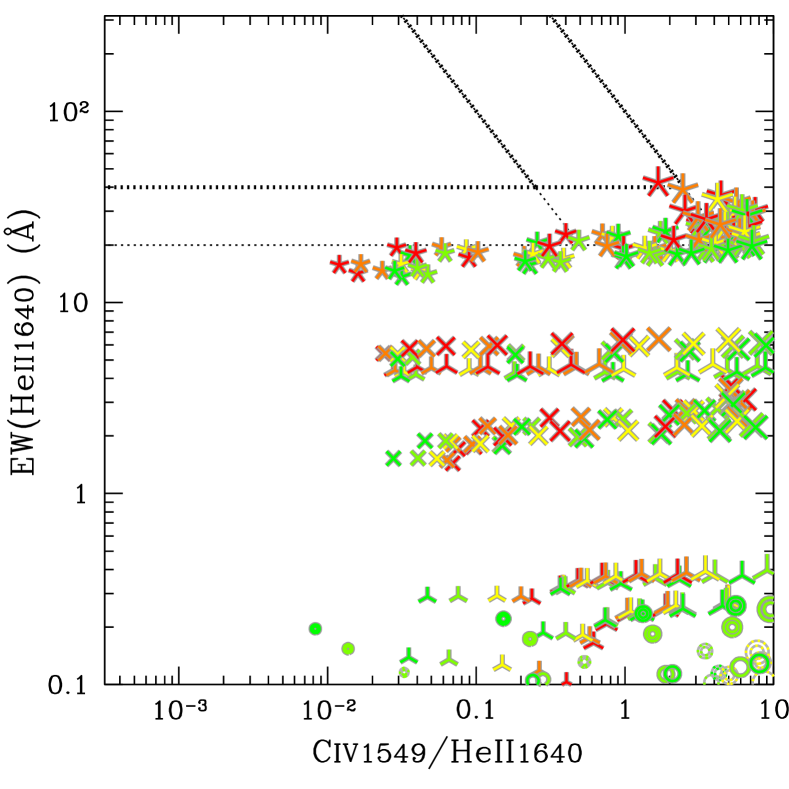
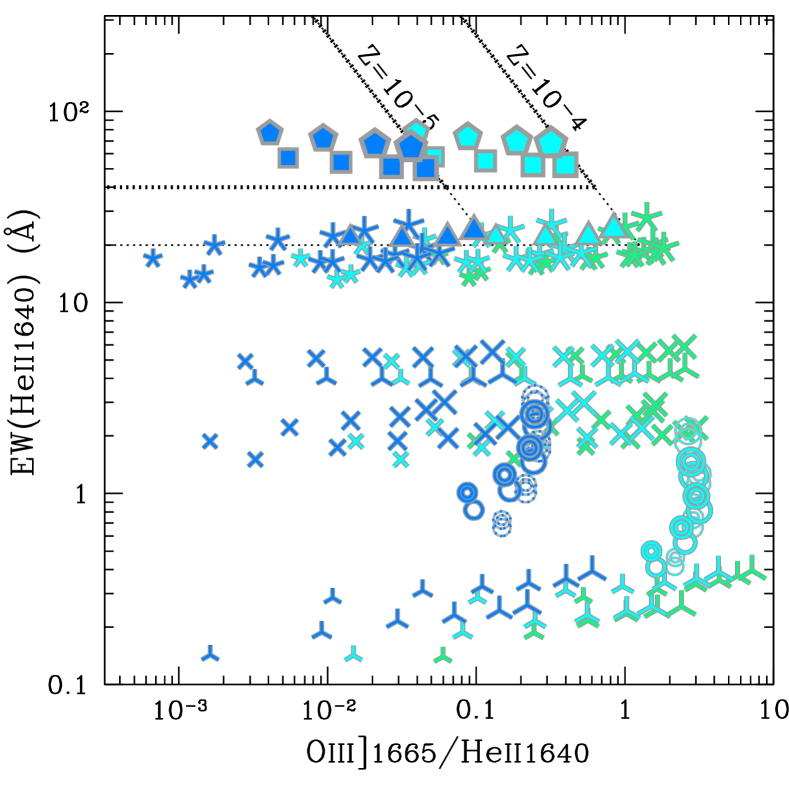
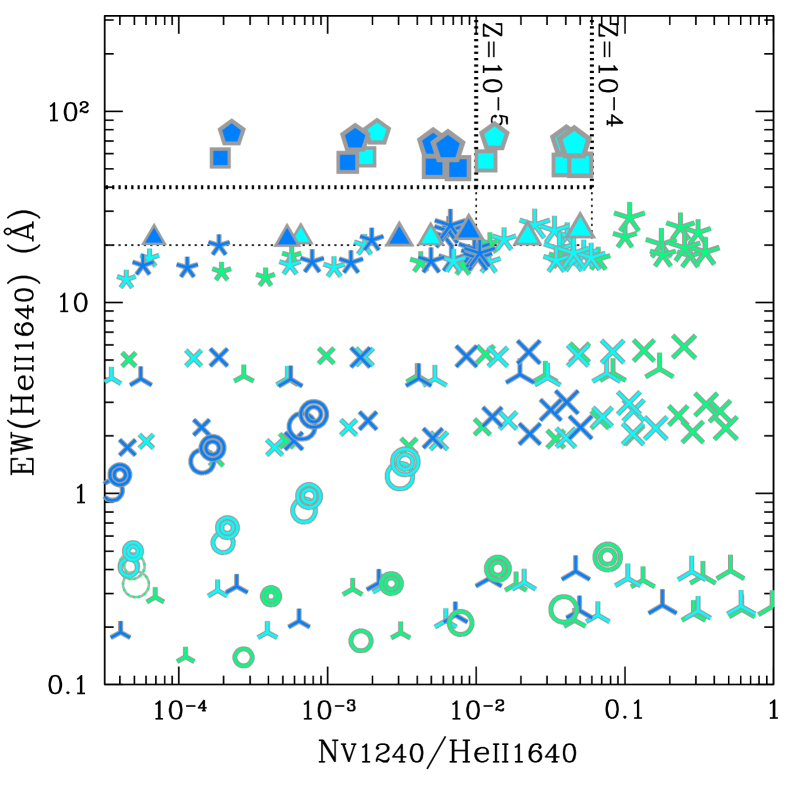
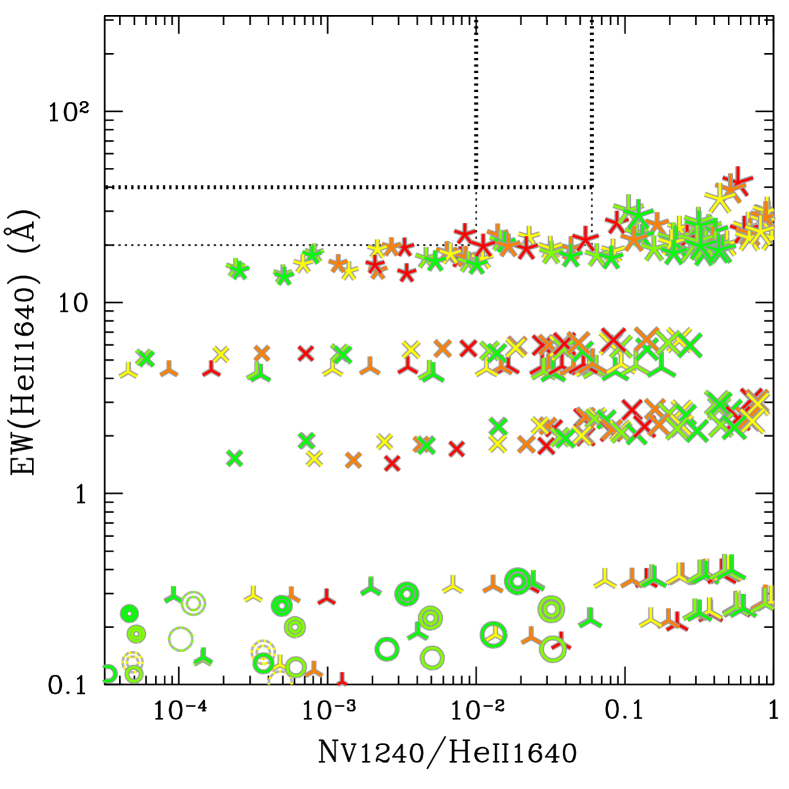
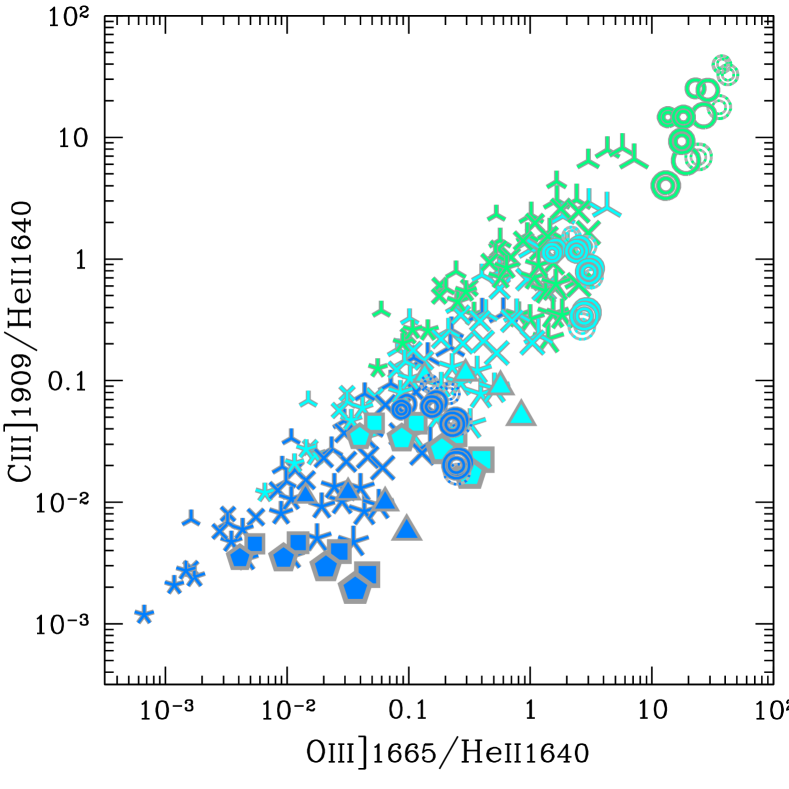
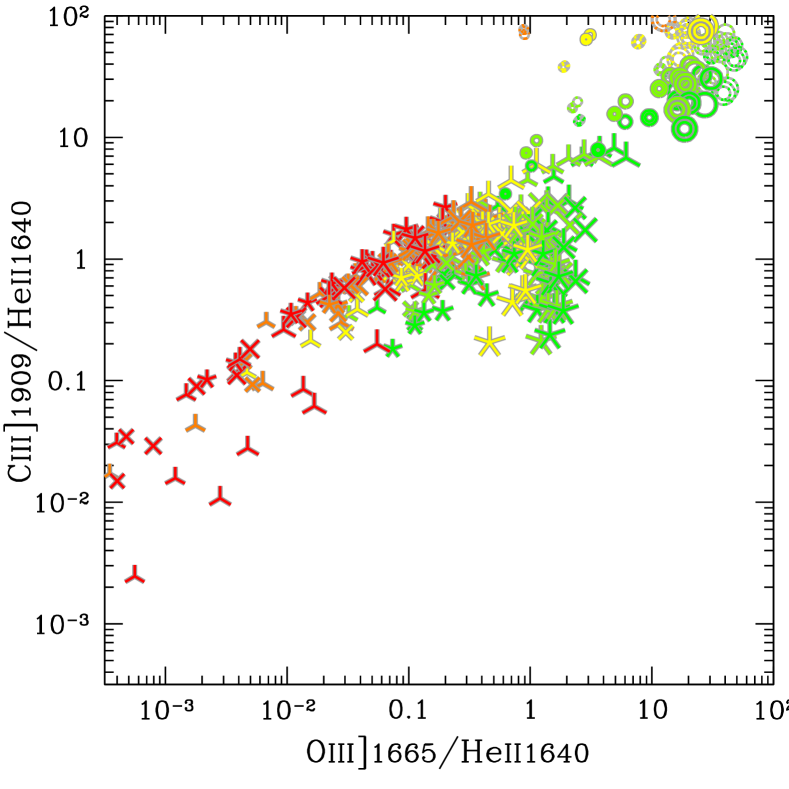
It is also expected that not all of the necessary lines are always available from sources in the early universe. To provide a substitute to probe the chemical enrichment of the ISM in an efficient way with limited spectroscopic measurements, we summarise in Fig. 8 the model distributions on diagrams which employ a single metal line each, in addition to Heii. The considered metal lines include O iii] (hereafter O iii], or O iii]) and Nv(hereafter Nv, or Nv) in addition to Ciii] and Civ. For each of the diagrams, we can define the diagnostic regions defined by
| (18) | ||||
| (19) | ||||
| (20) | ||||
| (21) |
to select galaxies with a gas phase metallicity below , and
| (22) | ||||
| (23) | ||||
| (24) | ||||
| (25) |
for galaxies below . Note that EW(Heii) in the above equations should be in units of Å in the rest frame.
|
We highlight the very interesting result that the Civ emission remains as strong as Heii even if the gas metallicity
falls below , potentially at the level of about one tenth of HeII even at , although the strength largely depends on the
ionisation state of ISM as seen with different symbols sizes
as the ionisation parameter varies.
Moreover, the line ratio would not always work for DCBHs,
especially for those whose EW(Heii) falls below Å,
where metal-enriched AGNs even with a super-solar metallicity
can be found to have a comparable CivHeii ratio.
A similar situation applies to the O iii] and Nv diagrams.
The Ciii] diagram appears to provide a more clean metallicity measurement
for PopIII galaxies and DCBHs with smaller uncertainties associated with ionisation condition
variations and contamination by metal-rich sources,
although the Ciii] line is generally predicted to be weak and its observation
becomes challenging from the primitive sources.
Finally, we note that the C4C3-C34 diagram (Fig. 7) in Nakajima et al. (2018) is partly used to separate AGNs from star-forming galaxies. We reaffirm that the separation method works for galaxies with a gas metallicity higher than Z⊙, and that sources dominated by PopIII stars and AGNs are not distinguishable, as cautioned by Nakajima et al. (2018) and illustrated in Fig. 7 (left).
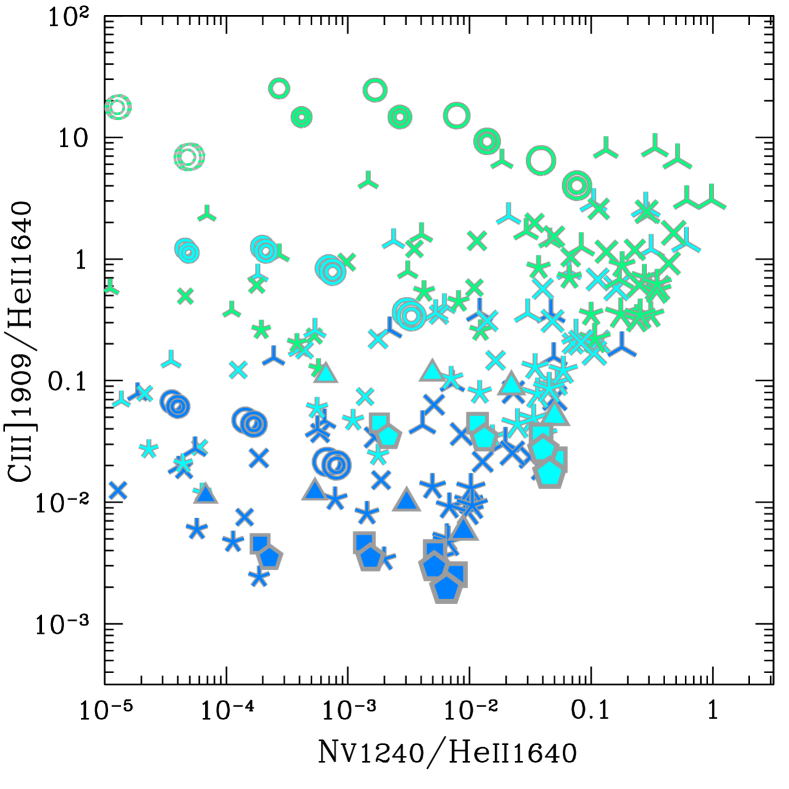
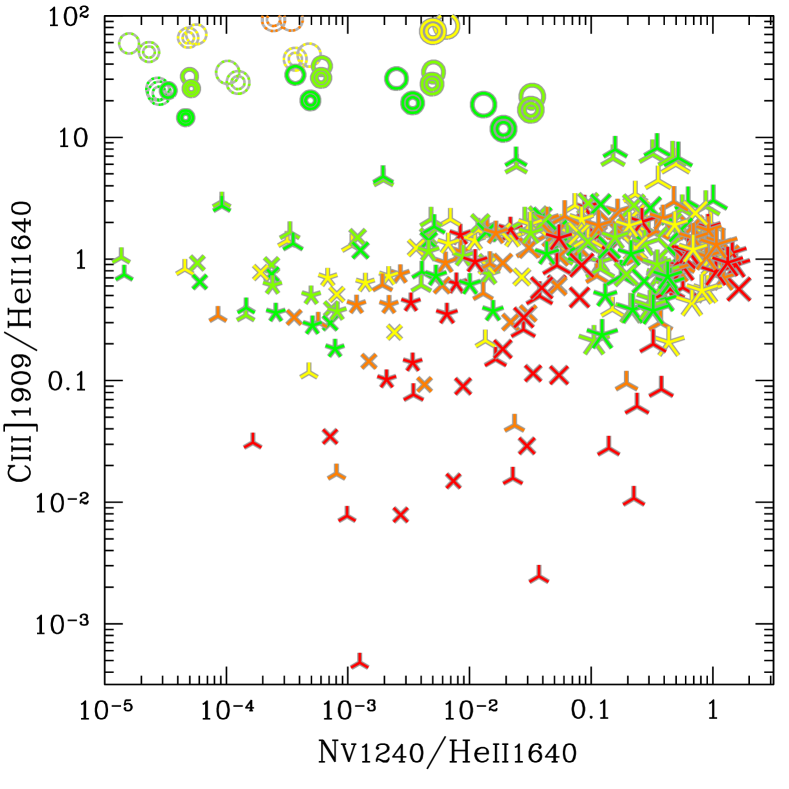
In Fig. 9, we also examine the other popular UV diagnostics combining Ciii], O iii], Nv, and Heii (Feltre et al. 2016; Gutkin et al. 2016; Laporte et al. 2017; Hirschmann et al. 2019; Saxena et al. 2020). As seen on the the C4C3-C34 diagram, the PopIII models are not well discriminated from other classes of metal-poor DCBHs and/or AGNs, and, more generally, discriminating different classes of targets and metallicities is difficult on these UV diagrams. Yet, it is confirmed that the Nv/Heii ratio (right panels in Fig. 9) is powerful in discriminating AGN and PopII galaxies in the metal rich regime.
As an additional caveat of these diagrams, one should take into account that they depend on the assumptions of metal abundance ratios such as C/O and N/O. Although our adopted prescriptions of the metal abundances are known to be generally valid for local Hii regions and star-forming galaxies on average (Hayden-Pawson et al., 2021), they are subject to significant dispersion, which could be increased by some systematic uncertainties at high-redshift. It would be recommended to directly constrain the metal abundance ratios using appropriate sets of emission lines if all the necessary lines are available (e.g., Pérez-Montero & Amorín, 2017; Hayden-Pawson et al., 2021) to correctly interpret observations. Yet, our assumptions provide a reasonable first step to explore the behaviours of these nebular emission lines, offering the diagnostics which will be useful even when limited sets of emission lines are observationally available.
4 Discussion and Summary
We have presented Cloudy photoionisation models predictions of the rest-frame optical and UV emission line strengths for PopIII galaxies and DCBHs, and we have proposed several diagnostic diagrams to select and distinguish between these early sources and more-evolved systems. The modelling reveals that it is possible to separate PopIII galaxies from other kind of primeval object, and in particular primeval black hole seeds (Direct Collapse Black Holes, DCBHs) by utilising the Heii emission lines, both in the optical and UV, in conjunction with the other lines probing a wider range of ionising spectral shapes. Moreover, metal line diagrams allow the characterisation of the ISM properties, including gas metallicity and density in extreme conditions, including the exploration of scenarios in which PopIII or DCBH are embedded in slightly enriched ISM, and paving the way for an exploration of primitive sources (Z ) in the early universe.
Among the most important diagnostics that we have identified, and interesting findings, we summarise the following:
-
•
The EW of the Heii optical line at 4686Å is the best discriminator of PopIII galaxies. A threshold of EW(Heii) 20Å discriminates well PopIII from PopII and from DCBH. Along with the HeiiH ratio, the EW(Heii) can also discriminate among PopIII with different IMFs. The EW of the Heii UV transition at 1640Å has a similar good diagnostic power, although not as sharp as the optical line.
-
•
DCBHs can be distinguished well from PopIII and PopII on the EW(Heii) vs. HeiiH diagram. The equivalent diagram in the UV, i.e. EW(Heii) vs. Heii Ly diagram, unfortunately does not have the same discriminatory power, although still useful to discriminate PopIII with top-heavy IMF.
-
•
Very low metallicity systems, including PopIII and DCBH embedded in low metallicity ISM (), can be distinguished well from more evolved, moderate/high metallicity systems (PopII and AGN in metal-rich environments) through the optical diagrams [O iii]H vs. [N ii]H, or vs. [S ii]H, or vs. [O ii]H. In particular, candidate DCBH in a primeval ISM, identified through the previously suggested diagrams, can be distinguished well from more evolved AGN through the optical BPT diagrams. The trends of the UV lines are more complex, but we have identified tight sequences in the Civ Ciii] vs. (Ciii]+Civ)Heii diagram that can diagnose the ISM metallicities embedding PopIII and DCBHs.
-
•
Interestingly, the [O iii] optical transition remains strong even in very low metallicity regimes, by being as strong as H at and only 10 times fainter than H at . Similarly, the Civ UV transition can be as strong as Heii even at metallicities below , and, potentially, only 10 times fainter than Heii at . Therefore, galaxies with [O iii]/H0.1 and Civ/Heii 0.1 are good candidates for hosting PopIII or DCBH in a pristine or slightly enriched environment.
-
•
Finally, the Hei/H ratio, together with the Heii/H ratio, is a good diagnostic of the gas electron density in the very low metallicity regime (where other density diagnostics associated with metal lines are not detectable).
While the focus of this work is to provide diagnostics for data that will be obtained in the early universe by forthcoming facilities (e.g. JWST and ELT), some of the currently available observations of local and high redshift galaxies can already be interpreted in the contest of these diagnostics. Such a comparison will be presented in a forthcoming, parallel paper.
Acknowledgements
We thank the anonymous referee for helpful comments and discussions that improved our manuscript. KN acknowledges support from JSPS KAKENHI Grant JP20K22373. RM acknowledges ERC Advanced Grant 695671 QUENCH, and support from the UK Science and Technology Facilities Council (STFC). RM also acknowledges funding from a research professorship from the Royal Society.
Data Availability
The data presented in this article will be shared on reasonable request to the corresponding author.
References
- Abel et al. (2002) Abel T., Bryan G. L., Norman M. L., 2002, Science, 295, 93
- Amorín et al. (2017) Amorín R., et al., 2017, Nature Astronomy, 1, 0052
- Andrews & Martini (2013) Andrews B. H., Martini P., 2013, ApJ, 765, 140
- Asplund et al. (2009) Asplund M., Grevesse N., Sauval A. J., Scott P., 2009, ARA&A, 47, 481
- Aver et al. (2015) Aver E., Olive K. A., Skillman E. D., 2015, J. Cosmology Astropart. Phys., 2015, 011
- Baldwin et al. (1981) Baldwin J. A., Phillips M. M., Terlevich R., 1981, PASP, 93, 5
- Barrow et al. (2018) Barrow K. S. S., Aykutalp A., Wise J. H., 2018, Nature Astronomy, 2, 987
- Beckmann et al. (2019) Beckmann R. S., et al., 2019, A&A, 631, A60
- Bowler et al. (2017) Bowler R. A. A., McLure R. J., Dunlop J. S., McLeod D. J., Stanway E. R., Eldridge J. J., Jarvis M. J., 2017, MNRAS, 469, 448
- Bromm et al. (2002) Bromm V., Coppi P. S., Larson R. B., 2002, ApJ, 564, 23
- Chevallard et al. (2018) Chevallard J., et al., 2018, MNRAS, 479, 3264
- Chon et al. (2021) Chon S., Omukai K., Schneider R., 2021, MNRAS, 508, 4175
- Cullen et al. (2019) Cullen F., et al., 2019, MNRAS, 487, 2038
- Curti et al. (2017) Curti M., Cresci G., Mannucci F., Marconi A., Maiolino R., Esposito S., 2017, MNRAS, 465, 1384
- Curti et al. (2021) Curti M., et al., 2021, arXiv e-prints, p. arXiv:2110.11841
- Dopita et al. (2006) Dopita M. A., et al., 2006, ApJS, 167, 177
- Dors et al. (2014) Dors O. L., Cardaci M. V., Hägele G. F., Krabbe Â. C., 2014, MNRAS, 443, 1291
- Eldridge et al. (2017) Eldridge J. J., Stanway E. R., Xiao L., McClelland L. A. S., Taylor G., Ng M., Greis S. M. L., Bray J. C., 2017, Publ. Astron. Soc. Australia, 34, e058
- Elvis et al. (2002) Elvis M., Risaliti G., Zamorani G., 2002, ApJ, 565, L75
- Feltre et al. (2016) Feltre A., Charlot S., Gutkin J., 2016, MNRAS, 456, 3354
- Ferland et al. (1998) Ferland G. J., Korista K. T., Verner D. A., Ferguson J. W., Kingdon J. B., Verner E. M., 1998, PASP, 110, 761
- Ferland et al. (2013) Ferland G. J., et al., 2013, Rev. Mex. Astron. Astrofis., 49, 137
- Ferrara et al. (2014) Ferrara A., Salvadori S., Yue B., Schleicher D., 2014, MNRAS, 443, 2410
- Groves et al. (2006) Groves B. A., Heckman T. M., Kauffmann G., 2006, MNRAS, 371, 1559
- Gutkin et al. (2016) Gutkin J., Charlot S., Bruzual G., 2016, MNRAS, 462, 1757
- Habouzit et al. (2019) Habouzit M., Volonteri M., Somerville R. S., Dubois Y., Peirani S., Pichon C., Devriendt J., 2019, MNRAS, 489, 1206
- Harikane et al. (2020) Harikane Y., Laporte N., Ellis R. S., Matsuoka Y., 2020, ApJ, 902, 117
- Hartwig et al. (2016) Hartwig T., et al., 2016, MNRAS, 462, 2184
- Hayden-Pawson et al. (2021) Hayden-Pawson C., et al., 2021, arXiv e-prints, p. arXiv:2110.00033
- Hirano et al. (2015) Hirano S., Hosokawa T., Yoshida N., Omukai K., Yorke H. W., 2015, MNRAS, 448, 568
- Hirschmann et al. (2019) Hirschmann M., Charlot S., Feltre A., Naab T., Somerville R. S., Choi E., 2019, MNRAS, 487, 333
- Hsyu et al. (2020) Hsyu T., Cooke R. J., Prochaska J. X., Bolte M., 2020, ApJ, 896, 77
- Inayoshi et al. (2018) Inayoshi K., Li M., Haiman Z., 2018, MNRAS, 479, 4017
- Inayoshi et al. (2020) Inayoshi K., Visbal E., Haiman Z., 2020, ARA&A, 58, 27
- Inoue (2011) Inoue A. K., 2011, MNRAS, 415, 2920
- Izotov et al. (2014) Izotov Y. I., Thuan T. X., Guseva N. G., 2014, MNRAS, 445, 778
- Jaacks et al. (2018) Jaacks J., Thompson R., Finkelstein S. L., Bromm V., 2018, MNRAS, 475, 4396
- Jaskot & Ravindranath (2016) Jaskot A. E., Ravindranath S., 2016, ApJ, 833, 136
- Jeon et al. (2015) Jeon M., Bromm V., Pawlik A. H., Milosavljević M., 2015, MNRAS, 452, 1152
- Jiang et al. (2021) Jiang L., et al., 2021, Nature Astronomy, 5, 256
- Kauffmann et al. (2003) Kauffmann G., et al., 2003, MNRAS, 346, 1055
- Kewley & Dopita (2002) Kewley L. J., Dopita M. A., 2002, ApJS, 142, 35
- Kewley et al. (2001) Kewley L. J., Dopita M. A., Sutherland R. S., Heisler C. A., Trevena J., 2001, ApJ, 556, 121
- Kewley et al. (2013) Kewley L. J., Dopita M. A., Leitherer C., Davé R., Yuan T., Allen M., Groves B., Sutherland R., 2013, ApJ, 774, 100
- Kroupa (2001) Kroupa P., 2001, MNRAS, 322, 231
- Lamareille (2010) Lamareille F., 2010, A&A, 509, A53
- Laporte et al. (2017) Laporte N., Nakajima K., Ellis R. S., Zitrin A., Stark D. P., Mainali R., Roberts-Borsani G. W., 2017, ApJ, 851, 40
- Liu & Bromm (2020) Liu B., Bromm V., 2020, MNRAS, 497, 2839
- López-Sánchez et al. (2012) López-Sánchez Á. R., Dopita M. A., Kewley L. J., Zahid H. J., Nicholls D. C., Scharwächter J., 2012, MNRAS, 426, 2630
- Maiolino & Mannucci (2019) Maiolino R., Mannucci F., 2019, A&ARv, 27, 3
- Maiolino et al. (2008) Maiolino R., et al., 2008, A&A, 488, 463
- Matsumoto et al. (2022) Matsumoto A., et al., 2022, arXiv e-prints, p. arXiv:2203.09617
- Mezcua & Domínguez Sánchez (2020) Mezcua M., Domínguez Sánchez H., 2020, ApJ, 898, L30
- Mezcua et al. (2016) Mezcua M., Civano F., Fabbiano G., Miyaji T., Marchesi S., 2016, ApJ, 817, 20
- Nagao et al. (2006) Nagao T., Marconi A., Maiolino R., 2006, A&A, 447, 157
- Nakajima et al. (2018) Nakajima K., et al., 2018, A&A, 612, A94
- Natarajan et al. (2017) Natarajan P., Pacucci F., Ferrara A., Agarwal B., Ricarte A., Zackrisson E., Cappelluti N., 2017, ApJ, 838, 117
- Oesch et al. (2016) Oesch P. A., et al., 2016, ApJ, 819, 129
- Pacucci et al. (2016) Pacucci F., Ferrara A., Grazian A., Fiore F., Giallongo E., Puccetti S., 2016, MNRAS, 459, 1432
- Pacucci et al. (2017) Pacucci F., Pallottini A., Ferrara A., Gallerani S., 2017, MNRAS, 468, L77
- Pacucci et al. (2021) Pacucci F., Mezcua M., Regan J. A., 2021, ApJ, 920, 134
- Pawlik et al. (2011) Pawlik A. H., Milosavljević M., Bromm V., 2011, ApJ, 731, 54
- Pérez-Montero & Amorín (2017) Pérez-Montero E., Amorín R., 2017, MNRAS, 467, 1287
- Raiter et al. (2010) Raiter A., Schaerer D., Fosbury R. A. E., 2010, A&A, 523, A64
- Salpeter (1955) Salpeter E. E., 1955, ApJ, 121, 161
- Sanders et al. (2016) Sanders R. L., et al., 2016, ApJ, 816, 23
- Sanders et al. (2020) Sanders R. L., et al., 2020, MNRAS, 491, 1427
- Saxena et al. (2020) Saxena A., et al., 2020, A&A, 636, A47
- Schaerer (2003) Schaerer D., 2003, A&A, 397, 527
- Schaerer et al. (2019) Schaerer D., Fragos T., Izotov Y. I., 2019, A&A, 622, L10
- Schneider et al. (2006) Schneider R., Salvaterra R., Ferrara A., Ciardi B., 2006, MNRAS, 369, 825
- Schutte & Reines (2022) Schutte Z., Reines A., 2022, arXiv e-prints, p. arXiv:2201.08396
- Senchyna et al. (2017) Senchyna P., et al., 2017, MNRAS, 472, 2608
- Senchyna et al. (2020) Senchyna P., Stark D. P., Mirocha J., Reines A. E., Charlot S., Jones T., Mulchaey J. S., 2020, MNRAS, 494, 941
- Shapley et al. (2015) Shapley A. E., et al., 2015, ApJ, 801, 88
- Shibuya et al. (2018) Shibuya T., et al., 2018, PASJ, 70, S15
- Shirazi et al. (2014) Shirazi M., Brinchmann J., Rahmati A., 2014, ApJ, 787, 120
- Sobral et al. (2015) Sobral D., Matthee J., Darvish B., Schaerer D., Mobasher B., Röttgering H. J. A., Santos S., Hemmati S., 2015, ApJ, 808, 139
- Sobral et al. (2019) Sobral D., et al., 2019, MNRAS, 482, 2422
- Stanway & Eldridge (2018) Stanway E. R., Eldridge J. J., 2018, MNRAS, 479, 75
- Steidel et al. (2014) Steidel C. C., et al., 2014, ApJ, 795, 165
- Steidel et al. (2016) Steidel C. C., Strom A. L., Pettini M., Rudie G. C., Reddy N. A., Trainor R. F., 2016, ApJ, 826, 159
- Stiavelli & Trenti (2010) Stiavelli M., Trenti M., 2010, ApJ, 716, L190
- Strom et al. (2017) Strom A. L., Steidel C. C., Rudie G. C., Trainor R. F., Pettini M., Reddy N. A., 2017, ApJ, 836, 164
- Tornatore et al. (2007) Tornatore L., Ferrara A., Schneider R., 2007, MNRAS, 382, 945
- Tumlinson (2006) Tumlinson J., 2006, ApJ, 641, 1
- Umeda et al. (2022) Umeda H., Ouchi M., Nakajima K., Isobe Y., Aoyama S., Harikane Y., Ono Y., Matsumoto A., 2022, arXiv e-prints, p. arXiv:2201.06593
- Valiante et al. (2016) Valiante R., Schneider R., Volonteri M., Omukai K., 2016, MNRAS, 457, 3356
- Valiante et al. (2018) Valiante R., Schneider R., Zappacosta L., Graziani L., Pezzulli E., Volonteri M., 2018, MNRAS, 476, 407
- Vikaeus et al. (2021) Vikaeus A., Zackrisson E., Schaerer D., Visbal E., Fransson E., Malhotra S., Rhoads J., Sahlén M., 2021, arXiv e-prints, p. arXiv:2107.01230
- Visbal et al. (2020) Visbal E., Bryan G. L., Haiman Z., 2020, ApJ, 897, 95
- Volonteri (2012) Volonteri M., 2012, Science, 337, 544
- Volonteri et al. (2017) Volonteri M., Reines A. E., Atek H., Stark D. P., Trebitsch M., 2017, ApJ, 849, 155
- Whalen et al. (2020) Whalen D. J., Surace M., Bernhardt C., Zackrisson E., Pacucci F., Ziegler B., Hirschmann M., 2020, ApJ, 897, L16
- Yue et al. (2013) Yue B., Ferrara A., Salvaterra R., Xu Y., Chen X., 2013, MNRAS, 433, 1556
- Zamorani et al. (1981) Zamorani G., et al., 1981, ApJ, 245, 357
Appendix A Photoionisation model results assuming different gas densities
In the main text we present results of photoionisation models by mostly adopting a gas density fixed to the fiducial value of . In this appendix, we present the results with different gas densities and examine how the diagnostics are (not) impacted by the choice of gas density.
|
|

|
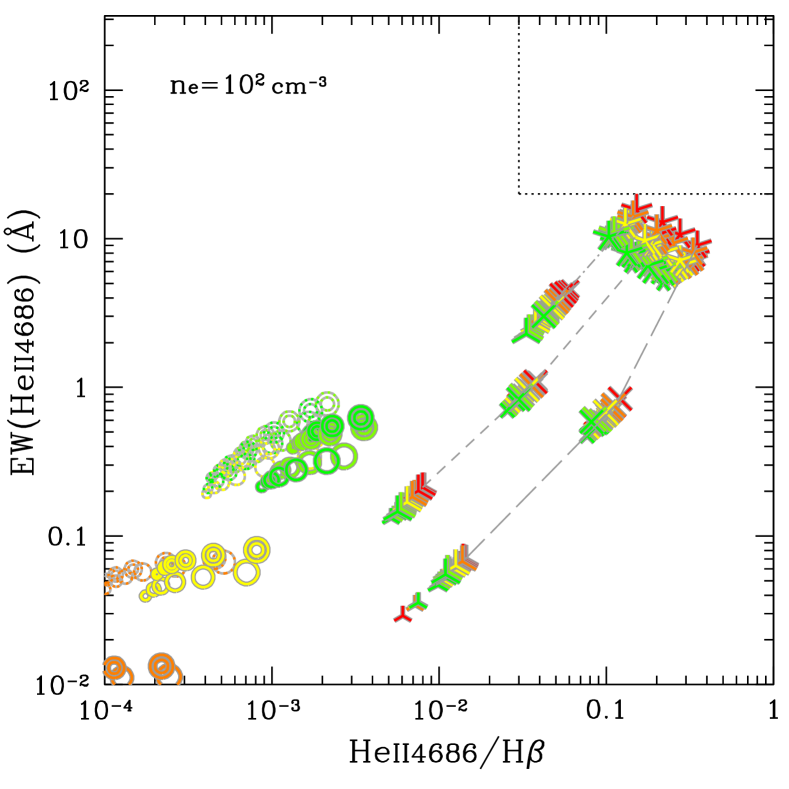
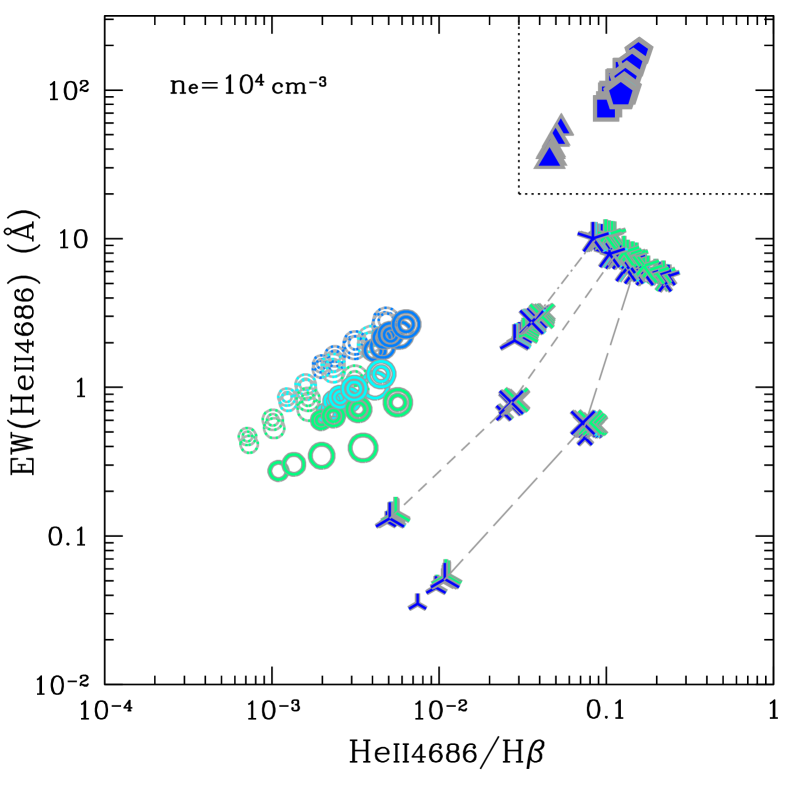
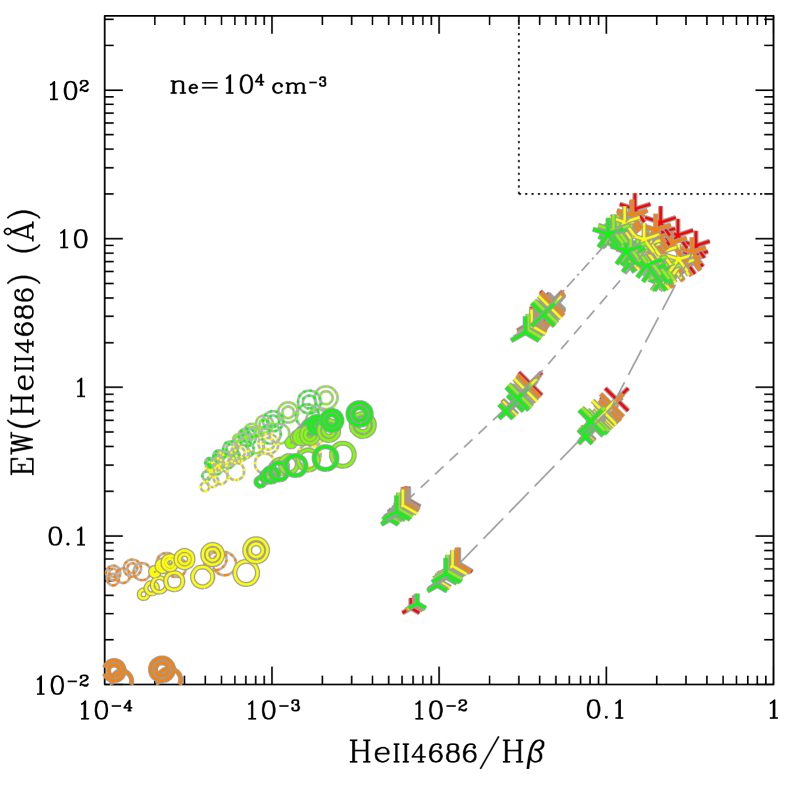
Fig. 10 presents the optical Heii diagnostic for a gas density of (left panels) and cm-3 (right panels). This confirms that the recombination lines ratio HeiiH is almost unchanged for any of the populations over the reasonable range of gas density from to cm-3. EW(Heii) shows a weak dependence on density, getting stronger by a factor of if a gas density higher by a factor of 10 is assumed. This dependence does not change the selection criteria for PopIII galaxies on this diagram (Eq. 1). We therefore reaffirm that the optical Heii diagram is the best discriminator of PopIII galaxies.
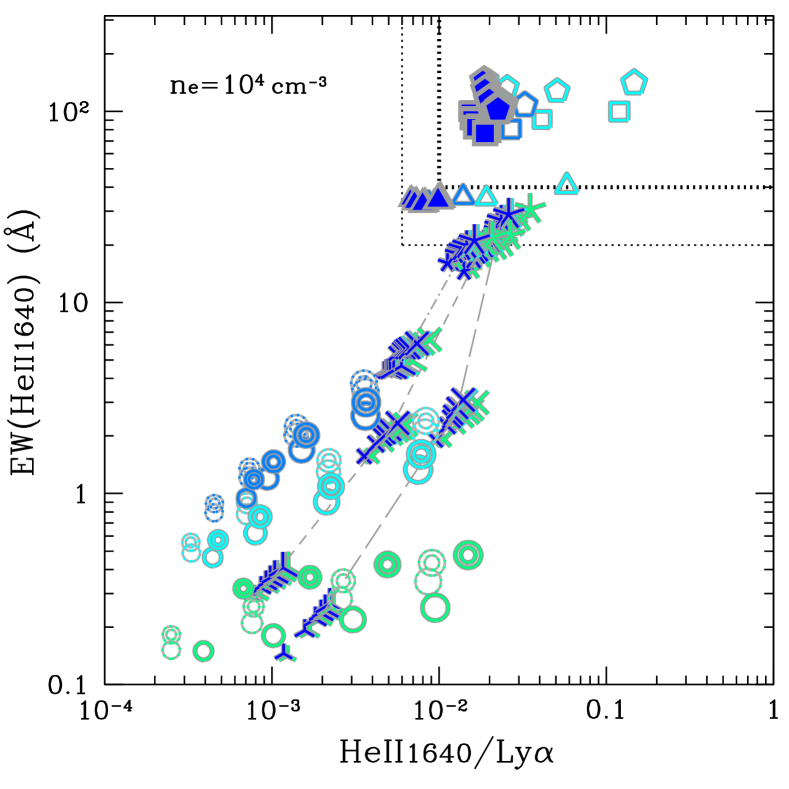
Fig. 11 shows the UV Heii diagnostics for different gas densities. A higher gas density leads to a stronger EW(Heii), by a factor of if assuming a gas density ten times higher, in a similar way as seen for the optical Heii emission. The strict selection criteria (Eq. 12) of EW(Heii) Å is confirmed valid even for the low gas density case. Although some metal-rich AGNs with a hard ionising spectrum () and a high density ( cm-3) can present an EW(Heii as strong as Å, such objects can be well-discriminated based on the diagnostics using the UV metal lines (§3.2.2). On the other hand, the relaxed selection criteria (Eq. 13) of EW(Heii) Å may miss some PopIII galaxies with a modest IMF if the gas density is as low as cm-3. This brings us another caveat when using the UV Heii diagnostic. The conservative lower-limits on HeiiLy ratio remain valid irrespective of the gas density.
In Fig. 12, we show some key diagnostic emission line ratios using metal lines to assess their dependences on gas density. We only present the low-metallicity models for the [N ii] BPT diagram and C4C3-C34 diagram as representatives. The dotted curves tracing the and are as determined based on the fiducial gas density models (Eqs. 6–9, 14–17). Fig. 12 demonstrates that these dotted curves work well for the different gas density models, confirming that the gas density has little effect on the diagnostic emission line ratios, and hence on the metallicity estimations based on the diagrams. Although these metal lines are collisional excitation lines, the effect is minimal at the low metallicity regime, especially when we use line ratios.
We also emphasise that our primary purpose here is to explore variations of metallicity spanning orders of magnitude; compared with the effects of such large metallicity variations, the effects of gas density variations on the diagnostics is essentially unimportant (with the exception of the Hei lines, as shown in Fig. 3). We can therefore conclude that the diagnostics developed in the main text work for different gas densities, and hence for a system with a possible internal variation of gas density, within the reasonable range of cm-3, are solid for constraining (when possible) the nature of different classes of sources and their metallicities.