Multi-wavelength properties of 850-m selected sources from the North Ecliptic Pole SCUBA-2 survey
Abstract
We present the multi-wavelength counterparts of 850-m selected submillimetre sources over a 2-deg2 field centred on the North Ecliptic Pole. In order to overcome the large beam size (15 arcsec) of the 850-m images, deep optical to near-infrared (NIR) photometric data and arcsecond-resolution 20-cm images are used to identify counterparts of submillimetre sources. Among 647 sources, we identify 514 reliable counterparts for 449 sources (69 per cent in number), based either on probabilities of chance associations calculated from positional offsets or offsets combined with the optical-to-NIR colours. In the radio imaging, the fraction of 850-m sources having multiple counterparts is 7 per cent. The photometric redshift, infrared luminosity, stellar mass, star-formation rate (SFR), and the AGN contribution to the total infrared luminosity of the identified counterparts are investigated through spectral energy distribution fitting. The SMGs are infrared-luminous galaxies at an average with –13.5, with a mean stellar mass of and SFR of . The SMGs show twice as large SFR as galaxies on the star-forming main sequence, and about 40 per cent of the SMGs are classified as objects with bursty star formation. At , the contribution of AGN luminosity to total luminosity for most SMGs is larger than 30 per cent. The FIR-to-radio correlation coefficient of SMGs is consistent with that of main-sequence galaxies at .
keywords:
surveys – galaxies: high-redshift – galaxies: starburst – galaxies: evolution – submillimetre: galaxies1 Introduction
The population of Submillimetre galaxies (hereafter SMGs; Smail et al., 1998; Blain et al., 2002) has been unveiled and widely studied during the past two decades, supporting the idea that a significant fraction of star formation is located in heavily dust-obscured galaxies during the peak epoch of cosmic star formation. Early surveys of SMGs were carried out using the low opacity atmospheric windows at 450 m and 850 m (e.g., Smail, Ivison & Blain, 1997; Barger et al., 1998). The subsequent space-based observatory Herschel observations greatly increased the number of galaxies selected in 250, 350, and 500 m (e.g., Bourne et al., 2016; Ward et al., 2022). Follow-up studies have shown that SMGs are gas-rich (Tacconi et al., 2006; Riechers et al., 2010) and massive (Michałowski et al., 2012, 2014; Dudzevičiūtė et al., 2020) galaxies with large (– M⊙ yr-1) star formation rates (SFRs; Barger et al., 2014; Toba et al., 2020) and heavily attenuated by dust (Geach et al., 2007; Michałowski et al., 2010). SMGs are frequently associated with an active galactic nucleus (AGN; Wang et al., 2013; Toba et al., 2018; Ueda et al., 2018), although the AGN component rarely dominates the submillimetre emission (e.g., Laird et al., 2010). Since the contribution of infrared-luminous galaxies to the global SFR density increases continuously up to and 3 (e.g., Magnelli et al., 2013; Lim et al., 2020; Casey, Narayanan & Cooray, 2014, for a review), understanding the physical nature of SMGs is crucial for constructing a self-consistent galaxy evolution model.
Statistical quantities, e.g., the number counts of 850-m selected galaxies at a flux limit of have now reached overall agreement between a variety of degree-scale survey fields (Geach et al., 2017; Simpson et al., 2020). Recent galaxy formation models also provide relatively good fits to the observed number counts and/or FIR luminosity function of SMGs (e.g., Lagos et al., 2020; Lovell et al., 2021) without requiring special treatment such as a different form of the initial mass function. This supports the idea that many SMGs represent a natural evolutionary stage of typical galaxies rather than being an exceptional galaxy population. Nevertheless, there remains a debate about the variation of physical properties for individual SMGs, i.e., why some SMGs lie above the so-called star-forming main sequence of galaxies (e.g., da Cunha et al., 2015) while others do not. As the number counts of SMGs can used to constrain the parameters for the galaxy formation models (e.g., Cowley et al., 2015), other statistics, such as the distribution of SFR, stellar mass, dust-to-gas mass ratio, redshift and AGN luminosity of SMGs, also provide strong constraints on the models (Hayward et al., 2021). However, despite the success in fitting number counts, it is still difficult to reproduce all the observed physical properties of SMGs in large volume surveys with galaxy formation models, due to the uncertainties in the fueling and feedback mechanisms that lead to the growth of SMGs.
Earlier ideas to explain active star formation in SMGs include merger-induced star formation (Narayanan et al., 2009, 2010), similar to the case of local ultra-luminous infrared galaxies (ULIRGs; Sanders et al., 1988). Since gas-rich galaxy-galaxy major merger events may cause both enhanced star formation and elevated AGN activity (Hopkins et al., 2008), diverse high-redshift galaxy populations may represent different phases of galaxy evolution. In the framework of gas-rich mergers for describing the formation of massive galaxies, SMGs are suspected to represent a starburst-dominated phase in the earlier stages of evolution, while the later quasar-dominated phase is observed as dust-obscured AGN (Dey et al., 2008; Narayanan et al., 2010; Hwang & Geller, 2013; Toba et al., 2015; Toba & Nagao, 2016). 10 to 20 per cent of SMGs are suspected to host AGN based on X-ray detection (Johnson et al., 2013). The fraction of AGN among SMGs (Wang et al., 2013) and the contribution of AGN to the bolometric luminosity of SMGs (Pope et al., 2008; Seo et al., 2018) provide indirect probes of the massive galaxy evolution scenario that includes an SMG phase. By probing black-hole-mass to stellar-mass ratios in SMGs, it is reported that SMGs host less massive black holes compared to non-SMGs with the same stellar mass at (Alexander et al., 2008; Ueda et al., 2018), supporting the suggestion that black hole growth comes after the growth of stellar mass. On the other hand, it is still an open question whether the star formation is enhanced or quenched through AGN activity in SMGs (e.g., Ramasawmy et al., 2019), which is related to the more general issue of the strength of AGN feedback in galaxy evolution.
Another possibility is that star formation in SMGs is powered by less vigorous, continuous fueling of gas through gas accretion or infall (Davé et al., 2010). Recent galaxy-formation models show that the submillimetre-bright phase can last for long enough to allow a supply of infalling gas, without requiring a major merger (Narayanan et al., 2015). From these simulated galaxies, the merger fraction of SMGs is not significantly higher compared with non-SMGs, suggesting that mergers are not the main origin of the high SFRs in SMGs (McAlpine et al., 2019). Direct studies of stellar and gas morphologies would quantify the fraction of merger-driven starbursts in the SMG population. However, this requires deep, high-resolution imaging follow up. While such observations are time-consuming, an alternative way to distinguish between mergers and continuous gas infall is to use the star-forming main sequence revealed in an SFR versus stellar mass diagram (e.g., Speagle et al., 2014; Schreiber et al., 2015; Koprowski et al., 2016; Tomczak et al., 2016). Although there is still debate about whether there exists a mass dependency in the specific SFR, the observed star-forming main sequence and its evolution as a function of redshift are well described by some recent galaxy-formation models (e.g., Henriques et al., 2015; Nelson et al., 2015). Therefore, the location of a galaxy relative to the star-forming main sequence provides information about the star-formation efficiency, which could be related to mergers (e.g., Barrufet et al., 2020). This idea is also supported by radio observations such as those described by Miettinen et al. (2017), which shows that SMGs on the main sequence are disk-like galaxies with relatively large radio sizes, while SMGs above the main sequence appear to be irregular in the rest-frame UV. A complication is that the placement with respect to the main sequence seems to depend on the method used to derive stellar mass, as discussed by Michałowski et al. (2012, 2014).
In order to probe the formation and evolution of SMGs, it is necessary to identify SMGs in other wavebands. For instance, an optical/near-infrared (NIR) identification is crucial for estimating properties such as stellar mass and photometric redshift. Unfortunately, SMGs selected in wide-area surveys suffer from the large beam sizes of single-dish imaging, which is of the order of 10 arcsec. This value is far larger than the beam size of the optical and NIR data, which is of order 1 arcsec. Therefore, since more than one optical/NIR selected object can fall within the beam size of submillimetre image, it is far from straightforward to determine which objects are responsible for the observed submillimetre emission. The use of submillimetre/millimetre interferometer array systems for follow up of discovered submillimetre sources (e.g., Karim et al., 2013; Hill et al., 2018; Simpson et al., 2020; Dudzevičiūtė et al., 2020) is required to obtain a better spatial localization of submillimetre source counterparts. With the more precise coordinates, it is possible to probe the physical properties of SMGs including securing redshift estimation. If no higher spatial resolution images are available in the submillimetre/millimetre, radio images can be utilized instead, because of the tight FIR-radio correlation for star-forming galaxies (e.g., Condon, 1992). Such radio identification has also been frequently used for identification of submillimetre sources (e.g., Ivison et al., 2002; Chapman et al., 2001, 2003; Smolčić et al., 2015; Liu et al., 2019; Lim et al., 2020). Likelihood methods using positions, magnitudes and/or colours (from the deep multi-wavelength data sets) have also been developed to identify counterparts of submillimetre sources to overcome the lack of high spatial resolution data at wavelengths longer than the submillimetre (e.g., Chapin et al., 2009; Hwang et al., 2010; Casey et al., 2013; Michałowski et al., 2017; An et al., 2019). This suggests that the areas with rich multi-wavelength data available are ideal for studying the physical properties of submillimetre-detected sources.
The James Clerk Maxwell Telescope (JCMT) Submillimetre Common User Bolometer Array-2 (SCUBA-2; Holland et al., 2013) Cosmology Legacy Survey (S2CLS) has been initiated as an 850-m survey over several frequently visited fields (Geach et al., 2017) with just the above motivation. About 3000 850-m sources are detected in the 5 deg2 of S2CLS fields. Detailed analyses of the physical properties of SMGs in S2CLS have been conducted on the EGS (Zavala et al., 2018), COSMOS (Michałowski et al., 2017; An et al., 2019), and UKIDSS/UDS (Chen et al., 2016; Michałowski et al., 2017; Dudzevičiūtė et al., 2020) fields, which are all accessible by the Atacama Large Millimeter/Submillimeter Array (ALMA). The subsequent surveys of S2CLS have been carried out or are being carried out with the JCMT, as a large programme, on the COSMOS field (e.g., Simpson et al., 2019), as well as their follow up with ALMA (Simpson et al., 2020).
The North Ecliptic Pole (NEP) region is one of the seven extragalactic fields included in the original S2CLS project (Geach et al., 2017). Through a more recent JCMT large programme, which is one of the subsequent surveys of S2CLS, the original 850-m area coverage has been extended from 0.6 deg2 to about 2 deg2, allowing the detection of 549 submillimetre sources (above 4, Shim et al., 2020). Some counterpart identification of S2CLS-NEP 850-m sources was already presented in Seo et al. (2018), using only a small subsample of sources with secure spectroscopic redshifts. Armed with the abundant multi-wavelength data sets, including the X-ray, optical, near-, mid-, to far-infrared (hereafter NIR, MIR and FIR, respectively) and radio wavelengths (White et al., 2010; Kim et al., 2012; Takagi et al., 2012; Krumpe et al., 2015; Nayyeri et al., 2018; Pearson et al., 2017, 2019; Oi et al., 2021), we now present the multi-wavelength counterpart identification of 850-m sources located in the full NEP survey field (Geach et al., 2017; Shim et al., 2020), as well as their estimated physical properties.
This paper is organized as follows. In Section 2, we describe our 850-m data and the availability of ancillary multi-wavelength observations. We present the counterpart identification in Section 3. The models and parameters for SED fitting and the related analysis are described in Section 4. Results based on the derived physical parameters, such as the photometric redshift, stellar mass, and SFR are discussed in Section 5. Our work is summarized in Section 6. Throughout the paper, we use Planck 2018 cosmological parameters for a flat CDM model (Planck Collaboration et al., 2020, , km s-1 Mpc-1), and magnitudes are given in the AB magnitude system (Oke, 1974).
2 Data
2.1 Submillimetre
The S2CLS project (Geach et al., 2017) obtained 850-m imaging over 0.6 deg2 centred on the North Ecliptic Pole, at an rms level of 1.2 mJy beam-1. The following North Ecliptic Pole SCUBA-2 survey (NEPSC2, Shim et al., 2020) expands the 850-m area coverage to 2 deg2 at the rms level of 1–2 mJy beam-1. The NEPSC2 source catalogue is constructed using an updated 850-m mosaic map through mosaicking of the previously available S2CLS data and the newly obtained data (see Shim et al., 2020, for more details).
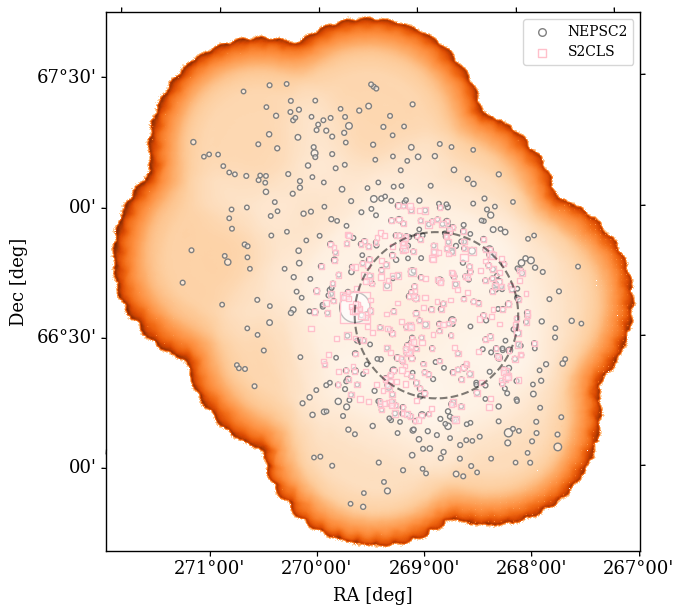
For this work, we merge the two catalogues into one. The signal-to-noise ratio (S/N) cuts applied in the catalogue construction are different in the two surveys. The NEPSC2 catalogue contains 549 sources with 4 detections, while the S2CLS catalogue contains 330 sources with 3.5 detections. Figure 1 shows the spatial distribution of 850-m sources from the two catalogues, overlaid on the variance map over the NEP area (bright colours represent areas with low variance). By merging the two catalogues, the number of ‘unique’ 850-m sources over the NEP region is 647. For overlapping sources, we use the information (coordinate and flux density) from the NEPSC2 catalogue. Note that one extremely bright submillimetre source with S/N of 195 is Galactic (the planetary nebula NGC 6543). The possibly spurious sources located in a petal-like pattern around it are excluded in the merged 850-m source catalogue. The new catalogue is used as an input in the multi-wavelength counterparts identification.
2.2 Multi-wavelength ancillary data
2.2.1 Radio
The 20-cm continuum data (i.e., with an effective frequency of 1525 MHz) of the NEP-deep field have been obtained using the Karl G. Jansky Very Large Array (VLA) during 2013–2014 (project ID: VLA/13B-361 and VLA/14A-469, PI: K. Nakanishi), with a total integration time of about 9.5 hours. Data reduction to construct the primary beam-corrected image has been performed with standard methods using casa, the Common Astronomy Software Applications package (International Consortium Of Scientists, 2011). The final image has a size of a 0.35-degree radius circle, reaches an rms noise level of 6 Jy in the centre, and has a spatial resolution of around 1.5 arcsec.
We use the 20-cm source catalogue (as well as the image) in the radio identification of 850-m sources. Source extraction is performed using the blobcat package (Hales et al., 2012) over the processed image, along with the rms map created by sextractor (Bertin & Arnouts, 1996) as an additional input. The source detection threshold is set to to avoid detecting artefacts as sources while maximizing number of detected sources. The integrated surface brightness for each radio blob is defined as the 20-cm flux density for a radio object.
Note that a Westerbork Synthesis Radio Telescope (WSRT) 20-cm source catalogue is available over a 1.7 deg2 area on the NEP (White et al., 2010). However, because of the relatively poor sensitivity (21 Jy rms) and spatial resolution (17.0 arcsec15.5 arcsec), we do not use the WSRT source catalogue in the radio identification of 850-m sources.
2.2.2 Near-infrared to mid-infrared
Several NIR photometric catalogues obtained from ground-based telescopes are available over the NEP field: (1) CFHT/WIRCam , , and observations in the 47 arcmin44 arcmin region centred on the AKARI NEP-deep field with 5 limiting magnitudes of 23.2, 22.8, and 22.5 mag, respectively (Oi et al., 2014); (2) KPNO 2.1-m/FLAMINGOS - and -band imaging of the NEP-deep at 21.3 and 19.6 mag (Imai et al., 2007), superseded by the previously described catalogue; (3) KPNO 2.1-m/FLAMINGOS - and -band observations covering the entire NEP-wide field, reaching down to a depth of 21.6 mag in and 21.3 mag in (Jeon et al., 2014); and (4) CFHT/WIRCam -band imaging observations covering around 1 deg2 in the NEP-Wide to a depth of 21.9 mag. The limited depth and the limited areal coverage of these data sets hamper the construction of an optical-to-NIR band-merged catalogue based on the NIR detection over the full 850-m survey area. We thus rely on the near- to mid-IR source catalogues generated by space-based telescopes for the identification of counterparts to the 850-m sources.
The AKARI/IRC NEP-deep and NEP-wide surveys make the NEP field a unique region of the sky where continuous MIR wavelength observations through 2–24 m are available. The flux limits in the NEP-deep survey (covering approximately 2000 arcmin2) are 14.2, 11.0, 8.0, 48.9, 58.5, 70.9, 117.0, 121.4, and 275.8 Jy for the , , , , , , , , and -bands, respectively (Wada et al., 2008; Takagi et al., 2012). The number in the name of each band indicates the central wavelength in m. In the 5.4 deg2 area of the NEP-wide survey, the flux limits are 15.4, 13.3, 13.6, 58.6, 67.3, 93.8, 133.1, 120.2, and 274.4 Jy, respectively (Kim et al., 2012). The full widths at half-maximum (FWHM) of the AKARI/IRC point spread function (PSF) range over 4.5–7 arcsec.
Most of the AKARI NEP-deep and NEP-wide survey area was also covered by the Spitzer/IRAC 3.6- and 4.5-m observations after the liquid helium run out, in Cycles 10 (Program ID: 10147, PI: J. Bock) and 14 (Program ID: 13153, PI: P. Capak). The data obtained during Cycle 10 have sensitivities of 6.5 and 4.0 Jy in the 3.6- and 4.5-m bands, respectively (Nayyeri et al., 2018). We create a new mosaic image using the data from both cycles and construct a source catalogue based on the new image. In this catalogue, flux limit is 1.6 Jy in both 3.6- and 4.5-m bands. Considering the improved spatial resolution (with the PSF FWHM being 1.6 arcsec) and the better sensitivity (a factor of 5 deeper at 4 m) of the Spitzer/IRAC photometry compared to that of the AKARI/IRC, the IRAC catalogue is mainly used to identify short-wavelength counterparts of the 850-m sources based on colours (see Section 3.2).
There is no large area survey using the Spitzer/MIPS instrument over the NEP area. However, we search the Spitzer archive to find several small programmes located in the NEP that used the MIPS 24-m band. For most cases, the depths are more or less similar to that of the AKARI/IRC -band data from the NEP-deep/wide. The PSF size is also similar (5.9 arcsec FWHM) to that of -band data. When available, the MIPS 24-m flux density is also included in the SED fitting of 850-m source counterparts (Section 4).
Regions around the ecliptic poles have been observed as a part of an all-sky survey by the Wide-field Infrared Survey Explorer (WISE) satellite with a best sensitivity of 5–6 mJy at 22 m for detections (Cutri et al., 2012). The WISE photometric data points at 3.4, 4.6, 12, and 22 m are included in the SED fitting as well, when available.
2.2.3 Optical
The most recent optical source catalogue over the entire 4 deg2 of the NEP-wide survey area provides deep 5-band Subaru/HSC photometry, at limiting magnitudes of 28.1, 26.8, 26.3, 25.5, and 25.0 mag in the , , , , and bands, respectively (Oi et al., 2021). This supplements the previously available optical photometry data with the CFHT/MegaCam bands (Hwang et al., 2007), Subaru/Suprime-cam bands (Takagi et al., 2012), Maidanak/SNUCAM bands (Jeon et al., 2010), and CFHT/MegaCam band (Huang et al., 2020).
2.2.4 Far-infrared
Although the area coverage is limited to the NEP-deep area, the Herschel/PACS 100- and 160-m source catalogues are available with sensitivities of 1.6 and 3.2 mJy, respectively (Pearson et al., 2019). The entire NEP-wide area has been covered by the Herschel/SPIRE observations (Pearson et al., 2017). While the detection sensitivities differ for source locations, the average rms at 250, 350, and 500 m is 9.0, 7.5, and 10.8 mJy, respectively, which is slightly above the SPIRE confusion limit (Nguyen et al., 2010). The mosaicked Herschel/PACS and SPIRE images over the NEP as well as the blind and forced source catalogues are also provided by the Herschel Extragalactic Legacy Project (HELP; Shirley et al., 2021). A more detailed description of the multi-wavelength catalogue compilation can be found in Kim et al. (2021), along with the comparisons between the survey areas over which different wavelength surveys are available.
3 Counterpart Identification
Due to the large beam size of the submillimetre single-dish telescope, the identification of counterparts at different wavelengths requires assumptions about the characteristics of galaxies that can be selected in the submillimetre. For instance, the use of radio wavelength information is a reasonable approach to identify objects responsible for submillimetre emission because of the well-known FIR-radio correlation of star-forming galaxies (e.g., Condon, 1992). In star-forming galaxies, the FIR emission is correlated with recently formed stars because it is produced by dust heated from the UV radiation of massive stars. The synchrotron radiation is also correlated with supernovae remnants from massive stars, therefore radio-detected galaxies are likely to be FIR bright. Mid-IR flux also correlates with the total infrared luminosity and/or FIR luminosity (e.g., Appleton et al., 2004; Takeuchi et al., 2005; Toba et al., 2017), since both MIR and FIR emission is generated from giant molecular clouds. The actual relationship between the two is complex, since the MIR polycyclic aromatic hydrocarbon (PAH) features are strongly affected by the contributions from an AGN, but nevertheless, information at radio and/or MIR wavelengths can be used to identify counterparts for 850-m sources.
Since the areal coverage of 20-cm data is only 0.38 deg2, smaller than the 2 deg2 of the NEPSC2 survey area, we need a method other than searching for radio emission to identify counterparts for submillimetre sources. As the spatial resolution of the MIR imaging data (7–24 m) is relatively poor, using the shorter wavelength data (i.e., optical to NIR) is a better strategy for counterpart identification. Previous studies such as Chen et al. (2016) presented a counterpart identification method for single-dish 850 m sources based on the optical-to-IR colours. The method uses the assumption that submillimetre-selected populations are heavily obscured galaxies and/or are located at high redshifts, having optical-to-IR colours that are distinguished from non-submillimetre populations. The method is quite successful, with the colour identification showing 80 per cent accuracy in identifying submillimetre source counterparts that are identified in the higher-resolution interferometer follow-up data (Chen et al., 2016). We follow such a strategy to use colours in order to identify counterparts of submillimetre sources in different wave bands.
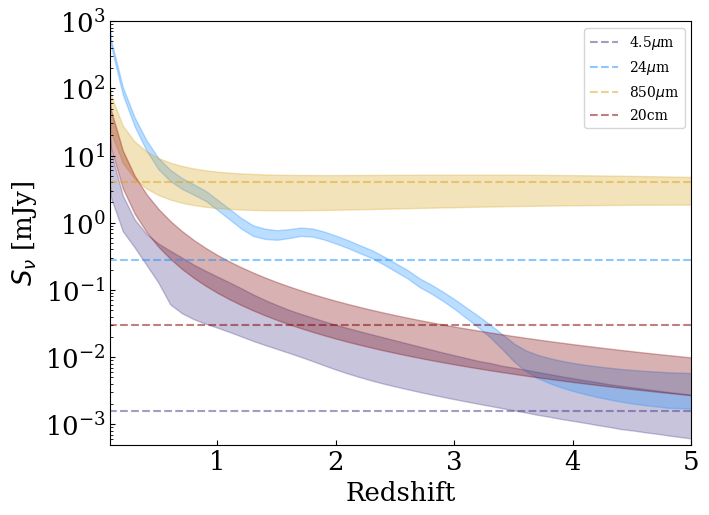
Before we describe the counterpart identification process in more detail, we discuss whether the ancillary multi-wavelength data sets over the NEP have enough sensitivity to allow identification of an SMG population over a wide range of redshifts. Figure 2 shows how the expected flux density in each filter depends on the redshift of an SMG. An averaged SED template from the ALESS SMG survey (da Cunha et al., 2015) is used here, for which the total IR luminosity is scaled to . The shaded flux density bands show possible ranges caused by the variation in the spectral shapes among the SMG population with different total luminosity. Also plotted for comparison are flux limits in the ancillary multi-wavelength data sets over the NEP field: 4.5-m detection limits from the Spitzer/IRAC mosaic; 24-m limits from the AKARI/IRC NEP-wide field (Kim et al., 2012); and 20-cm limits from the VLA data. According to the plot, the available 24-m ancillary data enable us to identify SMGs at if their SEDs are similar to those of the ALESS SMGs. The radio data can be used for identifying SMGs. Finally, 4.5-m images are deep enough for an identification of SMGs out to , although caution is needed since the rest-frame optical-to-NIR SED shapes are more diverse than those of the rest-frame FIR SED, depending on star-formation history variations, for example. Based on the comparison presented in Fig. 2, we use the VLA 20-cm and the Spitzer/IRAC 3.6/4.5-m data as a reference for identifying counterparts of submillimetre sources.
3.1 Radio identification
A conventional method of identifying counterparts at different wavelengths is to calculate the probability that the coincident match occurs within a specific radius, i.e., calculating -values based on the method outlined in Downes et al. (1986). As used in many previous searches for single-dish SMG counterparts at different wavelengths (e.g., Ivison et al., 2007; Casey et al., 2013; Koprowski et al., 2016; Michałowski et al., 2017), the -value is defined as
| (1) |
Here is the source (surface) density and indicates the angular offset between the positions. In regions where the VLA imaging is available, we cross-match our 850-m source catalogue with the radio source catalogue. The radio source density in the NEP field is 3200 deg-2, thus to get a false detection rate less than 10 per cent, we use a matching radius of 12 arcsec.
The number of 850-m sources that are located within the VLA field of view is 206 (note that the sensitivity of the VLA mosaic image rapidly gets worse as we move to the outer edge). Out of these 206 sources, we identify possible counterparts for 126 sources at radio wavelengths. Roughly speaking, this means that the radio identification rate is about 61 per cent. The identification rate is higher for sources with larger 850-m flux densities: for example, the radio identification rate is 70 per cent for sources with mJy and 32 per cent for sources with mJy. Most 850-m sources have only one radio counterpart. There are 10 sources with two radio objects within the matching radius, and two sources with three radio objects around the 850-m position. The number of possible counterparts identified in the radio is 140 in total. The offsets between the radio and 850-m position are less than 8 arcsec for 127 matches, and 5 arcsec for 108 matches.
It is difficult to estimate what fraction of submillimetre sources are actually multiples of fainter objects (e.g., Wang et al., 2011), without the aid of submm/mm interferometric observations providing better spatial resolution. The only available such case for NEP submillimetre sources is one of the brightest sources ( mJy) that is observed at 1.1 mm, which is found to be composed of two components (Burgarella et al., 2019). Previous studies that performed higher spatial resolution follow-up observations for single-dish selected sources (e.g., Hodge et al., 2013; Karim et al., 2013; Simpson et al., 2015, 2020) have suggested that a significant (30–50 per cent) fraction of submillimetre sources that are brighter than a few mJy at 850 m are composed of multiple components, with an increasing fraction at higher flux densities. However, they have also showed that most of the submillimetre flux density is contributed by the primary (i.e., the brightest) component, since secondary components are much fainter (e.g., Michałowski et al., 2017; Hill et al., 2018; Simpson et al., 2020). The fraction of 850-m sources in our sample with multiple radio counterparts among the radio-identified sources is less than 10 per cent (i.e., 12/126). Moreover, the average 850-m flux density of submillimetre sources with two or three radio counterparts is comparable to that of sources with only one radio counterpart. If the radio emission is explained by the radio-FIR correlation of star-forming galaxies, i.e., if the identified objects are not radio-loud AGN, the small fraction of multiple matches indicates either that the actual multiplicity is relatively low at this flux density range (–12 mJy), or that the secondary counterparts are much fainter than the primary counterparts.
3.2 Optical-to-NIR colour identification
Although it is straightforward to identify counterparts at radio wavelengths, the source densities at shorter wavelengths (i.e., optical to MIR) are much higher than in the radio. Thus we combine the positional offset with an additional prior to calculate a probability for an object to be a real counterpart to a submillimetre source. For this purpose, we use nway (Salvato et al., 2018), which is developed to identify sources with large positional uncertainty from data of better spatial resolution, e.g., identifying optical counterparts for X-ray sources (Hasinger et al., 2021). The nway code searches possible matches to a source within a specified search radius and calculates a probability for each object being a true counterpart based on the positional offset (i.e., a distance-based approach) with a possibility of combining additional characteristics such as magnitudes or colours as priors. Multiple priors can be tested simultaneously to find the most appropriate prior for source identification.
Through a Bayesian approach, the probability that a source in a poor resolution image (850-m source in this case) has any counterpart within the specified radius, , is calculated as
| (2) |
Here the prior is the probability of a chance alignment of physically unrelated objects, and the posterior can be calculated using information, obtained from the observed data . indicates the no-counterpart hypothesis, while indicates a hypothesis that the -th object is a true counterpart. Based on this equation, large values imply that at least one of the associations between different catalogues is likely to be physically related. The nway algorithm also provides relative posterior probabilities for every possible match ( for the i-th object), by normalizing the total probability (except the non-matched case) to be 1:
| (3) |
To find counterparts of the submillimetre sources (i.e., to find physically related matches between the catalogues), a probability cut for should be applied to the results. This may not limit the counterpart identification to a single object, since it is possible that multiple objects show comparable to each other. Our adopted probability cut for identification of NEP submillimetre sources is described in more detail below.
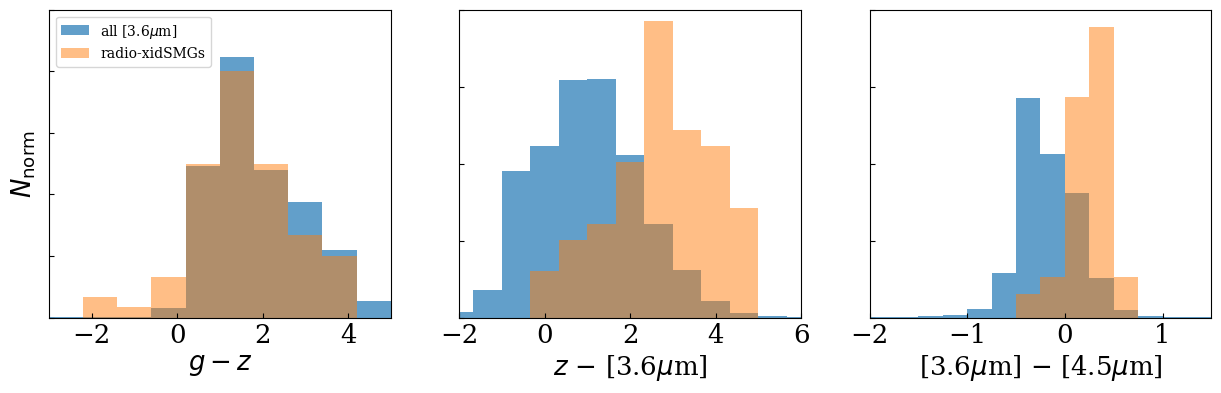
Any attribute of the objects can be used as a prior. However, since the choice of prior affects the calculation of likelihood values through weighting factors, those properties for which the source population show different characteristics to others (i.e., background galaxies) are good priors. To determine which attributes to use, we compare the colour distributions of the counterparts for 850-m sources that are identified in radio wavelengths with that of other objects. Figure 3 shows that the radio-identified counterpart of submillimetre emission is clearly distinguished from other objects in colours and colours, while it is not the case in optical colours such as . Therefore, NIR colours can be used to identify counterparts of the 850-m emission in combination with the spatial offset. While any colours generated from the combinations of or with or are similarly useful for use as priors, we choose because the -band sensitivity is slightly better than that of the band.
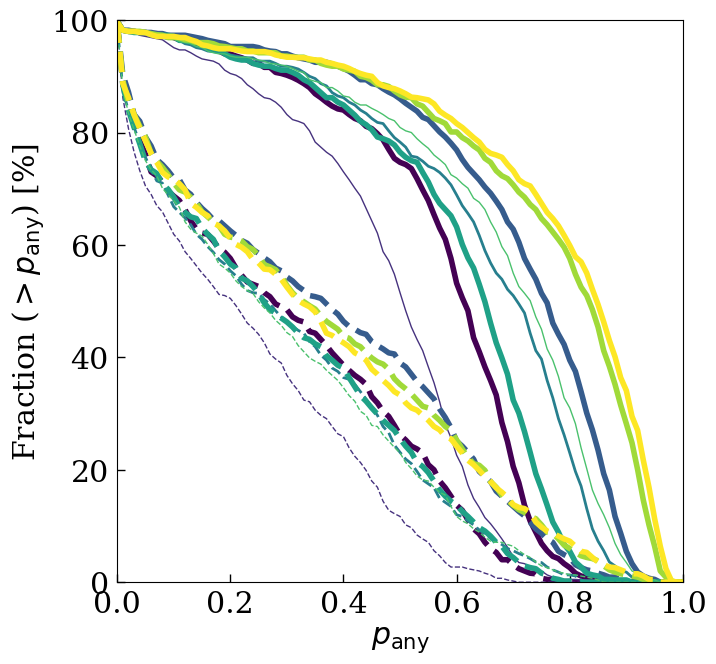
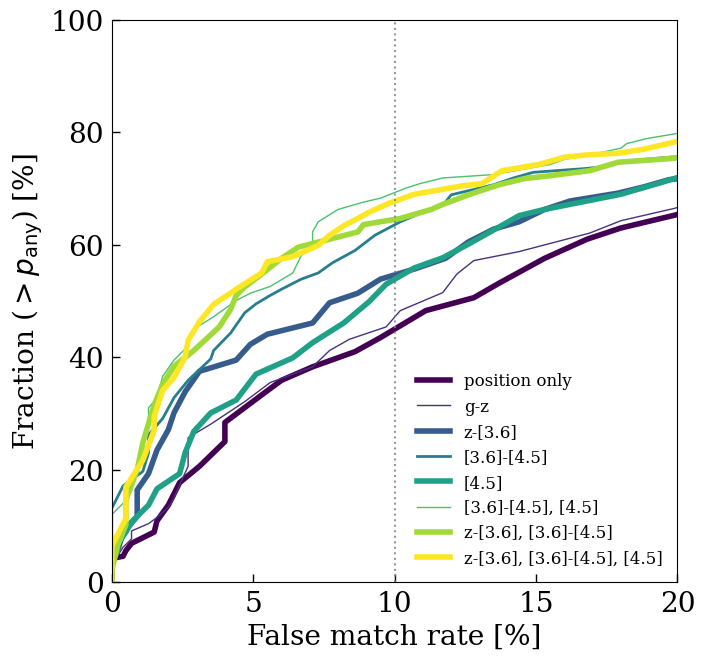
The left panel of Fig. 4 shows the cumulative fraction of cases when counterparts are found with different probability cuts, based on several different priors (colours and magnitudes). The completeness of identifications, i.e., the fraction of submillimetre-sources that do have counterparts, differs according to the probability cut. For example, in the position-only matching, adopting cases with (in Equation 2) as robust identifications corresponds to the identification of 20 per cent of 850-m sources. In order to determine a reasonable threshold for probability , we need an estimate of the false rate – i.e., the probability that the identified counterpart is not a real counterpart but a coincident match. For this purpose, we create a ‘fake-source’ catalogue by randomly changing the real 850-m source positions and perform the counterpart identification process with it using the same configuration. The fractions of matches using a fake-source catalogue are also illustrated in Fig. 4 (left panel) as dashed lines, and the cumulative fraction in this case can be considered as the ‘false match’ rate. A cut for a false rate less than some specific value can be determined based on this plot.
The right panel of Fig. 4 shows the relationship between the completeness (-axis) and the false match rate (-axis) for different choices of prior. A parameter combination that yields a high completeness and a low false rate simultaneously is the most efficient prior for counterpart identification. In our case, the combination of and colours with magnitudes appears to be the best prior (yellow line in Fig. 4). The use of priors (colours and/or magnitudes) results in a much better efficiency in counterpart identification than just using the nearest positional match or the match using optical colour () and position. High redshift galaxies and heavily attenuated galaxies are ‘optically dark’ (e.g., Toba et al., 2020), and -band magnitudes are not available for such galaxies. To account for this, we apply two combinations of priors: (1) , combined with ; and (2) combined with .
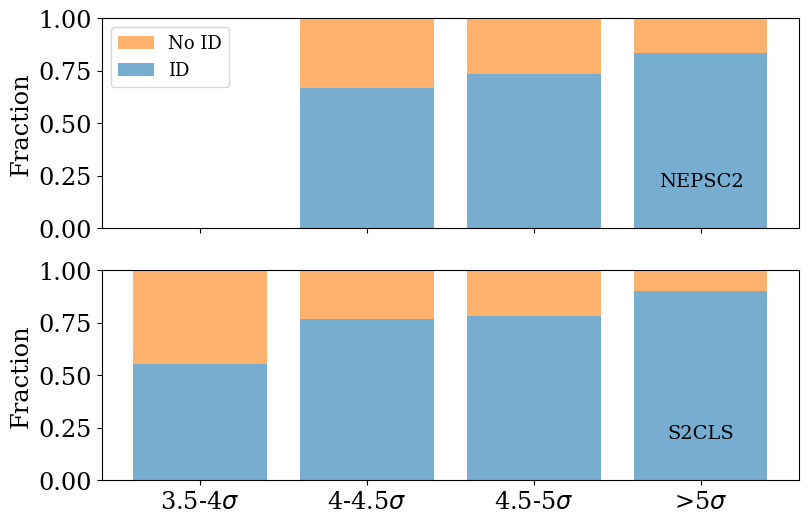
We apply a false rate cut of 10 per cent (i.e., ) to define the identification as reliable. Note that a false rate of 10 per cent does not mean that the probability of a counterpart being false is 10 per cent. Instead, it means that even a randomly defined position would encounter a spatially close object with similar prior characteristics this fraction of the time. At this probability cut, the completeness reaches around 65 per cent. Among 647 sources in the 850-m source catalogues, counterparts of 643 sources are identified based on the optical-NIR colours, except for the four sources that are located very close to saturated stars or matched to local galaxies. Then we have reliable identifications for 419 sources, corresponding to 65 per cent. The number of sources with reliable identification among the total number of submillimetre sources is defined as the identification success rate. Figure 5 shows how the identification success rate changes as a function of detection S/N at 850 m. The results are shown separately for two different 850-m source catalogues, since the detection S/N for the same source is recorded differently in the two catalogues. It is clear that the identification success rate increases as the S/N increases. This is in line with the increasing false detection rate in the low S/N regime of the 850-m source catalogue (Shim et al., 2020).
We define any object with (Equation 3) as a primary counterpart of the 850-m source, since this means that the probability of that object being the true counterpart is larger than the sum of probabilities of all other objects within the search radius being counterparts. Objects with are defined as secondary counterparts. Since the positional offset affects the probability calculation, we test if the difference between 850-m source coordinates measured in the NEPSC2 and S2CLS catalogues produces different results for finding most likely counterparts. There exist only 16 cases that a primary counterpart determined from the NEPSC2 position is a secondary counterpart determined from the S2CLS position, or vice versa, which accounts for only 7 per cent of the overlapping sources (16/222). Therefore, the positional uncertainty at 850-m seems to have little effect on the counterpart identification.
Among the 419 submillimetre sources with reliable identifications using optical-NIR colours, 40 sources have two (primary or secondary) counterparts, one source has three counterparts, while all other sources have only one primary counterpart. Again, this suggests that the probability of 850-m sources being composed of multiple components that are similarly contributing to 850-m emission is as low as 10 per cent (41/419). Overall, counterpart identification based on the optical-NIR colours tends to select a robust, single counterpart to each 850-m source.
3.3 Multi-wavelength photometry
We construct the final counterparts catalogue by compiling all the counterpart identification results from Sections 3.1 and 3.2. Among the 140 radio-identified counterparts, 103 counterparts overlap with those identified in optical-NIR colours, although not all of them are considered to be reliable enough in terms of the cut. The overlapping cases are 98 primary counterparts and five secondary counterparts. The remaining 37 cases include: (1) four cases that are not detected shortward of 4.5 m (i.e., 3.6m-dropouts); (2) 13 cases that are missed in the original IRAC source catalogue because the object is not de-blended in the IRAC images, though it is resolved in the optical images; and (3) 20 cases for which other NIR-selected objects are calculated to be more likely to be the counterpart (i.e., the of the radio counterpart is calculated to be less than 0.2). Therefore, it can be said that the optical-NIR-colour identification recovers 84 per cent of the radio-identified objects (103/123). This provides supporting evidence for the reliability of optical-to-NIR colour-based counterpart identification, which is convenient, since there exists no large submm/mm interferometric observation over this field to date.
| Model and input parameters | Range |
|---|---|
| Star-formation history: sfh2exp | |
| e-folding time of the main stellar population model [Myr] | 1000, 3000, 5000 |
| e-folding time of the late starburst population model [Myr] | 30, 100, 9000 |
| Mass fraction of the late burst population | 0.0, 0.01, 0.1, 0.3, 0.5 |
| Age of the main stellar population in the galaxy [Myr] | 500, 1000, 3000, 5000, 10000 |
| Age of the late burst [Myr] | 50, 100, 300 |
| Stellar population: bc03 | |
| Initial mass function | Chabrier |
| Metallicity | 0.02 |
| Dust attenuation: dustatt_modified_CF00 | |
| Av_ISM | 0.3, 0.6, 1.0, 1.6, 2.3, 3.0, 3.8, 5.0 |
| Power-law slope of the attenuation in the ISM | 0.7 |
| Power-law slope of the attenuation in the birth clouds | 1.3 |
| Dust emission: dl2014 | |
| Mass fraction of PAH | 0.47, 1.12, 2.50, 3.90 |
| Minimum radiation field | 1.0, 5.0, 10.0, 25.0, 40.0 |
| Power-law slope index () | 2.0 |
| Fraction illuminated from to | 0.1 |
| AGN emission: fritz2006 | |
| Ratio of the maximum to minimum radii of the dust torus | 60 |
| Optical depth at 9.7 m | 1.0, 6.0 |
| Radial gas density gradient in the torus, | |
| Angular gas density gradient in the torus, | 4.0 |
| Full opening angle of the dust torus | 100.0 |
| Angle between the equatorial axis and line of sight | 0.001, 60.100, 89.990 |
| AGN fraction () | 0.0, 0.1, 0.15, 0.2, 0.3, 0.4, 0.45, 0.5, 0.6, 0.7, 0.75, 0.8, 0.9 |
| Radio emission: radio | |
| FIR/radio correlation coefficient | 1.5, 1.7, 2.0, 2.15, 2.3, 2.45, 2.58, 2.7, 2.8 |
| Power-law slope of the synchrotron emission | 0.8 |
The full catalogue of the identified counterparts of 850-m sources will be provided online as supplementary material. Table 2 shows several selected entries of the catalogue as an example. The optical coordinates of the counterparts are measured in the Subaru/HSC -band images when available, and in the -band images if the object is not detected in the band. If there is more than one radio counterpart, we add the suffix ‘a’ to any radio object that is the closest to the 850-m position and ‘b’ and ‘c’ in order of distance. The suffices ‘-1’ and ‘-2’ for the optical-to-NIR identifier indicate whether the object is a primary counterpart or a secondary counterpart. Multiple secondary counterparts are marked as ‘-21’, ‘-22’, etc.
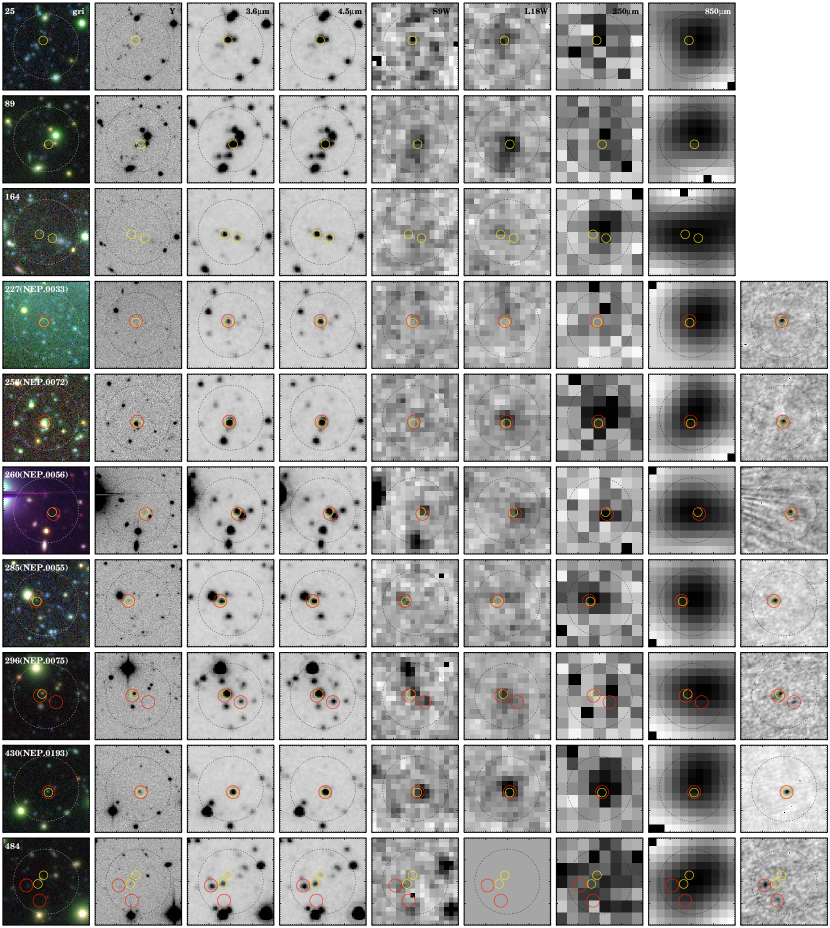
Several examples of multi-wavelength cut-out images around submillimetre sources are shown in Figure 6, which are centred on the 850-m coordinates. The positions of identified counterparts are also marked: red for radio identification, and yellow for optical-NIR-identification. In the optical colour-composite images and in the Subaru/HSC -band images, most counterparts of submillimetre sources are likely to be faint. Optical-NIR colours of the counterparts are expected to be red from comparison of the -band and 3.6-m images. Note that the coordinates of MIR emission (m) with corresponding FIR positions appear to be useful for identifying 850-m sources if the spatial resolution is provided, as has been suggested by other FIR surveys (e.g., Shirley et al., 2021).
Multi-wavelength photometric data points for the identified counterparts are compiled through the nearest object match using either the radio (when available) or the 4.5-m coordinates. At optical wavelengths, the HSC catalogue (Oi et al., 2021) is already combined with the IRAC 3.6- and 4.5-m catalogue (initially using 0.7 arcsec matching radius) to be used in counterpart identification. After visually checking cut-out images of each submillimetre source in the bands, as well as in the 3.6- and 4.5-m bands, we re-derive photometry for several objects that are missed in the HSC catalogue. The reason why these are not included in the released catalogue is that while that catalogue is constructed using the photometry based on the -band (deepest) detection, these objects are faint in the band. We also revise the 3.6- and 4.5-m photometric points for some objects that are not deblended at the IRAC spatial resolution by the initial object detection process. The -band photometry, the CFHT , and photometric data points are also combined through the search in all the available ancillary catalogues (Hwang et al., 2007; Takagi et al., 2012; Oi et al., 2014; Huang et al., 2020) using a matching radius of 1 arcsec. This matching radius is chosen to yield -values (see Equation 1) less than 0.05, considering the source number density. Additionally, the WISE 3-, 4-, 12-, and 22-m photometric points are combined using a search radius of 3 arcsec, from the AllWISE data release (Cutri et al., 2012). Considering the large FWHM of the WISE data, we combine the WISE points to only isolated objects, defined as objects that do not have neighbours of 4.5-m magnitude difference less than 1 mag within 3 arcsec.
To mitigate possible source confusion caused by the poor spatial resolution, we measure MIR and FIR fluxes of the identified counterparts using the object position on the processed image, instead of finding matches in previous catalogues (Kim et al., 2012; Takagi et al., 2012). The position we use corresponds to either the radio coordinates (when available) or the coordinates measured at 4.5 m. Flux densities at 2–24 m are measured in the AKARI/IRC 2–24 m and Spitzer/MIPS 24-m images, utilizing the associated photometry mode of sextractor (Bertin & Arnouts, 1996). The MIR fluxes are measured in 6-arcsec diameter apertures (which are used in deriving 3.6- and 4.5-m fluxes), then aperture corrections are applied. In the AKARI/IRC 2–4 m images of many objects, the fluxes derived from catalogue matching tend to be larger than the fluxes measured at the positions, due to source confusion. However at 7–24 m, fluxes measured with the two different methods (one matching to the blind detection catalogue, and the other performing forced photometry at the given positions) are mostly comparable with each other. This suggests that the MIR flux is dominated by the most likely counterpart of submillimetre emission, and the contribution to the MIR flux by other optical/NIR objects within the submillimetre beam size is not significant.
At FIR wavelengths (100–500 m), we measure fluxes of the counterparts in the Herschel/PACS 100- and 160-m images, and in the Herschel/SPIRE 250-, 350-, and 500-m images that are provided by HELP (Shirley et al., 2021). Fluxes are measured using xid+ (Hurley et al., 2017), a de-blender tool that applies counterpart positions as a prior. Since the spatial coverage of PACS 100- and 160-m images is small, SPIRE photometric points are essential to constrain FIR SED shape along with the 850-m flux density. However, the FWHMs in Herschel/SPIRE 250-, 350-, and 500-m images are 17.6, 23.9, and 35.2 arcsec, respectively, much larger than that of the SCUBA-2 850-m image. Therefore even if we use the positional information of identified counterpart to deblend the SPIRE fluxes, there remain the chance of source confusion at the larger radius. Effects of such possibilities on the SED fitting are described in more detail in Section 4.3.
The number of photometric bands in which the flux density is available ranges from 3 to 36, with a median value of 11. We perform the SED fitting analysis (see the next section) to the identified counterparts using all available photometric points.
4 SED fitting
4.1 Fitting configuration
Based on the multi-wavelength photometric catalogue constructed in Section 3.3, we derive physical properties of submillimetre source counterparts through SED fitting. We use cigale111https://cigale.lam.fr/2020/06/29/version-2020-0/ (Code Investigating GAlaxy Emission, Noll et al., 2009; Boquien et al., 2019), which computes spectral models based on an energy balance principle between the ultra-violet and the infrared wavelengths, where the former mainly represents the energy from direct stellar radiation and the latter reflects emission reprocessed by the dust. By fitting the computed spectral models to the observed photometric points, cigale allows us to investigate the physical properties of galaxies including the star-formation rate (SFR), dust luminosity, contribution of AGN to the total dust luminosity (i.e., AGN fraction), dust attenuation, and the masses of the stellar and dust components. For each output property, the estimated value and its uncertainty are calculated from the mean and standard deviation of the probability distribution function, which is weighted by the goodness of fit. Since we use the ‘photometric redshift’ mode of cigale, the photometric redshift (and its uncertainty) is derived from the SED fitting as well. The photometric redshift value is searched in redshift ranges between 0.1 and 6.0, with a redshift step size of 0.1.
The models and input parameters we use in running the modules of cigale are summarized in Table 1. In order to determine which models to adopt and what values to be used as inputs, we refer to previous studies on the FIR-selected galaxies (Barrufet et al., 2020), submillimetre-selected galaxies (Seo et al., 2018), and optically dark and/or red galaxies (Toba et al., 2020). Since it has been suggested that two-component star-formation histories provide more accurate estimates of the derived stellar masses of SMGs (Michałowski et al., 2014), we use a double decreasing exponential (sfh2exp) as the star-formation history. This consists of two stellar populations with different ages, both described as bursts. We choose the range of ages, e-folding timescales, and late burst mass fractions to allow a wide range of moderate and intense bursts. By allowing a late burst mass fraction to be zero, the use of a double decreasing exponential may also test a classical single exponential. We use the stellar population synthesis model of Bruzual and Charlot (2003) with a Chabrier (2003) stellar initial mass function, both of which have been widely adopted in previous studies of galaxy properties. The metallicity is fixed to be solar, since the SMGs are dust-rich galaxies.
For the attenuation of the stellar and nebular emission (and estimation of the luminosity absorbed by dust), we use the extended Charlot & Fall (2000) attenuation law, with wide parameter ranges based on the comparison between Calzetti et al. (2000) and Charlot & Fall (2000) attenuation laws. With the Charlot & Fall (2000) approach, the attenuation levels of the young stellar population (i.e., by the birth cloud) and the old stellar population (i.e., by the ISM) are treated separately, while they are combined to yield the total attenuation. Barrufet et al. (2020) have mentioned that among different possibilities for dust attenuation laws, the extended Charlot & Fall (2000) option appears to best describe the SEDs of FIR-selected galaxies. Likewise, in our analysis, the number of objects with better fits using the Charlot & Fall (2000) attenuation law is slightly larger than the number of objects that prefer Calzetti et al. (2000), which justifies the use of Charlot & Fall (2000). Note that for some objects, the use of one attenuation law produces a good-fitting result, while the use of the other law is not at all successful. Nevertheless, we decline to apply different attenuation laws to different objects since the use of different attenuation laws yields different stellar mass estimates, such that the dust_modified_CF00 tends to result in estimates of the stellar mass on average 20 per cent higher compared to the use of dust_modified_starburst for the same object.
To model dust emission through the MIR to FIR by emission from PAHs, small grains and larger cold grains, the dl2014 dust templates are used (Draine and Li, 2007; Draine et al., 2014). Seo et al. (2018) have mentioned that the use of the dl2014 module generally results in better fits for SMGs compared to the use of dale2014, since the former provides an extended variation of the radiation field intensity and PAH mass fraction, with an additional free parameter, namely the power-law slope.
The AGN models of Fritz, Franceschini & Hatziminaoglou (2006) are adopted, which consist of three components: radiation from an active nucleus; scattered emission by a dusty torus; and thermal emission from the torus. Most quantities (related to torus properties) are fixed at default values, while the AGN fraction is varied from 0 to 0.9. The angle between the equatorial axis and the line of sight is allowed to take the values 0.001 (type-1 AGN), 89.990 (type-2 AGN), or 60.100 between the two. For objects with radio identification, we also include the radio module to model the synchrotron emission by varying the power-law spectral index and the FIR-to-radio correlation coefficient (e.g., Helou et al., 1985; Yun et al., 2001). Since there is only one data point (20-cm) at radio wavelengths, the synchrotron power-law spectral slope is fixed to 0.8, and the FIR-to-radio correlation coefficient is varied between 1.5 and 2.8.
4.2 Fitting validation
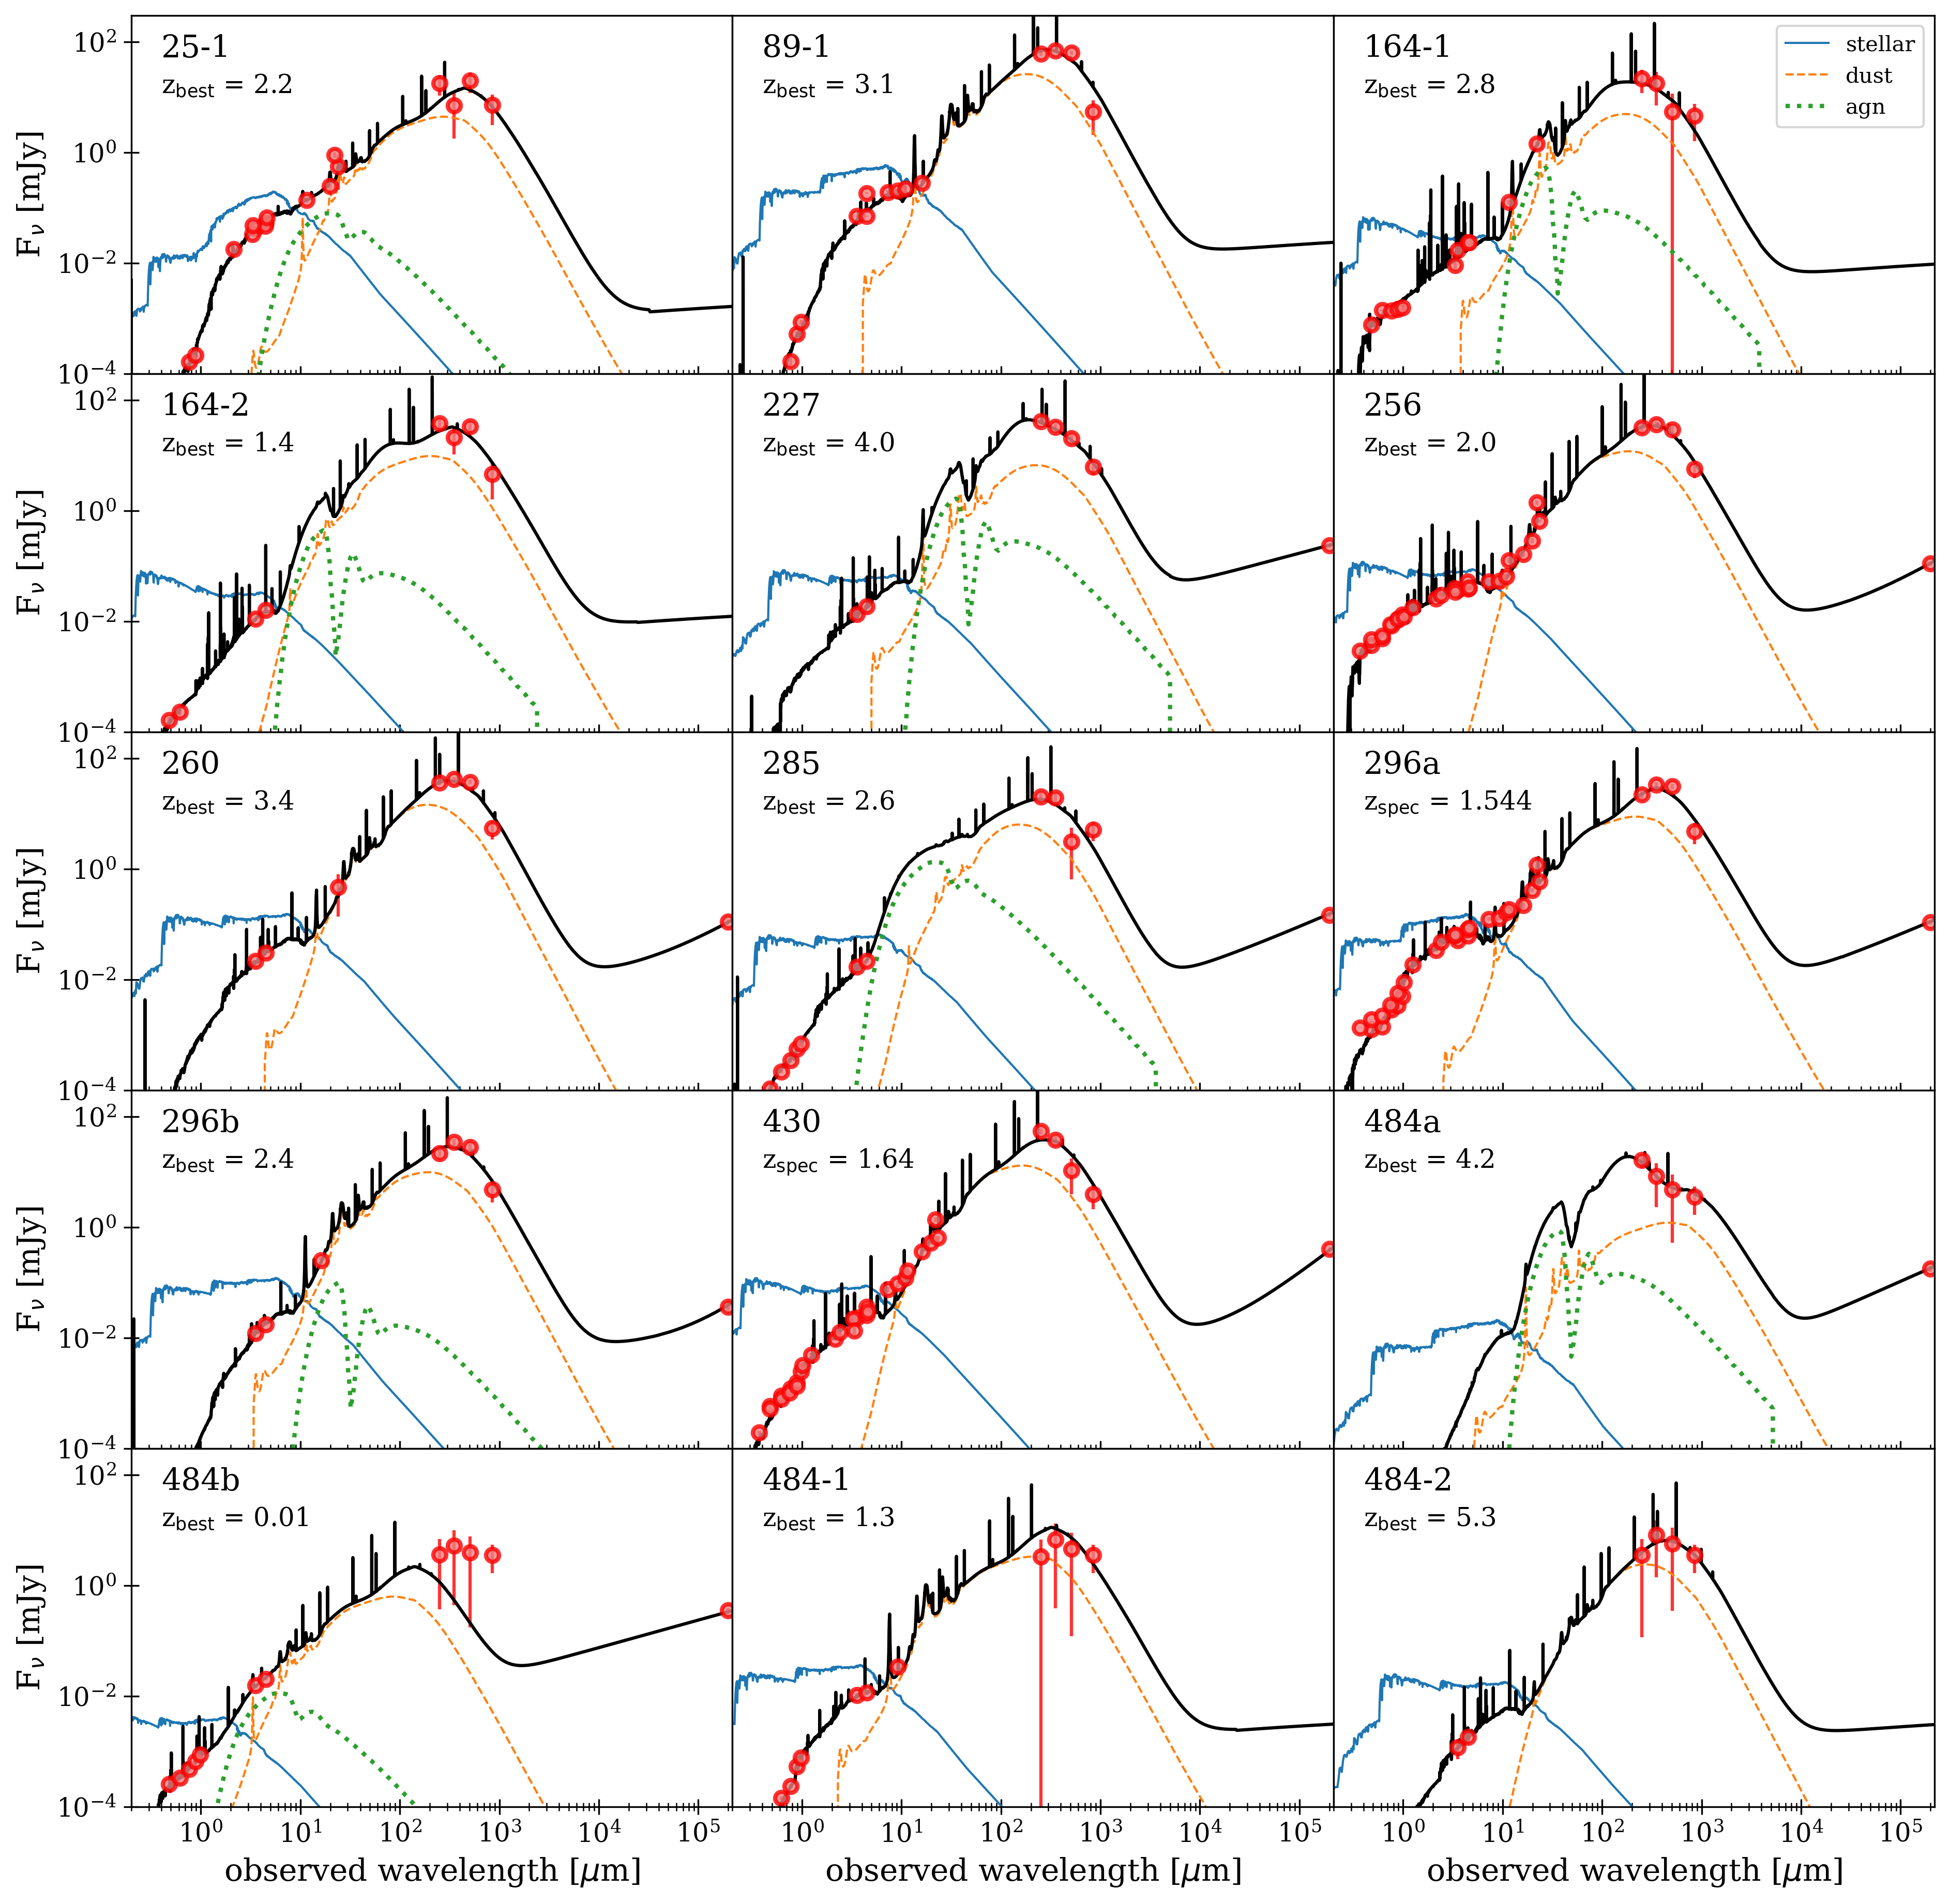
Figure 7 shows the best-fitting SEDs of several selected counterparts. The diversity in the MIR regime of the SEDs suggests that a large number of photometric detections in this wavelength range is crucial in order to estimate the AGN contribution and for understanding the PAH emission. While the best-fitting SED is determined, the derived values for physical parameters from the cigale run are not the values measured from the best-fitting SED. Instead, they are evaluated by weighting all the models based on the fitting quality, with the best-fitting models having the largest weight. Probability distribution function for each physical parameter is derived by searching the maximum likelihood of the individual models located in given bins of the parameter space, then the expected parameter value is calculated by taking the weighted sum of parameter space values using the probability distribution function as weights (see Noll et al., 2009, for details).
The use of cigale for SED fitting provides an opportunity to estimate the reliability of the derived physical parameters. Once the best-fitting SED is determined for each object, the flux densities in different filters can be calculated from the best-fitting SED. Since we know the exact ‘input values’ of physical parameters, then by running cigale again using these calculated flux densities, along with the observed flux uncertainties, at the exactly same setting as in the original run, we can check whether the ‘output values’ are consistent with the input values and see if the derived parameters are reliable. This is called a ‘mock test’ in the cigale structure.
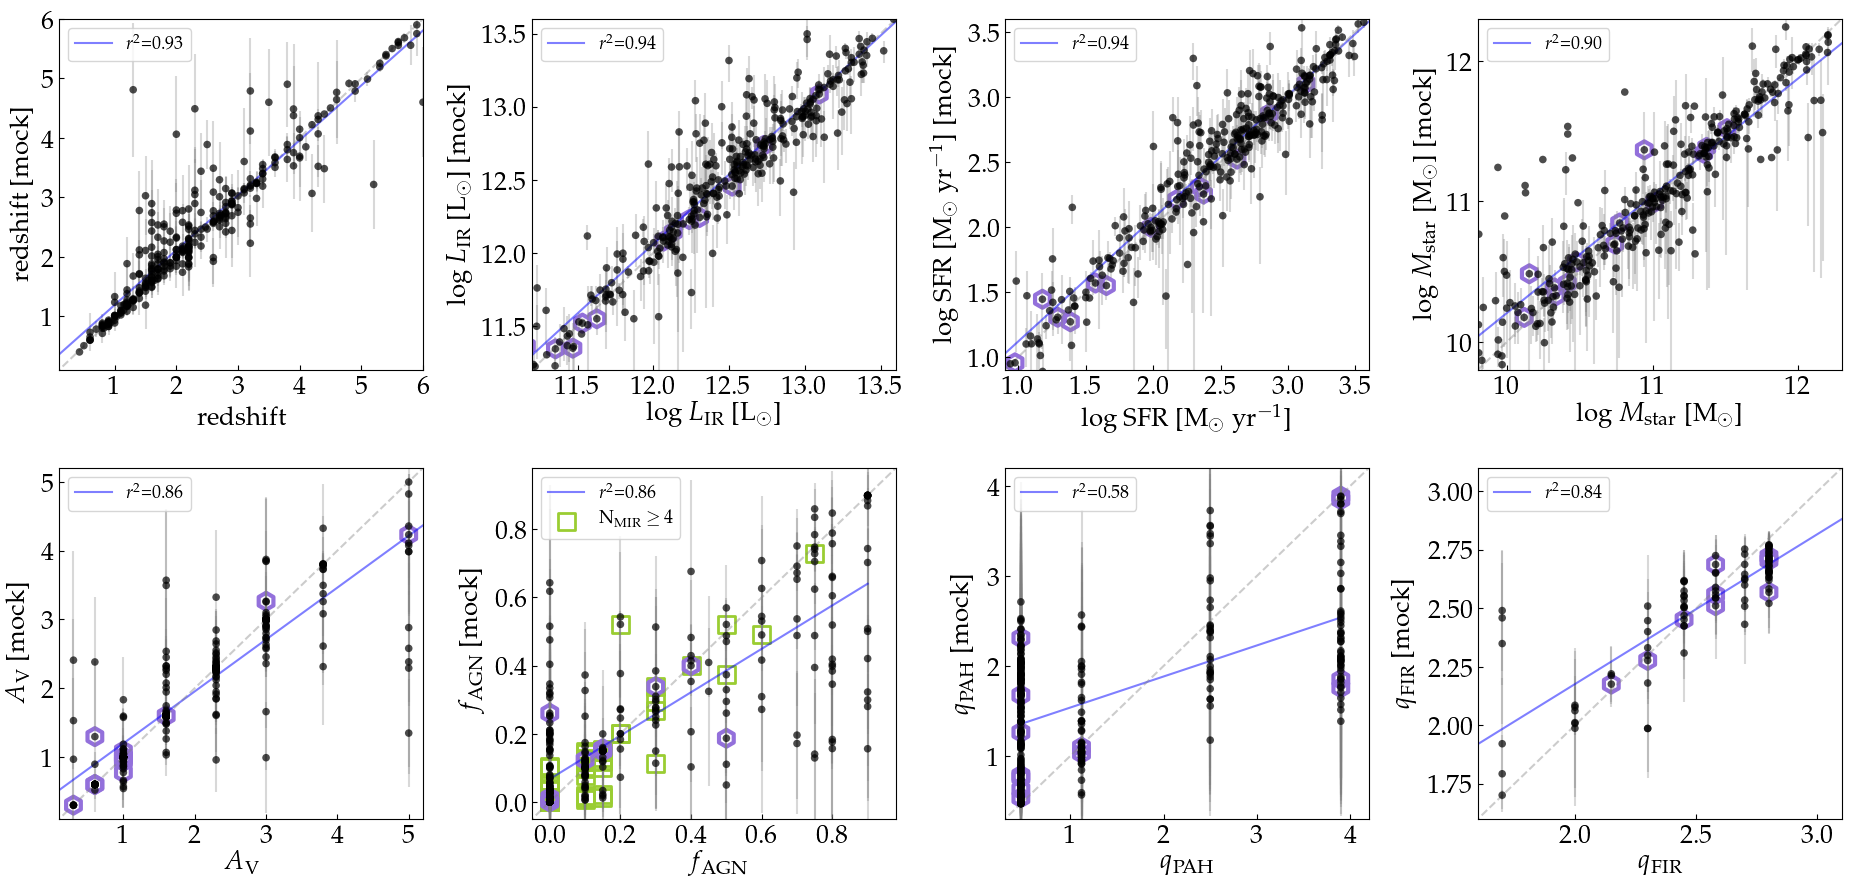
The results of the mock tests for our submillimetre sources are presented in Figure 8. The square of the correlation coefficient, , is indicated for each physical parameter: (photometric) redshift; total IR luminosity; SFR; stellar mass; dust attenuation in the -band; AGN contribution to the total IR luminosity; mass fraction of PAH molecules in dust mass; and FIR-to-radio correlation coefficient . Since the redshift uncertainty affects the parameter values the most, for this purpose, we use the 320 objects with (62 per cent of the entire 514 objects). In the cases of IR luminosity, SFR, and stellar mass, the input values and the output values are consistent within 0.1 dex, and the best-fitting linear correlation is quite close to the one-to-one line. This implies that the IR luminosity, SFR, and stellar mass are reliable parameters that can be determined through SED fitting. The attenuation , AGN fraction , , and are parameters with discrete input values. Nevertheless, these parameters also show values greater than 0.8, except the PAH mass fraction. In the case of AGN fraction , defined as , the scatter appears to be larger than the aforementioned parameters, with being 0.86. The estimation of in the cigale SED fitting mostly relies on the warm dust emission from the putative AGN torus, with peak flux densities observed in the 7–24 m bands. This is supported by the fact that the correlation between the input and output values becomes tighter if the sample is limited to objects having at least four photometric points detected at MIR wavelengths (see squares in the second panel of the bottom row of Fig. 8). The coefficient is even worse (0.58) for the PAH mass fraction , although the true (input) values are still positively correlated with the estimated values by mock photometric points. For radio-identified objects, the value for radio-to-FIR coefficient is 0.84.
The mock tests show that we can trust IR luminosity, SFR, and stellar mass for submillimetre counterparts if we limit the sample to those having redshift dispersion , while caution is needed to use and values. It would be safe to use only for classifying objects into subgroups of objects with high AGN contribution and low AGN contribution, since the quantitative values show too much scatter when there are not enough MIR photometric points available.
We also test if the use of a limited number of discrete values (such as step sizes for the redshift, , AGN fraction, , and ; see Table 1) affects the correlation coefficient. Little difference is found between the values when we use half the step size presented in Table 1. Rather, the ‘uncertainties’ in the input values, i.e., redshift and flux densities, are the main sources that increase the scatter. In the following analysis of physical parameters (in Sections 5.2 and 5.3), we mainly use objects with , except for the case of the redshift distribution (in Section 5.1). Additionally, the best-fitting SED for every object is visually inspected to see if the fitting quality is good enough. This quality check for SED fitting is used to limit the sample in Section 5.
4.3 Effect of different spatial resolutions to photometry
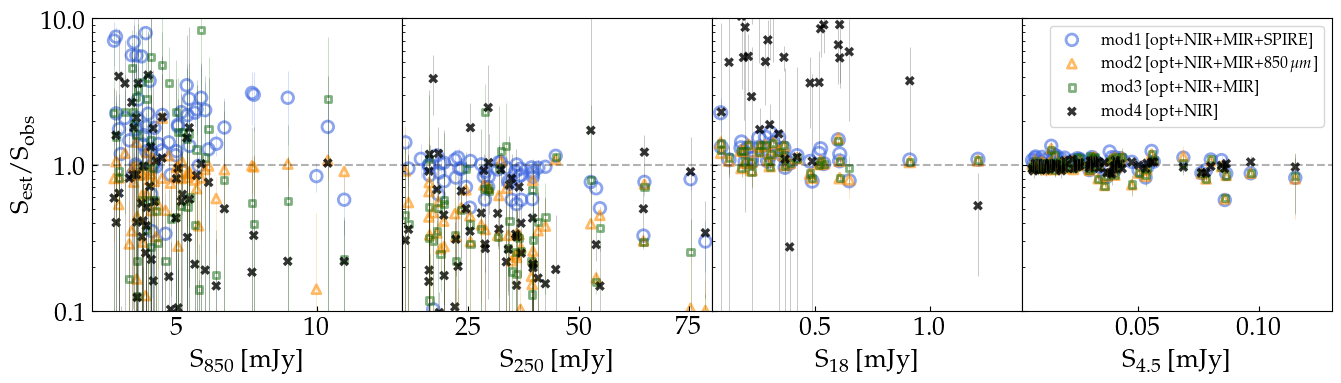
We mentioned that the flux enhancement due to a poor spatial resolution appears to be small in the wavelength range 7–24 m, with the use of fixed position photometry and aperture corrections (Section 3.3), which, however may not be the case for 250–500 m because of much larger FWHMs. In order to understand how the large FWHM affects the flux densities at long wavelengths, we test the SED fitting procedure using different combinations of photometric points, i.e., without including flux(es) from certain band(s), then investigating whether the flux excluded is well reproduced by the SED fitting based on data from the other bands. Such a test strategy enables us to check for consistency between photometric points from different bands. The different filter combinations used in the SED fitting are: (1) optical to 500 m; (2) optical to 24 m with 850 m added; (3) optical to 24 m; and (4) optical to 4.5 m. To secure the reliability of counterpart identification, objects used in this test are the radio-identified counterparts of 850-m emission that lie within 4 arcsec at the 850 m position, except those that are multiples in 20-cm images.
Figure 9 shows the results, i.e., the ratios between the ‘estimated’ flux densities () and the ‘observed’ flux densities (), in JCMT/SCUBA-2 850 m, Herschel/SPIRE 250 m, AKARI/IRC 18 m, and Spitzer/IRAC 4.5 m data. The estimated flux density is the average of all models weighted by the fitting quality. Thus it is close to the expected flux density in the given photometric band inferred by photometric points in other photometric bands. If the ratio is larger than 1, it means that the SED fitting overestimated the flux density in that filter, because the filters included in the SED fitting have enhanced flux densities compared to the filters not included in the SED fitting. The first panel of Fig. 9 shows that 850-m flux densities are overestimated if the SPIRE 250/350/500 m fluxes are included in the SED fitting while 850-m flux is missing. The second panel shows the same trend that the observed 250-m flux density is higher than the estimation based on the 850-m flux densities. The observed 250-m flux density is also high compared to the estimation using up to MIR photometric points (m), with the average of 0.6. A general conclusion is that, while the source responsible for MIR emission is also responsible for 850-m emission (as the FWHM sizes in the MIR and 850 m are comparable), the flux densities at 250–500 m are possibly contaminated by nearby fainter objects that are not identified as counterparts.
The third panel, for the 18-m flux density, shows that if the SED fitting is done using only optical to NIR photometric points, i.e., bands with the highest spatial resolution, the observed MIR flux densities are not properly recovered. In most cases, the optical-to-NIR SED fitting suggests higher MIR flux densities than the observed values, not lower. Thus the difference cannot be explained by source confusion in the MIR images with poor spatial resolution, since the source confusion would increase the observed flux. Instead, this shows the limitation of properly recovering the complex MIR SED from the optical-to-NIR SED fitting. The NIR part of the SED is relatively well constrained, regardless of the inclusion of MIR and FIR data points, again emphasizing the robustness of photometric redshifts, which are mainly driven by the optical-NIR photometric points (last panel of Fig. 9).
From this analysis, we suggest that 250–500-m flux densities for submillimetre source counterparts should be used with care, since there is the possibility of flux enhancement by the contribution of other fainter sources within the Herschel/SPIRE beam. In other bands that have smaller or comparable FWHM as 850-m image, such effect appears to be small.
5 Results
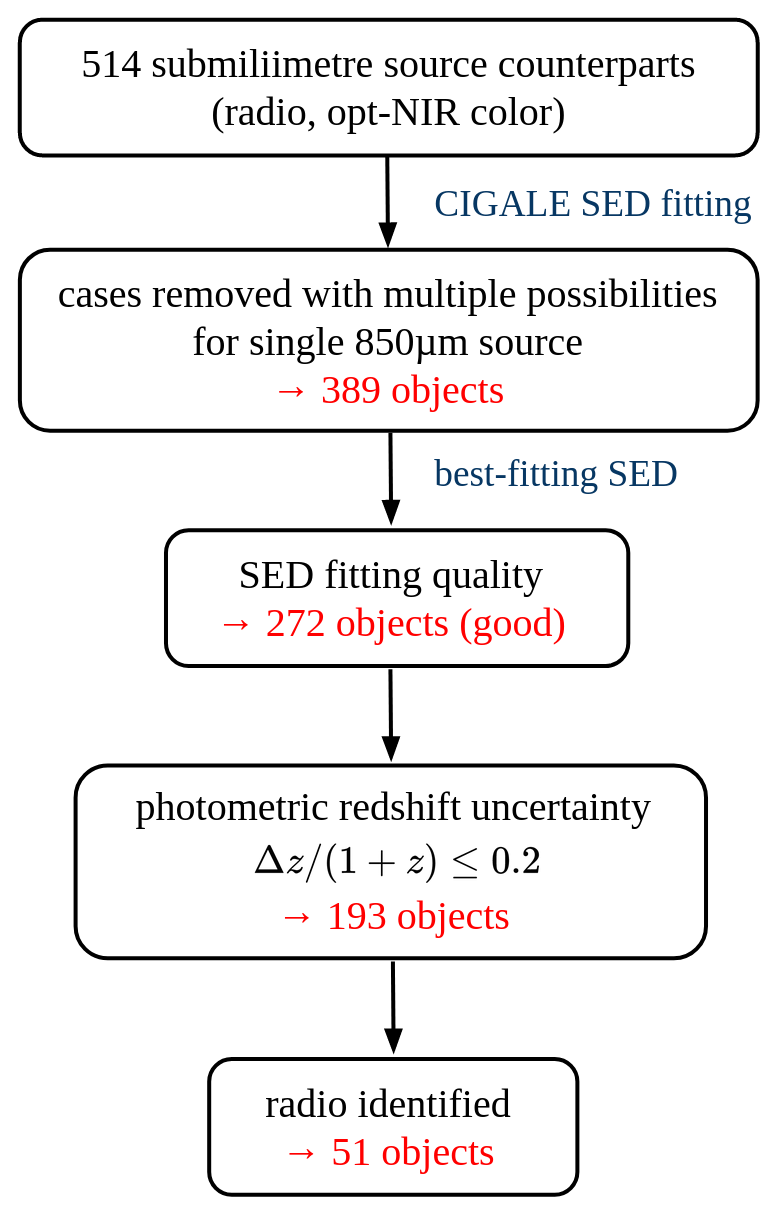
Before presenting results on various physical parameters, we summarize the sample definition process with the flow chart in Figure 10. Starting from 514 counterparts of 449 submillimetre sources, which are either identified by radio emission and/or by the combination of positional and optical-NIR colour information (we only include reliable cases for colour-based counterparts), we perform cigale SED fitting for all objects. Then we exclude cases for which more than one counterpart is identified for a single 850-m source, since it is possible that flux densities of multiple counterparts are not properly deblended in the images with large FWHMs. This leaves 389 objects (SMGs). Then by visually inspecting the best-fitting SEDs, we add tags to objects with good fit quality. These 272 objects comprise the basic sample that is used to draw conclusions about the nature of submillimetre sources. Our mock tests (Fig. 8) showed that physical parameters are reliable for objects with small uncertainties in photometric redshifts, of which the number of objects is 193. Among these 193, 51 objects are radio-identified counterparts while the other 142 objects are optical-NIR colour identified.
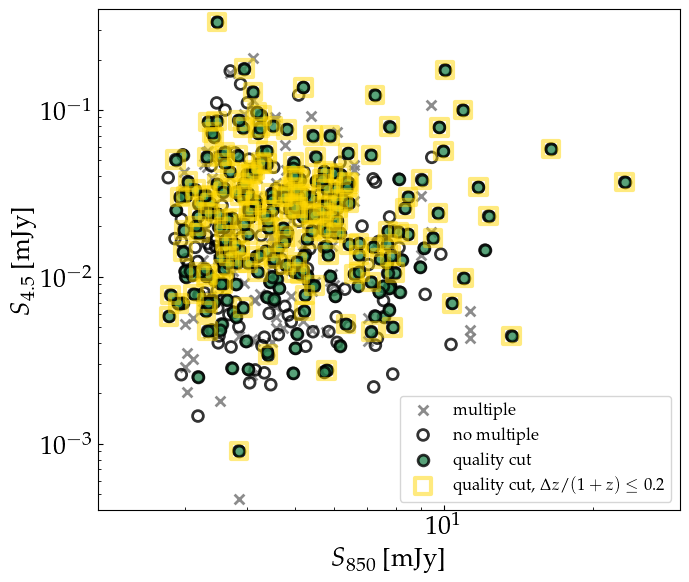
We investigate whether any bias can be introduced by the sample selection, in terms of brightness in 850-m and in near-infrared wavelengths. Figure 11 shows the location of objects that satisfy the criteria in each step in the versus space. 850-m sources with more than one identified counterpart are slightly brighter in 850 m, having mJy, while the mean flux density is mJy for 389 objects if such multiple cases are removed. However, the difference is not large compared to typical flux-density errors at 850 m, and therefore reducing the sample size does not introduce strong biases in terms of 850-m flux density of the submillimetre source population. Moreover, the fraction of submillimetre sources having multiple counterparts does not increase as the 850-m flux density increases. Since we do not have higher spatial resolution images at wavelengths close to 850 m, we can only rely on the counterpart identification strategy introduced in this work, and conclude that the possibility of mis-identification of counterparts to bright submillimetre sources appears to be low. If we select objects with good SED-fitting quality, the mean 850-m flux density is mJy, again suggesting that the sample selection is not biased towards either higher or lower flux density sub-sample. In terms of 4.5-m flux density, the distributions are consistent with each other as the sample definition process proceeds (with –0.028 mJy). However, the photometric redshift uncertainty is affected by the S/N of the photometric points, thus is 0.035 mJy, if we consider 193 objects with good SED fitting quality and low photometric redshift uncertainty. The elimination of objects that have large removes optically-dark counterparts of submillimetre sources that most likely have high photometric redshifts, . In the following Sections 5.2 and 5.3, we mark such objects with different symbols in the plots.
5.1 Redshift and IR luminosity distribution
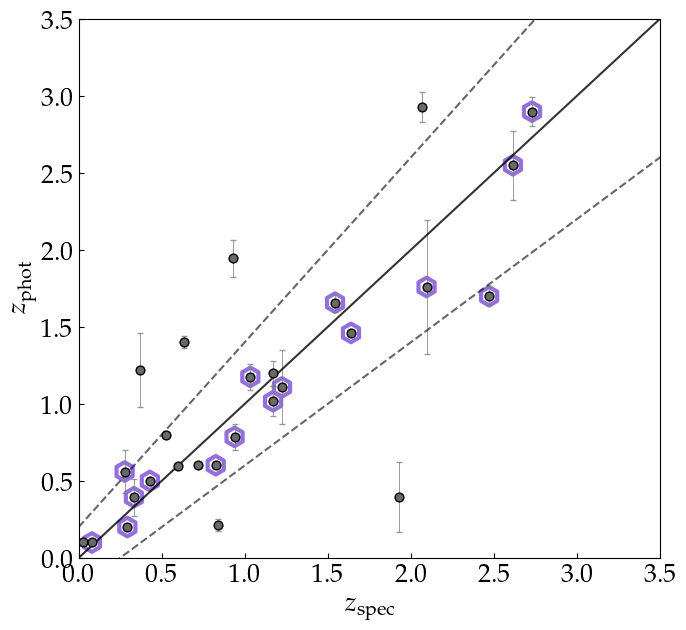
There are several spectroscopic redshift catalogues available over the NEP field (e.g., Shim et al., 2013, and other unpublished redshift lists), from observations using MMT/Hectospec, WIYN/Hydra, Keck/DEIMOS, and GTC/Osiris, in addition to objects with spectroscopic redshifts that can be found from the NASA Extragalactic Database. We search these catalogues for matches to submillimetre source counterparts using coordinates constrained in the radio or 4.5 m. Most of the spectroscopic follow-up survey programmes over the NEP field targeted MIR-selected sources at optical and/or NIR wavelengths, and thus are likely to be limited to NIR-bright objects. In total, 27 counterparts are matched to objects in the spectroscopic redshift catalogues within a radius of 1 arcsec. However, spectroscopic redshifts for 11 objects are assigned low quality flags, corresponding to cases where only one emission line is used to estimate the redshift or the redshift is highly unreliable due to the poor S/N of the spectrum (see Shim et al., 2013, for details).
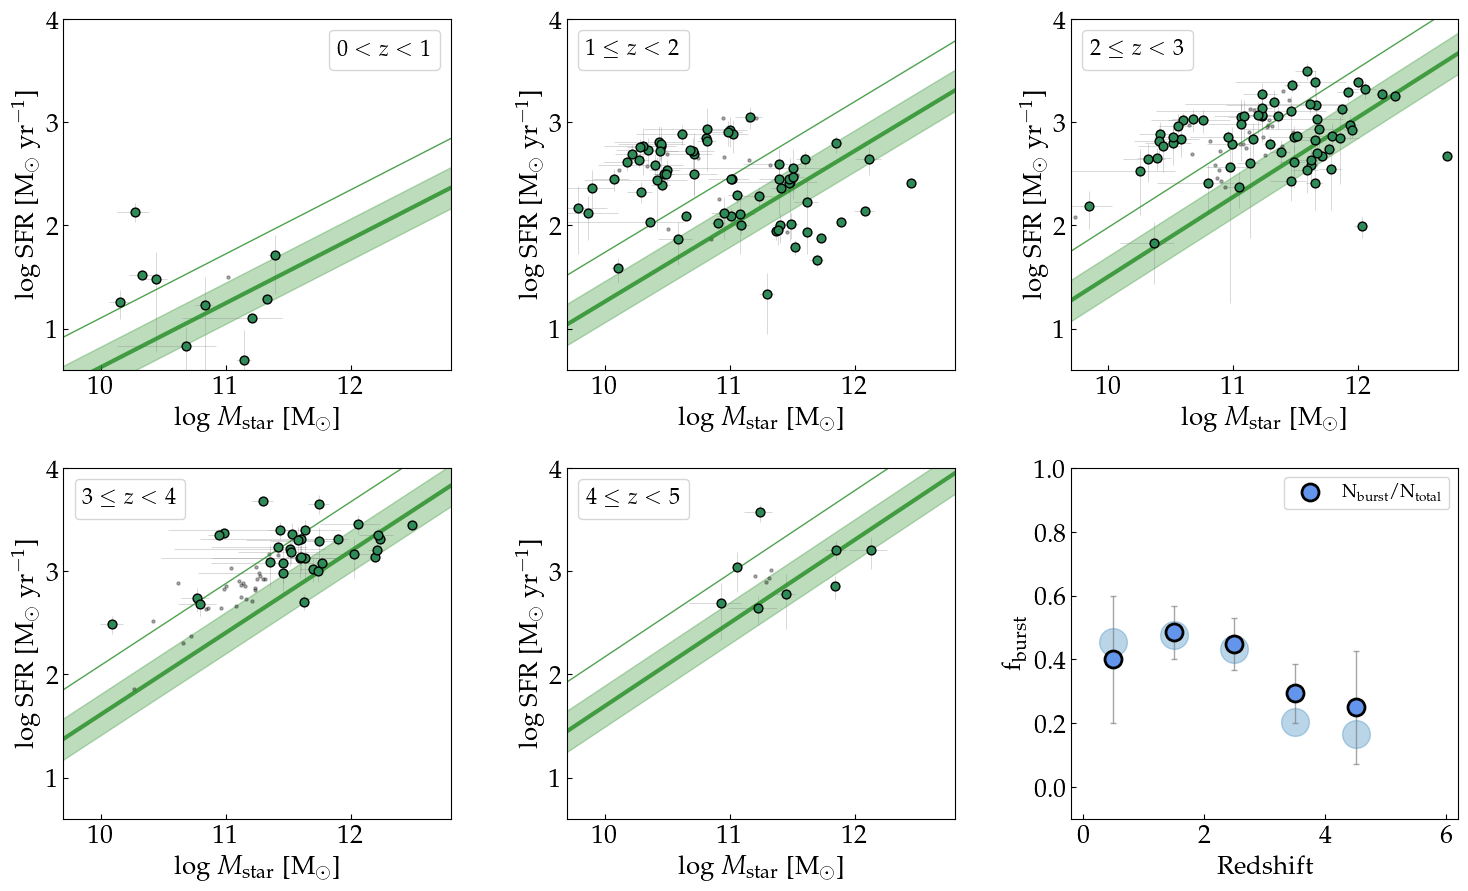
Figure 12 shows a comparison between the photometric redshifts derived from cigale SED fitting and the spectroscopic redshifts. Objects with a good spectroscopic redshift quality flag, i.e., a secure redshift identified with several emission lines, are indicated with open hexagons on the plot. For such objects, the derived photometric redshift is consistent with the spectroscopic redshift within of 0.2. Although the number is limited, the consistency between the photometric redshifts and the spectroscopic redshifts supports the reliability of the photometric redshifts of identified SMGs.
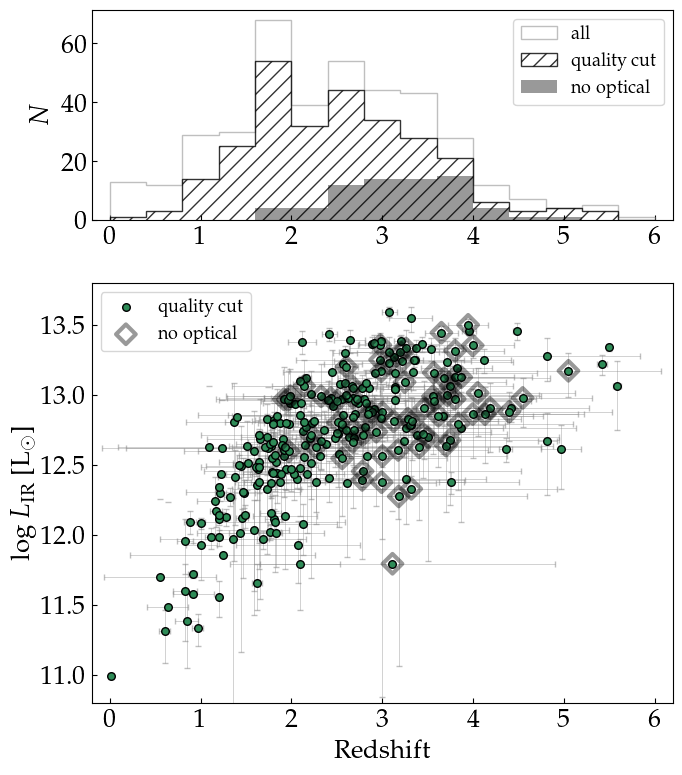
The distribution of photometric redshift of SMGs is presented in the top panel of Fig. 13. The faint grey histogram shows the redshift distribution of 389 objects that are not among the multiple identified counterparts to a single 850-m source, while the hatched histogram shows the redshift distribution of 272 objects with good SED fitting results through a visual check. The mean of the photometric redshift distribution for all 389 objects is and for the 272 objects with good fitting quality, it is , both with the standard deviation of 1.0. Our value, , is consistent with the redshift distribution of the 850-m selected SMGs in earlier studies (Chapman et al., 2003, 2005), and in other cosmological survey fields (e.g., Chen et al., 2016; Michałowski et al., 2017; Zavala et al., 2018; Dudzevičiūtė et al., 2020). There are cases where the identified counterpart is not detected at wavelengths shorter than the NIR (i.e., m), or even at wavelengths shorter than the MIR. Possible reasons for these non-detections include heavy dust attenuation, high-redshift, or a combination of both. 69 objects that are optically undetected show good fitting quality, and the mean redshift of this subgroup of objects is , higher than the mean redshift of the entire sample.
Figure 13 (bottom panel) shows the total IR luminosity distribution of 850-m source counterparts as a function of redshift. As expected from the effect of the negative -correction at 850 m (see Fig. 2), the lowest IR luminosity range that can be probed is consistently of the order over the redshift range . The IR luminosity range of the sources is to . The optically undetected objects that are identified as counterparts to 850-m sources are not the systems with the largest IR luminosities; instead, they are likely to be more heavily attenuated galaxies, as found by Toba et al. (2020). No clear trend is found between the 850-m flux density () and the photometric redshift. There are several objects with , which could be rare high-redshift dusty star-forming galaxies. These candidate objects are worth further investigation through follow-up observations.
5.2 SFR and stellar mass
The SFR and stellar mass are physical quantities that can be constrained more robustly by SED fitting compared to other parameters (Section 4.2). The mean SFR of the 514 identified counterparts (when any sample selection cut is not applied) is M⊙ yr-1, and the mean stellar mass is M⊙. The SFR and stellar mass values are similar in magnitude to those derived for submillimetre-selected galaxies in previous studies (e.g., Chen et al., 2016; Michałowski et al., 2017; Dudzevičiūtė et al., 2020). These two parameters are used to understand the nature of a galaxy, i.e., whether it is in a stage of quiet, passive evolution or in a stage of vigorous star formation. Since the observationally identified main sequence of star-forming galaxies depends on redshift (e.g., Speagle et al., 2014; Nelson et al., 2015), we divide submillimetre source counterparts into redshift bins.
Figure 14 shows the relationship between the SFR and the stellar mass for the 272 submillimetre source counterparts at different redshifts (with good SED fitting quality), compared to the main sequence of star-forming galaxies in the corresponding redshift bin (Speagle et al., 2014, marked as lines). Objects with large photometric redshift uncertainty are marked as small dots, while objects with relatively secure photometric redshifts are marked as filled circles. At redshift bins and , submillimetre sources with larger stellar masses show higher SFRs, following the trend of the star-forming main sequence, while most objects are located above the main sequence. At , on the other hand, the scatter in the SFR for the given stellar mass is relatively large compared to the cases of higher redshift. Massive () objects at this redshift bin show lower SFR than that of main sequence galaxies. Their SEDs suggest that they harbor non-negligible old stellar population reflected by a distinguished 4000 Å break in addition to the dust component, which result higher stellar mass and low SFR. Note that objects of which SED fitting quality is not good enough are excluded in the SFR-stellar mass diagram. Since the quality of SED fitting is affected by the S/N in the flux densities, it is expected that the excluded objects are fainter, dominating the lower stellar mass range. The mean stellar mass of objects with good and bad SED fitting quality is M⊙ and M⊙, respectively. The mean SFR for the excluded objects is also smaller than that of the objects shown in the plot. Therefore by excluding objects with bad SED fitting quality, it is possible that we miss objects that are located lower left of the SFR-stellar mass diagram, and constitute low mass range of star-forming main sequence.
In each panel, representing different redshift bins, objects that lie above the thin line (the limit where the SFRs of galaxies is 3 times that of the main sequence) are generally considered as starbursts (e.g., Barrufet et al., 2020). The fraction of objects that are classified as starbursts, , is defined as . The is an indirect measure of how much star formation quantity is induced by powerful events with short timescales (such as gas-rich major mergers) or powered by relatively steady fueling mechanism (such as continuous gas accretion). In the bottom right panel of Fig. 14, we show how for submillimetre sources changes as a function of redshift. While the filled circles are from 193 objects with well constrained photometric redshifts (), the fainter, larger circles (without error bars) are from all 272 objects with good SED fitting quality. The two values are comparable within the Poisson errors. At , around 40 per cent of submillimetre sources are classified as starbursts. There is no clear trend of decreasing or increasing burst fraction with redshift, if we use 193 objects with small uncertainties in photometric redshift. However, with the inclusion of objects that are mostly faint in wavelengths shortward of 3.6 m, the fraction of galaxies with bursting star formation is lower at compared to the case at . The burst fraction numbers do not change much even if we include objects with less acceptable SED fitting quality (which are missed in the plot): per cent and per cent at and . Barrufet et al. (2020) have suggested that the fraction of starbursts is 43 and 40 per cent in bins of and , respectively, for dusty galaxies selected from Herschel/SPIRE. Using the same redshift bins, we obtain 52 and 44 per cent (or 44 and 41 per cent when no photometric redshift uncertainty cut is applied) for the burst fraction. The values are consistent with each other, suggesting that both SPIRE-selected and SCUBA-2-selected samples represent dusty star-forming galaxies at , while about 50 per cent of them are closely located on the main sequence and another 50 per cent show largely enhanced star formation.
5.3 AGN contribution and star formation
The AGN contribution fraction , i.e., the ratio of the AGN luminosity to the sum of the AGN and dust luminosities, , estimated from the cigale SED fitting, can be used to indicate the role of AGN in a specific object. Since the uncertainties in values are large compared to other quantities (such as SFR and stellar mass; Fig. 8), we use in the classification of objects, not in the comparison of AGN activity levels among objects. Different studies introduce different criteria to discriminate AGN candidates from star-formation dominated galaxies through values (e.g., Serjeant et al., 2010; Shen et al., 2020; Wang et al., 2020). For example, Serjeant et al. (2010) have classified 850-m selected objects with as AGN, considering the uncertainty of estimating the from the broad-band photometry SED fitting. Shen et al. (2020) have divided radio selected objects into star-forming galaxies () and AGN (), and Wang et al. (2020) have suggested to define MIR-selected AGN candidates. Here, we adopt a cut of for object classification. Objects with are defined as ‘high-’ sample, and objects with are defined as ‘low-’ sample.
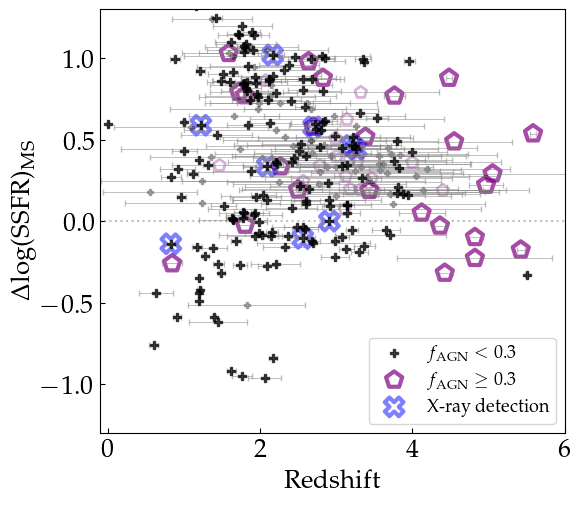
Figure 15 shows 272 objects with good SED fitting quality, divided into two subgroups: high- objects and low- objects. The fraction of high- objects is lower than 10 per cent at , yet at redshift , over 70 per cent of the objects show larger than 0.3. We can conclude that the AGN must have played an important role in the growth of dusty star-forming galaxies. Interestingly, most objects with X-ray detection (Krumpe et al., 2015) show . This suggests two possibilities: first, that X-ray surveys and MIR surveys may probe different populations of AGN, since the MIR surveys have the power to reveal dusty AGN; second, the luminosity of X-ray selected AGN may account for only a small fraction of the infrared luminosity (Pope et al., 2008). Further study on the objects will help decide which explanation is correct.
The enhancement of the SFR is parameterized as the distance of a galaxy from the star-forming galaxy main sequence (MS) in the SFR-stellar mass plane (i.e., ). By using this parameter, the effects of different stellar mass and redshift evolution are removed, and galaxies of all types of star formation from the main sequence ( close to 0) to vigorous starbursts ( significantly above 0) can be distinguished. Previously in Fig. 14, we show that objects with , classified as starbursts, comprise about 40 per cent of the submillimetre sources, with a slight decrease at redshifts higher than . In Fig. 15, average values of submillimetre sources are about 0.34, suggesting that 850-m SMGs are typically galaxies with twice as much SFR than normal star-forming galaxies at similar stellar mass. The mean values are 0.35 and 0.34 for objects with and , respectively, based on 193 objects with small photometric redshift uncertainties. If objects with large photometric redshift uncertainties are included, the mean values are 0.36 and 0.44 for high- and low- objects. The two-sample Kolmogorov-Smirnov test on the values for high- and low- subsamples shows -values as large as 0.26 (when objects with large photometric redshift uncertainties are included) and 0.98 (when only objects with small photometric redshift uncertainties are considered), suggesting that the star formation properties for objects in two subsamples are not different. This implies that an increase of AGN luminosity to total luminosity does not result in either a higher specific SFR (increase in ) or a lower specific SFR (decrease in ). This result is consistent with previous studies on X-ray selected AGN, which reported little evidence of SFR being either enhanced or suppressed by the increasing X-ray luminosity (e.g., Mullaney et al., 2012; Stanley et al., 2015; Ramasawmy et al., 2019).
5.4 Radio-to-FIR ratio
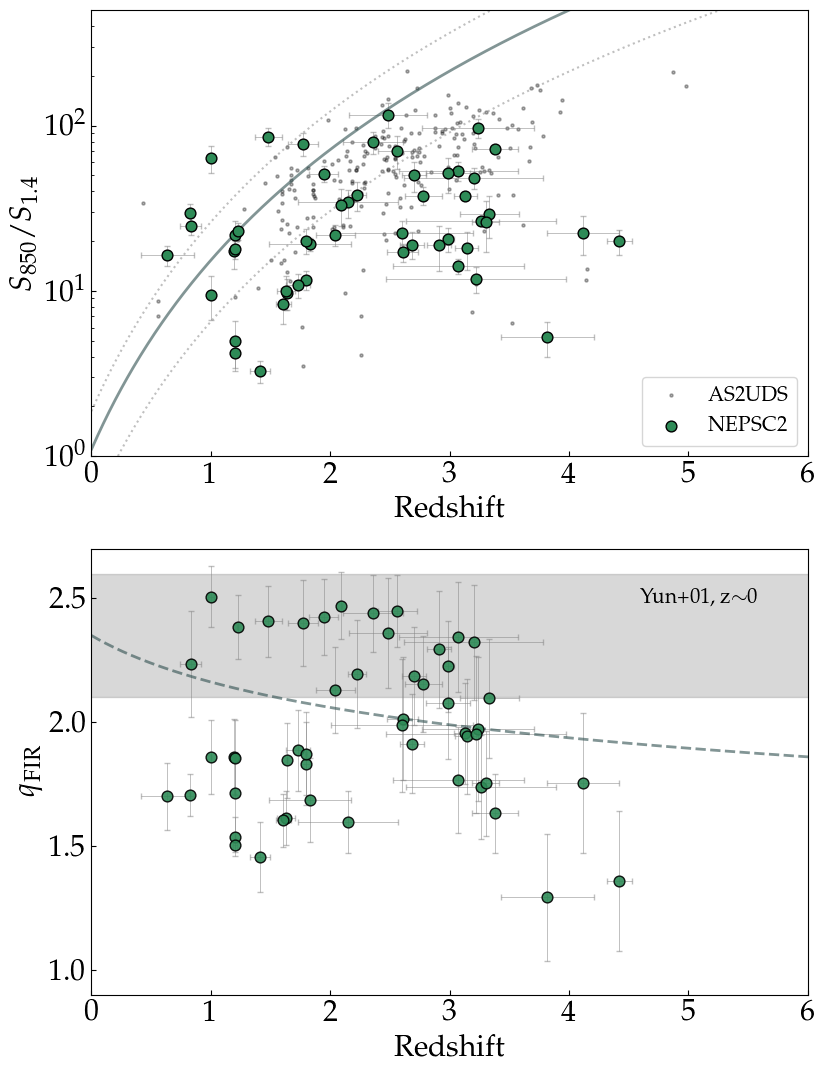
SED fitting of radio-identified submillimetre counterparts is carried out by including the VLA photometry. It has been suggested that the observed radio spectral index between 1.4 GHz and 350 GHz (i.e., 850 m) can be used in the estimation of photometric redshifts, based on the tight radio-to-FIR correlation (e.g., Barger, Cowie & Richards, 2000; Dunlop et al., 2001; Yun and Carilli, 2002; Aretxaga et al., 2003). Figure 16 (top) shows the 850-m to 1.4 GHz flux ratio of the radio-identified submillimetre sources versus the estimated photometric redshift, found by SED fitting. We exclude submillimetre sources with multiple counterparts in this plot, since the 850-m flux density might include contributions from more than one object in those cases. Cases where the SED fitting quality is not acceptable are also excluded.
In the versus redshift plot, 850-m selected submillimetre sources from the NEPSC2 occupy a similar region as the submillimetre sources selected in the higher spatial resolution 870-m image (AS2UDS; Dudzevičiūtė et al., 2020). This suggests that the 850-m flux density measured in NEPSC2 is not contaminated by a radio-quiet component. The solid line plotted for comparison is the expected trend for as a function of redshift, based on the local infrared-luminous galaxy Arp 220 (Barger, Cowie & Richards, 2000). In their work, the SED of Arp 220 over 30–3000 m is approximated as a modified blackbody with emissivity and a dust temperature of 47 K. By assuming the power-law slope of the synchrotron emission to be 0.8, they suggest that is proportional to and is higher at larger dust temperatures. In the figure, two dotted lines represent the same trend with dust temperatures of 80 K and 20 K. The majority of the radio-identified submillimetre sources lie below the Barger, Cowie & Richards (2000) line, implying lower dust temperature and/or different . There are sources at redshifts around with low (), i.e., excess radio emission. Two of these objects have no detection in optical images, while the remaining one is very faint, implying that these may be candidates for heavily attenuated radio-loud AGN at high redshifts.
Rather than using the observed flux density ratio, the FIR-to-radio correlation coefficient (Helou et al., 1985, ), derived using the IR luminosity from full SED fitting, would be a better parameter that can be compared among different galaxy populations. The values for radio-identified submillimetre sources are derived using cigale SED fitting, with the determination coefficient based on the mock tests (Fig. 8). In the bottom panel of Fig. 16, we show the values along the redshift axis, for the same sources presented in the top panel. Local galaxies selected in the FIR are known to show very consistent values (Yun et al., 2001). The radio-identified submillimetre sources in our sample show , lower than the value for local IR luminous galaxies. The change in the value in the redshift range of –3 is roughly consistent with the evolution of FIR-to-radio correlation out to , inferred from a stacking analysis of star-forming main-sequence galaxies (Magnelli et al., 2015). While the radio-identified submillimetre sources show different levels of star formation enhancement, the consistency between our value and that of Magnelli et al. (2015) confirms that the FIR-to-radio correlation is still universal, regardless of the star-formation mode of a galaxy.
Objects with small are classified as ‘radio-excess’ objects, i.e., possible radio-loud AGN. We notice that there exist objects clustered at and with low , which are also distinguished from others because of the low values. The fraction of such radio-excess objects among the radio-identified submillimetre sources is about 15 per cent. These radio-excess objects need further study, particularly through obtaining spectroscopic redshifts.
6 Conclusions
We have presented the multi-wavelength counterparts of 850-m sources in the NEP survey fields along with their physical properties derived from SED fitting. By using the 20-cm radio flux density measured in a higher resolution image, and optical-to-NIR colours, we identify 514 counterparts to 449 submillimetre sources. The identification rate is 69 per cent (449/647). The optical-to-NIR colour identification recovers 84 per cent of the radio counterparts, showing that the robustness of using colours in identification of submillimetre source counterparts. The number fraction of 850-m sources with more than one identified counterpart is about 10 per cent. Our main conclusions on the nature of 850-m selected sources (i.e., SMGs) found through the SED fitting are as follows.
(i) The mean photometric redshift of the SMGs is , similar to values from previous studies of 850-m-selected galaxies. The derived photometric redshifts are consistent with the spectroscopic redshifts, despite the number of objects with available spectroscopic redshifts being small. The total infrared luminosities are approximately comparable to typical values for local ULIRGs, ranging over –13.5. The NEPSC2 SMG sample includes a number of optically faint SMGs, with a mean redshift of .
(ii) In the SFR-stellar mass diagrams for different redshift bins, at least 40 per cent of the SMGs are classified as bursty systems whose SFRs are more than 3 times larger than the star-forming main sequence galaxies at those redshifts. If the samples are limited to those with smaller photometric redshift uncertainty, no clear trend is found for starburst fraction varies along the redshift. However, if we consider the existence of optically undetected or very faint dusty galaxies at that lie on the main sequence, the burst fraction appears to decrease as redshift increases. It is not straightforward to suggest a physical mechanism to explain the SFRs of these galaxies from this result; however, there must be some process that can explain the ‘less bursty’ mode of star formation in these high-redshift dusty galaxies.
(iii) At , most objects that are thought to be responsible for submillimetre emission are classified as high- objects, i.e., objects with AGN contribution to the total infrared luminosity larger than 0.3. The SFR enhancement, defined as an offset from the star-forming main sequence, for high- and low- objects is not statistically different. This shows that AGN play an important role at early times for dusty star-forming galaxy growth, yet there is no clear evidence that the presence of AGN either enhances or suppresses the SFR in the galaxy.
(iv) The scatter in the FIR-to-radio correlation coefficients for submillimetre counterparts is relatively large. While we see values at that are similar to those expected from redshift evolution, some objects show even larger radio excess. This diagnostic could be used in future to search for radio-loud AGN at high redshift, and we already have possible candidates that are worth following up.
The investigation of the nature of 850-m selected galaxies with counterpart identification in this paper could be expanded further using the upcoming data sets; for example, deep X-ray observations from the eROSITA survey (Merloni, Nandra, & Predehl, 2020) and millimetre observations using the LMT/TolTEC (Bryan et al., 2018, 3-bands survey with 1.1, 1.4, and 2.0 mm) will add more constraints on the AGN activity and dust characteristics of these sources. Connections between SMGs and galaxy large-scale structure will also be investigated with the help of planned or ongoing spectroscopic surveys on the NEP region, using MMT/Hectospec and Subaru/PFS.
Data availability
Supplementary data are available at MNRAS online.
Table A1. Counterpart identification results for entire 850-m sources from the NEPSC2S2CLS survey. As the counterpart identification has not been made for three sources that are located close to a saturated star or a Galactic planetary nebula, the number of 850-m sources presented in this table is 644.
Table A2. Catalogue containing the multi-wavelength photometry of the 514 identified counterparts (either with radio or with colour identification that are reliable) and the cigale outputs for each object. The outputs include photometric redshift, total IR luminosity, SFR, stellar mass, , , and , as well as their uncertainties.
Acknowledgements
The James Clerk Maxwell Telescope is operated by the East Asian Observatory on behalf of: The National Astronomical Observatory of Japan; Academia Sinica Institute of Astronomy and Astrophysics; the Korean Astronomy and Space Science Institute; and the Center for Astronomical Mega-Science (as well as the National Key R&D Program of China with No. 2017YFA0402700). Additional funding support is provided by the Science and Technology Facilities Council of the United Kingdom and participating universities in the United Kingdom and Canada. Additional funds for the construction of SCUBA-2 were provided by the Canada Foundation for Innovation. This paper uses the JCMT data taken as part of Program ID M17BL007, M20AL005, and archival data from Program ID MJLSC02. HS, DL and YK acknowledge support from the National Research Foundation of Korea (NRF) grant, No. 2018R1C1B6008498 and No. 2021R1A2C4002725, funded by the Korea government (MSIT). DS acknowledges support from the Natural Sciences and Engineering Council of Canada. SS was supported in part by ESCAPE - The European Science Cluster of Astronomy & Particle Physics ESFRI Research Infrastructures, which in turn received funding from the European Union’s Horizon 2020 research and innovation programme under Grant Agreement no. 824064. SS also thanks the Science and Technology Facilities Council for support under grant ST/P000584/1. YA acknowledges financial support by NSFC grant 11933011 and the science research grant from the China Manned Space Project with NO. CMS-CSST-2021-B06. TG acknowledges the support by the Ministry of Science and Technology of Taiwan through grant105-2112-M-007-003-MY3. HSH acknowledges support by the National Research Foundation of Korea (NRF) grant funded by the Korea government (MSIT) (No. 2021R1A2C1094577). MI acknowledges the support from the National Research Foundation of Korea (NRF) grant, No. 2020R1A2C3011091, funded by the Korea government (MSIT). MPK acknowledges support from the First TEAM grant of the Foundation for Polish Science No. POIR.04.04.00-00-5D21/18-00. MJM acknowledges the support of the National Science Centre, Poland through the SONATA BIS grant 2018/30/E/ST9/00208. GJW gratefully acknowledges an Emeritus Fellowship from The Leverhulme Trust.
References
- Alexander et al. (2008) Alexander D.M. et al., 2008, AJ, 135, 1968
- An et al. (2019) An F X. et al., 2019, ApJ, 886, 48
- Appleton et al. (2004) Appleton P.N. et al., 2004, ApJS, 154, 147
- Aretxaga et al. (2003) Aretxaga I., Hughes D.H., Chapin E.L., Gaztanaga E., Dunlop J.S., Ivison R.J., 2003, MNRAS, 342, 759
- Barger et al. (1998) Barger A.J., Cowie L.L., Sanders D.B., Fulton E., Taniguchi Y., Sato Y., Kawara K., Okuda H., 1998, Nature, 394, 248
- Barger, Cowie & Richards (2000) Barger A.J., Cowie L.L., Richards E.A., 2000, AJ, 119, 2092
- Barger et al. (2014) Barger A.J. et al., 2014, ApJ, 784, 9
- Barrufet et al. (2020) Barrufet L. et al., 2020, A&A, 641, 129
- Bertin & Arnouts (1996) Bertin E., Arnouts S., 1996, A&AS, 117, 393
- Blain et al. (2002) Blain A.W., Smail I., Ivison R.J., Kneib J.-P., Frayer D.T., 2002, Physics Reports, 369, 111
- Boquien et al. (2019) Boquien M., Burgarella D., Roehlly Y., Buat V., Ciesla L., Corre D., Inoue A.K., Salas H., 2019, A&A, 622, 103
- Bourne et al. (2016) Bourne N. et al., 2016, MNRAS, 462, 1714
- Bruzual and Charlot (2003) Bruzual G., Charlot S., 2003, MNRAS, 344, 1000
- Bryan et al. (2018) Bryan S. et al., 2018, Proc. SPIE Conf. Ser. Vol. 10708, p.107080J
- Burgarella et al. (2019) Burgarella D. et al., 2019, PASJ, 71, 12
- Calzetti et al. (2000) Calzetti D., Armus L., Bohlin R.C., Kinney A.L., Koornneef J., Storchi-Bergmann T., 2000, ApJ, 533, 682
- Casey et al. (2013) Casey C.M. et al., 2013, MNRAS, 436, 1919
- Casey, Narayanan & Cooray (2014) Casey C.M., Narayanan D., Cooray A., 2014, Physics Reports, 541, 45
- Chapin et al. (2009) Chapin E.L. et al.,2009, MNRAS, 398, 1793
- Chapman et al. (2001) Chapman S.C., Lewis G.F., ScottD., Richards E., Borys C., Steidel C. C., Adelberger K. L., Shapley A.E., 2001, ApJL, 548, 17
- Chapman et al. (2003) Chapman S.C. et al., 2003, ApJ, 585, 57
- Chapman et al. (2005) Chapman S.C., Blain A.W., Smail I., Ivison R.J., 2005, ApJ, 622, 772
- Charlot & Fall (2000) Charlot S., Fall S.M., 2000, ApJ, 539, 718
- Chabrier (2003) Chabrier G., 2003, PASP, 115, 763
- Chen et al. (2016) Chen C.-C. et al., 2016, ApJ, 820, 82
- Condon (1992) Condon J.J., 1992, AR&A, 30, 575
- Cowley et al. (2015) Cowley W.I., Lacey C.G., Baugh C.M., Cole S., 2015, MNRAS, 446, 1784
- Cutri et al. (2012) Cutri R. M. et al., 2012, VizieR Online Data Catalogue, 2307
- da Cunha et al. (2015) da Cunha E. et al., 2015, ApJ, 806, 110
- Davé et al. (2010) Davé R., Finlator K., Oppenheimer B.D., Fardal M., Katz N., Kereš D., Weinberg D.H., 2010, MNRAS, 404, 1355
- Dey et al. (2008) Dey A. et al., 2008, ApJ, 677, 943
- Downes et al. (1986) Downes A.J.B., Peacock J.A., Savage A., Carrie D.R., 1986, MNRAS, 218, 31
- Draine and Li (2007) Draine B.T., Li A., 2007, ApJ, 657, 810
- Draine et al. (2014) Draine B.T. et al., 2014, ApJ, 780, 172
- Dudzevičiūtė et al. (2020) Dudzevičiūtė U. et al., 2020, MNRAS, 494, 3828
- Dunlop et al. (2001) Dunlop J.S. et al., 2001, NewAR, 45, 609
- Fritz, Franceschini & Hatziminaoglou (2006) Fritz J., Franceschini A., Hatziminaoglou E., 2006, MNRAS, 366, 767
- Geach et al. (2007) Geach J. E., Smail I., Chapman S. C., Alexander D. M., Blain A. W., Stott J. P., Ivison R. J., 2007, ApJL, 655
- Geach et al. (2017) Geach J.E. et al., 2017, MNRAS, 465, 1789
- Hales et al. (2012) Hales C.A., Murphy T., Curran J.R., Middelberg E., Gaensler B.M., Norris R.P., 2012, MNRAS, 425, 979
- Hasinger et al. (2021) Hasinger G., Freyberg M., Hu E.M., Waters C.Z., Capak P., Moneti A., McCracken H.J., 2021, A&A, 645, 95
- Hayward et al. (2021) Hayward C.C. et al., 2021, MNRAS, 502, 2922
- Helou et al. (1985) Helou G., Soifer B.T., Rowan-Robinson M., 1985, ApJL, 298, 7
- Henriques et al. (2015) Henriques B.M.B., White S.D.M., Thomas P.A., Angulo R., Guo Q., Lemson G., Springel V., Overzier R., 2015, MNRAS, 451, 2663
- Hill et al. (2018) Hill R. et al., 2018, MNRAS, 477, 2042
- Hodge et al. (2013) Hodge J.A. et al., 2013, ApJ, 768, 91
- Holland et al. (2013) Holland W.S. et al., 2013, MNRAS, 430, 2513
- Hopkins et al. (2008) Hopkins P.F., Hernquist L., Cox T.J., Keres D., 2008, ApJS, 175, 356
- Huang et al. (2020) Huang T.-C. et al., 2020, MNRAS, 498, 609
- Hurley et al. (2017) Hurley P. D. et al. 2017, MNRAS, 464, 885
- Hwang et al. (2007) Hwang N. et al., 2007, ApJS, 172, 583
- Hwang et al. (2010) Hwang H.S. et al., 2010, MNRAS, 409, 75
- Hwang & Geller (2013) Hwang H.S., Geller, M.J., 2013, ApJ, 769, 116
- Imai et al. (2007) Imai K., Matsuhara H., Oyabu S., Wada T., Takagi T., Fujishiro N., Hanami H., Pearson C. P., 2007, AJ, 133, 2418
- International Consortium Of Scientists (2011) International Consortium Of Scientists, 2011, CASA: Common Astronomy Software Applications, Astrophysics Source Code Library [record ascl: 1107.013]
- Ivison et al. (2002) Ivison R.J. et al., 2002, MNRAS, 337, 1
- Ivison et al. (2007) Ivison R.J. et al., 2007, MNRAS, 380, 199
- Jeon et al. (2010) Jeon Y., Im M., Ibrahimov M., Lee H. M., Lee I., Lee M. G., 2010, ApJS, 190, 166
- Jeon et al. (2014) Jeon Y., Im M., Kang E., Lee H. M., Matsuhara H., 2014, ApJS, 214, 20
- Johnson et al. (2013) Johnson S.P. et al., 2013, MNRAS, 431, 662
- Karim et al. (2013) Karim A. et al., 2013, MNRAS, 432, 2
- Kim et al. (2012) Kim S.J. et al., 2012, A&A, 548, A29
- Kim et al. (2021) Kim S.J. et al., 2021, MNRAS, 500, 4078
- Koprowski et al. (2016) Koprowski M.P. et al., 2016, MNRAS, 458, 4321
- Krumpe et al. (2015) Krumpe M. et al., 2015, MNRAS, 446, 911
- Lagos et al. (2020) Lagos C.P. et al., 2020, MNRAS, 499, 1948
- Laird et al. (2010) Laird E.S., Nandra K., Pope A., Scott D., 2010, MNRAS, 401, 2763
- Lim et al. (2020) Lim C.-F. et al., 2020, ApJ, 889, 80
- Liu et al. (2019) Liu R.H., Hill R., Scott D., Almaini O., An F., Gubbels C., Hsu L.-T., Lin L., Smail I., Stach S., 2019, MNRAS, 489, 1770
- Lovell et al. (2021) Lovell C.C., Geach J.E., Dave R., Narayanan D., Li Q., MNRAS, 502, 772
- Magnelli et al. (2013) Magnelli B. et al., 2013, A&A, 555, 132
- Magnelli et al. (2015) Magnelli B. et al., 2015, A&A, 573, 45
- McAlpine et al. (2019) McAlpine S. et al., 2019, MNRAS, 488, 2440
- Merloni, Nandra, & Predehl (2020) Merloni A., Nandra K., Predehl P., 2020, Nat. Astron. 4, 634
- Miettinen et al. (2017) Miettinen O. et al., 2017, A&A, 602, 54
- Michałowski et al. (2010) Michałowski M., Hjorth J., Watson D., 2010, A&A, 514, 67
- Michałowski et al. (2012) Michałowski M.J., Dunlop J.S., Cirasuolo M., Hjorth J., Hayward C.C., Watson D., 2012, A&A, 541, 85
- Michałowski et al. (2014) Michałowski M.J., Hayward C.C., Dunlop J. S., Bruce V. A., Cirasuolo M., Cullen F., Hernquist L., 2014, A&A, 571, 75
- Michałowski et al. (2017) Michałowski M.J. et al., 2017, MNRAS, 469, 492
- Mullaney et al. (2012) Mullaney J.R., et al., 2012, MNRAS, 419, 95
- Narayanan et al. (2009) Narayanan D., Cox T.J., Hayward C.C., Younger J.D., Hernquist L., 2009, MNRAS, 400, 1919
- Narayanan et al. (2010) Narayanan D., Hayward C.C., Cox T.J., Hernquist L., Jonsson P., Younger J.D., Groves B., 2010, MNRAS, 401, 1613
- Narayanan et al. (2015) Narayanan D. et al., 2015, Nature, 525, 496
- Nayyeri et al. (2018) Nayyeri H. et al., 2018, ApJS, 234, 38
- Nelson et al. (2015) Nelson D. et al., 2015, Astronomy and Computing, 13, 12
- Nguyen et al. (2010) Nguyen H.T. et al., 2010, A&A, 518, 5
- Noll et al. (2009) Noll S., Burgarella D., Giovanni E., Buat V., Marcillac D., Munoz-Mateos J. C., 2009, A&A, 507, 1793
- Oi et al. (2014) Oi N. et al., 2014, A&A, 566, A60
- Oi et al. (2021) Oi N. et al., 2021, MNRAS, 500, 5024
- Oke (1974) Oke J. B. et al., 1974, ApJS, 27, 21
- Pearson et al. (2017) Pearson C. et al., 2017, PKAS, 32, 219
- Pearson et al. (2019) Pearson C. et al., 2019, PASJ, 71, 13
- Planck Collaboration et al. (2020) Planck Collaboration et al., 2020, A&A, 641, 6
- Pope et al. (2008) Pope A. et al., 2008, ApJ, 675, 1171
- Ramasawmy et al. (2019) Ramasawmy J., Stevens J., Garreth M., Geach J. E., 2019, MNRAS, 486, 4320
- Riechers et al. (2010) Riechers D.A. et al., 2010, ApJL, 720, 131
- Salvato et al. (2018) Salvato M. et al., 2018, MNRAS, 473, 4937
- Sanders et al. (1988) Sanders D.B., Soifer B.T., Elias J.H., Madore B.F., Matthews K., Neugebauer G., Scoville N.Z., 1988, ApJ, 325, 74
- Schreiber et al. (2015) Schreiber C. et al., 2015, A&A, 575, 74
- Seo et al. (2018) Seo H. et al., 2018, JKAS, 51, 49
- Serjeant et al. (2010) Serjeant S. et al., 2010, A&A, 514, 10
- Shen et al. (2020) Shen L. et al., 2020, ApJ, 902, 101
- Shim et al. (2013) Shim H. et al., 2013, ApJS, 207, 37
- Shim et al. (2020) Shim H. et al., 2020, MNRAS, 498, 5065
- Shirley et al. (2021) Shirley R. et al., 2021, MNRAS, 507, 129
- Simpson et al. (2015) Simpson J.M. et al., 2015, ApJ, 807, 128
- Simpson et al. (2019) Simpson J.M. et al., 2019, ApJ, 880, 43
- Simpson et al. (2020) Simpson J.M. et al., 2020, MNRAS, 495, 3409
- Smail, Ivison & Blain (1997) Smail I., Ivison R. J., Blain A. W., 1997, ApJL, 490, 5
- Smail et al. (1998) Smail I., Ivison R. J., Blain A.W., Kneib, J.P., 1998, ApJL, 507, 21
- Smolčić et al. (2015) Smolčić V. et al., 2015, A&A, 576, 127
- Speagle et al. (2014) Speagle J.S., Steinhardt C.L., Capak P.L., Silverman J.D., 2014, ApJS, 214, 15
- Sutherland & Saunders (1992) Sutherland W., Saunders W., 1992, MNRAS, 259, 413
- Stanley et al. (2015) Stanley F., Harrison C. M., Alexander D.M., Swinbank A. M., Aird J.A., Del Moro A., Hickox R.C., Mullaney J.R., 2015, MNRAS, 453, 591
- Tacconi et al. (2006) Tacconi L.J. et al., 2006, ApJ, 640, 228
- Takagi et al. (2012) Takagi T. et al., 2012, A&A, 537, A24
- Takeuchi et al. (2005) Takeuchi T.T., Buat V., Iglesias-Paramo J., Boselli A., Burgarella D., 2005, A&A, 432, 423
- Toba et al. (2015) Toba Y. et al. 2015, PASJ, 67, 86
- Toba & Nagao (2016) Toba Y., Nagao T., 2016, ApJ, 820, 46
- Toba et al. (2017) Toba Y. et al. 2017, ApJ, 840, 21
- Toba et al. (2018) Toba Y., Ueda J., Lim C.-F., Wang W.-H., Nagao T., Chang Y.-Y., Saito T., Kawabe R., 2018, ApJ, 857, 31
- Toba et al. (2020) Toba Y. et al., 2020, ApJ, 889, 76
- Toba et al. (2020) Toba Y. et al., 2020, ApJ, 899, 35
- Tomczak et al. (2016) Tomczak A. R. et al., 2016, ApJ, 817, 118
- Ueda et al. (2018) Ueda Y. et al., 2018, ApJ, 853, 24
- Wada et al. (2008) Wada T. et al., 2008, PASJ, 60, S517
- Wang et al. (2011) Wang, W.-H., Cowie, L. L., Barger, A. J., Williams, J. P., 2011, ApJL, 726, 18
- Wang et al. (2013) Wang S.-X. et al., 2013, ApJ, 778, 179
- Wang et al. (2020) Wang T.-W. et al., 2020, MNRAS, 499, 4068
- Ward et al. (2022) Ward B.A. et al., 2022, MNRAS, 510, 2261
- White et al. (2010) White G.J. et al., 2010, A&A, 517, A54
- Yun and Carilli (2002) Yun M.S., Carilli, C.L., 2002, ApJ, 568, 88
- Yun et al. (2001) Yun M.S., Reddy N.A., Condon J.J., 2001, ApJ, 554, 803
- Zavala et al. (2018) Zavala J.A. et al., 2018, MNRAS, 475, 5585
| SMM ID | NEPSC2 ID | SC2CLS ID | Radio ID | Opt/IR ID | RA (850 ) | Dec (850 ) | RA (radio) | Dec (radio) | RA (IRAC) | Dec (IRAC) | RA (optical) | Dec (optical) | radio | colour | reliable | multiple | ||
|---|---|---|---|---|---|---|---|---|---|---|---|---|---|---|---|---|---|---|
| 2 | NEPSC2_J175052+660458 | — | — | 2-1 | 267.7205 | 66.0828 | — | — | 267.71922 | 66.08245 | 267.71855 | 66.08249 | 32.039 | 3.139 | N | Y | Y | N |
| 10 | NEPSC2_J180457+671542 | — | — | 10-1 | 271.2404 | 67.2617 | — | — | 271.24429 | 67.26094 | 271.24402 | 67.26064 | 10.577 | 4.066 | N | Y | N | N |
| 20 | NEPSC2_J180157+671747 | — | — | 20-1 | 270.4882 | 67.2966 | — | — | 270.48607 | 67.29675 | 270.48616 | 67.29679 | 9.424 | 3.421 | N | Y | Y | Y |
| 20 | NEPSC2_J180157+671747 | — | — | 20-2 | 270.4882 | 67.2966 | — | — | 270.49095 | 67.29782 | 280.49121 | 67.29783 | 9.424 | 3.421 | N | Y | Y | Y |
| 23 | NEPSC2_J175619+664606 | NEP.0003 | 23a | 23-21 | 269.0807 | 66.7686 | 269.07967 | 66.76822 | 269.07975 | 66.76818 | — | — | 11.288 | 1.805 | Y | Y | Y | Y |
| 23 | NEPSC2_J175619+664606 | NEP.0003 | 23b | 23-22 | 269.0807 | 66.7686 | 269.08212 | 66.76803 | 269.08219 | 66.76800 | 269.08220 | 66.76815 | 11.288 | 1.805 | Y | Y | Y | Y |
| 29 | NEPSC2_J175515+664355 | NEP.0010 | 29 | 29-1 | 269.8131 | 66.7321 | 268.81263 | 66.73238 | 268.81288 | 66.73238 | 268.81291 | 66.73248 | 10.963 | 1.782 | Y | Y | Y | N |
| 63 | NEPSC2_J175351+670606 | — | — | 63-1 | 268.4652 | 67.1018 | — | — | 268.46617 | 67.10250 | — | — | 7.904 | 2.850 | N | Y | Y | N |
| 100 | NEPSC2_J180006+663654 | NEP.0017 | — | 100-1 | 270.0286 | 66.6151 | — | — | 270.03033 | 66.61509 | 270.03014 | 66.61510 | 8.339 | 1.857 | N | Y | Y | N |
| 163 | NEPSC2_J175236+663813 | NEP.0015 | 163a | 163-1 | 268.1514 | 66.6371 | 268.15002 | 66.63690 | 268.14993 | 66.63681 | 268.14987 | 66.63675 | 7.272 | 1.816 | Y | Y | Y | Y |
| 163 | NEPSC2_J175236+663813 | NEP.0015 | 163b | 163-3 | 268.1514 | 66.6371 | 268.15049 | 66.63855 | 268.15078 | 66.63841 | 268.15084 | 66.63848 | 7.272 | 1.816 | Y | N | N | Y |
| 282 | NEPSC2_J175239+662327 | — | 282 | — | 268.1650 | 66.3910 | 268.16328 | 66.39084 | — | — | — | — | 5.324 | 1.777 | Y | N | N | N |
| 470 | NEPSC2_J175438+664303 | NEP.0125 | — | 470-1 | 268.6591 | 66.7177 | — | — | 268.65764 | 66.71719 | 268.65960 | 66.71797 | 3.696 | 1.825 | N | Y | N | Y |
| 470 | NEPSC2_J175438+664303 | NEP.0125 | 470a | 470-31 | 268.6591 | 66.7177 | 268.66182 | 66.71960 | 268.66198 | 66.71960 | 268.66234 | 66.71958 | 3.696 | 1.825 | Y | N | N | Y |
| 470 | NEPSC2_J175438+664303 | NEP.0125 | 470b | 470-32 | 268.6591 | 66.7177 | 268.66233 | 66.71523 | 268.66246 | 66.71523 | 268.66256 | 66.71526 | 3.696 | 1.825 | Y | N | N | Y |
| 20050 | — | NEP.0050 | NEP.0050a | 20050-3 | 269.6466 | 66.6166 | 269.64728 | 66.61698 | 269.64711 | 66.61717 | 269.64714 | 66.61711 | 5.286 | 1.399 | Y | N | N | Y |
| 20050 | — | NEP.0050 | NEP.0050b | 20050-1 | 269.6466 | 66.6166 | 269.64491 | 66.61607 | 269.64550 | 66.61618 | 269.64545 | 66.61611 | 5.286 | 1.399 | Y | Y | Y | Y |
| 20092 | — | NEP.0092 | NEP.0092 | 20092-1 | 268.6824 | 66.4739 | 268.67864 | 66.47413 | 268.67893 | 66.47407 | 268.67873 | 66.47396 | 4.526 | 1.318 | Y | Y | N | N |
| 20327 | — | NEP.0327 | — | 20327-1 | 269.0750 | 66.4985 | 269.07075 | 66.49810 | 269.07102 | 66.49809 | 269.07080 | 66.49812 | 2.973 | 1.180 | N | Y | Y | Y |
| 20327 | — | NEP.0327 | NEP.0327 | 20327-3 | 269.0750 | 66.4985 | 269.07075 | 66.49810 | 269.07102 | 66.49809 | 269.07080 | 66.49812 | 2.973 | 1.180 | Y | N | N | Y |
Note. Column (1): 850-m source ID in the combined catalogue. Column (2): 850-m source ID from the NEPSC2 catalogue (Shim et al., 2020). Column (3): 850-m source ID (‘Nickname’) from the S2CLS catalogue (Geach et al., 2017). Column (4): radio counterpart ID presented in Section 3.1, with suffices ‘a’ and ‘b’ in order of positional offsets between the 850-m position and 20-cm position. Column (5): counterpart ID presented in Section 3.2, where ‘-1’ and ‘-2’ stands for primary and secondary counterpart from the optical-NIR colour identification. IDs with ‘-3’ indicates that the object is not originally identified from the optical-NIR colour identification, because of the low relative possibility . If there is more than one number in the suffices, e.g. ‘-21’ and ‘-22’, it means that more than one secondary counterpart is identified because of the definition of the secondary identification. Columns (6) and (7): 850-m coordinates. Columns (8) and (9): coordinates of the counterparts in the VLA images. Columns (10) and (11): coordinates of the counterparts in the IRAC 4.5 m. Columns (12) and (13): coordinates of the counterparts in the HSC -band images (when available) or in the - or -band images (when the object is undetected in the band). Columns (14) and (15): flux density and uncertainty in 850 m, in units of mJy. Column (16)–(19): boolean column indicating whether the counterpart is identified in radio wavelength (20 cm), whether the counterpart is identified using optical-NIR colour, whether the identification based on colour is reliable enough (with false rate less than 10 per cent), and whether the submillimetre source has more than one counterpart.