Superconductivity and phase diagrams of CaK(Fe1-xMnx)4As4 single crystals
Abstract
In order to study the effects of Mn substitution on the superconducting and magnetic ground state of CaKFe4As4 ( = 35 K), members of the CaK(Fe1-xMnx)4As4 series have been synthesized by high-temperature solution growth in single crystalline form and characterized by elemental analysis, thermodynamic and transport measurements. These measurements show that the superconducting transition temperature decreases monotonically and is finally suppressed below 1.8 K as is increased from 0 to 0.036. For -values greater than 0.016, signatures of a magnetic transition can be detected in both thermodynamic and transport measurements in which kink-like features allow for the determination of the transition temperature, , that increases as Mn substitution increases. A temperature-composition (T-x) phase diagram is constructed, revealing a half-dome of superconductivity with the magnetic transition temperature, , appearing near 26 K for 0.017 and rising slowly up to 33 K for 0.036. In addition to the creation of the - phase diagram for CaK(Fe1-xMnx)4As4, specific heat data are used to track the jump in specific heat at ; The CaK(Fe1-xMnx)4As4 data does not follow the scaling of with as many of the other Fe-based superconducting systems do. These data suggest that, as magnetic pair-breaking is present, the jump in for a given is reduced. Elastoresistivity coefficients, and , as a function of temperature are also measured. and are qualitatively similar to CaK(Fe1-xNix)4As4. This may indicate that the magnetic order in Mn substituted system may be still the same as CaK(Fe1-xNix)4As4. Superconductivity of CaK(Fe1-xMnx)4As4 is also studied as a function of magnetic field. A clear change in ()/, where () is d()/d, at 0.015 is observed and probably is related to change of the Fermi surface due to magnetic order. Coherence lengths and the London penetration depths are also calculated based on and data. Coherence lengths as the function of also shows the changes near = 0.015, again consistent with Fermi surfaces changes associated with the magnetic ordering seen for higher -values.
I introduction
Since their discovery in 2008 [1], the study of Fe-based superconductors has lead to extensive experimental interest and their variety offers the opportunity of understanding unconventional superconductivity in a broader sense. Though diverse, the several families of Fe-based superconductors share similar crystal structures [2, 3, 4] all featuring edge-shared tetrahedral Fe-As or Fe-Se layers, and phase diagrams [5, 6, 7, 2, 3, 8, 9, 4, 10, 11, 12, 13, 14, 15, 16, 17, 18] that suggest a relationship between, or proximity of, superconducting and magnetic and/or nematic ordering or fluctuations. The role of magnetic as well as structural transitions and fluctuations in unconventional superconductivity is still an open topic, attracting both theoretical and experimental research. The relationship between these states is believed to be key to understanding unconventional superconductivity [19].
Within the Fe-based superconductors, three structural classes, Fe2As2 (=Alkaline Earth) (122) families [5, 6, 7, 2, 3, 8, 9, 4], Fe4As4 (A=Alkaline Metal) (1144) family [10, 11, 12, 13, 16, 17] and FeSe [14, 15] provide a microcosm of many of the key questions at hand. At ambient pressure, doped 122-systems manifest the most common interplay between stripe-like antiferromagnetic order, nematicity, and superconductivity [8, 3]. On the other hand the Ni-substituted 1144-system has hedgehog-spin-vortex-crystal (h-SVC) type antiferromagnetic (AFM) order and superconductivity interacting with each other without any structural phase transition[13, 20]. In contrast, at ambient pressure, FeSe has a nematic-like transition and superconductivity, but no magnetic order [14, 15]. The comparison of these three classes of Fe-based superconductors allows us to examine the effects of the presence or absence of nematicity and magnetic order on the superconducting state.
CaKFe4As4 is a structurally ordered, quaternary compound that intrinsically superconducts with around 35 K [10, 11]. As such it offers the possibility of studying the effects of Mn substitution on the superconducting state [21, 22]. Given that it was not possible to induce superconductivity in the Ba(Fe1-xMnx)2As2 system [23, 24], one of the motivations for this study was to gain insight into how Mn affects superconductivity in the CaK(Fe1-xMnx)4As4 system. This is of particular interest given the fact that Mn, of all the 3-d transition metals, is most likely to manifest local-moment-like properties akin to what can be found for rare earths such as Gd.
A second motivation for this study of the CaK(Fe1-xMnx)4As4 system is based on the similarities between CaKFe4As4 and Ba0.5K0.5Fe2As2, both having the same nominal electron count and presenting only a superconducting transition upon cooling. This analogy was explored [13] in the study of the similarities between the underdoped ( 0.5) Ba1-xKxFe2As2 and Ni/Co doped CaKFe4As4 phase diagrams, both showing a 1/2 dome of superconductivity with increasing AFM ordering () coinciding with decreasing superconducting . Study of CaK(Fe1-xMnx)4As4 allows us to investigate to what extent this analogy between the K-doped-122 and transition-metal-doped 1144 phase diagrams holds. In particular, we compare nominally hole doped CaK(Fe1-xMnx)4As4 with overdoped ( 0.5) Ba1-xKxFe2As2. Even though superconductivity is suppressed in both cases, we found a fundamental difference between the two phase diagrams: a magnetic phase transition line appears in the CaK(Fe1-xMnx)4As4 compounds upon doping, which is not present for overdoped Ba1-xKxFe2As2. In addition, at a quantitative level, Mn substitution suppresses much more rapidly than what was found for Co or Ni substitution.
In this paper, we detail the synthesis and characterization of CaK(Fe1-xMnx)4As4 single crystals. A temperature-composition (-) phase diagram is constructed by elemental analysis, thermodynamic and transport measurements. In addition to creating the - phase diagram, specific heat and elastoresistivity is also measured to track the jump in specific heat at and investigate the evolution of nematic fluctuations. Coherence lengths and the London penetration depths are also calculated based on and data obtained from measurements. Finally, temperature vs change of electron count, ||, phase diagram of CaK(Fe)4As4 single crystals, = Mn, Ni and Co, is also presented and discussed.
II Crystal Growth and Experimental Method
Single crystalline CaK(Fe1-xMnx)4As4 samples were grown by high-temperature solution growth [25] out of FeAs flux in the manner similar to pure CaKFe4As4 [12, 11]. Lumps of potassium metal (Alfa Aesar 99.95%), distilled calcium metal pieces (Ames Laboratory, Materials Preparation Center (MPC 99.9%)) and Fe0.512As0.488 and Mn0.512As0.488 precursor powders were loaded into a 1.7ml fritted alumina Canfield Crucible Set [26] (LSP Industrial Ceramics, Inc.) in an argon filled glove-box. The ratio of K:Ca:Fe0.512As0.488 and Mn0.512As0.488 was 1.2:0.8:20. A 1.3 cm outer diameter and 6.4 cm long tantalum tube which was used to protect the silica ampoule from reactive vapors was welded with the crucible set in partial argon atmosphere inside. The sealed Ta tube was then itself sealed into a silica ampoule and the ampoule was placed inside a box furnace. The furnace was held for 2 hours at 650 ℃ before increasing to 1180 ℃ and held there for 5 hours to make sure the precursor was fully melted. The furnace was then fast cooled from 1180 ℃ to 960 ℃ in 1.5 hours. Crystals were grown during a slow cool-down from 960 ℃ to 920 ℃ over 48 hours. After 1-2 hours at 920 ℃ the ampoule was inverted into a centrifuge and spun to separate the remaining liquid from the grown crystals. Metallic, plate-like, crystals were obtained but, unfortunately, with both average size and thickness diminishing by factor 2-4 as is increased.
Similar to CaKFe4As4 [12], single crystals of CaK(Fe1-xMnx)4As4 are soft and malleable which makes them difficult to grind for powder x-ray diffraction measurements. Diffraction measurements were carried out on single crystal samples, which were cleaved along the (001) plane, using a Rigaku MiniFlex II powder diffactometer in Bragg-Brentano geometry with Cu K radiation ( = 1.5406 Å) [27].
The Mn substitution levels () of the CaK(Fe1-xMnx)4As4 crystals were determined by energy dispersive spectroscopy (EDS) quantitative chemical analysis using an EDS detector (Thermo NORAN Microanalysis System, model C10001) attached to a JEOL scanning-electron microscope (SEM). The compositions of platelike crystals were measured at three separate positions on each crystal’s face (parallel to the crystallographic ab-plane) after cleaving them. An acceleration voltage of 16 kV, working distance of 10 mm and take off angle of 35∘ were used for measuring all standards and crystals with unknown composition. Pure CaKFe4As4 was used as a standard for Ca, K, Fe and As quantification. SmMn2Ge2 and GdMn2Ge2 were used as standards for Mn, both leading to consistent results without significant difference within the experimental error ( 0.0015). The spectra were fitted using NIST-DTSA II Lorentz 2020-06-26 software[28]. Different measurements on the same sample reveal good homogeneity in each crystal and the average compositions and error bars were obtained from these data, accounting for both inhomogeneity and goodness of fit of each spectra.
Temperature and magnetic field-dependent magnetization and resistance measurements as well as temperature dependent specific heat measurements were carried out by using Quantum Design (QD), Magnetic Property Measurement Systems (MPMS) and Physical Property Measurement Systems (PPMS). Field-dependent magnetization data from which is obtained, was collected by Quantum Design MPMS-3 using quartz sample holder with magnetic field parallel to the crystallographic ab plane. Temperature dependent magnetization measurements were taken for Hab by placing the plate-like sample between two collapsed plastic straws with the third, uncollapsed, straw providing support as a sheath on the outside. The single crystal samples of CaK(Fe1-xMnx)4As4 measured in the MPMS have plate-like morphology with length and width from 3 mm to 10 mm and thickness (c axis) 50 - 200 m. The approximate effective demagnetizing factor ranges from 0.007 to 0.077 with magnetic field applied parallel to the crystallographic ab plane[29]. Since the value of is small, we neglect the demagnetizing field when magnetic field was applied parallel to the crystallographic ab plane. AC electrical resistance measurements were performed in a standard four-contact geometry using the ACT option of the PPMS, with a 3 mA excitation and a frequency of 17 Hz. 50m diameter Pt wires were bonded to the samples with silver paint (DuPont 4929N) with contact resistance values of about 2-3 Ohms. The magnetic field, up to 90 kOe, was applied along c or ab directions, with the current flowing in the ab plane. Temperature dependent specific heat measurements were carried out by using the relaxation technique as implemented in the Heat Capacity option of the PPMS. Due to small masses of the individual crystals for some concentrations, stacks of several crystals were used when needed, with thin layers of Apiezon N grease in between.
Elastoresistance measurements were performed using a technique similar to that described in Refs. [30, 31]. To this end, samples of CaK(Fe1-xMnx)4As4 were cleaved and cut into bar-like shapes of dimensions mm3. The orientation of the long side of the crystals was chosen to be either the [1 1 0]T or the [1 0 0]T direction (the notion []T refers to the tetragonal unit cell). For each direction, two crystals were glued orthogonally on a piezoelectric actuator from Piezomechanik using Devcon 5-Minute Epoxy. In previous works [30], it was demonstrated that this glue provides a strain transmission of below 250 K. Strictly speaking, samples glued on the piezoelectric actuator experience biaxial strain upon application of a voltage. However, the biaxial strain is highly anisotropic, i.e., has opposite signs in the two orthogonal directions. Thus, we denote the strain along the poling directions of the actuator as , and the strain perpendicular to it as . Correspondingly, we denote the resistance of the sample, whose long axis is parallel to (), as (). The resistances and were measured in a standard four-point configuration with LakeShore’s resistance bridges LS370 and LS372, with contacts made by spot welding 25m diameter Pt wires to the sample resulting in contact resistances of typically 1 . The strains and , created by the application of voltages between -30 V and 120 V to the actuator, were measured by two orthogonal strain gauges that were placed on the surface of the actuator opposite to the one on which samples were attached. The low-temperature environment was provided by a Janis SHI-950T-X closed cycle refrigerator, with the sample in 4He exchange gas.
III CaK(Fe1-xMnx)4As4 Structure and Composition
.
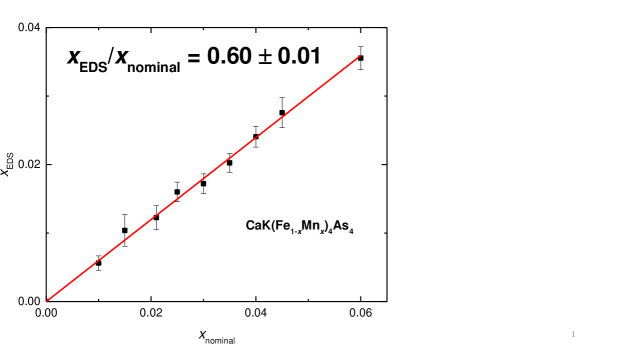
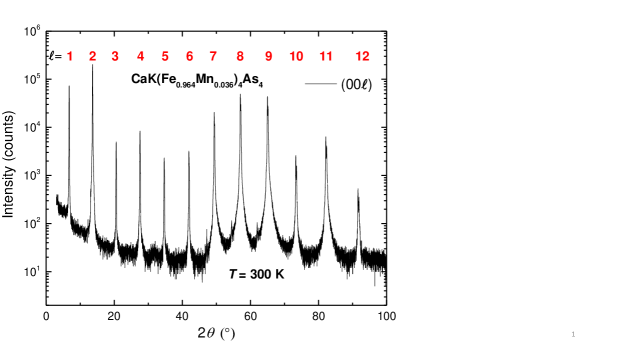
Figure 1 presents single crystal diffraction data of CaK(Fe1-xMnx)4As4 with . From the figure, we can see that all (), , are detected. The = odd peaks which are forbidden for the I4/mmm structure [10] can be clearly found. This indicates that sample has the anticipated P4/mmm structure associated with the CaKFe4As4 structure [10, 13, 11].
The Mn substitution, EDS, determined by EDS is shown in Fig. 2 for different crystals as a function of the nominal Mn fraction nominal that was originally used for the growth. Error bars account for both possible inhomogeneity of substitution and goodness of fit of each EDS spectra. A clear correlation can be seen between the nominal and the measured substitution levels, with a proportionality factor of 0.60 0.01. From this point onward, EDS will be used when referring to Mn substitution level. For comparison, the ratio of measured to nominal Ni and Co fraction in the corresponding CaK(Fe1-xTMx)4As4 are 0.64 and 0.79 respectively [13].
IV Data analysis and Phase Diagram
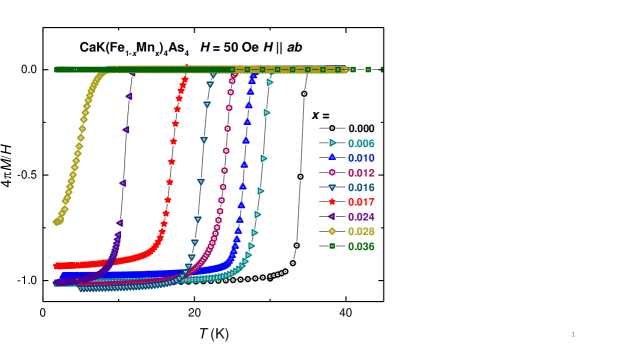
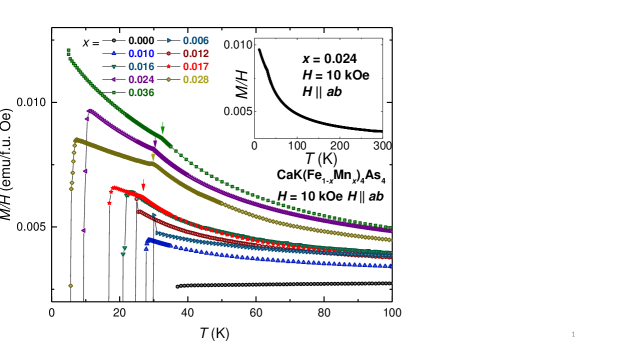
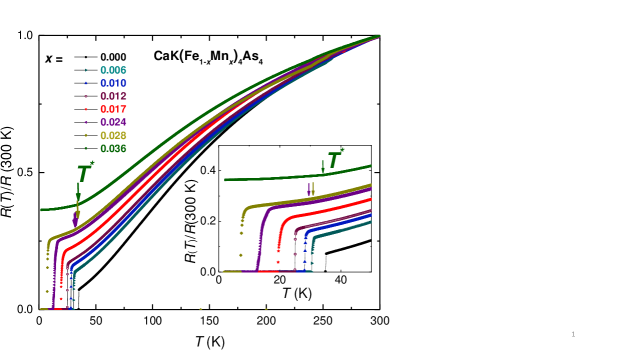
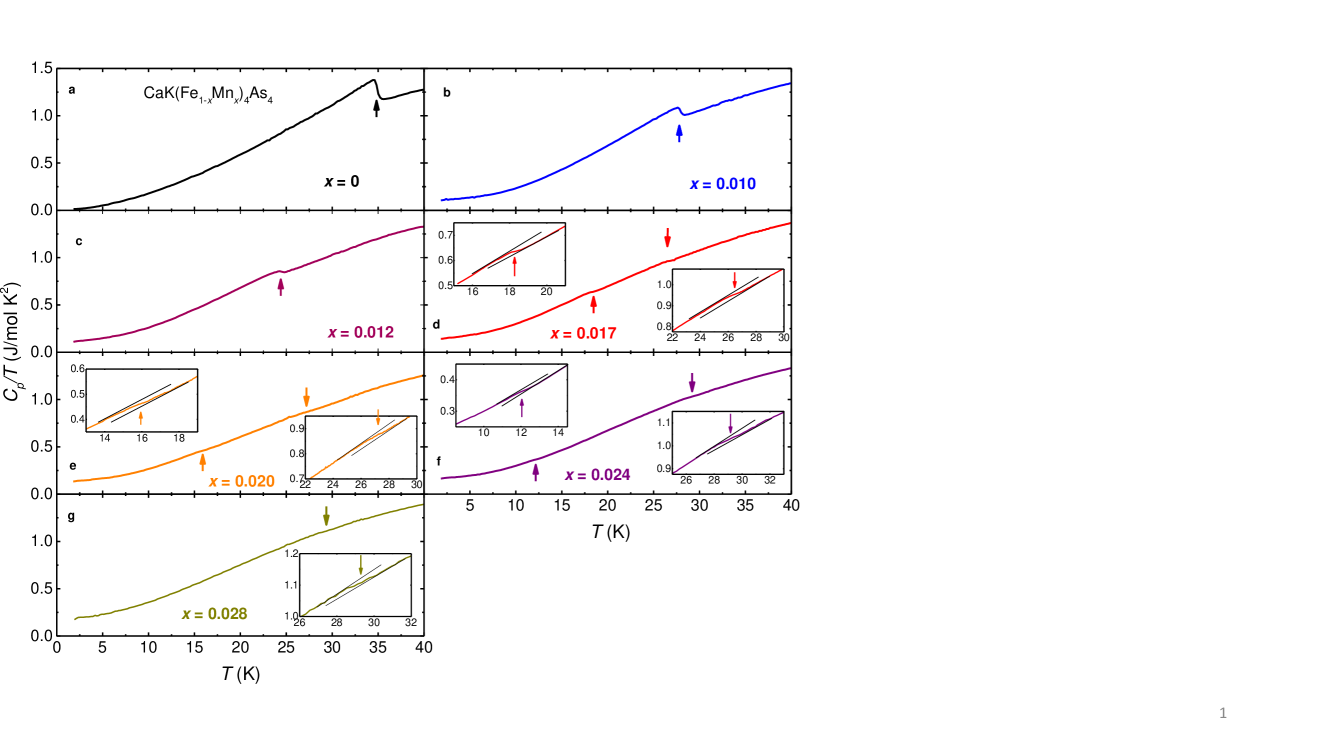
Figure 3 shows the low temperature (1.8 K - 45 K), zero-field-cooled-warming (ZFCW) magnetization for CaK(Fe1-xMnx)4As4 single crystals for = 50 Oe (Field-cooled-warming (FCW) and ZFCW magnetization data for an = 0.016 sample can be found in figure 20 in the Appendix). is the volumetric magnetic moment in this figure and is calculated by using the density of CaKFe4As4, which is determined to be 5.22 g/cm3 from lattice parameters at room temperature [10]. A magnetic field of 50 Oe was applied parallel to ab plane (i.e. parallel to the surface of the plate-like crystal). The superconducting transitions () are clearly seen in this graph except for the highest substitution value x = 0.036. As the value of the Mn substitution, , increases, the superconducting transition temperature decreases. For , a full magnetic shielding is not reached by 1.8 K.
Figure 4 shows the low temperature (5 K - 100 K) ()/ data for CaK(Fe1-xMnx)4As4 single crystals with 10 kOe field applied parallel to the crystallographic ab plane. There is an appearance of a Curie-Weiss tail after adding Mn and kink-like features found around 30 K for , which may indicate new phase transition (). The inset shows ()/ of a CaK(Fe0.976Mn0.024)4As4 single crystal over a wider temperature range. As Mn is added the Curie-tail-like feature grows. Although the Mn doping levels are low ( < 0.05), the () data can be fit by a C/(+) + function when we take to be equal to , or its extrapolation by linear fitting from figure 7 to = 0.006 for low , where is absent (see table 1 in the Appendix). The effective moment calculated per Mn is found to be 5 B. This means that the substitution of Mn brings more local-moment-like behavior to this system. For > 0.016, a kink-like feature can be seen at a temperature . As increases from 0.016 to 0.036, the temperature increases from 30 K to 35 K. The criterion for determining is shown in Fig. 21 in the Appendix.
Figure 5 presents the temperature dependent, normalized, electrical resistance of CaK(Fe1-xMnx)4As4 single crystals. RRR (the ratio of (300 K) and resistance before ) decreases as Mn substitution increases, which indicates disorder increasing. The superconducting transition temperatures decrease as Mn is added to the system. when x = 0.036, there is no signature of a superconducting transition detectable above 1.8 K. With increasing Mn content, a kink appears for > 0.017 and rises to about 33 K for = 0.036. A similar feature also appeared in Ni and Co-substituted CaKFe4As4 electrical resistance measurements [13]. The criterion for determining the transition temperature, , associated with this kink is shown in the appendix in Fig. 21c where and d/d are both shown.
Figure 6 presents the temperature dependent specific heat data divided by temperature for < 45 K. Whereas the feature associated with superconductivity (centered around ) is relatively clear (marked by upward pointing arrows), at least for lower -values, the feature associated with (marked by downward pointing arrows) is quite subtle and is shown more clearly in the insets. Transition temperature is inferred from the mid-point of the feature. As has been already seen in the magnetization as well as resistance data, the addition of Mn (increase of -value) leads to a suppression of as well as an onset and gradual increase of above a threshold value of 0.017.
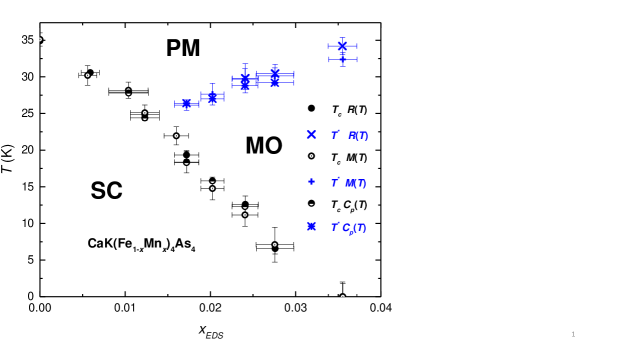
Figure 7 summarizes the transition temperature results inferred from magnetization, resistance and specific heat measurements, plotting the superconducting and magnetic transitions as a function of substitution, constructing the - phase diagram for the CaK(Fe1-xMnx)4As4 system. As depicted in this phase diagram, increasing Mn substitution (i) suppresses monotonically with it extrapolating to 0 K by 0.036 and (ii) stabilizes a new transition, presumably an antiferromagnetic one, for 0.016 with the transition temperature rising from 26 K for = 0.017 to 33 K for = 0.036. Each phase line is made out of data points inferred from R(T), M(T) and (T) measurements, illustrating the good agreement between our criterion for inferring and . The CaK(Fe1-xCox)4As4 and CaK(Fe1-xNix)4As4 series have qualitatively similar phase diagrams, with the quantitative differences being associated with the doping levels necessary to induce the magnetic phase and to suppress superconductivity. Further comparisons of the CaK(Fe1-xMnx)4As4 phase diagram to the phase diagrams of the CaK(Fe1-xCox)4As4 and CaK(Fe1-xNix)4As4 series, as well as doped BaFe2As2 series will be made in the discussion section below.
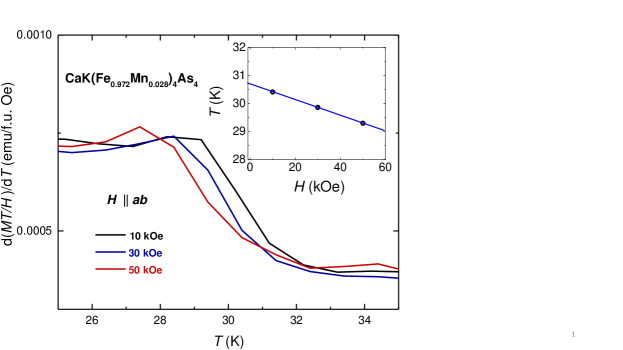
Given that the () and () data were taken in zero applied field whereas the () data shown in Fig. 4 were taken in 10 kOe, it is prudent to examine the field dependence of transition associated with . In figure 8 we show the d()/d data [32] for the = 0.028 sample for || ab = 10, 30 and 50 kOe. As is commonly seen for antiferromagnetic phase transition, increasing a magnetic field leads to a monotonic suppression of . The inset to Fig. 8 shows that the extrapolated, = 0, value would be 30.7 K as compared to the value of 30.4 K for 10 kOe. This further confirms that there should be (and is) good agreement between the values inferred from 10 kOe magnetization data and the values inferred from the zero field specific heat and resistance data in Fig. 7. In addition these data suggest that magnetic field could be used to fine tune the value of , if needed.
V Superconducting critical fields and anisotropy
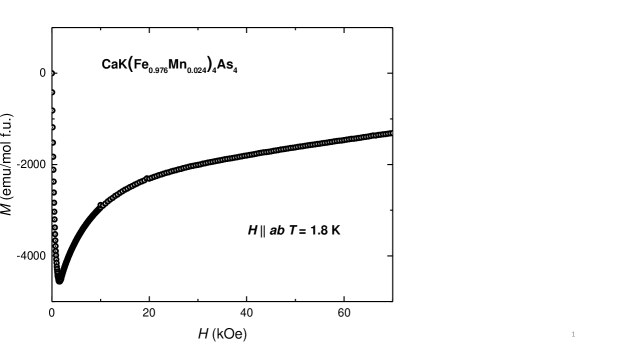
Superconductivity can be studied as a function of field (in addition to temperature and doping). Before we present our c2() results, based on () data, it is useful to check the () data. We start with M(H) data for = 0.024, = 29.7 K and = 9.9 K, taken over a wide field range. The 1.8 K M(H) data for shown in Fig. 9 is classically non-linear, showing a local minimum near 2.3 kOe. For = 1.8 K < the value is clearly higher than the 65 kOe maximum field we applied. can be inferred from the lower field M(H) data.
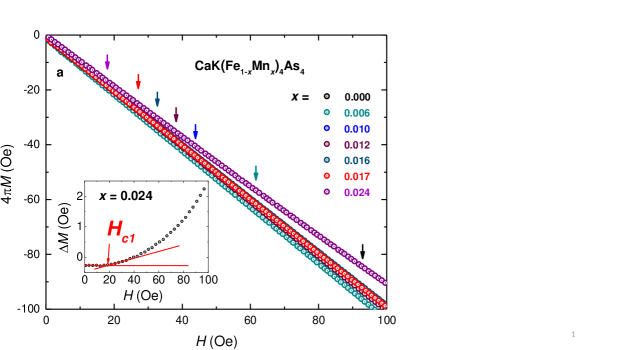
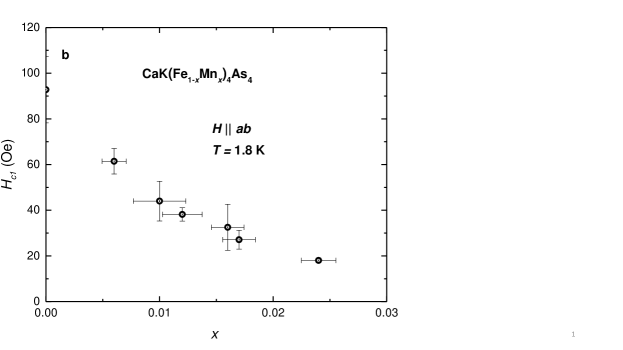
In order to better estimate values we performed low field, sweeps at base temperature. In Fig. 10a we show the M(H) data for 0 0.024 for 100 Oe. As increases the deviation from the fully diamagnetic, linear behavior, that occurs at , appears at lower and lower fields. As shown in inset of figure 10a, is determined by subtracting the linear, lowest field behavior of from . Because of the finite thickness of samples, even magnetic field is apply in plane, there is a small demagnetizing factor ( < 0.077). Therefore, is taken as the vortices start to enter the sample and determined when deviates from the low field, the no-zero value is due to remnant field of MPMS. The standard error of comes from at least 4 different samples’ measurements. We should note that using this method with higher data density we were able to identify for the pure CaKFe4As4 (x = 0) as 100 Oe as opposed to the 1.3 kOe estimated in Ref. [11]. Figure 10b shows a monotonic decrease in as Mn substitution increases and decreases.
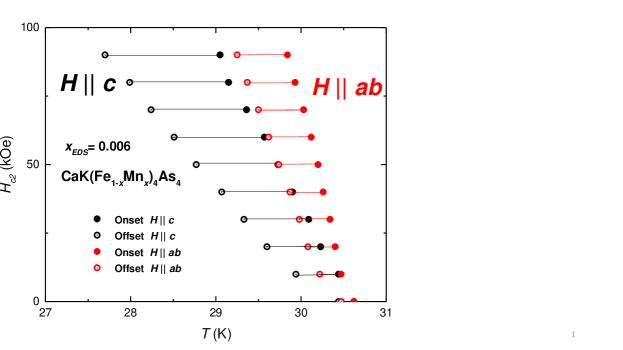
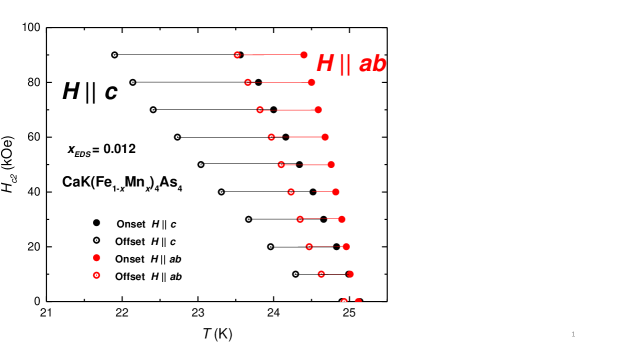
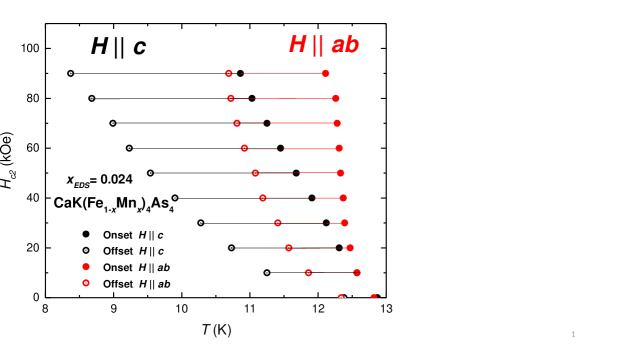
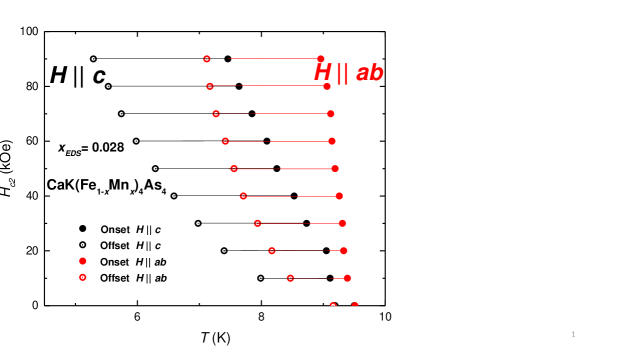
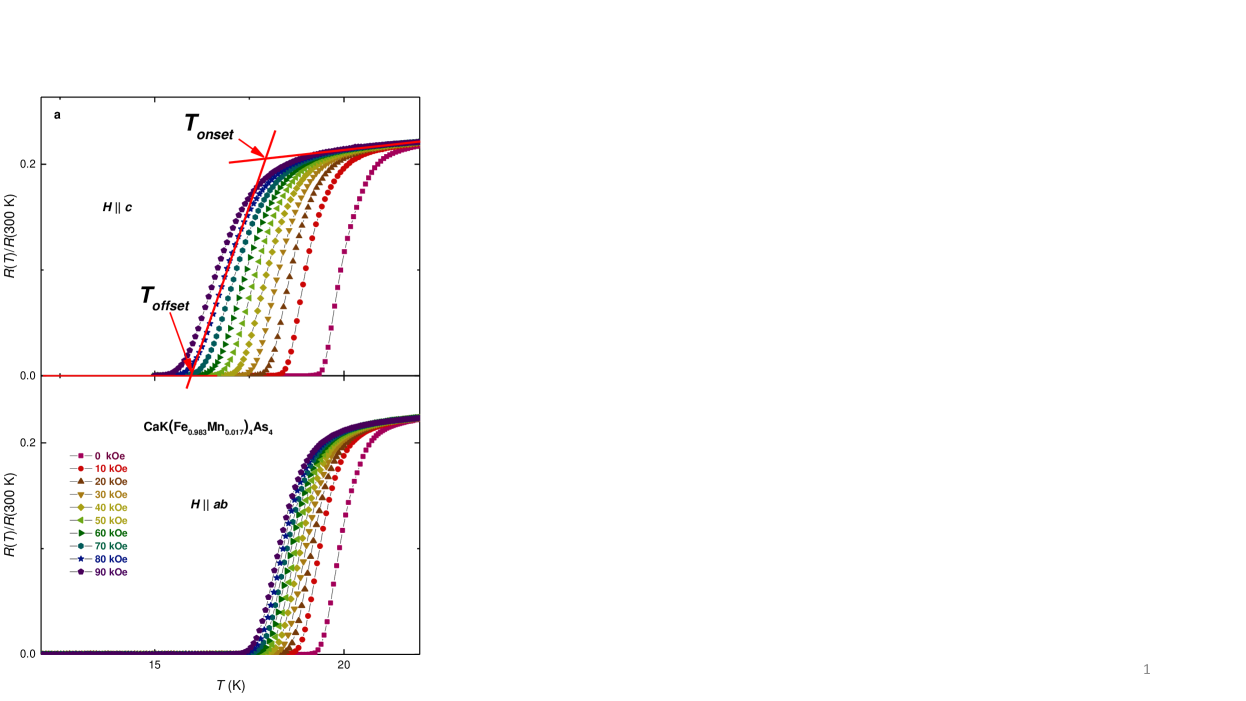
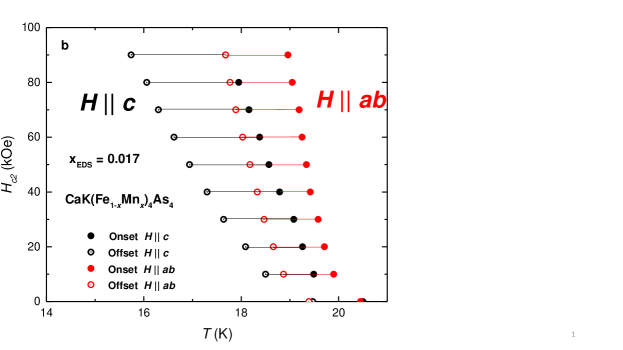
In order to further study the effects of Mn substitution on the superconducting state, anisotropic data for temperatures near were determined for the substitution levels that have superconductivity. Figure 11a shows a representative set of () data taken for fixed applied magnetic fields, axis and plane 90 kOe for = 0.017. Figure 11a also shows an example of the onset and offset criteria used for the evaluation of . Figure 11b present the curves for CaK(Fe0.983Mn0.017)4As4 single crystals with both || and || , showing both the onset (Tonset) and offset (Toffset) temperatures. For = 0.006, 0.010, 0.012, 0.024 and 0.028, curves are shown in Appendix figs. 23 - 27. From plots, we can see that is only suppressed by about 3 K when 90 kOe magnetic field is applied, so the complete plots of the CaK(Fe1-xMnx)4As4 compounds cannot be fully determined, however we still can observed several trends in these data.
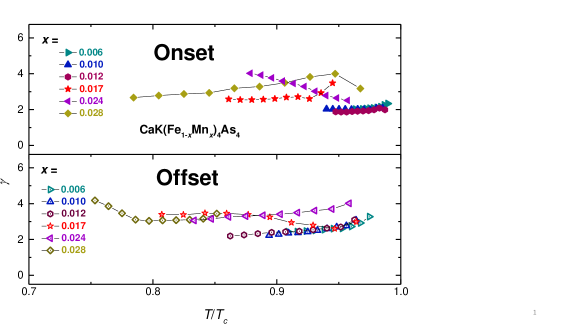
Figure 12 shows the temperature dependent anisotropy ratio, 3 for these samples over the 0.8 < / < 1.0 range. This value is similar to other 122 and 1144 materials [7, 11].
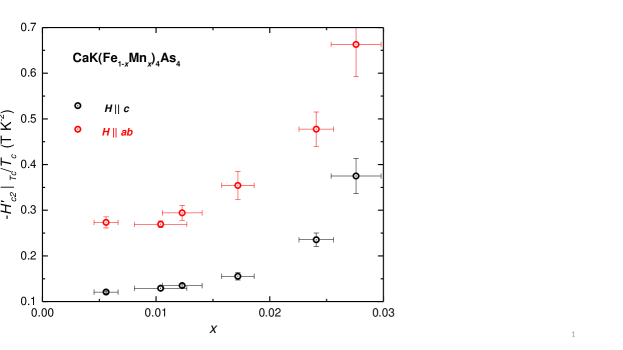
Given that we have determined () for temperatures close to , we can evaluate the ()/ close to , where () is d()/d, specifically seeing how it changes as drops below with increasing x. Error of ()/ comes from linear fit of () near the . In the case of other Fe-based systems [33, 34, 35, 36] clear changes in ()/ were associated with changes in the magnetic sublattice coexisting with superconductivity (i.e. ordered or disordered). In Fig. 13 we can see that there is a change in the x-dependence of ()/ for 0.015, beyond which substitution level suppresses below . Comparison with the slope change of in the pressure-temperature phase diagram of CaK(Fe1-xNix)4As4 [33], further suggest that this is probably related to changes in the Fermi surface, caused by the onset of the new periodicity associated with the AFM order.
VI Elastoresistance
In order to investigate the evolution of nematic fluctuations in CaK(Fe1-xMnx)4As4 and compare it with Ni-substituted CaKFe4As4 as well as Co-substituted BaFe2As2, we measured elastoresistance. Figure 14 shows the temperature dependence of the elastoresistance coefficients and for Mn-1144 samples. These quantities were determined from the strain-induced resistance change [31] via
| (1) | |||||
| (2) | |||||
| (3) | |||||
| (4) | |||||
Thus, and reflect the elastoresistance coefficients associated with and strain, respectively. For each temperature measured, we found that has the opposite sign of , indicating that the - and -induced resistance changes are much larger than the isotropic -induced strain component[31]. Given that anisotropic strain is the conjugate field to and nematic order, the respective elastoresistance coefficients are often considered as a measure of the respective nematic susceptibilites [37]. One should note, however, that the proportionality factor, between the elastoresistance coefficients and the nematic susceptibilities, with or (), does not have to be constant. can, in principle, be temperature- and/or doping-dependent, as it depends on microscopic details of the Fermi surface and scattering mechanisms. Nonetheless, the observation of a diverging elastoresistance with Curie-Weiss-like temperature dependence in several Fe-based superconductors, which is in agreement with the theoretical expectations based on a Ginzburg-Landau ansatz and a constant , can be taken as a good indication that elastoresistance measurements can be used to infer the strength of nematic fluctuations [30, 37].
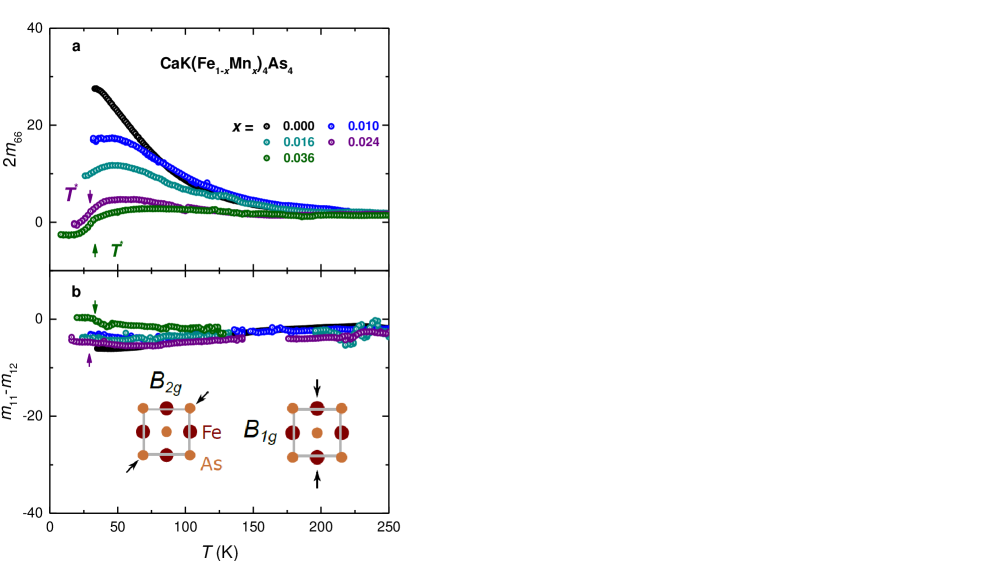
As shown in Fig. 14, of CaK(Fe1-xMnx)4As4 is characterized by a marked temperature dependence for low and also changes significantly with doping, whereas is only weakly-temperature dependent and is essentially doping-independent. This suggests that nematic fluctuations, if present, occur only in the channel. A closer look at , however, clearly suggests that nematic fluctuations are suppressed with increasing Mn substitution level. In fact, for and 0.036, i.e., those concentrations for which a clear signature of a magnetic transition is observed, the values of across the entire temperature range are comparable to the ones of . Thus, the magnetic order is very likely not characterized by a nematic component. In other words, a stripe-type magnetic order, as realized in many other pnictides and which would break tetragonal symmetry, can likely be ruled out based on this elastoresistance data. These data suggest that (i) for CaK(Fe1-xMnx)4As4 the magnetic order may well be a spin-vortex crystal type of antiferromagnetism similar to what was found CaK(Fe1-xNix)4As4 [13], and (ii) there may be stripe-type magnetic and nematic fluctuations and susceptibility present in the undoped and weakly doped CaK(Fe1-xMnx)4As4 but they are suppressed when the doping levels are increased.
Qualitatively, our elastoresistance results for CaK(Fe1-xMnx)4As4 are similar to the elastoresistance results [38] obtained for the Ni-doped CaK(Fe1-xNix)4As4, where Ni substitution stabilizes a spin-vortex crystal magnetic phase [13]. This statement relates to the decrease of with increasing as well as its complex temperature dependence which does not simply follow Curie-Weiss behavior. Whereas the former is clearly surprising, given that Ni- and Mn- substitutions lead to a different nominal electron counts, the latter might be related to the proportionality factor between and not being constant. Another possibility that could give rise to deviations from Curie-Weiss type behavior is the close proximity of competing magnetically-ordered phases, as pointed out from calculations of the nematic susceptibility in a phenomenological model in Ref. [38]. A qualitative difference between the elastoresistance results on Mn- and Ni-substituted CaKFe4As4 is the sign of for those where magnetic order is present. In our experiment, is positive above across the entire range of studied, whereas for Ni-substituted samples a sign change of from positive to negative was observed for Ni substitution values that are large enough for the magnetic transition to emerge. It is likely that the differences of the Fermi surface resulting from different electron counts affect the sign of .
VII discussion and summary
The - phase diagram for CaK(Fe1-xMnx)4As4 is qualitatively similar to those found for Co- and Ni-substituted CaKFe4As4, there is a clear suppression of with increasing Mn substitution as well as an onset of what is likely to be a AFM ordering for > 0.015. For CaK(Fe1-xMnx)4As4, elastoresistance measurements shows that is small compare to the Fe-based superconductors showing stripe-type order. This means that the order is not strongly coupling to an orthorhombic distortion and is analogous to Ni-substituted CaKFe4As4, which suggests that AFM structure in Mn-substituted 1144 doesn’t break symmetry and is still h-SVC.
In figures 10 and 13 we presented measurements and analysis of and data. Whereas we do not see any clear effect of the onset of AFM ordering on (Fig. 10b), there is a clear effect on (Fig. 13). Using our and data we can extract information about the superconducting coherence length and London penetration depth as well.
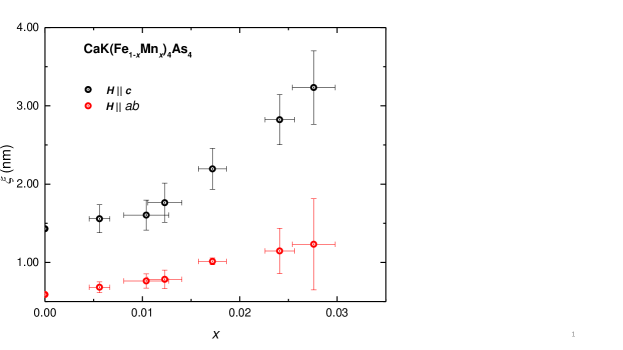
Figure 15 shows coherence length, , of CaK(Fe1-xMnx)4As4 as a function of . is estimated by using the anisotropic scaling relations |d/d|= /2 and |d/d|= /2 [11]. Coherence lengths increase as substitution levels increase, and, given that depends on d/d, it is not surprising that a change in behavior of occurs as the AFM state is entered.
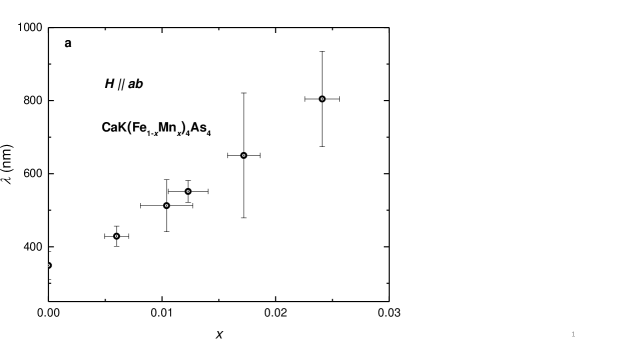
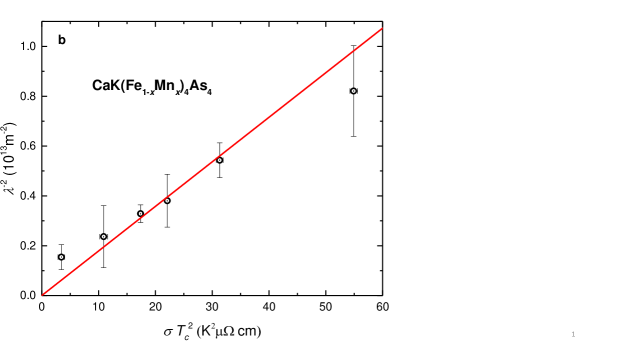
Figure 16a shows the London penetration depth, , as a function of . is obtained by using: = (ln / + 0.5)/(4) [39]. Figure 16b shows versus , where is normal state conductivity which was measured near the . These data roughly follow the behavior associated with Homes type scaling in the presence of pair breaking [40, 41, 42]. Given that there is no clear break in behavior in for 0.015 (Fig. 10), it is not surprising that there is no clear feature in Fig. 16a for 0.015.
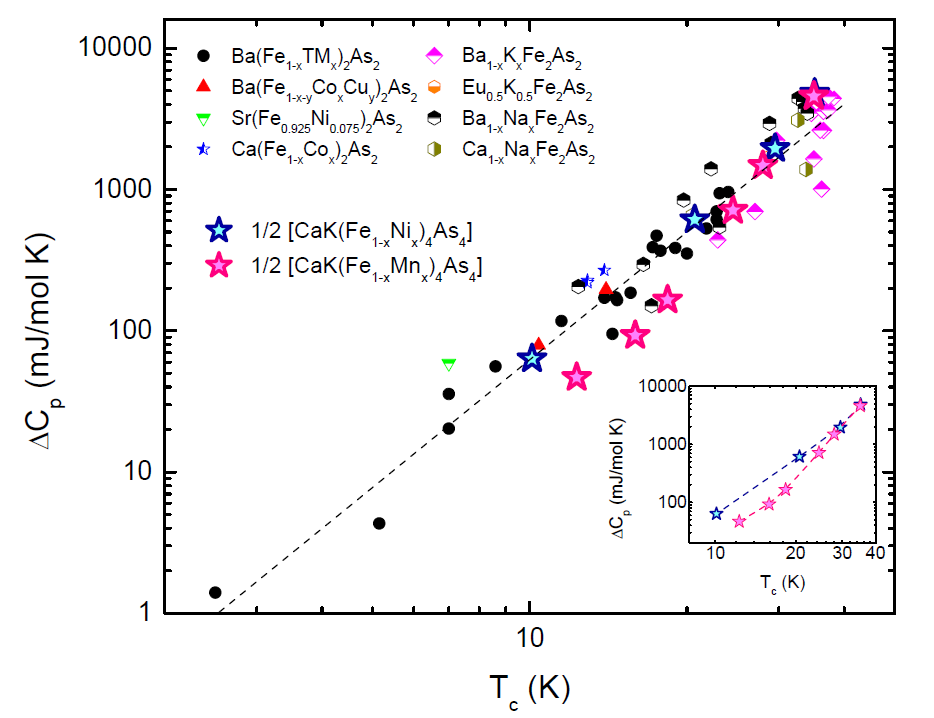
Figure 17 presents the jump in specific heat at versus for representative 122 systems, as well as for CaK(Fe1-xNix)4As4 and CaK(Fe1-xMnx)4As4, on a log-log plot [44]; the inset shows just the CaK(Fe1-xNix)4As4 and CaK(Fe1-xMnx)4As4 data on their own for clarity. The CaK(Fe1-xMnx)4As4 data follows the basic scaling that has been seen for many of the Fe-based superconducting systems, but, at a more quantitative level, the CaK(Fe1-xMnx)4As4 data do fall on or below the lower edge of the manifold, especially when compared to the CaK(Fe1-xNix)4As4. This would be consistent with the jump in for a given being lower when magnetic pair-breaking is present [45, 46]. Given that the Mn ions appear to have a relatively large local moment ( 5 ) such magnetic pair breaking could be an additional effect that is not present in the Ni- or Co-doped 1144 or Ni- or Co-doped 122 systems. As mentioned in the introduction section, since in Ba(Fe1-xMnx)2As2 could not stabilize superconductivity, the CaK(Fe1-xMnx)4As4 system is important for assessing the role Mn may play in these Fe-based superconductors.
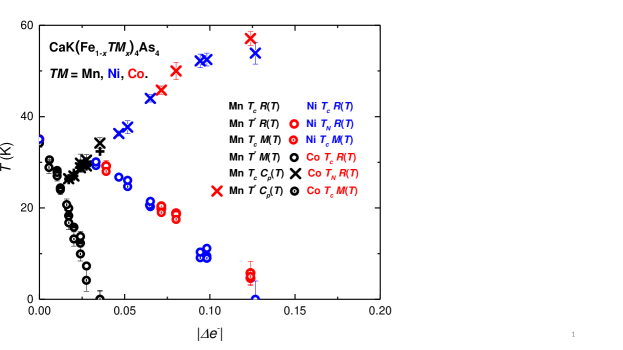
For = Co and Ni substitutions, the phase diagrams of CaK(Fe)4As4 scaled almost exactly when transition temperatures were plotted not as a function of but as a function of band filling change (i.e. when each Ni atom brings two extra electrons and each Co atom brings only one extra electron) [13, 20]. This led to the conclusion that for electron doping of CaKFe4As4 the number of electrons added was the controlling factor for both the stabilization of magnetic ordering as well as for the suppression of superconductivity. In figure 18 we show that as Mn is substituted into CaKFe4As4 there is a qualitatively similar suppression of superconductivity as well as the stabilization of magnetic order. This is at odds with the simple analogy that was developed between Co and Ni-substituted CaKFe4As4 and and (Ba1-xKx)Fe2As2. In that analogy CaKFe4As4 could be considered to have the same band filling as Ba0.5K0.5Fe2As2, giving rise to the expectations that if substitution lead to rigid band changes in band filling, then (i) Co/Ni doping would suppress superconductivity and stabilize antiferromagnetic ordering (which does happen) and (ii) Mn doping would lead to a suppression of superconductivity, but not lead to any further magnetic ordering. So, the appearance of clear magnetic ordering in very slightly Mn substituted CaKFe4As4 is noteworthy.
More quantitatively, in figure 18 the CaK(Fe)4As4 phase diagrams for = Mn, Co and Ni are plotted on the same and |e-| axes. This figure shows that whereas the phase lines do overlap, suggesting that the change electron count (positive or negative) can be correlated to the stabilization of magnetic order, the suppression of is much more rapid for Mn substitution than for Ni or Co. Indeed an unrealistic factor of four would be needed to bring the line into agreement with the Co and Ni data.
Two possible explanations for the different suppression of readily come to mind. First is the simple acknowledgment that for CaKFe4As4 electron and hole doping via 3d-transition metal substitution for Fe may simply have different effects, most likely associated with asymmetries of the density of states of CaKFe4As4 on either side of EF. The second explanation is given by Abrikosov–Gor’kov mechanism [47] which invokes the large, local moment behavior of the Mn ions and try to understand the enhanced suppression of as being associated with additional breaking of Cooper pairs by spin-flip scattering of electrons off of the local moment Mn impurity (such enhanced Mn pair breaking was already suggested in [21] for Mn substitution into Ba0.5K0.5Fe2As2). This latter case is intriguing, but would require a rather curious type of high- superconductivity that is both built out of transition metal antiferromagnetic fluctuations and yet is aggressively suppressed by transition metal based magnetic impurities. This apparent contradiction could be reconciled by the fact that the Fe-moments that are providing the fluctuations are of order 0.5 whereas the Mn moments are estimated to be an order of magnitude larger, 5 . In this sense Mn would be acting more like a rare earth impurity akin to Gd. It should be noted, though, that neither of these possible explanations for the different suppression of help explain or rationalize this fact the lines for Mn-, Co- and Ni-substitutions do seem to overlap.
In summary, we have been able to grow and study the CaK(Fe1-xMnx)4As4 system. We have been able to assemble a - phase diagram that clearly shows the suppression of the superconducting with the addition of Mn, with dropping from 35 K for = 0 to zero for > 0.036, as well as the stabilization of magnetic order for > 0.015, with 26 K 32 K. The similarity between the - phase diagrams for Mn, Co and Ni substitution as well as the elastoresistivity data showing no strong indications of a nematic phase transition or fluctuations, strongly suggest that the magnetic ordering associated with is a hedgehog vortex crystal. As becomes greater than 0.015 and becomes less than , a clear change in the behavior of ()/ and the associated superconducting coherence length, , can be seen. These are associated with the probable changes in the Fermi surface that accompany the AFM ordering at . Comparable features in or the London penetration depth are not clearly resolvable.
The - phase diagram for CaK(Fe1-xMnx)4As4 is qualitatively similar to what was found for Ni- and Co-1144 including the appearance of Mn-stabilized antiferromagnetic ordering. Whereas the stabilization of antiferromagnetic ordering occurs at the same rate (per change in band filling) as it does for Ni- or Co-substitutions, the suppression of is much faster (by a factor of roughly four). The versus plot for CaK(Fe1-xMnx)4As4 also drops somewhat faster that would be expected when compared to the CaK(Fe1-xNix)4As4 data. Both of these enhanced suppression may be associated with the large effective moment found for the substituted Mn ions, 5 , as compared to the size of the ordered Fe moments ( 0.5 ).
Acknowledgements.
We thank A. Kreyssig and B. Kuthanazhi for useful discussions. Work at the Ames Laboratory was supported by the U.S. Department of Energy, Office of Science, Basic Energy Sciences, Materials Sciences and Engineering Division. The Ames Laboratory is operated for the U.S. Department of Energy by Iowa State University under Contract No. DE-AC02-07CH11358. E.G. and W.R.M. were supported, in part, by the Gordon and Betty Moore Foundations EPiQS Initiative through Grant GBMF4411. L.X. was supported by the W. M. Keck Foundation.[References]
- Kamihara et al. [2008] Y. Kamihara, T. Watanabe, M. Hirano, and H. Hosono, Journal of the American Chemical Society 130, 3296 (2008).
- Johnston [2010] D. C. Johnston, Advances in Physics 59, 803 (2010).
- Paglione and Greene [2010] J. Paglione and R. L. Greene, Nature Physics 6, 645 (2010).
- Hosono and Kuroki [2015] H. Hosono and K. Kuroki, Physica C: Superconductivity and its Applications 514, 399 (2015).
- Canfield et al. [2009] P. C. Canfield, S. L. Bud’ko, N. Ni, J. Q. Yan, and A. Kracher, Physical Review B 80, 060501(R) (2009).
- Ni et al. [2009] N. Ni, A. Thaler, A. Kracher, J. Q. Yan, S. L. Bud’ko, and P. C. Canfield, Physical Review B 80, 024511 (2009).
- Ni et al. [2010] N. Ni, A. Thaler, J. Q. Yan, A. Kracher, E. Colombier, S. L. Bud’ko, P. C. Canfield, and S. T. Hannahs, Physical Review B 82, 024519 (2010).
- Canfield and Bud’ko [2010] P. C. Canfield and S. L. Bud’ko, Annual Review of Condensed Matter Physics 1, 27 (2010).
- Stewart [2011] G. R. Stewart, Reviews of Modern Physics 83, 1589 (2011).
- Iyo et al. [2016] A. Iyo, K. Kawashima, T. Kinjo, T. Nishio, S. Ishida, H. Fujihisa, Y. Gotoh, K. Kihou, H. Eisaki, and Y. Yoshida, Journal of the American Chemical Society 138, 3410 (2016).
- Meier et al. [2016] W. R. Meier, T. Kong, U. S. Kaluarachchi, V. Taufour, N. H. Jo, G. Drachuck, A. E. Böhmer, S. M. Saunders, A. Sapkota, A. Kreyssig, et al., Physical Review B 94, 064501 (2016).
- Meier et al. [2017] W. R. Meier, T. Kong, S. L. Bud’ko, and P. C. Canfield, Physical Review Materials 1, 013401 (2017).
- Meier et al. [2018] W. R. Meier, Q.-P. Ding, A. Kreyssig, S. L. Bud’ko, A. Sapkota, K. Kothapalli, V. Borisov, R. Valentí, C. D. Batista, P. P. Orth, et al., npj Quantum Materials 3, 5 (2018).
- Hsu et al. [2008] F.-C. Hsu, J.-Y. Luo, K.-W. Yeh, T.-K. Chen, T.-W. Huang, P. M. Wu, Y.-C. Lee, Y.-L. Huang, Y.-Y. Chu, D.-C. Yan, et al., Proceedings of the National Academy of Sciences 105, 14262 (2008).
- Böhmer and Kreisel [2018] A. E. Böhmer and A. Kreisel, Journal of Physics: Condensed Matter 30, 023001 (2018).
- Kawashima et al. [2016] K. Kawashima, T. Kinjo, T. Nishio, S. Ishida, H. Fujihisa, Y. Gotoh, K. Kihou, H. Eisaki, Y. Yoshida, and A. Iyo, Journal of the Physical Society of Japan 85, 064710 (2016).
- Bao et al. [2018] J.-K. Bao, K. Willa, M. P. Smylie, H. Chen, U. Welp, D. Y. Chung, and M. G. Kanatzidis, Crystal Growth & Design 18, 3517 (2018).
- Gati et al. [2020] E. Gati, L. Xiang, S. L. Bud’ko, and P. C. Canfield, Annalen der Physik 532, 2000248 (2020).
- Mazin [2010] I. I. Mazin, Nature 464, 183 (2010).
- Meier [2018] W. Meier, Thesis (2018), URL https://lib.dr.iastate.edu/etd/16856/.
- Li et al. [2012] J. Li, Y. F. Guo, S. B. Zhang, J. Yuan, Y. Tsujimoto, X. Wang, C. I. Sathish, Y. Sun, S. Yu, W. Yi, et al., Physical Review B 85, 214509 (2012).
- LeBoeuf et al. [2014] D. LeBoeuf, Y. Texier, M. Boselli, A. Forget, D. Colson, and J. Bobroff, Physical Review B 89, 035114 (2014).
- Thaler et al. [2011] A. Thaler, H. Hodovanets, M. S. Torikachvili, S. Ran, A. Kracher, W. Straszheim, J. Q. Yan, E. Mun, and P. C. Canfield, Physical Review B 84, 144528 (2011).
- Pandey et al. [2011] A. Pandey, V. K. Anand, and D. C. Johnston, Physical Review B 84, 014405 (2011).
- Canfield [2020] P. C. Canfield, Reports on Progress in Physics 83, 016501 (2020).
- Canfield et al. [2016] P. C. Canfield, T. Kong, U. S. Kaluarachchi, and N. H. Jo, Philosophical Magazine 96, 84 (2016).
- Jesche et al. [2016] A. Jesche, M. Fix, A. Kreyssig, W. R. Meier, and P. C. Canfield, Philosophical Magazine 96, 2115 (2016).
- Newbury and Ritchie [2014] D. E. Newbury and N. W. M. Ritchie, in Scanning Microscopies 2014, edited by M. T. Postek, D. E. Newbury, S. F. Platek, and T. K. Maugel (2014), vol. 9236, p. 92360H.
- Prozorov and Kogan [2018] R. Prozorov and V. G. Kogan, Physical Review Applied 10, 014030 (2018).
- Kuo et al. [2016] H.-H. Kuo, J.-H. Chu, J. C. Palmstrom, S. A. Kivelson, and I. R. Fisher, Science 352, 958 (2016).
- Kuo et al. [2013] H.-H. Kuo, M. C. Shapiro, S. C. Riggs, and I. R. Fisher, Physical Review B 88, 085113 (2013).
- Fisher [1962] M. E. Fisher, Philosophical Magazine 7, 1731 (1962).
- Xiang et al. [2018] L. Xiang, W. R. Meier, M. Xu, U. S. Kaluarachchi, S. L. Bud’ko, and P. C. Canfield, Physical Review B 97, 174517 (2018).
- Kaluarachchi et al. [2016] U. S. Kaluarachchi, V. Taufour, A. E. Böhmer, M. A. Tanatar, S. L. Bud’ko, V. G. Kogan, R. Prozorov, and P. C. Canfield, Physical Review B 93, 064503 (2016).
- Xiang et al. [2017] L. Xiang, U. S. Kaluarachchi, A. E. Böhmer, V. Taufour, M. A. Tanatar, R. Prozorov, S. L. Bud’ko, and P. C. Canfield, Physical Review B 96, 024511 (2017).
- Taufour et al. [2014] V. Taufour, N. Foroozani, M. A. Tanatar, J. Lim, U. Kaluarachchi, S. K. Kim, Y. Liu, T. A. Lograsso, V. G. Kogan, R. Prozorov, et al., Physical Review B 89, 220509(R) (2014).
- Chu et al. [2012] J.-H. Chu, H.-H. Kuo, J. G. Analytis, and I. R. Fisher, Science 338, 469 (2012).
- Böhmer et al. [2020] A. E. Böhmer, F. Chen, W. R. Meier, M. Xu, G. Drachuck, M. Merz, P. W. Wiecki, S. L. Bud’ko, V. Borisov, R. Valentí, et al. (2020), eprint 2011.13207.
- Cho et al. [2017] K. Cho, A. Fente, S. Teknowijoyo, M. A. Tanatar, K. R. Joshi, N. M. Nusran, T. Kong, W. R. Meier, U. Kaluarachchi, I. Guillamón, et al., Physical Review B 95, 100502(R) (2017).
- Dordevic et al. [2013] S. V. Dordevic, D. N. Basov, and C. C. Homes, Scientific Reports 3, 1713 (2013).
- Kogan [2013] V. G. Kogan, Physical Review B 87, 220507(R) (2013).
- Kogan et al. [2013] V. G. Kogan, R. Prozorov, and V. Mishra, Physical Review B 88, 224508 (2013), ISSN 1098-0121, URL https://link.aps.org/doi/10.1103/PhysRevB.88.224508.
- Bud’ko et al. [2018] S. L. Bud’ko, V. G. Kogan, R. Prozorov, W. R. Meier, M. Xu, and P. C. Canfield, Physical Review B 98, 144520 (2018).
- Bud’ko et al. [2009] S. L. Bud’ko, N. Ni, and P. C. Canfield, Physical Review B 79, 220516(R) (2009).
- Skalski et al. [1964] S. Skalski, O. Betbeder-Matibet, and P. R. Weiss, Physical Review 136, A1500 (1964).
- Bud’ko et al. [2010] S. L. Bud’ko, V. G. Kogan, H. Hodovanets, S. Ran, S. A. Moser, M. J. Lampe, and P. C. Canfield, Physical Review B 82, 174513 (2010).
- A. A. Abrikosov and L. P. Gor’kov [1961] A. A. Abrikosov and L. P. Gor’kov, Sov. Phys. JETP 12, 1243 (1961) 12, 1243 (1961).
- [48] OriginLab, Origin Help, URL https://www.originlab.com/doc/Origin-Help/Interpret-Regression-Result{#}R-Square{_}.28COD.29.
- Tomioka et al. [1993] Y. Tomioka, M. Naito, and K. Kitazawa, Physica C: Superconductivity 215, 297 (1993).
VIII Appendix
Figure 19 shows the difference in the magnetization () between CaK(Fe1-xMnx)4As4 and CaKFe4As4 single crystals as a function of temperature from 40 K to 300 K with a field of 10 kOe applied parallel to the crystallographic ab plane. The magnetization plots have the appearance of Curie-Weiss tails suggesting that the Mn substituted system has local moment behavior. In order to determine if these are indeed Curie-Weiss tails, fitting was done by assuming that local moment behavior is only due to Mn and fixing values to be determined by value or its extrapolation by linear fitting to = 0.006 for low , where is absent to = 0.006 for low , where is absent. Due to the small signals in the high temperature range, we performed fitting from 40 K to 200 K. Table 1 shows the result of fitting. The value of is around 5 and (COD) values are larger than 0.99. R (COD) is also known as coefficient of determination which is a statistical measure to qualify the linear regression. If is 1, it indicates that the fitted line explains all the variability of the response data around its mean [48]. The fitting results strongly suggest that Mn, unlike Ni or Co in CaK(Fe1-x)4As4, [20] is more local-like moment bearing.
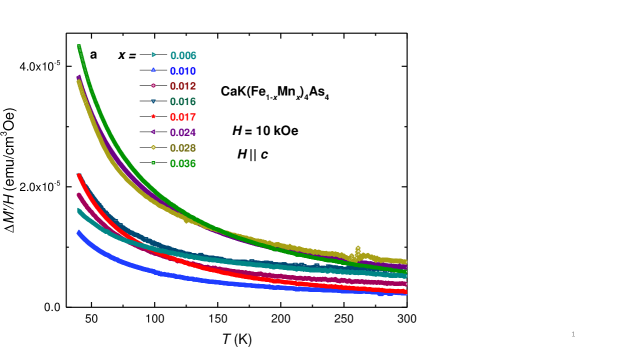
| , | , K | , | ||
|---|---|---|---|---|
| 0.006 | 5.47 (0.18) | 22.0 | -0.0132 | 0.9977 |
| 0.010 | 4.26 (0.22) | 23.9 | -0.0021 | 0.9985 |
| 0.012 | 4.82 (0.14) | 24.6 | -0.0021 | 0.9985 |
| 0.016 | 4.55 (0.09) | 25.5 | -0.0010 | 0.9948 |
| 0.017 | 4.69 (0.08) | 26.5 | -0.0060 | 0.9975 |
| 0.024 | 5.18 (0.07) | 28.8 | -0.0042 | 0.9986 |
| 0.028 | 4.63 (0.08) | 30.0 | -0.0046 | 0.9911 |
| 0.036 | 4.93 (0.05) | 35.5 | -0.0065 | 0.9954 |
. is the volumetric magnetic moment with cgs unit emu cm-3 or Oe.
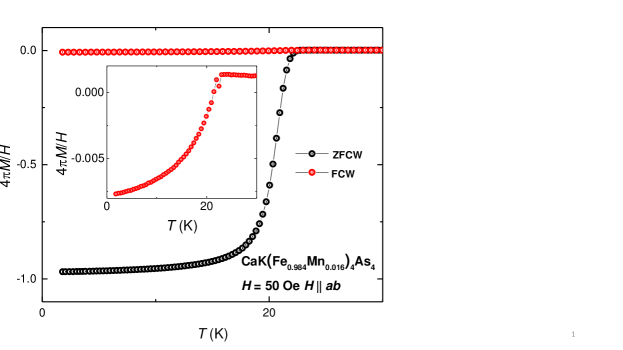
Figure 20 shows Zero-field-cooled-warming (ZFCW) and Field-cooled-warming (FCW) low temperature magnetization as a function of temperature for CaK(Fe0.984Mn0.016)4As4 single crystals with a field of 50 Oe applied parallel to ab plane. The large difference between ZFCW and FCW is consistent with the large pinning found even in CaKFe4As4[49].
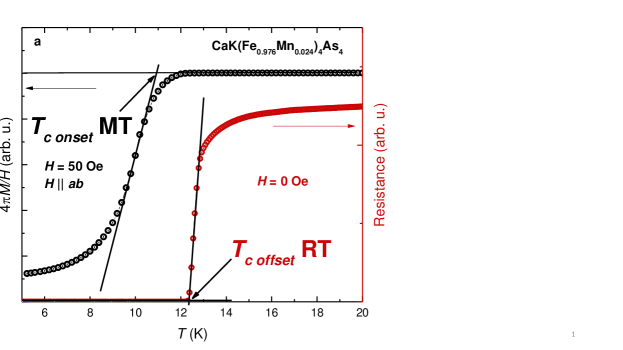
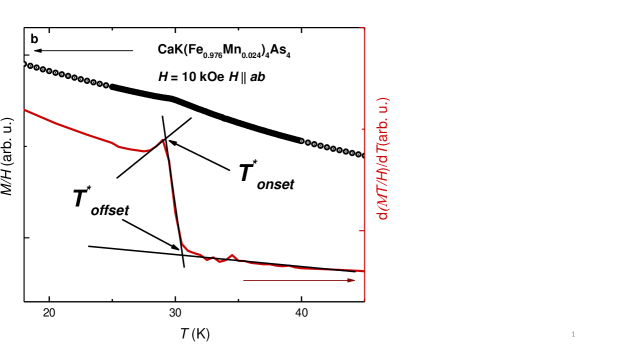
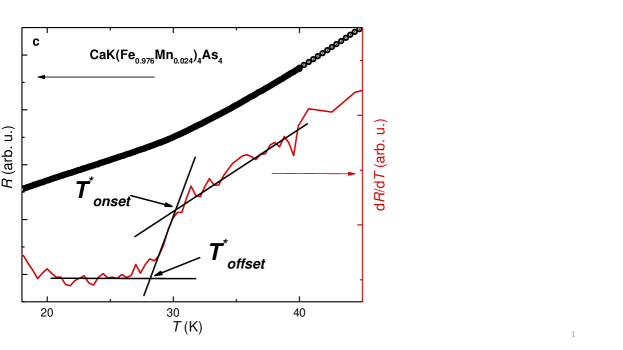
Criteria for inferring and are shown in Fig. 21. For (Fig. 21a) we use an onset criterion for our M(T) data and an offset criterion for our R(T) data. As is often the case, these criteria agree well, especially in the low field limit. For , although the feature is much clearer for Mn substitution than it was for Ni or Co substitution [20], the features in M(T) and R(T) are still somewhat subtle. In order to infer we take the average of onset and offset value and use the difference as error.
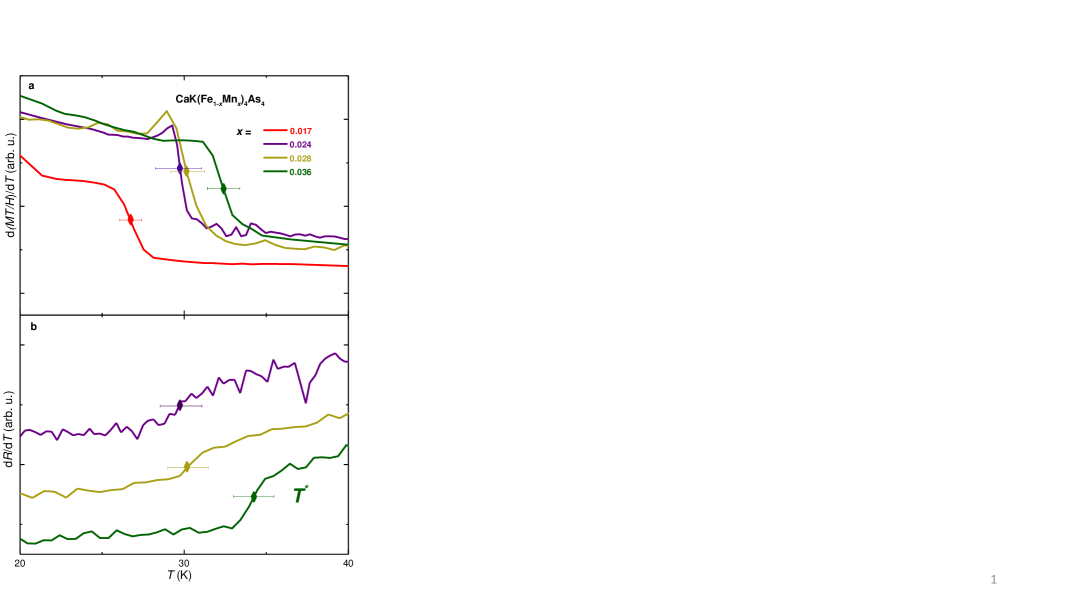
dR(T)/dT and dM(T)/dT data for several different x-values are shown in figure 22, showing good agreement between the position of the features.