Continuous Mott transition in moiré semiconductors:
role of long-wavelength inhomogeneities
Abstract
Recent experiments in moiré transition metal dichalcogenide materials have reported the observation of a continuous bandwidth-tuned transition from a metal to a paramagnetic Mott insulator at a fixed filling of one electron per moiré unit cell. The electrical transport measurements reveal a number of puzzling features that are seemingly at odds with the theoretical expectations of an interaction induced, but disorder-free, bandwidth-tuned metal-insulator transition. In this work, we include the effects of long-wavelength inhomogeneities, building on the results for a continuous metal-insulator transition at fixed filling in the clean limit. We examine the effects of meso-scale inhomogeneities near the critical point on transport using the framework of random resistor networks, highlighting the salient differences from a simple percolation-based picture. We place our results in the context of recent and ongoing experiments.
Introduction.- Electrical transport properties of metals and insulators at low-temperature are vastly different. The finite, but small, low-temperature resistance in conventional metals with weak disorder is due to elastic scattering off impurities. On the other hand, electrical transport in insulators with a finite charge-gap is nearly frozen out. Across a continuous metal-insulator transition (MIT), the theoretical mechanism leading to the dramatic suppression of the electrical conductivity is a question of fundamental interest, made especially difficult by the complex interplay of interaction and disorder effects. Recent experimental advances in tunable moiré materials have led to the demonstration of a bandwidth-tuned continuous quantum phase transition (QPT) between a metal and an interaction-induced Mott insulator at a fixed (commensurate) filling Ghiotto et al. (2021); Li et al. (2021).
We focus here on one of these experiments Li et al. (2021), which studied a continuous MIT in a transition metal dichalcogenide (TMD) heterobilayer as a function of an external displacement field at half-filling. Approaching the transition from the insulating side, the charge-gap vanishes continuously and is not associated with long-range magnetism (at least down to of the Curie-Weiss scale). Moreover, the spin-susceptibility evolves smoothly across the MIT suggesting that the Mott insulator has an abundance of low-energy spinful excitations, and displays a “Pomeranchuk” effect as a function of increasing temperature. The temperature-dependent resistivity traces exhibit beautiful scaling collapse into two sets of insulating and metallic-like curves, with the possible exception of the immediate vicinity of the critical point suggesting on the important role played by inhomogeneities. One possible theory Florens and Georges (2004) that can help explain much of this data is associated with the transition from a Fermi-liquid metal to a paramagnetic Mott insulator with a Fermi surface of electrically neutral spinons Senthil (2008). Across such a QPT, the spin-susceptibility evolves smoothly as the electronic Fermi surface morphs into the spinon Fermi surface, while the quasiparticle residue and charge-gap vanish continuously upon approaching the critical point from either side. A number of complimentary theoretical approaches have also been used to analyze other aspects of a MIT and insulating regimes Pan et al. (2020); Morales-Durán et al. (2021); Pan and Das Sarma (2021); Zang et al. (2021, 2022) in this system, respectively. The role of disorder has been analyzed starting from a different point of view across (but not necessarily, continuous and bandwidth-tuned) MITs Aguiar et al. (2009); Li et al. (2019); Tan et al. (2021); Ahn and Das Sarma (2022); see also Imada et al. (1998); Abrahams et al. (2001); Spivak and Kivelson (2006).
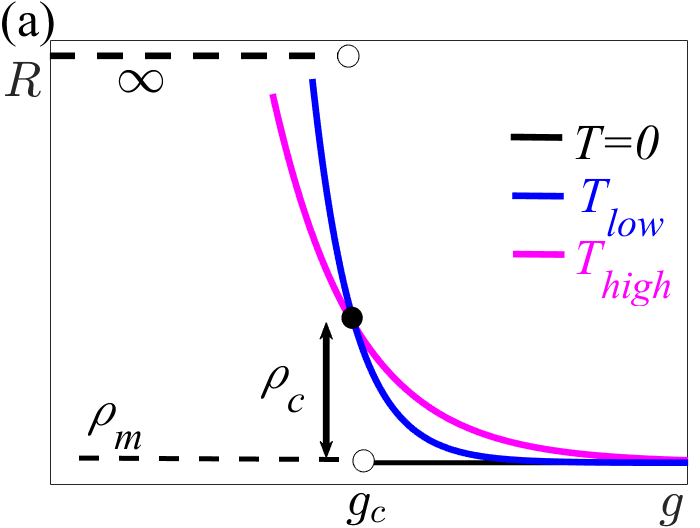
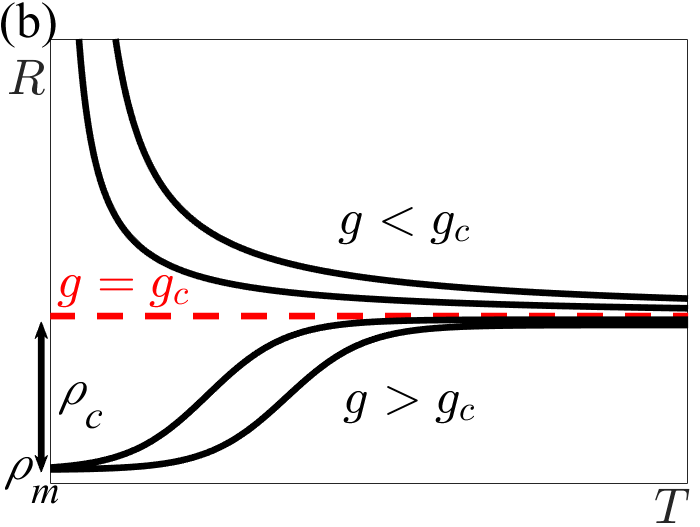
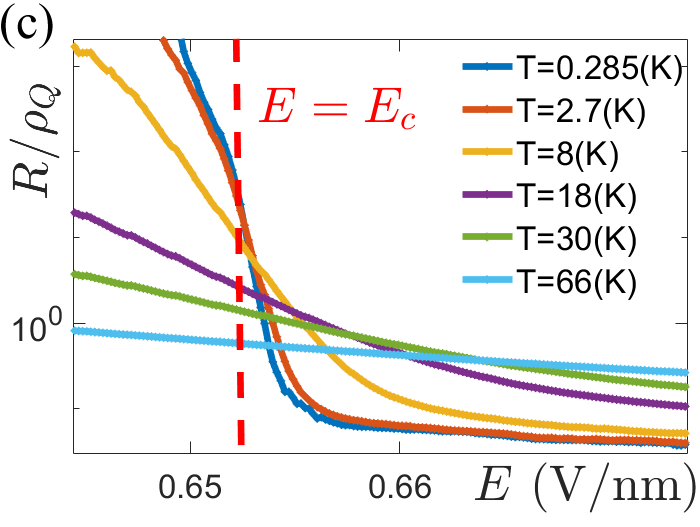
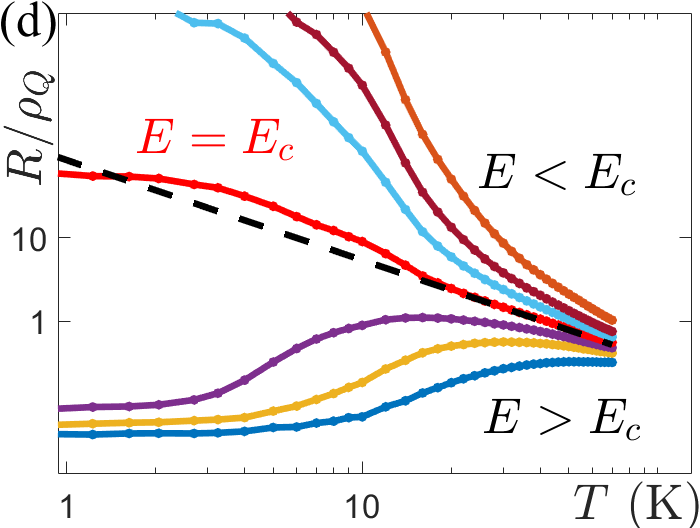
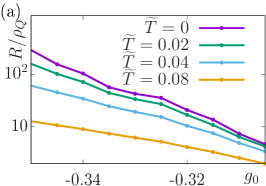
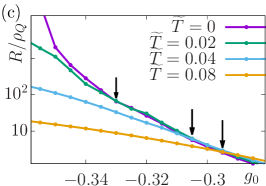
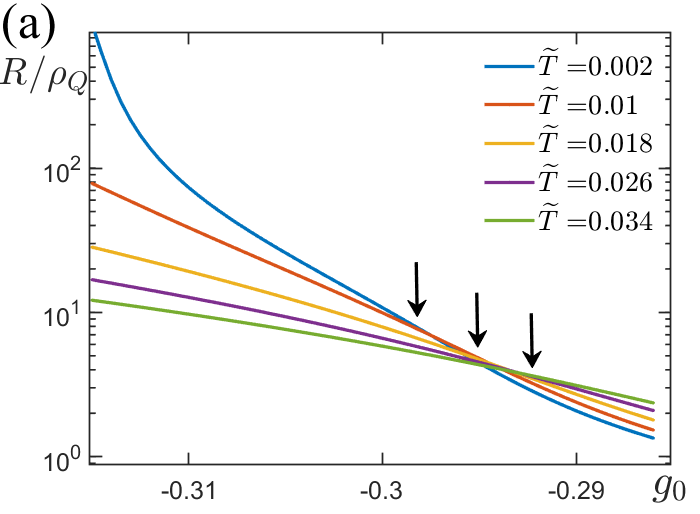
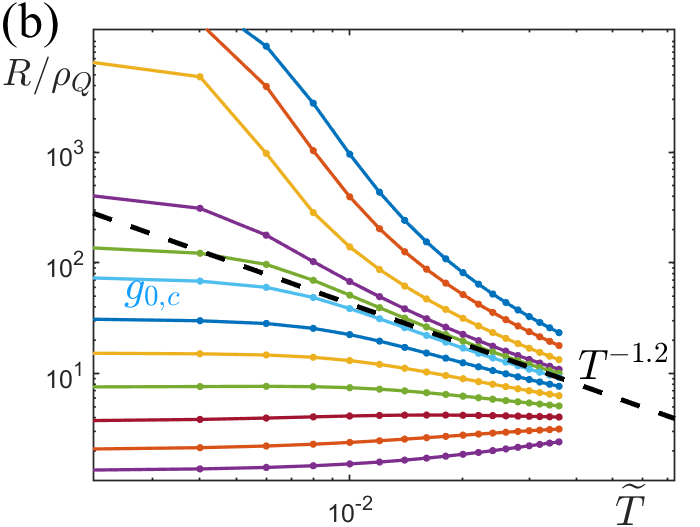
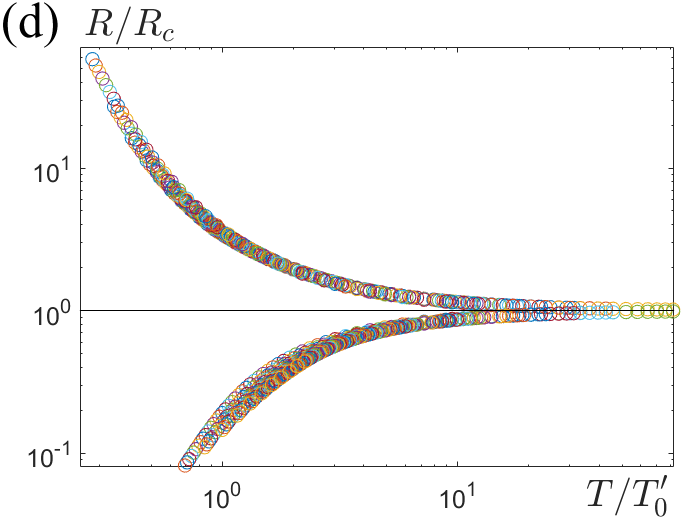
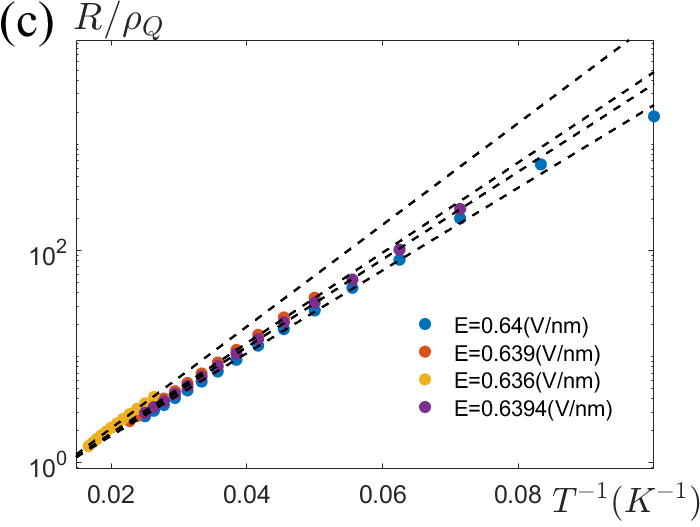
Despite the broad agreement between the experiment and theory, there are a number of mysteries associated with the transport measurements, especially when placed in the context of the theory for a continuous metal to paramagnetic Mott insulator transition. In the absence of microscopic inhomogeneities, the theoretical expectation for the resistivity evolution as a function of external tuning parameter and temperature is as shown in Fig. 1(a) and (b). At asymptotically low temperatures, the resistivity is accompanied by a universal “jump” of magnitude, , across the MIT. here is a universal number whose exact numerical value is determined by the strongly coupled field-theory describing the critical point Senthil (2008); Witczak-Krempa et al. (2012); Xu et al. (2022). Moreover, as a function of increasing temperature, all resistance traces should cross at a single point Witczak-Krempa et al. (2012). On the other hand, the experiments reveal the following anomalous features: (i) the transport data reveals no sign of a resistivity-jump; instead, the low-temperature resistance grows dramatically upon approaching the putative critical point from the metallic side (Fig. 1(c)); (ii) the resistivity traces exhibit multiple crossings at different values of the tuning parameter as a function of increasing temperatures (Fig. 1(c)); (iii) the normalized sheet-resistance, , exhibits scaling collapse into two families of mirror symmetric curves, where represents an unusual power-law resistance at the critical point (Fig. 1(d)). It is natural to ask if resolving these discrepancies between theory and experiment requires an entirely new starting point.
In this letter, we will demonstrate that all of the unexpected features associated with electrical transport are likely tied to the effects of meso-scale inhomogeneities near the continuous MIT. We do not describe the microscopic origin of such inhomogeneities here, which likely arise due to a variety of reasons including some combination of Coulomb impurities, twist-angle disorder etc. In our model, the sample consists of “puddles”, with a characteristic mean bandwidth defined locally within each puddle.111The variations in local twist-angle and the size of the moiré unit cell can also induce chemical-potential disorder. However, we will consider the simpler situation with only a local bandwidth disorder, which already helps us address the experimental puzzles. Electrical transport is then best described in terms of a random network of such puddles. However, as we explain below, a naive bond-percolation picture in terms of only metallic and insulating links is insufficient to account for the experimental phenomenology. The intrinsic correlation effects that lead to additional temperature-dependent fraction of puddles with “critical” resistance () lead to a modified percolative transition.
Model.- Let us first consider a simplified picture at . We consider an external parameter driving the QPT across . As a result of the long-wavelength disorder, the system is effectively described by a network of resistors corresponding to either metallic () or insulating () puddles. For a given mean value of the tuning parameter, , we assume that the distribution of resistors is given by, , where represents a characteristic disorder strength. Henceforth, will denote a unitless parameter (i.e. ). At , the metallic resistors are assumed to have a small residual resistance, , due to weak elastic impurity scattering while the insulating resistors have infinite resistance (Fig. 1(a)). The system is then effectively described by bond-percolation and the conductance of this random resistor network (RRN) can be computed using the transfer-matrix method Derrida and Vannimenus (1982); Han and Choi (1998).
Next we turn to the role of a finite temperature, which is incorporated within our model via two distinct mechanisms. For the insulating puddles, we assume that their resistance has an activated form, , where is the “local” gap-size within the puddle, with a characteristic energy . For our numerical computations and comparison with experiments, we will assume that the puddle itself is locally described by the clean theory associated with a QPT from a metal to a paramagnetic Mott insulator with spinon Fermi surface; the associated correlation length exponent, , and dynamical exponent, Senthil (2008). Additionally, as a function of increasing temperature, the system will crossover into the quantum-critical (QC) regime, which is controlled by the fixed-point associated with the clean theory (Fig. 2a). As noted earlier, transport in this regime is dominated by critical resistors, , and the volume fraction of puddles with a critical resistance, , is controlled by the width of the QC fan at a given temperature (Fig. 2(a)). Once we include both temperature-dependent effects, the numerical calculations will lead to a remarkable agreement with the experimental phenomenology.
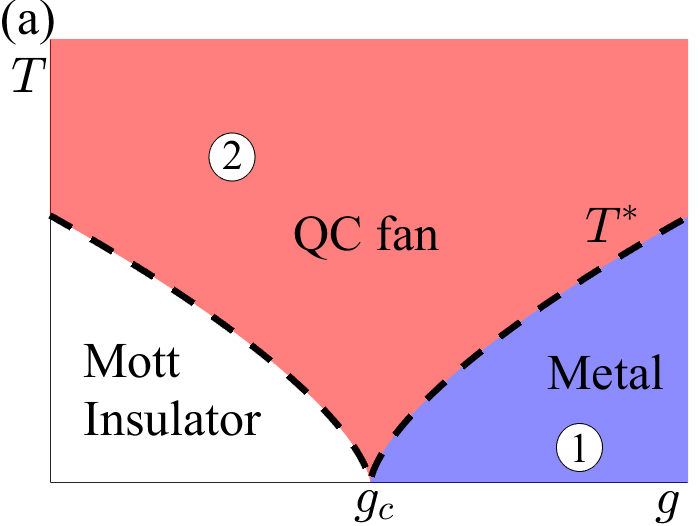
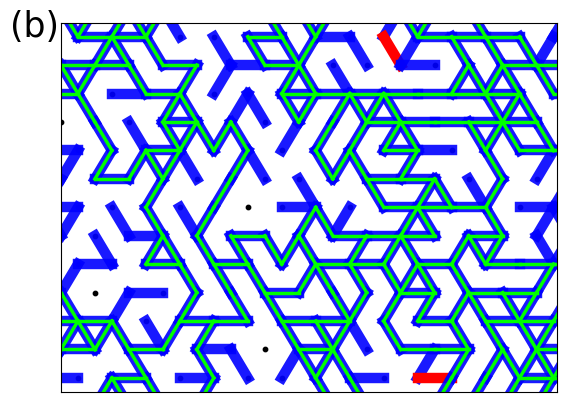
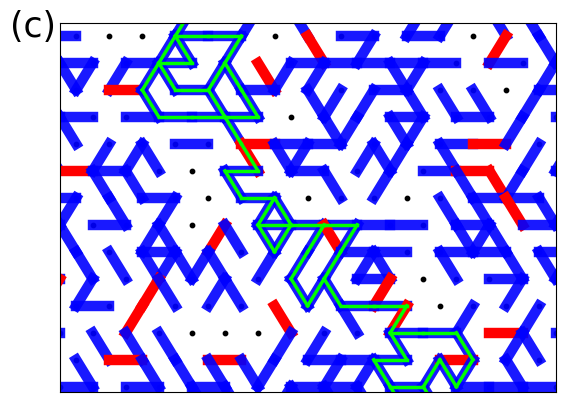
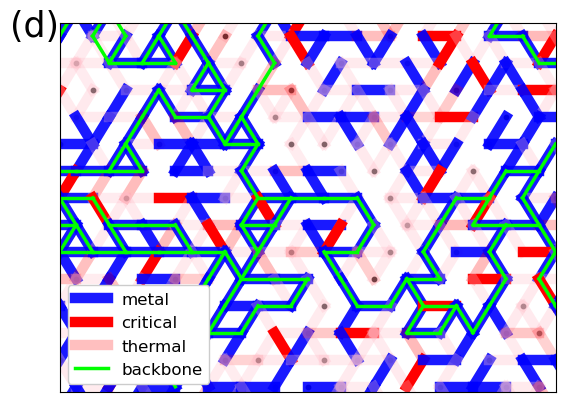
To understand how the metallic, insulating and critical puddles contribute to the current carrying paths, let us consider two representative points, , on a simplified phase diagram (Fig. 2(a)). We show a snapshot of a typical percolating current path (green network) in Fig. 2(b) for the point labelled , at low temperature and deep in the metallic regime, which involves almost entirely metallic resistors (blue) and practically no critical resistors (red). In this low temperature limit, the total fraction of resistors, , where is the percolation threshold on the triangular lattice. We note that the (bond) percolation threshold is defined as the fraction of connected bonds in a network, at which an infinitely-large cluster forms and the percolation sets in Stauffer and Aharony (2018a). Thus, deep in this metallic regime, the critical resistors do not play any significant role. We now turn to the point labelled , a point at high temperature in the QC regime, where we assume that approaches the percolation threshold from above. Let us first ignore thermal activation for the insulating links. With increasing temperature, the width of the QC fan becomes larger thereby increasing . Thus, the current carrying “backbone” now inevitably contains critical resistors (Fig. 2(c)). As long as these critical resistors are located at singly-connected bonds along the backbone, it can lead to a significant increase in the resistance by . If we now introduce a thermally activated contribution to the resistance due to the insulators, the current path will also include those insulating resistors with a small gap (light-red) in the vicinity of the critical point (Fig. 2(d)). Clearly, as one approaches the percolation threshold, the overall conductivity will be determined by the non-trivial connectivity along the backbone, which we address next using a more quantitative analysis.
Results.- We begin by presenting the evolution of the resistance across the MIT, including the finite-temperature effects (measured in units, , where is a fixed gap scale deep in the insulator). We consider a semi-infinite strip-like geometry with dimensions, . The results in Fig. 3 are obtained for and a constant ; we have obtained similar results for a distribution of metallic resistance values centered around a mean . Importantly, the key differences arise depending on whether the critical resistors are included in the computation. We note that our coarse-grained percolation model ignores a number of microscopic ingredients, e.g. the explicit temperature dependence of . However, as our analysis will show, even this simplified treatment captures the essential phenomenology near the MIT, where the dominant effect of increasing temperature is to enter the critical regime (Fig. 2(a)) with a large resistance.
First, we consider the simplest scenario without any critical resistors, where the temperature dependence enters via thermal activation. In Fig. 3(a), we present the evolution of resistance as a function of at different temperatures. It is clear that at any fixed value of , the resistance should decrease as a function of increasing temperature due to thermal activation. Importantly, in this scenario there are no crossings, unlike the experimental data. Turning next to the setup including critical resistors, we show results for resistance in Fig. 3(b) and (c) in the absence and presence of thermally activated insulators, respectively. The traces corresponding to in both curves (violet), where , are identical; the resistance diverges continuously upon approaching the percolation threshold Stauffer and Aharony (2018b). Within this setup, the notion of a universal resistivity jump at the MIT even at asymptotically low temperatures is ill-defined. Notably, with increasing temperature, the resistance curves exhibit multiple crossing points (black arrows) just as the experimental results in Fig. 1(c), which is tied crucially to the presence of the critical resistors with a temperature dependent, si .
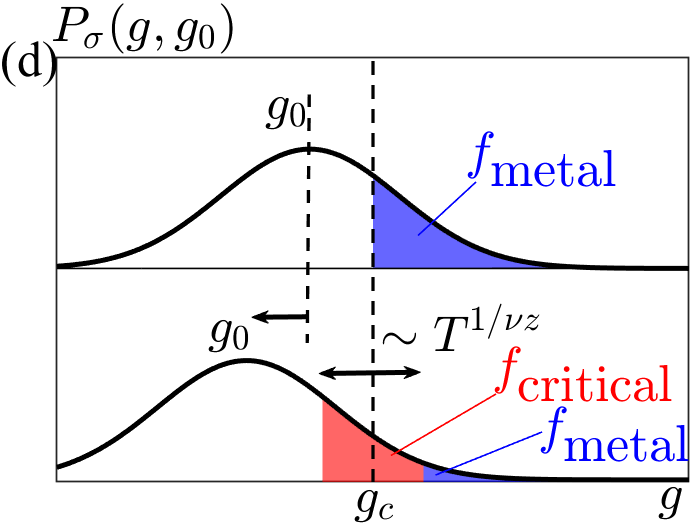
To understand the origin of multiple crossings, recall that is determined by the total fraction of resistors, . At , is determined by the blue region in the top panel of Fig. 3(d). At finite , , the width of the QC fan associated with the underlying clean fixed-point. Thus, at finite , is determined by the total area of the blue and red regions in the bottom panel of Fig. 3(d). As a function of increasing temperature, as the area of the red region increases, the position of the critical point also changes. This leads to the multiple crossing points.
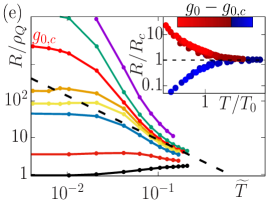
Turning now to the temperature dependence of the resistance in the scenario including the thermally activated insulators, we show our results as a function of varying in Fig. 3(e). We identify the critical point as (red curve) based on the following two measures. First, one can distinguish between a metallic vs. insulating-like response at low-temperatures depending on the sign of , with as an inflection point. Secondly, we can observe scaling collapse for the curves near onto metallic and insulating branches (inset of Fig. 3(e)), by considering the normalized resistance, , as a function of . Here, is the resistance at the critical field and represents the charge gap. We observe that the resistance in the nominally metallic low-temperature regime increases and crosses over into an insulating-like response at high-temperatures, in qualitative agreement with the experimental results (Fig. 1d). This is a consequence of the inclusion of critical resistors along the current path at high temperatures. Remarkably, the asymptotic high-temperature power-law behavior in this scenario is also similar to the experiments, , with . It is worth noting that in the scenario without thermal activation, as in Fig. 3(b), the asymptotic high-temperature behavior of with is markedly different si . Thus, the scenario where temperature affects both the fraction of critical resistors and activated insulating resistors, appears to show better quantitative agreement with the experiments. To estimate the approximate disorder strength, we fit our results to the experimental result at the lowest temperature, leading to an estimated bound si .

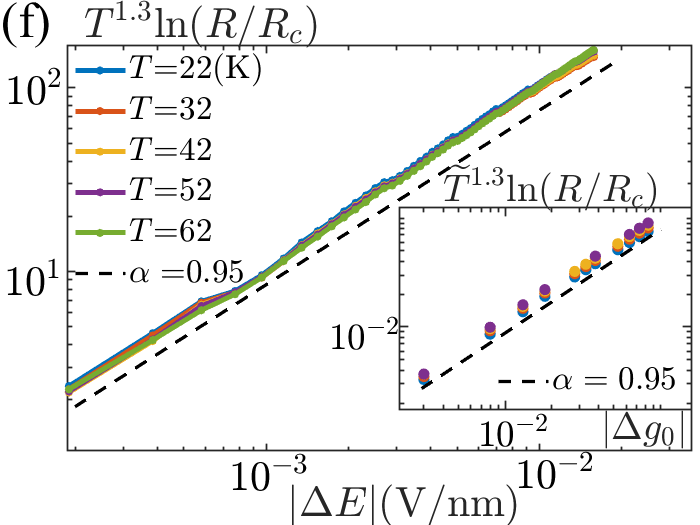
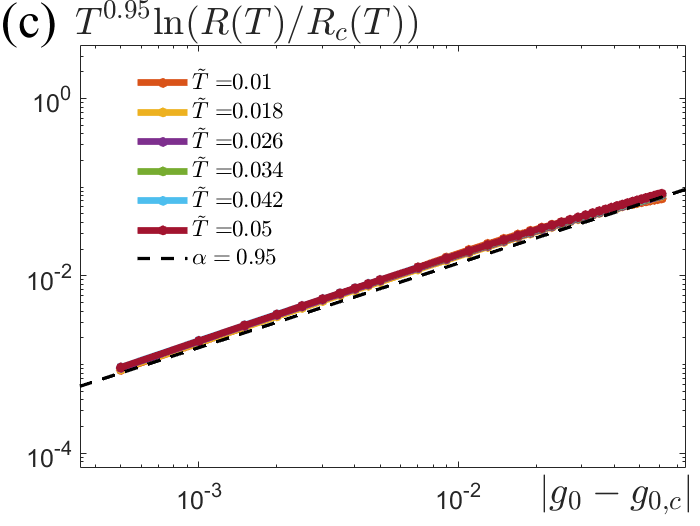
Finally, let us address the behavior of transport at finite temperature near , but on the insulating side of the critical point. If one is not situated in the immediate vicinity of the critical point, and over a small range of intermediate temperatures, the resistance is well described by the usual activated behavior. After all, this is how the charge-gap is extracted in the experiment. However, for a given realization of disorder, our analysis has already shown that the current path involves insulating links (with different local gaps) that are thermally activated, as well as temperature-dependent critical resistors. The latter effect plays an important role in giving rise to the power-law envelope, , at higher temperatures. Therefore, it is natural to consider the possibility of describing the full temperature dependence of the resistance, which interpolates between the power-law temperature dependence at and an activated form deep inside the insulator, using a single function,
| (1) |
where is a -independent constant and are new exponents. The rationale for this modified form is that it arises due to the flow of the current that averages over insulating links with a distribution of different gap-sizes at low temperatures, and is controlled by the critical resistors at high temperatures. We note that and need not be equal to the expectations from the clean theory, with and , respectively. In Fig. 3(f), by plotting as a function of , we demonstrate that the above form describes the experimental data Li et al. (2021) as well as our numerical results (inset) on the insulating side over an extended range of temperatures. Remarkably, we find that choosing leads to a collapse of all the curves over a wide range of temperature with for both the experimental and numerical data.
Outlook.- Our work illustrates that a minimal model of long-wavelength disorder induced smearing of a continuous bandwidth-tuned MIT at half filling can account for a number of mysteries associated with recent transport experiments Li et al. (2021). However, a number of questions remain. For instance, the experiments report evolution of the spin-susceptibility across the same transition and as a function of temperature. Since the low-temperature susceptibility does not change significantly across the transition, even within a percolation-based picture the susceptibility for the insulating puddles should be comparable to the metallic puddles. If this is not the case, the decreasing fraction of metallic puddles below would lead to a decreasing susceptibility. Similarly, the temperature-dependent evolution of the susceptibility, and the associated Pomeranchuk effect, can arise due to the combined effect of temperature dependence from metallic/insulating puddles and the critical puddles. We leave a detailed theoretical modeling of these observations for future work. Future measurements of the local compressibility and NMR will lead to further insights into the meso-scale inhomogeneities near the MIT. These experiments likely also hold the key for explaining the origin of the difference in the behavior of electrical transport near a similar continuous MIT, but in a moiré TMD homobilayer Ghiotto et al. (2021).
Acknowledgements.
We thank Kin-Fai Mak and Jie Shan for stimulating discussions, and Tingxin Li for sharing with us the experimental data in Fig. 1. SK and DC are supported by Grant No. 2020213 from the United States Israel Binational Science Foundation (BSF), Jerusalem, Israel. TS was supported by US Department of Energy grant DE- SC0008739, and partially through a Simons Investigator Award from the Simons Foundation. This work was also partly supported by the Simons Collaboration on Ultra-Quantum Matter, which is a grant from the Simons Foundation (651446, TS).References
- Ghiotto et al. (2021) A. Ghiotto, E.-M. Shih, G. S. S. G. Pereira, D. A. Rhodes, B. Kim, J. Zang, A. J. Millis, K. Watanabe, T. Taniguchi, J. C. Hone, L. Wang, C. R. Dean, and A. N. Pasupathy, “Quantum criticality in twisted transition metal dichalcogenides,” Nature 597, 345 (2021).
- Li et al. (2021) T. Li, S. Jiang, L. Li, Y. Zhang, K. Kang, J. Zhu, K. Watanabe, T. Taniguchi, D. Chowdhury, L. Fu, J. Shan, and K. F. Mak, “Continuous Mott transition in semiconductor moiré superlattices,” Nature 597, 350 (2021).
- Florens and Georges (2004) S. Florens and A. Georges, “Slave-rotor mean-field theories of strongly correlated systems and the mott transition in finite dimensions,” Phys. Rev. B 70, 035114 (2004).
- Senthil (2008) T. Senthil, “Theory of a continuous Mott transition in two dimensions,” Physical Review B 78, 045109 (2008).
- Pan et al. (2020) H. Pan, F. Wu, and S. Das Sarma, “Quantum phase diagram of a moiré-hubbard model,” Phys. Rev. B 102, 201104 (2020).
- Morales-Durán et al. (2021) N. Morales-Durán, A. H. MacDonald, and P. Potasz, “Metal-insulator transition in transition metal dichalcogenide heterobilayer moiré superlattices,” Phys. Rev. B 103, L241110 (2021).
- Pan and Das Sarma (2021) H. Pan and S. Das Sarma, “Interaction-driven filling-induced metal-insulator transitions in 2d moiré lattices,” Phys. Rev. Lett. 127, 096802 (2021).
- Zang et al. (2021) J. Zang, J. Wang, J. Cano, and A. J. Millis, “Hartree-fock study of the moiré hubbard model for twisted bilayer transition metal dichalcogenides,” Phys. Rev. B 104, 075150 (2021).
- Zang et al. (2022) J. Zang, J. Wang, J. Cano, A. Georges, and A. J. Millis, “Dynamical mean-field theory of moiré bilayer transition metal dichalcogenides: Phase diagram, resistivity, and quantum criticality,” Phys. Rev. X 12, 021064 (2022).
- Aguiar et al. (2009) M. C. O. Aguiar, V. Dobrosavljević, E. Abrahams, and G. Kotliar, “Critical behavior at the mott-anderson transition: A typical-medium theory perspective,” Phys. Rev. Lett. 102, 156402 (2009).
- Li et al. (2019) S. Li, Q. Zhang, P. Ghaemi, and M. P. Sarachik, “Evidence for mixed phases and percolation at the metal-insulator transition in two dimensions,” Phys. Rev. B 99, 155302 (2019).
- Tan et al. (2021) Y. Tan, P. K. H. Tsang, and V. Dobrosavljević, “Disorder-dominated quantum criticality in moiré bilayers,” arXiv e-prints , arXiv:2112.11522 (2021), arXiv:2112.11522 [cond-mat.str-el] .
- Ahn and Das Sarma (2022) S. Ahn and S. Das Sarma, “Disorder-induced two-dimensional metal-insulator transition in moiré transition metal dichalcogenide multilayers,” Phys. Rev. B 105, 115114 (2022).
- Imada et al. (1998) M. Imada, A. Fujimori, and Y. Tokura, “Metal-insulator transitions,” Rev. Mod. Phys. 70, 1039 (1998).
- Abrahams et al. (2001) E. Abrahams, S. V. Kravchenko, and M. P. Sarachik, “Metallic behavior and related phenomena in two dimensions,” Rev. Mod. Phys. 73, 251 (2001).
- Spivak and Kivelson (2006) B. Spivak and S. A. Kivelson, “Transport in two dimensional electronic micro-emulsions,” Annals of Physics 321, 2071 (2006).
- Witczak-Krempa et al. (2012) W. Witczak-Krempa, P. Ghaemi, T. Senthil, and Y. B. Kim, “Universal transport near a quantum critical Mott transition in two dimensions,” Physical Review B 86, 245102 (2012).
- Xu et al. (2022) Y. Xu, X.-C. Wu, M. Ye, Z.-X. Luo, C.-M. Jian, and C. Xu, “Interaction-driven metal-insulator transition with charge fractionalization,” Phys. Rev. X 12, 021067 (2022).
- Derrida and Vannimenus (1982) B. Derrida and J. Vannimenus, “A transfer-matrix approach to random resistor networks,” Journal of Physics A: Mathematical and General 15, L557 (1982).
- Han and Choi (1998) D. G. Han and G. M. Choi, “Computer simulation of the electrical conductivity of composites: the effect of geometrical arrangement,” Solid State Ionics 106, 71 (1998).
- Stauffer and Aharony (2018a) D. Stauffer and A. Aharony, Introduction to percolation theory (Taylor & Francis, 2018).
- Stauffer and Aharony (2018b) D. Stauffer and A. Aharony, Introduction to percolation theory (Taylor & Francis, 2018).
- (23) See supplementary information for additional details on finite size scaling of conducatance, RRN results in the absence of thermal activation, complementary results obtained using effective medium theory, an approximate estimate of the disorder strength, and experimental considerations for recovering an effective activated form of transport in the insulator.
- Redner (2012) S. Redner, “Fractal and multifractal scaling of electrical conduction in random resistor networks,” in Mathematics of Complexity and Dynamical Systems (Springer New York, 2012) pp. 446–462.
Supplementary material for “Continuous Mott transition in moiré semiconductors:
role of long-wavelength inhomogeneities”
I Finite-size scaling of conductance
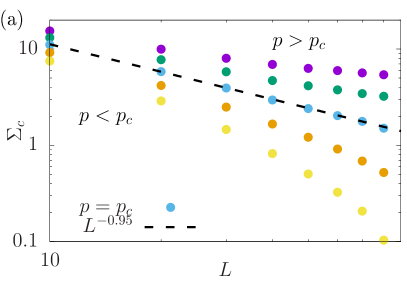
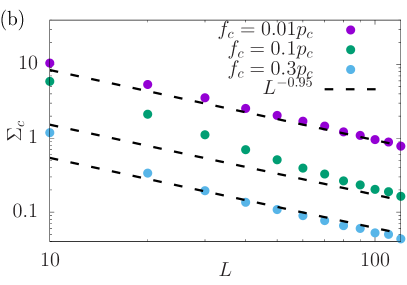
In this section, we discuss the finite-size scaling of the conductance at the bond-percolation threshold. We have also used a variety of numerical values for the ratios of the resistances, which do not affect our conclusions qualitatively. In standard bond-percolation, the conductance behaves as . Here, is a critical exponent for bond-percolation and is a new exponent; our results in Fig. 4(a) are consistent with Stauffer and Aharony (2018b). With increasing , the system size dependence gets modified at intermediate system-sizes, as in Fig. 4(b). However, this is merely a crossover phenomenon, since the power-law behavior associated with usual bond-percolation is restored at large . Recall that here is the total fraction of metallic and critical resistors, respectively, with on the triangular lattice. The result for varying in Fig. 4(b) are obtained for a fixed . In the limit of a large system-size, is approximately set by the average resistance of the percolating cluster, i.e. .
II Random resistor network in the absence of thermally activated insulators
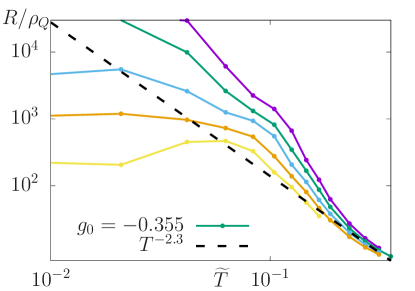
In this section, we discuss the origin of the asymptotic power-law behavior of the resistance at high temperature in the absence of thermally activated insulating links. In Fig. 5, we show the temperature dependence of the resistance across the MIT on a log-log plot, which displays a power-law with . The origin of this behavior is due to the explicit dependence of on , combined with the detailed behavior of the conductance near the percolation threshold, . To capture this asymptotic power-law behavior at high temperature in the critical regime, we approximate
| (II.2) |
where are the critical exponents that we have explicitly assumed, associated with the bandwidth-tuned MIT in the clean theory. With and , the above combination leads to a value that is close to . Importantly, this result is markedly different from the experiment , which agrees better with the RRN results once the effects of thermally activated insulators are included. In the latter description, the network of insulating links with a distribution of gap-sizes near the backbone, contribute to the conductivity.
III Effective medium theory
In this section, we present results for the resistivity obtained using effective medium theory (EMT), which is qualitatively consistent with the RRN results obtained earlier. The EMT is an alternative approach for computing the conductance of a disordered system. The basic setup is similar, with the system described in terms of puddles with a Gaussian distribution centered around a mean value of the tuning parameter, . The effective conductance, , within EMT satisfies a self-consistent equation Redner (2012)
| (III.3) |
where sums over the entire distribution of puddles, is the disorder distribution as earlier, and is the conductance of the puddle. is a geometry-dependent constant tied to the underlying triangular lattice. In Fig. 6, we show our EMT results for the same parameter values that were chosen for the RRN computations, . Unsurprisingly, the resistance evolution continues to display multiple crossing points in Fig. 6(a).
In Fig. 6(b), we present the results as a function of temperature. As with RRN, one can identify a critical field by a scaling analysis, and also describe the complete temperature dependence on the insulating side in terms of Eq. 1 in the main text (Fig. 6(c)). While the exponent is still the same as RRN and the actual experiment, obtained from EMT is slightly different and given by . Using the temperature dependent , we can obtain mirror symmetric branches from the scaling collapse plot as shown in Fig. 6(d).
IV Estimating the strength of long-wavelength disorder
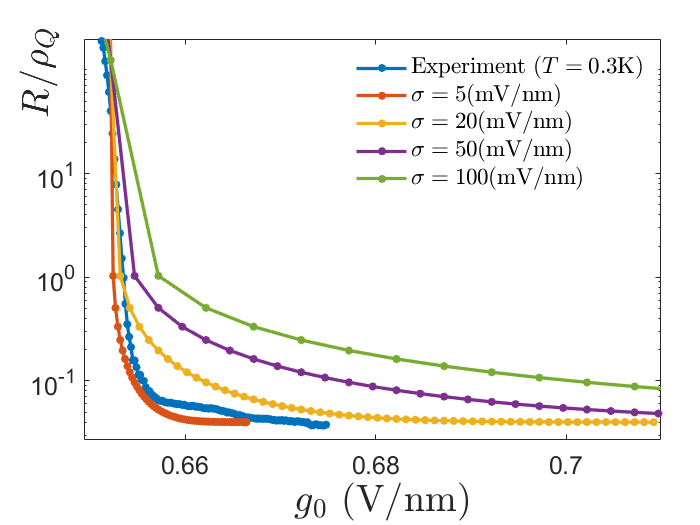
The disorder strength in the experiments can be estimated from the resistance evolution at the lowest temperature. Assuming that the resistance evolution at the lowest temperature is well described by a two-phase bond-percolation without critical resistors, we obtain from the experiments deep in the metallic side . Fig. 7 shows the experimental data and EMT results in the limit at various disorder strengths. We can see that a disorder strength leads to a significant discrepancy between the experimental and the numerical results. Thus, on this crude comparison, we estimate that the disorder strength should be .
V Recovery of the usual activated behavior
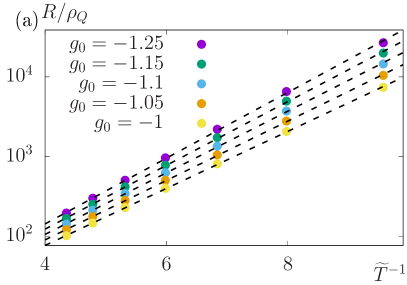
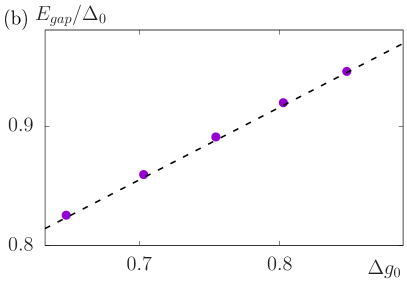
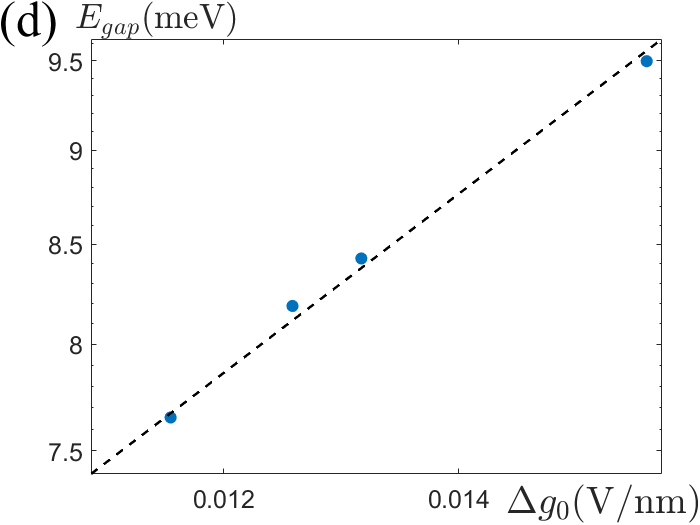
Near the MIT, the thermal activation form needs to be modified to comply with the temperature dependence of as shown in the main text. However, the usual activation form should be valid away from the immediate vicinity of the MIT, over an intermediate regime of temperatures. The upper bound of the temperature regime can be set by the crossover temperature , below which the resistance should be reasonably well described by an activation form . Here is measured from the usual percolation threshold. Additionally, the usual activation behavior cannot persist down to the lowest temperature because, at low temperatures, the resistance curves in the insulating side show a saturation behavior due to the inclusion of metallic puddles, as shown in Fig. 3(e) and Fig. 6(b). In Fig. 8(a), we plot the RRN resistance values as a function of over an intermediate regime of temperatures described above. Here, the slope of the black dashed lines shows an extracted gap. We present the extracted gap values as a function of on a log-log plot in Fig. 8(b) to obtain the slope , We also plot extracted gap values for the experimental results in Fig. 8(c), and obtain the slope in Fig. 8(d).