11email: {gnpark,niklas.adams,wvdaalst}@pads.rwth-aachen.de
OPerA: Object-Centric Performance Analysis
Abstract
Performance analysis in process mining aims to provide insights on the performance of a business process by using a process model as a formal representation of the process. Such insights are reliably interpreted by process analysts in the context of a model with formal semantics. Existing techniques for performance analysis assume that a single case notion exists in a business process (e.g., a patient in healthcare process). However, in reality, different objects might interact (e.g., order, item, delivery, and invoice in an O2C process). In such a setting, traditional techniques may yield misleading or even incorrect insights on performance metrics such as waiting time. More importantly, by considering the interaction between objects, we can define object-centric performance metrics such as synchronization time, pooling time, and lagging time. In this work, we propose a novel approach to performance analysis considering multiple case notions by using object-centric Petri nets as formal representations of business processes. The proposed approach correctly computes existing performance metrics, while supporting the derivation of newly-introduced object-centric performance metrics. We have implemented the approach as a web application and conducted a case study based on a real-life loan application process.
Keywords:
Performance Analysis Object-Centric Process Mining Object-Centric Petri Net Actionable Insights Process Improvement1 Introduction
Process mining provides techniques to extract insights from event data recorded by information systems, including process discovery, conformance checking, and performance analysis [1]. Especially performance analysis provides techniques to analyze the performance of a business process, e.g., bottlenecks, using process models as representations of the process [6].
Existing techniques for performance analysis have been developed, assuming that a single case notion exists in business processes, e.g., a patient in a healthcare process [17, 10, 14, 19, 16, 6, 5]. Such a case notion correlates events of a process instance and represents them as a single sequence, e.g., a sequence of events of a patient. However, in real-life business processes supported by ERP systems such as SAP and Oracle, multiple objects (i.e., multiple sequences of events) exist in a process instance [7, 2] and they share events (i.e., sequences are overlapping). Fig. 1(a) shows a process instance in a simple blood test process as multiple overlapping sequences. The red sequence represents the event sequence of test T1, whereas the blue sequences indicate the event sequences of samples S1 and S2, respectively. The objects share conduct test event (e4), i.e., all the sequences overlap, and the samples share transfer samples event (e6), i.e., the sample sequences overlap.
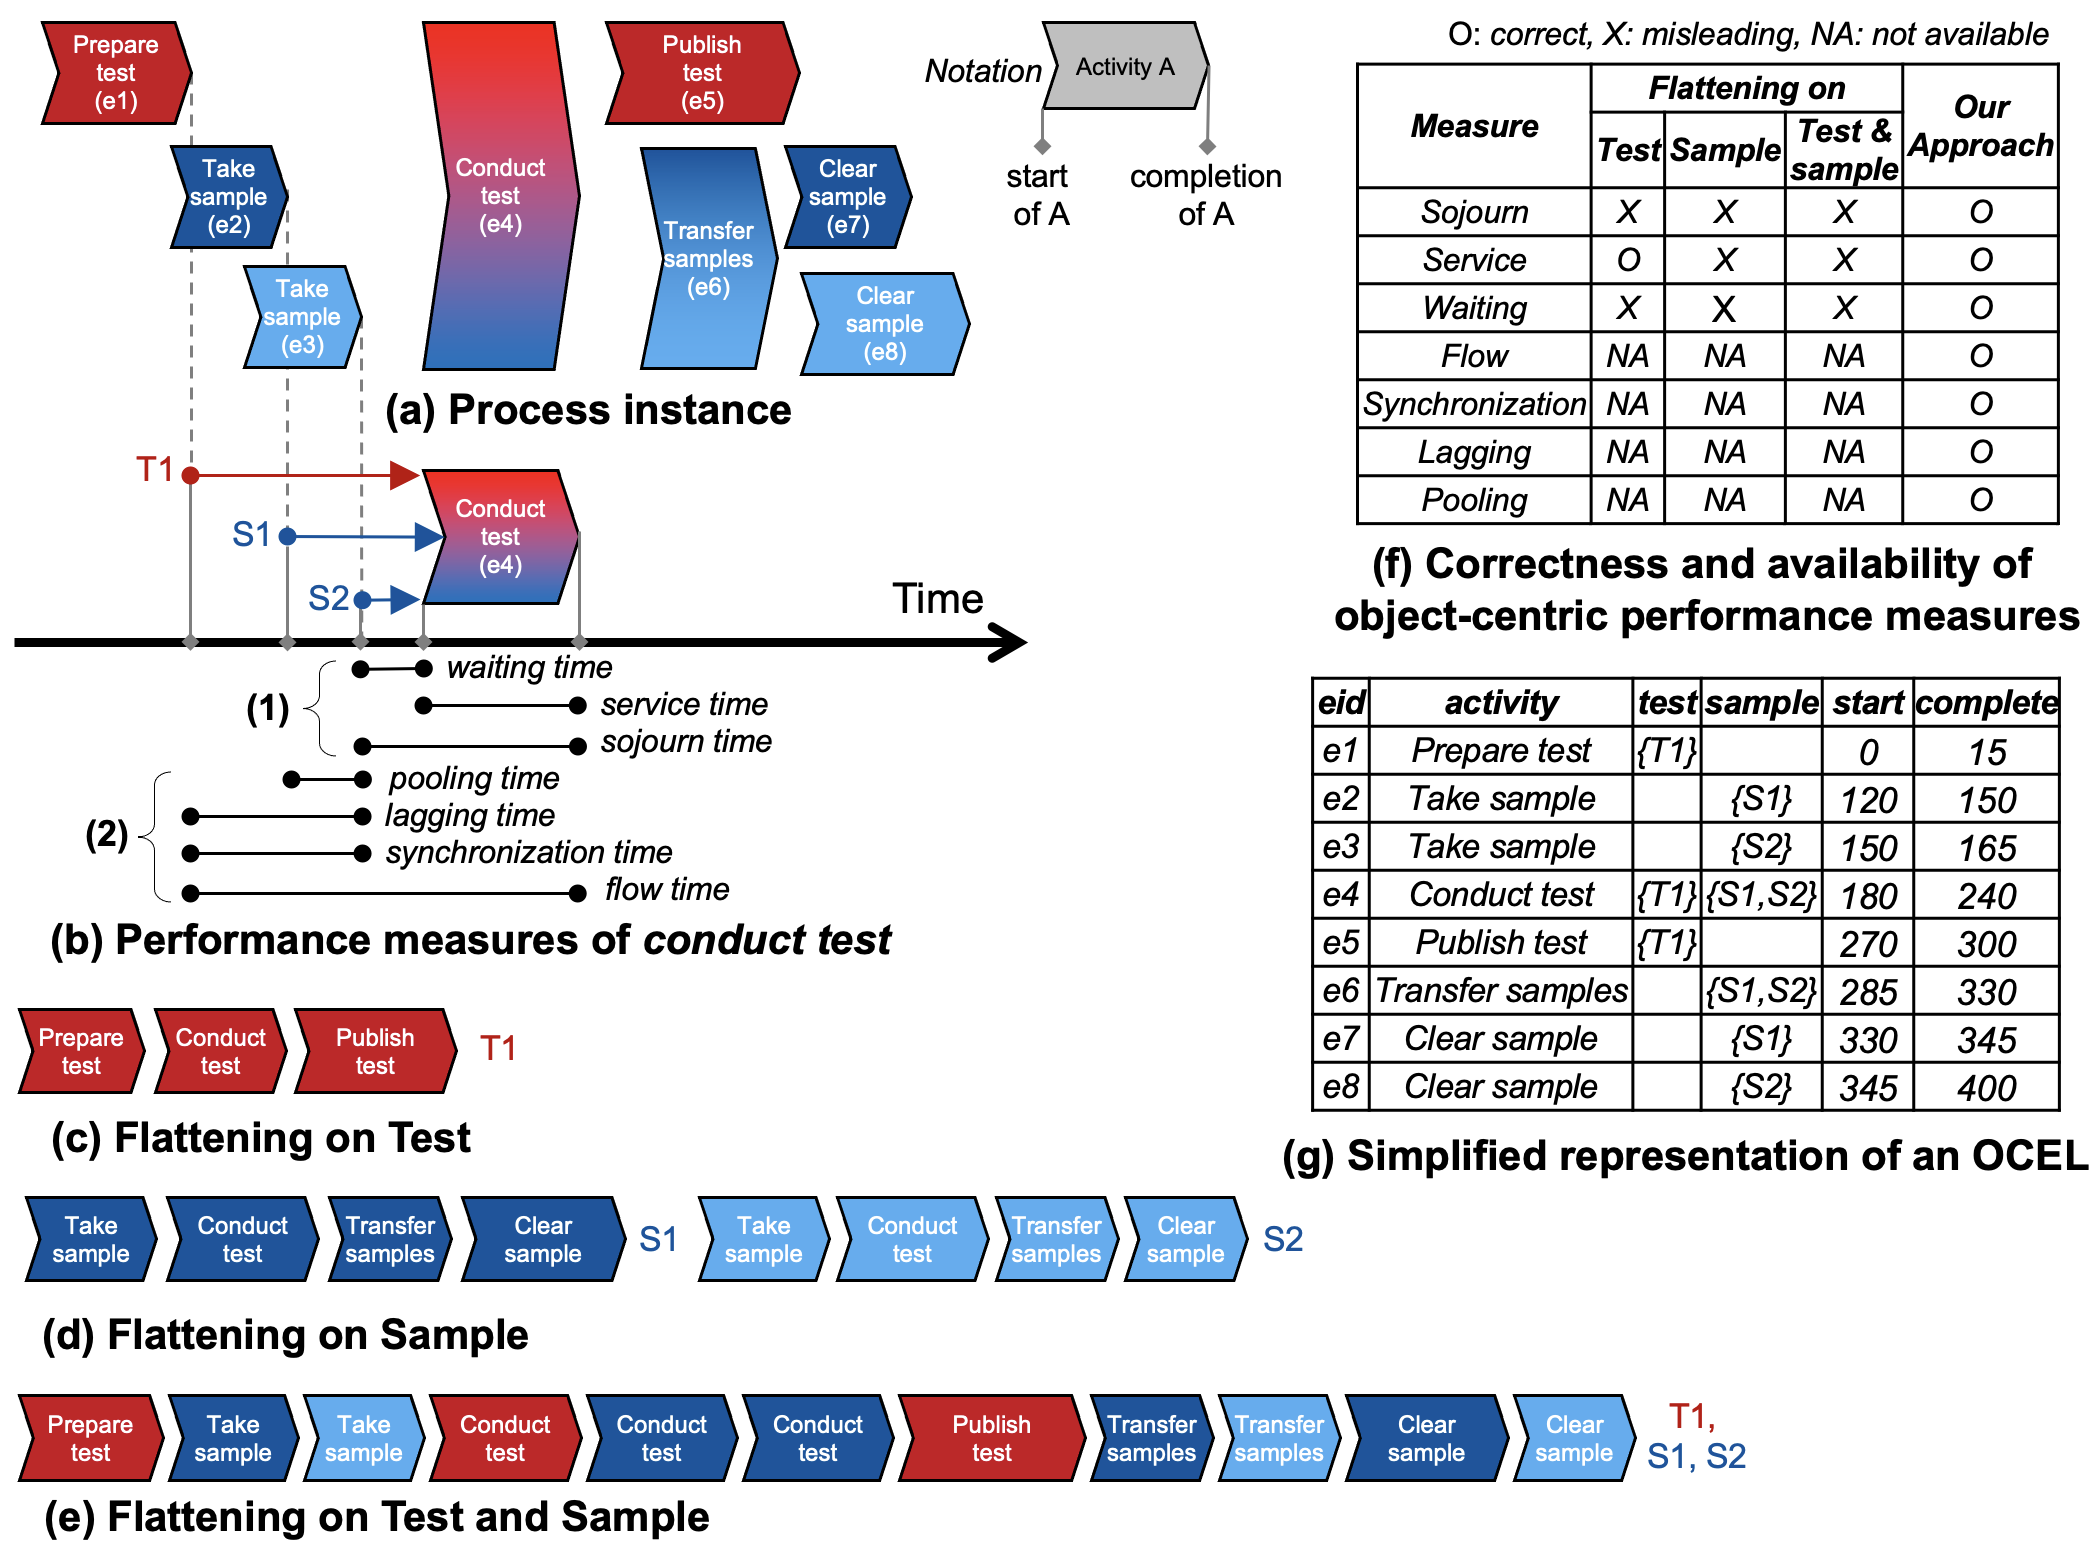
The goal of object-centric performance analysis is to analyze performance in such “object-centric” processes with multiple overlapping sequences using 1) existing performance measures and 2) new performance measures considering the interaction between objects. Fig. 1(b)(1) visualizes existing performance measures related to event conduct test. Waiting time of conduct test is the time spent before conducting the test after preparing test T1 and samples S1 and S2, while the service time is the time spent for conducting the test and sojourn time is the sum of waiting time and service time. Furthermore, Fig. 1(b)(2) shows new performance measures considering the interaction between objects. First, synchronization time is the time spent for synchronizing different objects, i.e., samples S1 and S2 with test T1 to conduct the test. Next, pooling time is the time spent for pooling all objects of an object type, e.g., the pooling time of conduct test w.r.t. sample is the time taken to pool the second sample. Third, lagging time is the time spent due to the lag of an object type, e.g., the lagging time of conduct test w.r.t. test is the time taken due to the lag of the second sample. Finally, flow time is the sum of sojourn time and synchronization time.
A natural way to apply existing techniques to multiple overlapping sequences is to flatten them into a single sequence. To this end, we select an object type(s) as a case notion, removing events not having the object type and replicating events with multiple objects of the selected type [2]. For instance, Fig. 1(a) is flattened to Fig. 1(c) by using test as a case notion, to Fig. 1(d) by using sample as a case notion, and Fig. 1(e) by using both test and sample as a case notion.
However, depending on the selection, flattening results in misleading insights. Fig. 1(f) summarizes the correctness of object-centric performance analysis on flattened sequences. 1) Flattening on test provides a misleading waiting time, measured as the time difference between the complete time of prepare test and the start time of conduct test, and, thus, a misleading sojourn time. 2) Flattening on sample results in misleading insights on the service time since two service times are measured despite the single occurrence of the event. 3) By flattening on both test and sample, the waiting time for take sample is measured in relation to prepare test although they are independent events from different object types.
In this work, we suggest a novel approach to object-centric performance analysis. The approach uses an Object-Centric Event Log (OCEL) that store multiple overlapping sequences without flattening (cf. Fig. 1(g)) as an input. Moreover, we use Object-Centric Petri Nets (OCPNs) [2] as a formalism to represent process models, and the object-centric performance is analyzed in the context of process models. With formal semantics of OCPNs, we can reliably compute and interpret performance analysis results, considering the concurrency, loops, etc [DBLP:journals/widm/AalstAD12].
More in detail, we first discover an OCPN that formally represents a process model from the OCEL. Next, we replay the OCEL on the discovered OCPN to produce token visits and event occurrences. Finally, we compute object-centric performance measures using the token visit and event occurrence. For instance, in the proposed approach, the waiting time of Conduct test is computed as the difference between e4’s start and e1’s complete. The synchronization time is computed as the time difference between e3’s complete and e1’s complete.
In summary, we provide the following contributions.
-
1.
Our approach correctly calculates existing performance measures in an object-centric setting.
-
2.
Our approach supports novel object-centric performance metrics taking the interaction between objects into account, such as synchronization time.
-
3.
The proposed approach has been implemented as a web application111 A demo video, sources, and manuals are available at https://github.com/gyunamister/OPerA and a case study with a real-life event log has been conducted to evaluate the effectiveness of the approach.
The remainder is organized as follows. We discuss the related work in Sec. 2. Next, we present the preliminaries, including OCELs and OCPNs in Sec. 3. In Sec. 4, we explains the approach to object-centric performance analysis. Afterward, Sec. 5 introduces the implementation of the proposed approach and a case study using real-life event data. Finally, Sec. 6 concludes the paper.
2 Related Work
2.1 Performance Analysis in Process Mining
Performance analysis has been widely studied in the context of process mining. Table 1 compares existing work and our proposed work in different criteria: 1) if formal semantics exist to analyze performance in the context of process models, 2) if aggregated measures, e.g., mean and median, are supported, 3) if frequency analysis is covered, 4) if time analysis is covered, and 5) if multiple case notions are allowed to consider the interactions of different objects. Existing algorithms/techniques assume a single case notion, not considering the interaction among different objects.
| Author | Technique | Form. | Agg. | Freq. | Perf. | Obj. |
| Maté et al. [17] | Business Strategy Model | - | ✓ | ✓ | ✓ | - |
| Denisov et al. [10] | Performance Spectrum | - | ✓ | ✓ | ✓ | - |
| Hornix [14] | Petri Nets | ✓ | ✓ | ✓ | ✓ | - |
| Rogge-Solti et al. [19] | Stochastic Petri Nets | ✓ | ✓ | - | ✓ | - |
| Leemans et al. [16] | Directly Follows Model | ✓ | ✓ | ✓ | ✓ | - |
| Adriansyah et al. [6] | Robust Performance | ✓ | ✓ | ✓ | ✓ | - |
| Adriansyah [5] | Alignments | ✓ | ✓ | ✓ | ✓ | - |
| Our work | Object-Centric | ✓ | ✓ | ✓ | ✓ | ✓ |
2.2 Object-Centric Process Mining
Traditionally, methods in process mining have the assumption that each event is associated with exactly one case, viewing the event log as a set of isolated event sequences. Object-centric process mining breaks with this assumption, allowing one event to be associated with multiple cases and, thus, having shared events between event sequences. An event log format has been proposed to store object-centric event logs [13], as well as a discovery technique for OCPNs [2] and a conformance checking technique to determine precision and fitness of the net [4]. Furthermore, Esser and Fahland [11] propose a graph database as a storage format for object-centric event data, enabling a user to use queries to calculate different statistics. A study on performance analysis is, so far, missing in the literature, with only limited metrics being supported in [2] by flattening event logs and replaying them. However, object-centric performance metrics are needed to accurately assess performance in processes where multiple case notions occur.
The literature contains several notable approaches to deal with multiple case notions. Proclets [12] is the first introduced modeling technique to describe interacting workflow processes and, later, artifact-centric modeling [9] extends this approach. DB nets [18] are a modeling technique based on colored Petri nets. OCBC [3] is a newly proposed technique that includes the evolution of a database into an event log, allowing for the tracking of multiple objects. Object-centric process mining aims to alleviate the weaknesses of these techniques. The approaches and their weaknesses are more deeply discussed in [2].
3 Background
3.1 Object-Centric Event Data
Definition 1 (Universes)
Let be the universe of event identifiers, the universe of activity names, the universe of timestamps, the universe of object types, and the universe of object identifiers. assigns precisely one type to each object identifier. is the universe of all object mappings indicating which object identifiers are included per type. is the universe of events.
Given , , , , , and . Note that we assume an event has start and complete timestamps.
Fig. 1(b) describes a fraction of a simple object-centric event log with two types of objects. For the event in the fourth row, denoted as , , , , , , and . Note that the timestamp in the example is simplified using the relative scale.
Definition 2 (Object-Centric Event Log (OCEL))
An object-centric event log is a tuple , where is a set of events and is a total order underlying . is the set of all possible object-centric event logs.
3.2 Object-Centric Petri Nets
A Petri net is a directed graph having places and transitions as nodes and flow relations as edges. A labeled Petri net is a Petri net where the transitions can be labeled.
Definition 3 (Labeled Petri Net)
A labeled Petri net is a tuple with the set of places, the set of transitions, , the flow relation, and a labeling function.
Each place in an OCPN is associated with an object type to represent interactions among different object types. Besides, variable arcs represent the consumption/production of a variable amount of tokens in one step.
Definition 4 (Object-Centric Petri Net)
An object-centric Petri net is a tuple where is a labeled Petri net, maps places to object types, and is the subset of variable arcs.
Fig. 3(a) depicts an OCPN, with where , , , , etc., , , etc., and .
Definition 5 (Marking)
Let be an object-centric Petri net, where . is the set of possible tokens. A marking of is a multiset of tokens, i.e., .
For instance, marking denotes three tokens, among which place p3 has one token referring to object T1 and p4 has two tokens referring to objects S1 and S2.
A binding describes the execution of a transition consuming objects from its input places and producing objects for its output places. A binding is a tuple of transition and function mapping the object types of the surrounding places to sets of object identifiers. For instance, describes the execution of transition with where and , where test and sample are the object types of its surrounding places (i.e., ).
A binding is enabled in marking if all the objects specified by exist in the input places of . For instance, is enabled in marking since , , and exist in its input places, i.e., and .
A new marking is reached by executing enabled binding at leads to, denoted by . As a result of executing , is removed from and added to . Besides, and are removed from and added to , resulting in new marking .
4 Object-Centric Performance Analysis
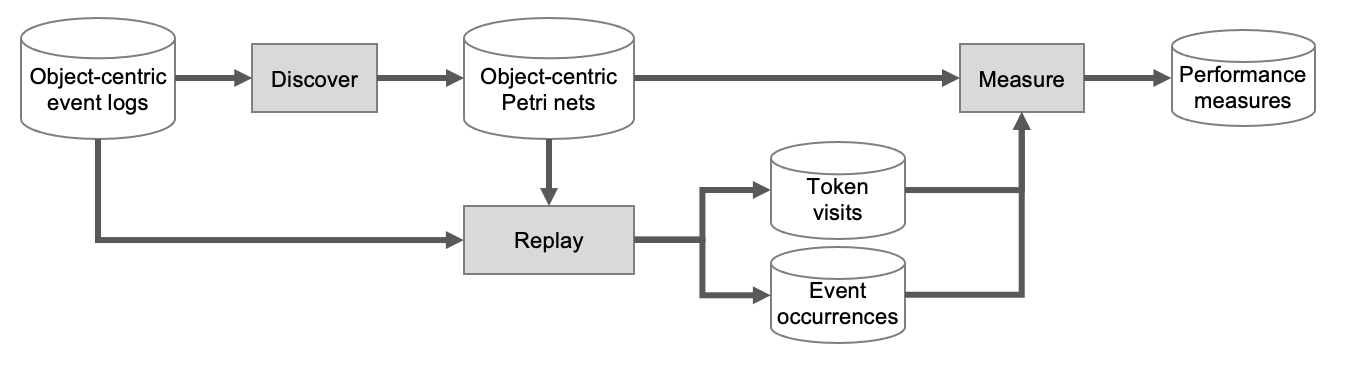
This section introduces an approach to object-centric performance analysis. Fig. 2 shows an overview of the proposed approach. First, we discover an OCPN based on an OCEL. Next, we replay the OCEL with timestamps on the discovered OCPN to connect events in the OCEL to the elements of OCPN and compute event occurrences and token visits. Finally, we measure various object-centric performance metrics based on the event occurrence and token visit. The discovery follows the general approach presented in [2]. In the following subsections, we focus on explaining the rest.
4.1 Replaying OCELs on OCPNs
First, we couple events in an OCEL to an OCPN by “playing the token game” using the formal semantics of OCPNs. Note that most of business processes are not sequential, and, thus, simply relating an event to its directly following event does not work. By using the semantics of OCPNs, we can reliably relate events to process models by considering the concurrency and loop and correctly identify relationships between events.
As a result of the replay, a collection of event occurrences are annotated to each visible transition, and a collection of token visits are recorded for each place. First, an event occurrence represents the occurrence of an event in relation to a transition.
Definition 6 (Event Occurrence)
Let be an object-centric Petri net, where . An event occurrence is a tuple of a transition and an event. is the set of possible event occurrences of .
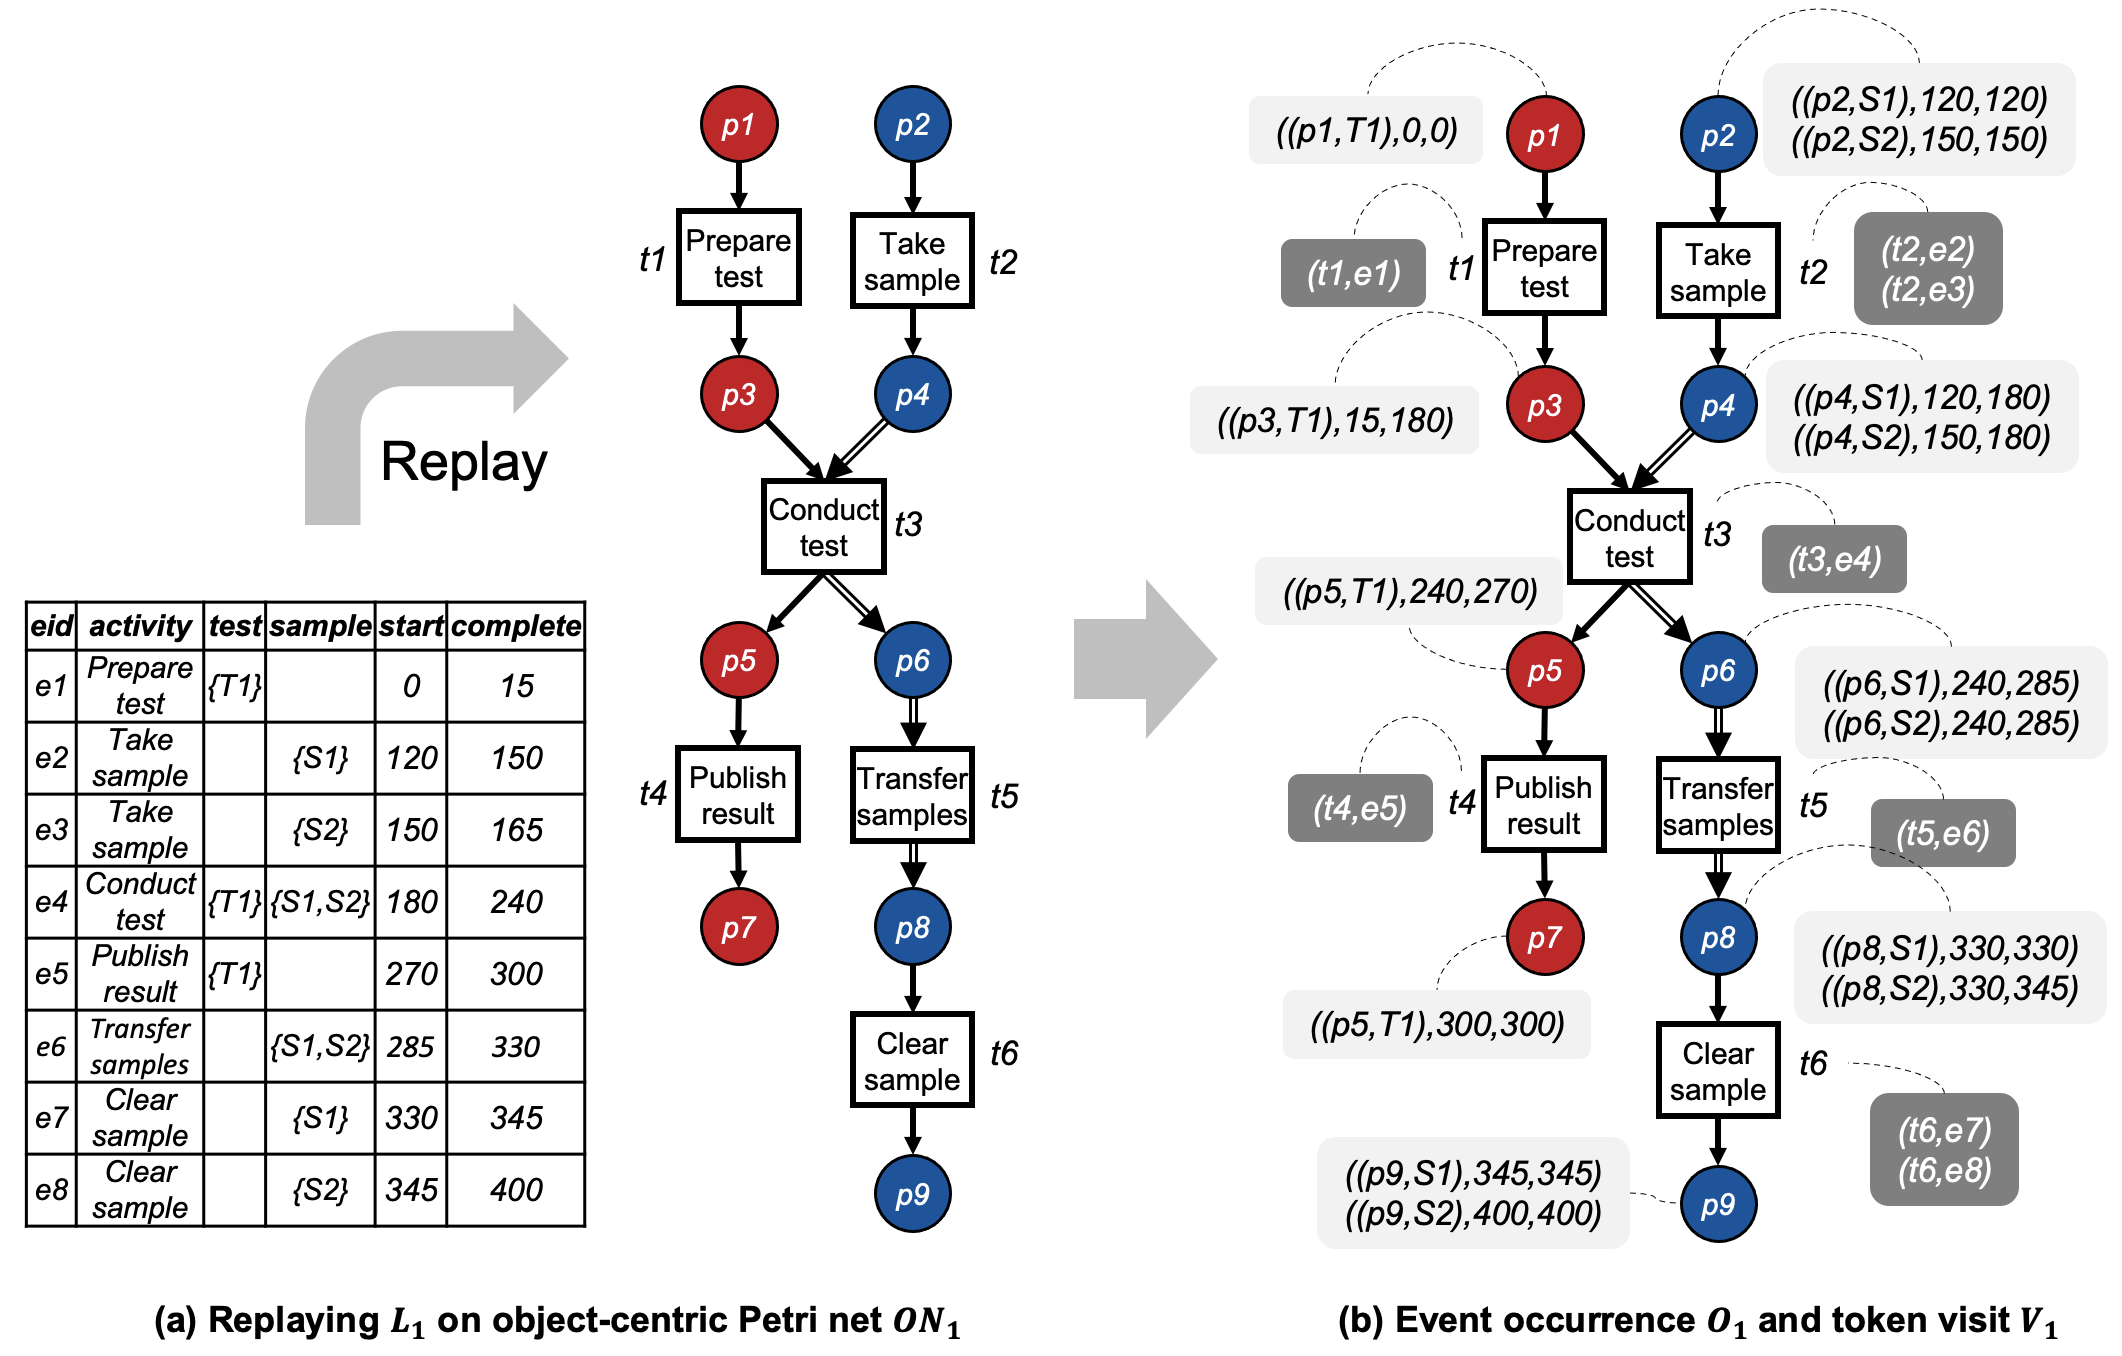
For instance, is a possible event occurrence in shown in Fig. 3(a). It indicates that t3 is associated with the occurrence of event . In other words, t3 is fired by 1) consuming tokens from p3 and and fromp4 at and 2) producing tokens to p5 and and p6 at . Note that we derive the consumed and produced tokens by using the transition and the event, i.e., we are aware of the input and output places of the transition and the involved objects of the event. Moreover, we know when the event starts and completes.
A token visit describes “visit” of a token to the corresponding place with the begin time of the visit, i.e., the timestamp when the token is produced, and the end time of the visit, i.e., the timestamp when the token is consumed.
Definition 7 (Token Visit)
Let be an object-centric Petri net, where . is the set of possible tokens. A token visit is a tuple of a token, a begin time, and an end time. is the set of possible token visits of .
Given token visit , , , , and . For instance, is a possible token visit in shown in Fig. 3. It represents that token is produced in place p3 at and consumed at .
Given an OCEL, a replay function produces event occurrences and token visits of an OCPN, connecting events in the log to the OCPN.
Definition 8 (Replay)
Let be an object-centric Petri net. A replay function maps an event log to a set of event occurrences and a set of token visits.
Fig. 3(b) shows the result of replaying the events in shown in Fig. 3(a) on model depicted in Fig. 3(a). The dark gray boxes represent event occurrences and the light gray boxes represent token visits , where . For instance, replaying event e1 and e4 in produces event occurrences, and , respectively, and token visit where is the time when e1 completes and is the time when e4 starts.
In this work, we instantiate the replay function based on the token-based replay approach described in [8]. We first flatten an OCEL to a traditional event log and project an OCPN to an accepting Petri net for each object type. Next, we apply the token-based replay for each log and Petri net, as introduced in [2]. The replay function needs to be instantiated to ignore non-fitting events to deal with logs with non-perfect fitness. To simplify matters, we assume the flattened logs perfectly fit the projected Petri nets (i.e., no missing or remaining tokens).
4.2 Measuring Object-Centric Performance Measures
We compute object-centric performance measures per event occurrence. For instance, we compute synchronization, pooling, lagging, and waiting time of that analyzes an event of conduct test. For meaningful insights, we may aggregate all waiting time measures of conduct test events into the average, median, maximum, or minimum waiting time of conduct test.
To this end, we first relate an event occurrence to the token visits 1) associated with the event occurrence’s transition and 2) involving the objects linked to the event occurrence’s event.
Definition 9 (Relating An Event Occurrence to Token Visits)
Let be an object-centric event log and an object-centric Petri net. Let be an event occurrence. denotes the set of objects related to the event occurrence. is a function mapping an event occurrence and a set of token visits to the set of the token visits related to the event occurrence, s.t., for any and , .
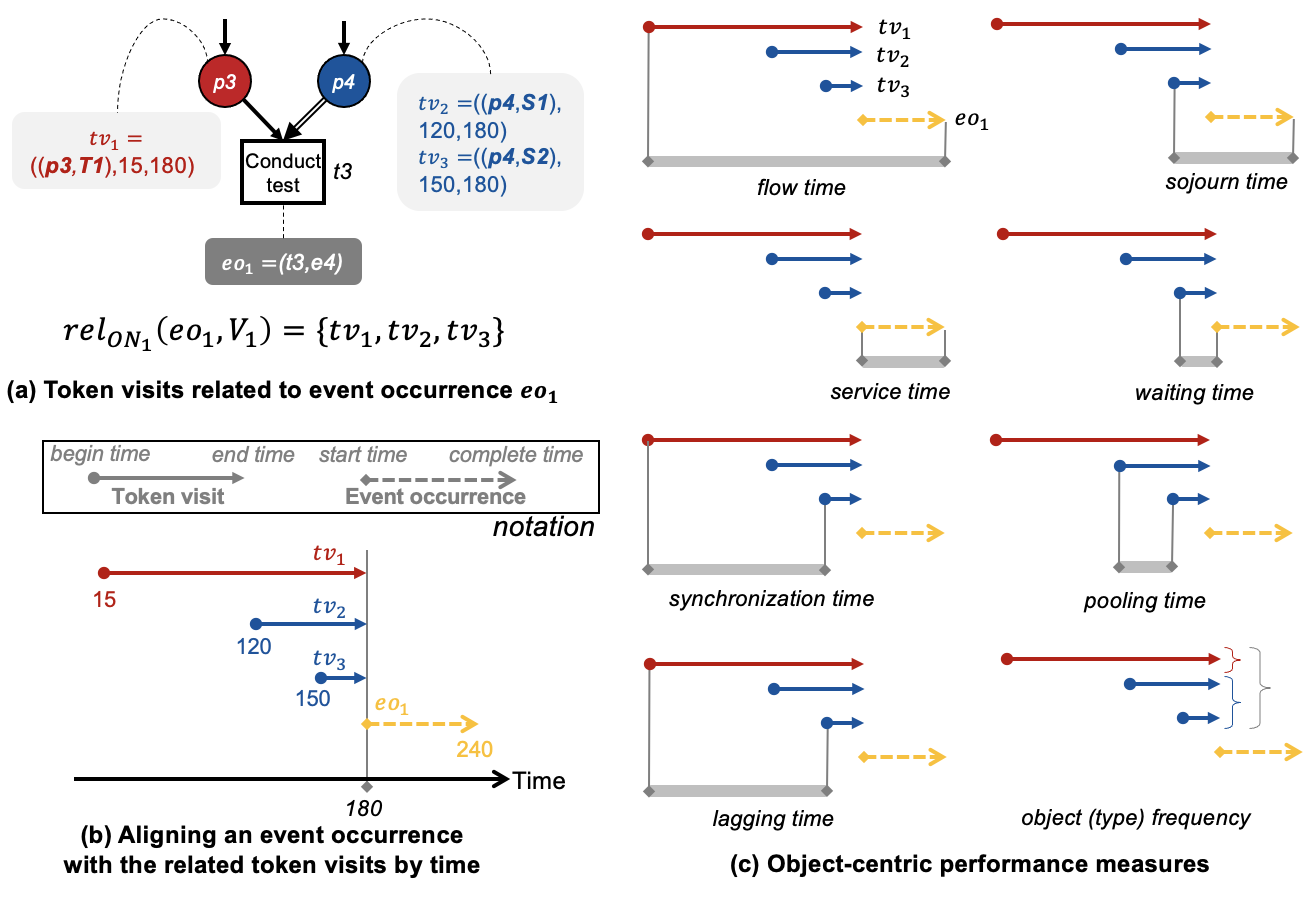
Fig. 4(a) shows the token visits related to . since , , and each token visit is with the latest begin time among other token visits of the corresponding object, e.g., is the latest token visit of .
A measurement function computes a performance measure of an event occurrence by using the related token visits.
Definition 10 (Measurement)
Let be an object-centric Petri net. is a function mapping an event occurrence and its related token visits to a performance value. denotes the set of all such functions.
In this paper, we introduce seven measurement functions to compute object-centric performance measures as shown in Fig. 4(c). With an OCEL, an OCPN, and , we introduce the functions with formal definitions and examples as below:
-
•
computes flow time, i.e., the time difference between the completion of the event and the earliest token visit related to the event. Formally, for any , with . In Fig. 4(c), the flow time of is the time difference between the completion of the event, i.e., the completion time of e4 (), and the earliest token visit related to the event, i.e., the begin time of (). Note that flow time is equal to the sum of synchronization time and sojourn time.
-
•
computes sojourn time, i.e., the time difference between the completion of the event and the latest token visit related to the event. Formally, for any , with . In Fig. 4(c), the sojourn time of is the time difference between the completion of the event, i.e., the completion time of e4 (), and the latest token visit related to the event, i.e., the begin time of (). Note that sojourn time is equal to the sum of waiting time and service time.
-
•
computes waiting time, i.e., the time difference between the start of the event and the latest token visit related to the event. Formally, for any , with . In Fig. 4(c), the waiting time of is the time difference between its start, i.e., the start time of e4 (), and the latest token visit, i.e., the begin time of ().
-
•
computes service time, i.e., the time difference between the completion of the event and the start of the event. Formally, for any , . In Fig. 4(c), the service time of is the time difference between the completion of the event, i.e., the completion time of e4 (), and the start of the event, i.e., the start time of e4 ().
-
•
computes synchronization time, i.e., the time difference between the latest token visit and the earliest token visit related to the event. Formally, for any , with . In Fig. 4(c), the synchronization time of is the time difference between the latest token visit, i.e., the begin time of (), and the earliest token visit, i.e., the begin time of (). Note that the synchronization time consists of pooling time and lagging time.
-
•
computes pooling time w.r.t. object type , i.e., the time difference between the latest token visit of and the earliest token visit of related to the event. Formally, for any , with . In Fig. 4(c), the pooling time of w.r.t. sample is the time difference between the latest token visit of sample, i.e., the begin time of (), and the earliest token visit of sample, i.e., the begin time of (). Note that the pooling time can be the same as the synchronization time.
-
•
computes lagging time w.r.t. object type , i.e., the time difference between the latest token visit of and the earliest token visit of other object types related to the event. Formally, for any , with and if . otherwise. In Fig. 4(c), the lagging time of w.r.t. sample is the time difference between the latest token visit of samples, i.e., the begin time of (), and the earliest token visit of any object types, i.e., the begin time of (). Note that, in some cases, the lagging time is the same as the synchronization time.
Non-temporal performance measures are trivial to compute given object-centric event data, but still provide valuable insights. They include object frequency, i.e., the number of objects involved with the event, and object type frequency, i.e., the number of object types involved with the event. In Fig. 4(c), the object frequency of e4 is including T1, S1, and S2 and the object type frequency of e4 is including Test and Sample.
5 Evaluation
In this section, we present the implementation of the proposed approach and evaluate the effectiveness of the approach by applying it to a real-life event log.
5.1 Implementation
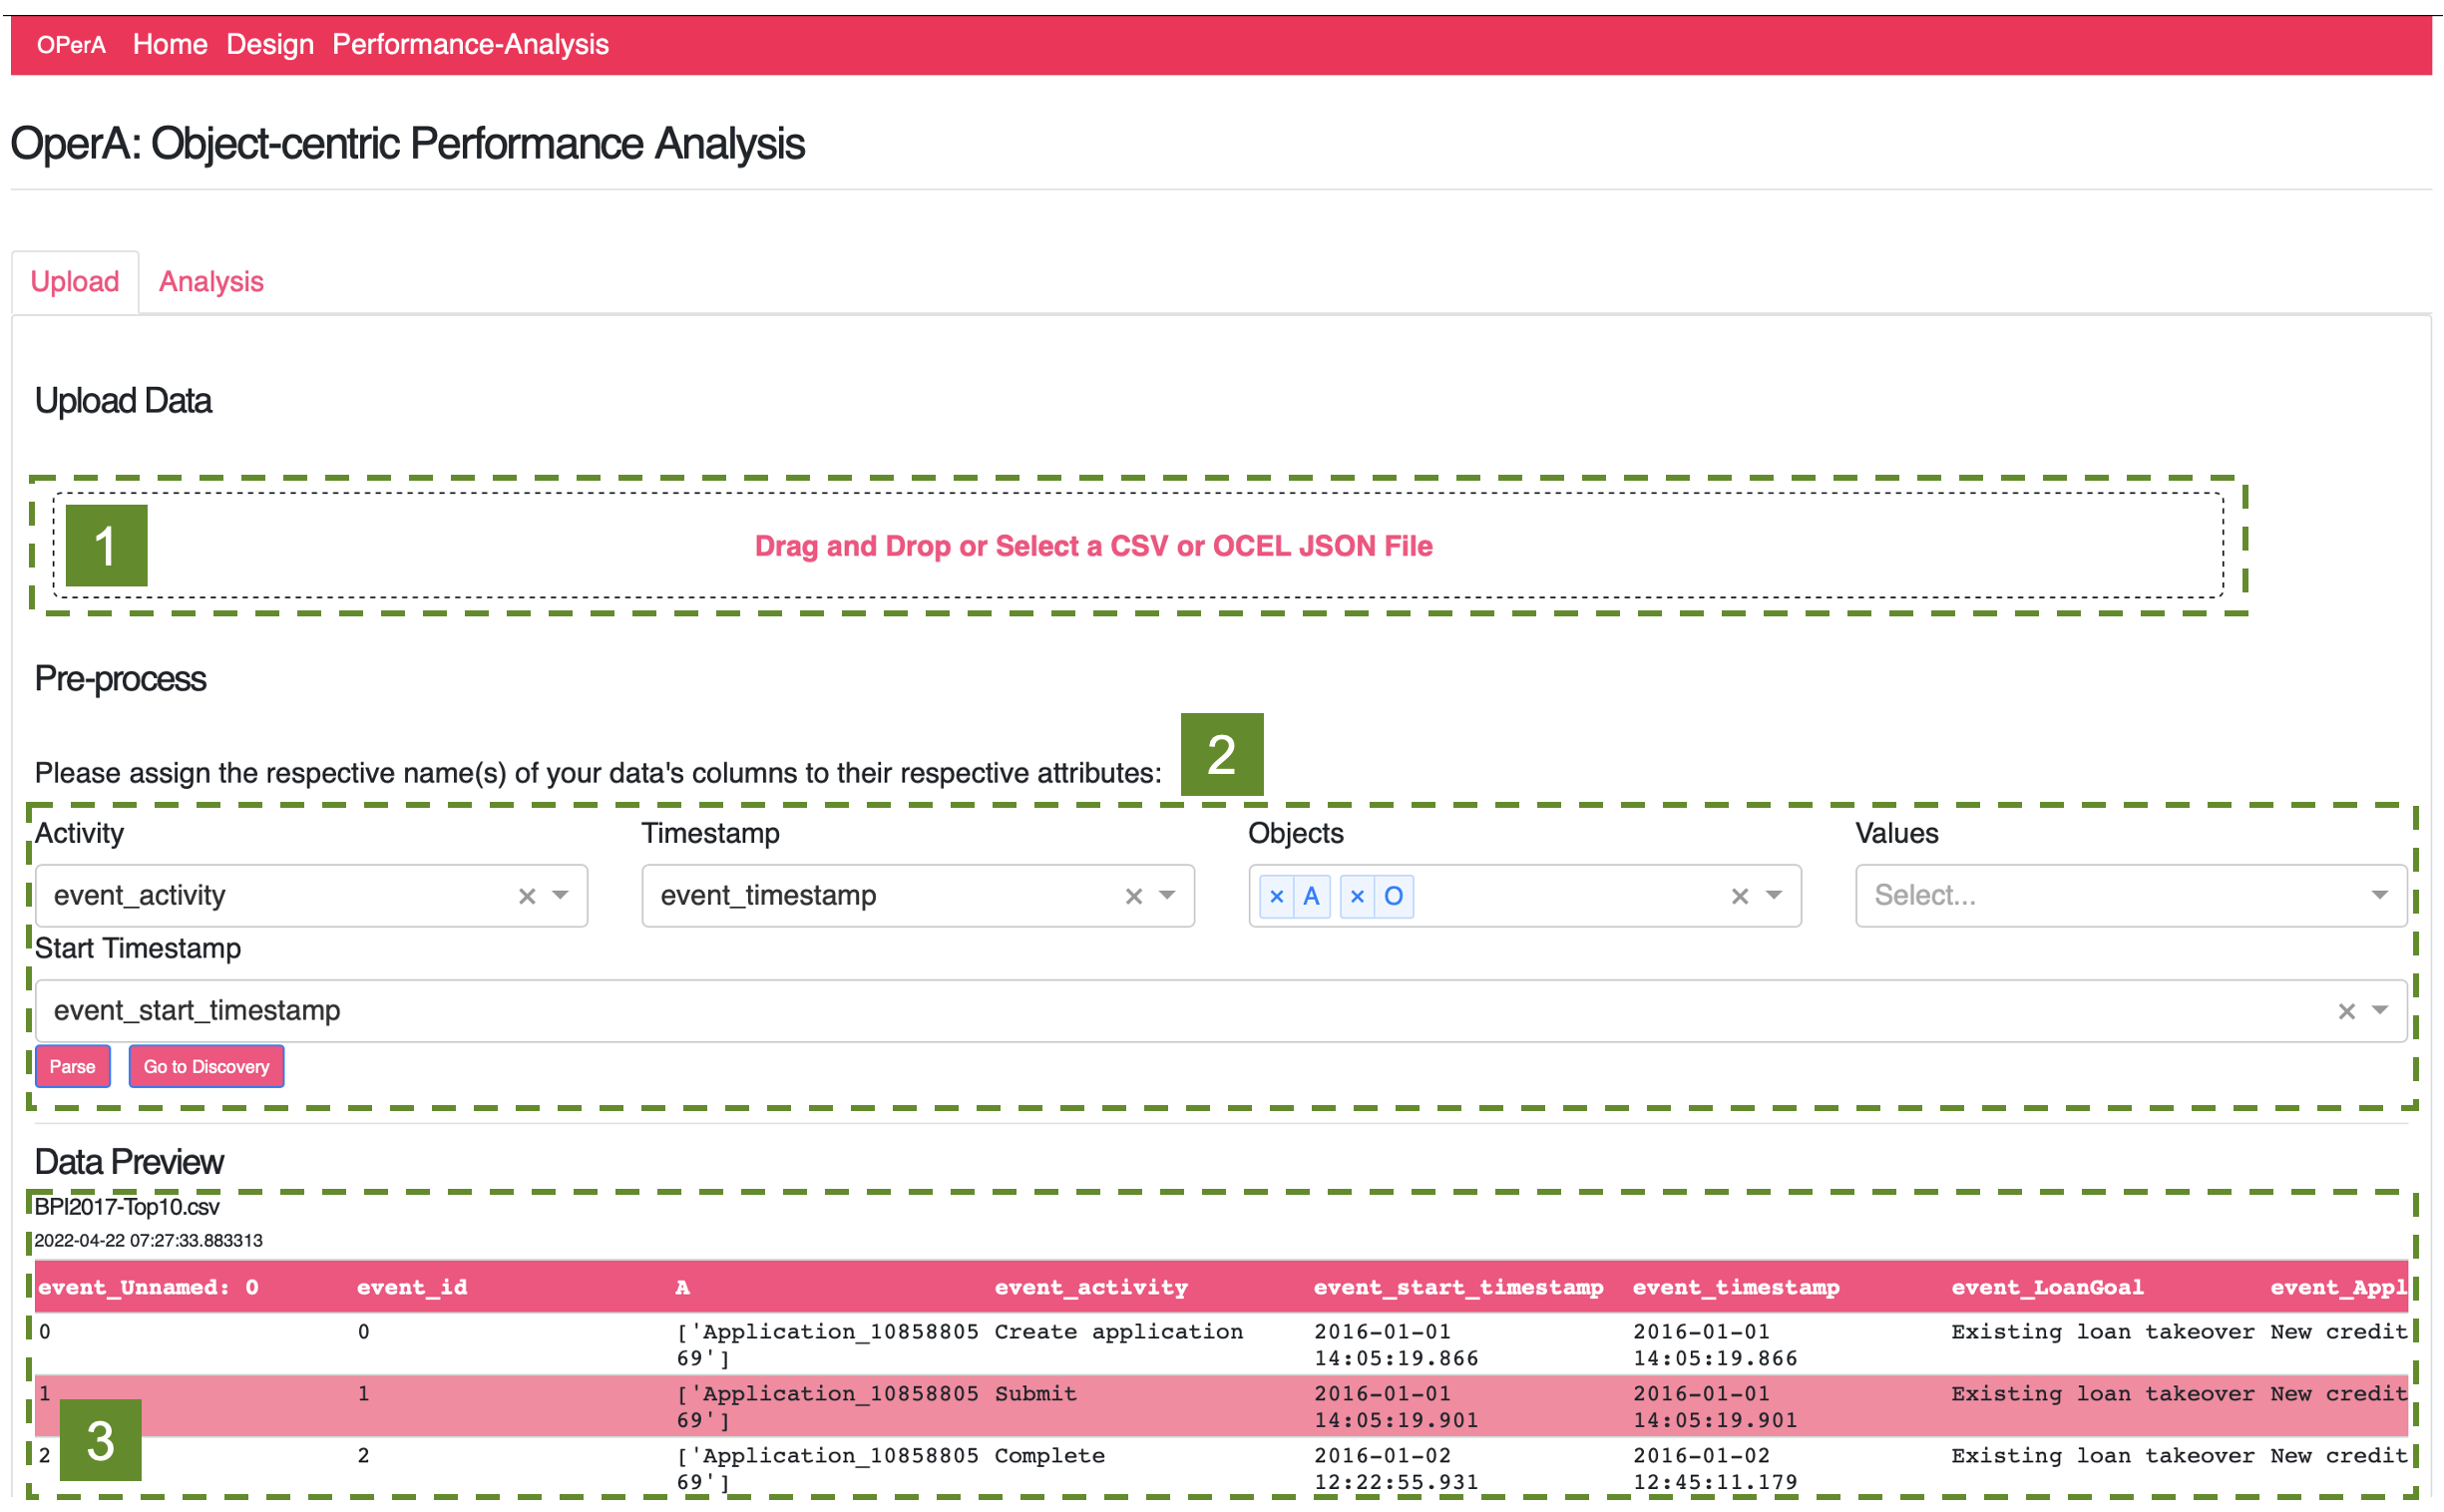
The approach discussed in Sec. 4 has been fully implemented as a web application222A demo video, sources, and manuals are available at https://github.com/gyunamister/OPerA with a dedicated user interface. We containerize it as a Docker container, structuring functional components into a coherent set of microservices. The following functions are supported:
-
•
Importing object-centric event logs in different formats including OCEL JSON, OCEL XML, and CSV.
- •
-
•
Replaying tokens with timestamps on OCPNs based on token-based replay approach suggested in [8].
-
•
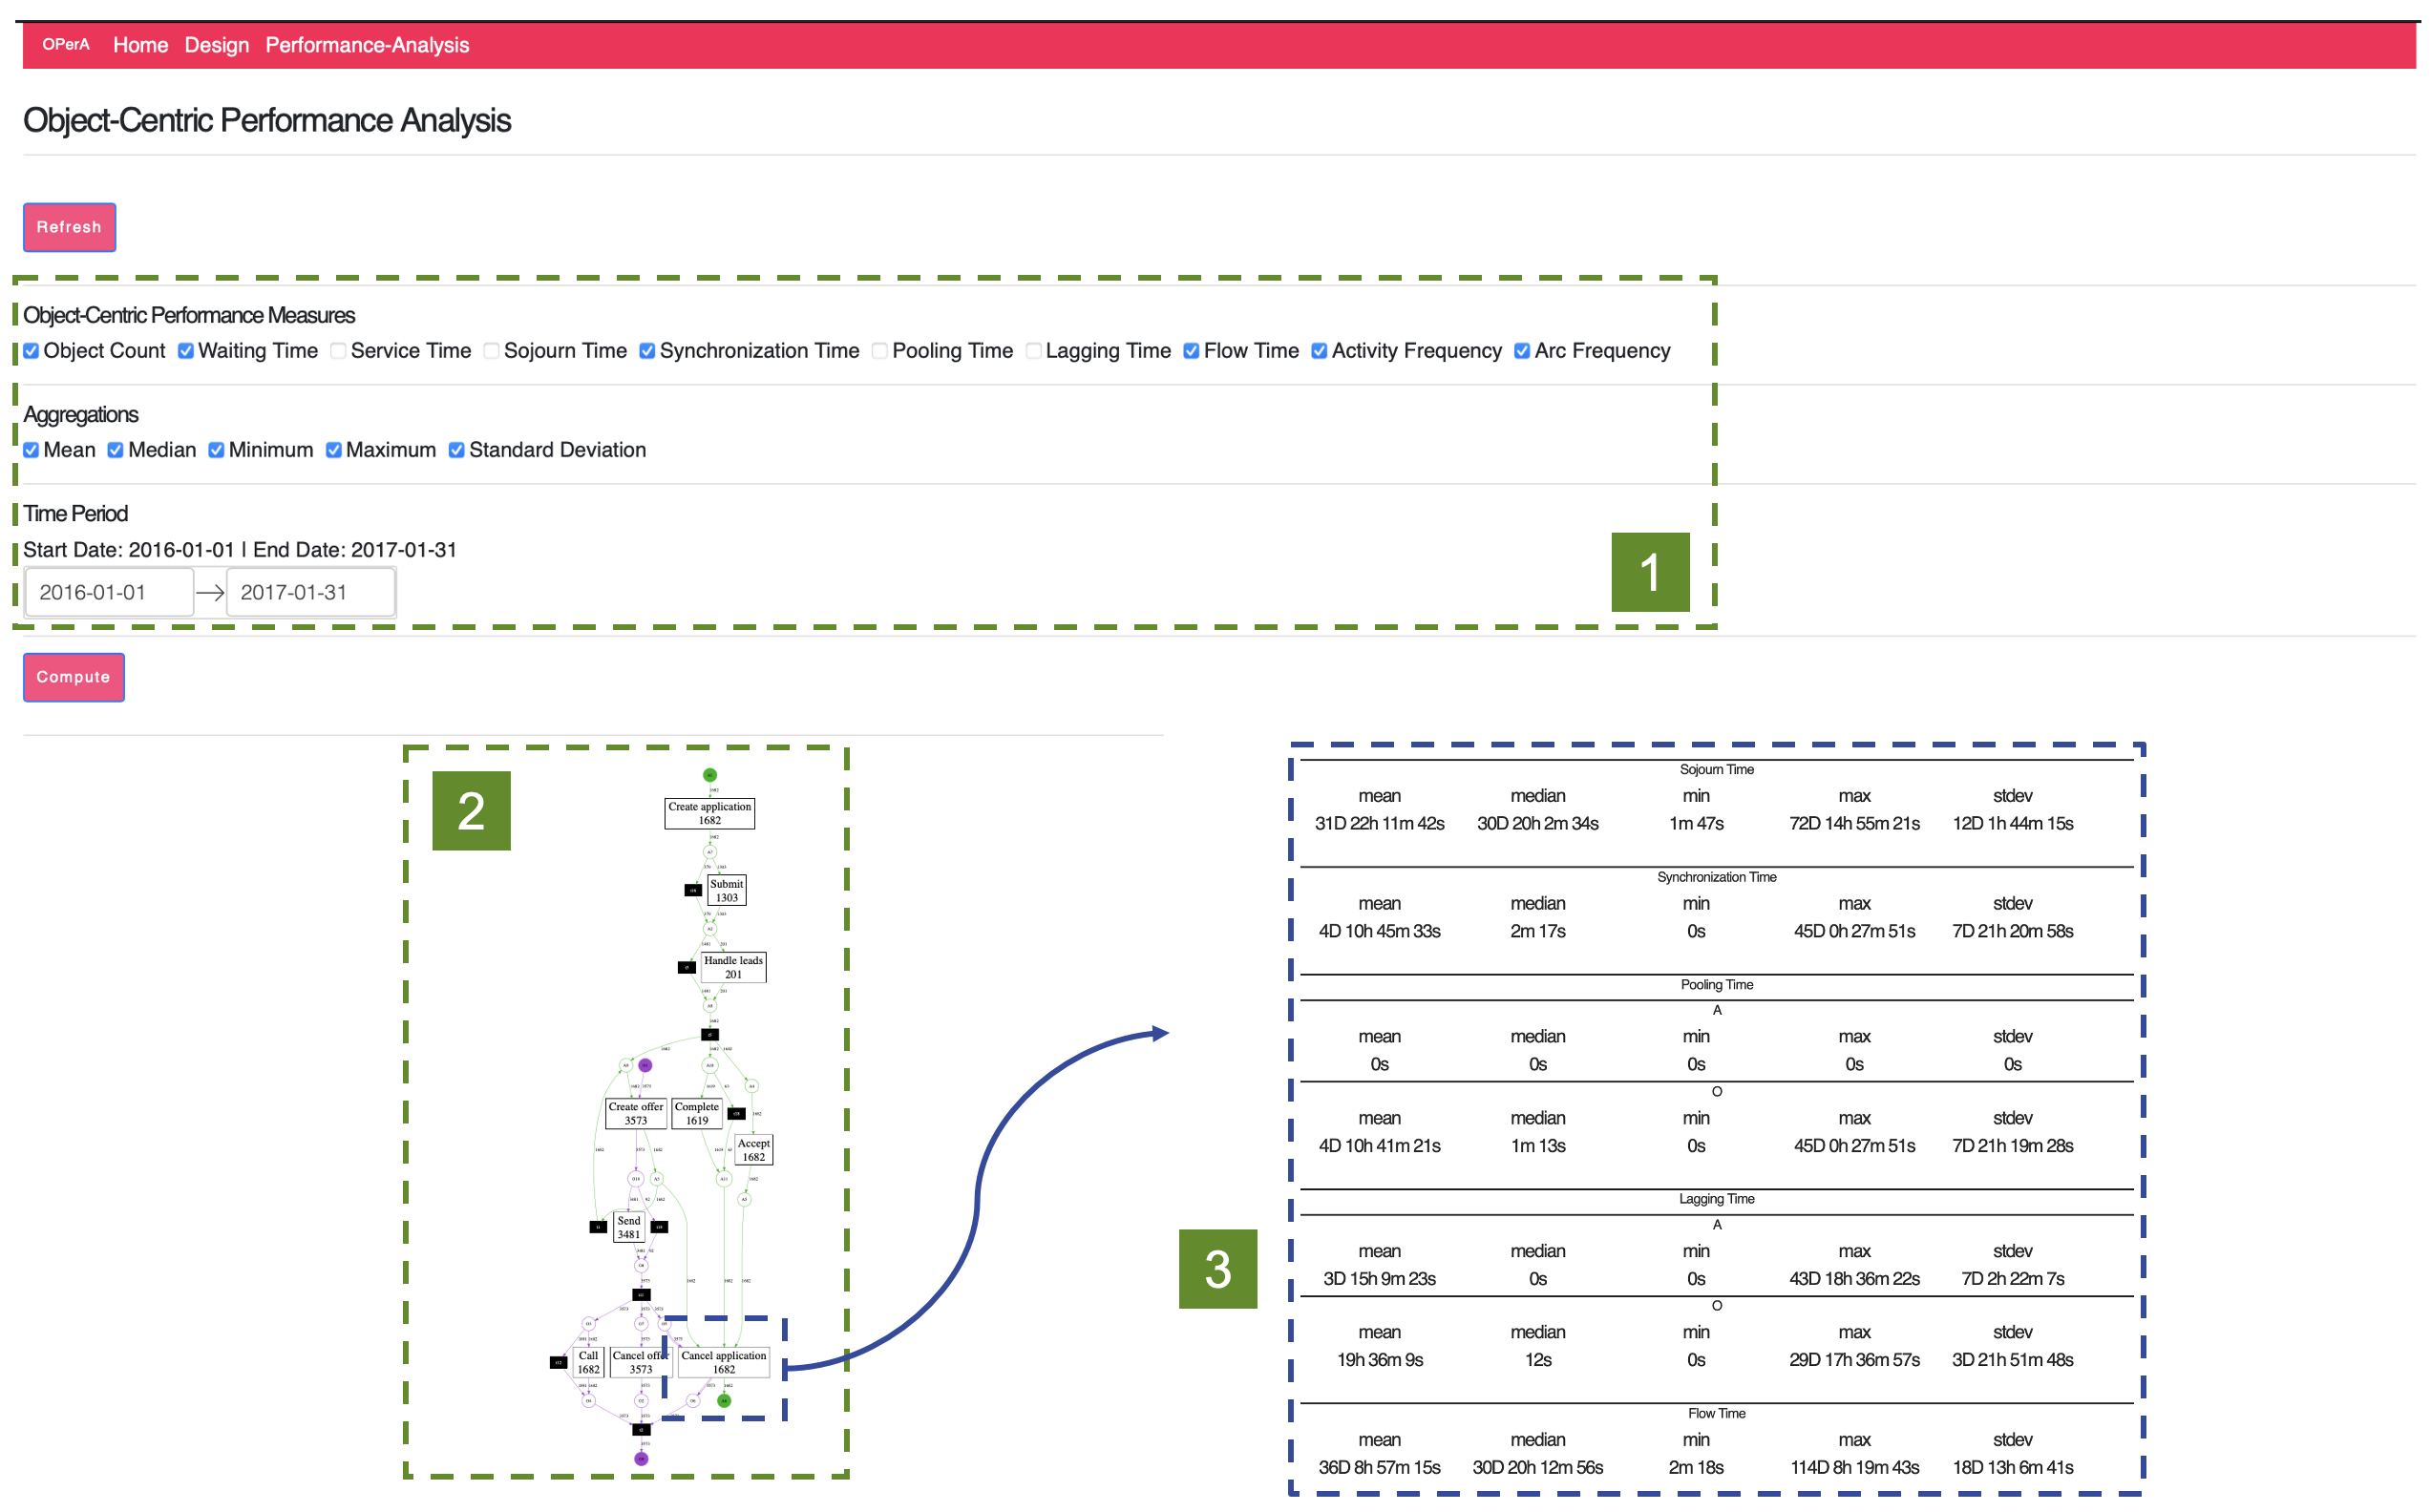
Computing object-centric performance measures based on the replay results, i.e., event occurrences and token visits.
-
•
Visualizing OCPNs with the object-centric performance measure.
5.2 Case Study: Loan Application Process
Using the implementation, we conduct a case study on a real-life loan application process of a Dutch Financial Institute333doi.org/10.4121/uuid:3926db30-f712-4394-aebc-75976070e91f. Two object types exist in the process: application and offer. An application can have one or more offers. First, a customer creates an application by visiting the bank or using an online system. In the former case, submit activity is skipped. After the completion and acceptance of the application, the bank offers loans to the customer by sending the offer to the customer and making a call. An offer is either accepted or canceled.
In this case study, we focus on the offers canceled due to various reasons. We filter infrequent behaviors by selecting the ten most frequent types of process executions. Moreover, we remove redundant activities, e.g., status updates such as Completed after Complete application. The resulting event log, available at the Github repository, contains events by applications and offers.
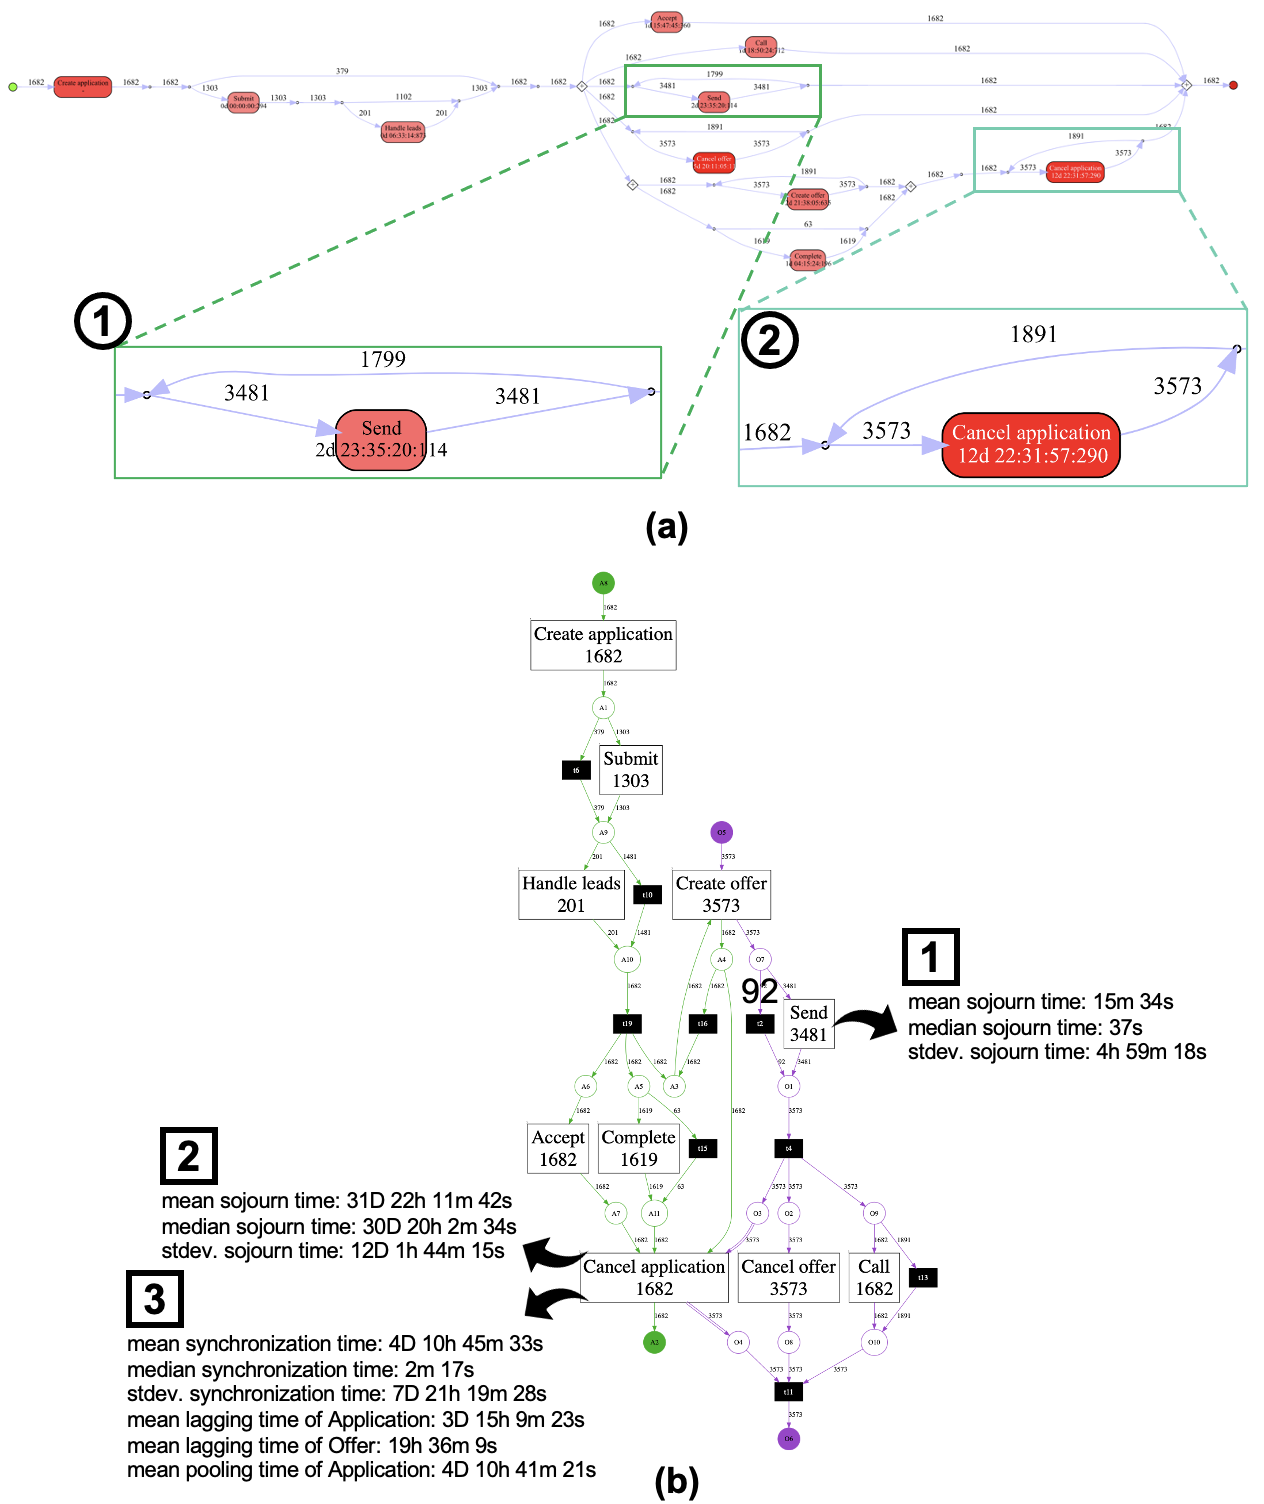
First, we compare our approach to a traditional technique for performance analysis based on alignments [5]. To apply the traditional technique, we first flatten the log using the application and offer as a case notion. Fig. 7(a) shows the performance analysis results from Inductive Visual Miner in ProM framework444https://www.promtools.org. As shown in \raisebox{-.9pt} {1}⃝, applications repeat activity Send. In reality, as shown in 1, no repetition occurs while the activity is conducted once for each offer except offers skipping it. Furthermore, the average sojourn time for the activity is computed as around days and hours, whereas, in reality, it is around minutes as shown in 1.
Furthermore, \raisebox{-.9pt} {2}⃝ shows that activity Cancel application is repeated times, but it occurs, in reality, times for each application, as depicted in 2. In addition, the average sojourn time for the activity is measured as around days and hours, but in fact, it is around days and hours, as shown in 2.
Next, we analyze the newly-introduced object-centric performance measures, including synchronization, lagging, and pooling time. As described in 3, the average synchronization time of activity Cancel application is around days and hours.
Moreover, the average lagging time of applications is days and hours and the lagging time of offers is hours, i.e., offers are more severely lagging applications. Furthermore, the pooling time of offers is almost the same as the synchronization time, indicating that the application is ready to be cancelled almost at the same time as the first offer, and the second offer is ready in around days and hours.
6 Conclusion
In this paper, we proposed an approach to object-centric performance analysis, supporting the correct computation of existing performance measures and the derivation of new performance measures considering the interaction between objects. To that end, we first replay OCELs on OCPNs to couple events to process models, producing event occurrences and token visits. Next, we measure object-centric performance metrics per event occurrence by using the corresponding token visits of the event occurrence. We have implemented the approach as a web application and conducted a case study using a real-life loan application process of a financial institute.
The proposed approach has several limitations. First, our approach relies on the quality of the discovered process model. Discovering process models that can be easily interpreted and comprehensively reflect the reality is a remaining challenge. Second, non-conforming behavior in event data w.r.t. a process model can lead to misleading insights. If Transfer samples is missing for a sample in an event log, although a process model describes that it always occurs for samples, the performance measure of Clear sample w.r.t. the sample will be computed based on the wrong timestamps from Conduct Test. In the implementation, we use process discovery techniques that guarantee the discovery of a perfectly-fitting process model and remove the issue of non-conforming behavior. As future work, we plan to extend the approach to support reliable performance analysis of non-conforming event logs. Moreover, we plan to develop an approach to object-centric performance analysis based on event data independently from process models. Another direction of future work is to define and compute more interesting performance metrics that consider the interaction between objects.
References
- [1] van der Aalst, W.M.P.: Process Mining - Data Science in Action, Second Edition. Springer (2016). https://doi.org/10.1007/978-3-662-49851-4, https://doi.org/10.1007/978-3-662-49851-4
- [2] van der Aalst, W.M.P., Berti, A.: Discovering object-centric petri nets. Fundam. Informaticae 175(1-4), 1–40 (2020). https://doi.org/10.3233/FI-2020-1946, https://doi.org/10.3233/FI-2020-1946
- [3] van der Aalst, W.M.P., Li, G., Montali, M.: Object-centric behavioral constraints. CoRR abs/1703.05740 (2017), http://arxiv.org/abs/1703.05740
- [4] Adams, J.N., van der Aalst, W.M.P.: Precision and fitness in object-centric process mining. In: Ciccio, C.D., Francescomarino, C.D., Soffer, P. (eds.) 3rd International Conference on Process Mining, ICPM 2021, Eindhoven, The Netherlands, October 31 - Nov. 4, 2021. pp. 128–135. IEEE (2021). https://doi.org/10.1109/ICPM53251.2021.9576886, https://doi.org/10.1109/ICPM53251.2021.9576886
- [5] Adriansyah, A.: Aligning observed and modeled behavior. Ph.D. thesis, Mathematics and Computer Science (2014). https://doi.org/10.6100/IR770080
- [6] Adriansyah, A., Dongen, van, B., Piessens, D., Wynn, M., Adams, M.: Robust performance analysis on YAWL process models with advanced constructs. Journal of Information Technology Theory and Application 12(3), 5–26 (2011)
- [7] Bayomie, D., Ciccio, C.D., Rosa, M.L., Mendling, J.: A probabilistic approach to event-case correlation for process mining. In: Laender, A.H.F., Pernici, B., Lim, E., de Oliveira, J.P.M. (eds.) Conceptual Modeling - 38th International Conference, ER 2019, Salvador, Brazil, November 4-7, 2019, Proceedings. Lecture Notes in Computer Science, vol. 11788, pp. 136–152. Springer (2019). https://doi.org/10.1007/978-3-030-33223-5_12, https://doi.org/10.1007/978-3-030-33223-5_12
- [8] Berti, A., van der Aalst, W.M.P.: A novel token-based replay technique to speed up conformance checking and process enhancement. Trans. Petri Nets Other Model. Concurr. 15, 1–26 (2021). https://doi.org/10.1007/978-3-662-63079-2_1, https://doi.org/10.1007/978-3-662-63079-2_1
- [9] Cohn, D., Hull, R.: Business artifacts: A data-centric approach to modeling business operations and processes. IEEE Data Eng. Bull. 32(3), 3–9 (2009), http://sites.computer.org/debull/A09sept/david.pdf
- [10] Denisov, V., Fahland, D., van der Aalst, W.M.P.: Unbiased, fine-grained description of processes performance from event data. In: Weske, M., Montali, M., Weber, I., vom Brocke, J. (eds.) Business Process Management - 16th International Conference, BPM 2018, Sydney, NSW, Australia, September 9-14, 2018, Proceedings. Lecture Notes in Computer Science, vol. 11080, pp. 139–157. Springer (2018). https://doi.org/10.1007/978-3-319-98648-7_9, https://doi.org/10.1007/978-3-319-98648-7_9
- [11] Esser, S., Fahland, D.: Multi-dimensional event data in graph databases. J. Data Semant. 10(1-2), 109–141 (2021). https://doi.org/10.1007/s13740-021-00122-1, https://doi.org/10.1007/s13740-021-00122-1
- [12] Fahland, D.: Describing behavior of processes with many-to-many interactions. In: PETRI NETS 2019. vol. 11522, pp. 3–24. Springer (2019), https://doi.org/10.1007/978-3-030-21571-2_1
- [13] Ghahfarokhi, A.F., Park, G., Berti, A., van der Aalst, W.M.P.: Ocel standard, http://ocel-standard.org/
- [14] Hornix, P.T.: Performance analysis of business processes through process mining. Master’s thesis, Mathematics and Computer Science (2007). https://doi.org/10.6100/IR770080
- [15] Leemans, S.J.J., Fahland, D., van der Aalst, W.M.P.: Scalable process discovery and conformance checking. Softw. Syst. Model. 17(2), 599–631 (2018). https://doi.org/10.1007/s10270-016-0545-x, https://doi.org/10.1007/s10270-016-0545-x
- [16] Leemans, S.J.J., Poppe, E., Wynn, M.T.: Directly follows-based process mining: Exploration & a case study. In: International Conference on Process Mining 2019. pp. 25–32. IEEE (2019). https://doi.org/10.1109/ICPM.2019.00015, https://doi.org/10.1109/ICPM.2019.00015
- [17] Maté, A., Trujillo, J., Mylopoulos, J.: Conceptualizing and specifying key performance indicators in business strategy models. In: Atzeni, P., Cheung, D.W., Ram, S. (eds.) Conceptual Modeling - 31st International Conference ER 2012, Florence, Italy, October 15-18, 2012. Proceedings. Lecture Notes in Computer Science, vol. 7532, pp. 282–291. Springer (2012). https://doi.org/10.1007/978-3-642-34002-4_22, https://doi.org/10.1007/978-3-642-34002-4_22
- [18] Montali, M., Rivkin, A.: Db-nets: On the marriage of colored Petri nets and relational databases. Trans. Petri Nets Other Model. Concurr. 12, 91–118 (2017). https://doi.org/10.1007/978-3-662-55862-1_5, https://doi.org/10.1007/978-3-662-55862-1_5
- [19] Rogge-Solti, A., Weske, M.: Prediction of remaining service execution time using stochastic petri nets with arbitrary firing delays. In: Basu, S., Pautasso, C., Zhang, L., Fu, X. (eds.) Service-Oriented Computing - 11th International Conference, ICSOC 2013, Berlin, Germany, December 2-5, 2013, Proceedings. Lecture Notes in Computer Science, vol. 8274, pp. 389–403. Springer (2013). https://doi.org/10.1007/978-3-642-45005-1_27, https://doi.org/10.1007/978-3-642-45005-1_27