disposition \setkomafontcaption \setkomafontcaptionlabel\usekomafontcaption
Exploring Artificial Intelligence as a General Purpose Technology with Patent Data
Abstract
Artificial Intelligence (AI) is often defined as the next general purpose technology (GPT) with profound economic and societal consequences. We examine how strongly four patent AI classification methods reproduce the GPT-like features of (1) intrinsic growth, (2) generality, and (3) innovation complementarities. Studying US patents from 1990-2019, we find that the four methods (keywords, scientific citations, WIPO, and USPTO approach) vary in classifying between 3-17% of all patents as AI. The keyword-based approach demonstrates the strongest intrinsic growth and generality despite identifying the smallest set of AI patents. The WIPO and science approaches generate each GPT characteristic less strikingly, whilst the USPTO set with the largest number of patents produces the weakest features. The lack of overlap and heterogeneity between all four approaches emphasises that the evaluation of AI innovation policies may be sensitive to the choice of classification method.
JEL Classifications: O31, O33, O34
Keywords: Patent, Artificial Intelligence, AI, Classification, General Purpose Technology, Innovation
Highlights
-
•
Compare four methods (keyword, science-citations, WIPO, USPTO approach) to identify AI patents.
-
•
The four methods differ by growth and scale (60k-600k patents), and overlap in only 1.36%.
-
•
All methods identify patents with GPT characteristics (growth, generality, complementarity).
-
•
Simple keyword-based method performs best to reproduce GPT characteristics.
-
•
Conclusions about the growth and impact of AI may be sensitive to choice of approach.
1 Introduction
Artificial intelligence (AI) is often defined as the next general purpose technology (GPT) that will shape the technological and economic evolution of the 21st century [3, 15, 12]. AI is expected to affect a wide range of industries through its ability to augment and complement extant products and processes [10, 14]. Researchers predict radical impacts on labor markets with winners and losers [45], and up to 47% of existing jobs in the US to become obsolete [19]. On the other hand, AI optimists portend that, as firms across various industries up-skill workers and adapt their business to utilise AI, rising productivity will drive the expansion of output, transform occupational task structures, and stimulate long-run employment [22, 1].
For researchers interested in studying the impact of AI, it is decisive to have a robust measure of AI diffusion [47, 48, 6]. However, as [41] emphasised, the ex-ante scientific measurement of radical novelty is one of the greatest challenges for scholars of technological change; with AI development and diffusion still at an early stage [12], it is not yet clear how it will impact various economic variables.
Patents provide a quantitative and forward-looking indicator of technological change and innovation. Detailed classification systems that associate patents with technological fields provide insights into the qualitative dimension of technological change [25]. However, as technological developments in AI become increasingly embedded throughout multiple sectors of the economy, existing classification schemes may be unfit to capture sophisticated technology networks linked by fundamental principles and mutual dependencies [23, 39].
In this paper, we make a systematic comparison of four classification approaches to identify AI inventions in patent data. Specifically, we compare methods based on (1) keywords, (2) scientific citations, (3) the World Intellectual Property Organization (WIPO) classification method, and (4) the United States Patent and Trademark Office (USPTO) approach. The keyword-based approach identifies AI patents by searching for AI-related terms in patent texts, while science citations capture patents through citation links to AI research. The WIPO approach classifies AI patents using CPC and IPC codes, keywords, and application fields of patents, whereas the USPTO approach utilises machine learning techniques.
For each of the four classification approaches, we collect AI patents granted by the USPTO between 1990 and 2019. In total, we identify 735,565 AI patents, yet the approaches differs strikingly by scale: 67,187 patents are captured by keywords, 178,004 by science citations, 158,652 by the WIPO, and 595,047 by the USPTO approach. Together, all four approaches agree on only 1.36% of AI patents and the pairwise overlap accounts for around or less than 20% throughout the entire period. In addition to varying by scale, the four methods also suggest disparate trends of AI inventions over time. Whilst growth in AI patents captured by the science and USPTO approaches slowed down in recent years, we observe growth in keyword and WIPO AI patents to accelerate.
Given the heterogeneity of the approaches and the lack of a clear definition of AI [31], we do not aim to judge which method performs best in identifying AI inventions. Instead, we ask to what extent each classification approach generates canonical GPT characteristics in patented AI technologies, as these are the economic properties many researchers are interested in.
-
1.
GPTs are engines of growth that have a wide scope for technical improvement, as seen in the historical GPTs of electricity and computing [39]. For each of our four classification approaches, we measure this feature by calculating the growth rates of each pool of patents, as well as the growth rates of patents that rely on AI inventions (as indicated by citation links). GPTs are expected to show positive or even accelerating growth rates over time.
-
2.
GPTs are characterised by their potential uses across a wide range of products and processes. To capture this feature, we examine the technological diversity of patent citations. Historically, GPTs such as electricity experienced delays of up to forty-two years before becoming more widely utilised and disseminating throughout the economy [16]. Following [23], we capture this feature by measuring the citation lag between AI and its subsequent inventions.
-
3.
GPTs strongly complement extant and novel technologies [39], as exemplified by electricity’s ability to transform and improve myriad production processes. We evaluate this feature by studying the diversity of co-classification of AI patents across different technology groups. A high diversity of co-classifications suggests that AI complements technological opportunities in a wide range of fields.
In our comparison, all four classification approaches show that AI patenting is rising continuously over time, as captured by patent counts and share of AI patents. Moreover, each approach consistently demonstrates a slow-down in AI patenting from 1990 to the early 2000s (a so-called ‘AI Winter’) followed by a period of increased patenting beginning in 2010 [43, 29].
Ultimately, each of the four patent groups reproduces key GPT characteristics —but to different extents. Despite capturing the smallest number of patents, the keyword sample shows the highest average growth rate in the post 2010s and most strikingly demonstrates AI’s wide-ranging usefulness across several technology fields. Patents identified by the USPTO approach most strongly show the feature of innovation complementarity from 1990-2010, while the other three approaches show more heterogeneous trends. However, when accounting for the differences in patent counts, innovation complementarity is most clearly demonstrated in the WIPO patents, closely followed by science and keywords.
To validate our measures, we evaluate the same three GPT characteristics for other technologies that were proposed as GPT candidates in the post-1990s and find similar trends to those seen in AI patents. All of them outperform an average US patent which confirms their GPT nature.
The results of our study indicate that the simple keyword approach generates key GPT-features most strikingly. The other approaches are conceptually and computationally more complex: the USPTO approach relies on sophisticated machine learning (ML) methods, the science approach leverages additional data sources, and the WIPO method relies on the symbolic combination of technology codes and keywords.
However, [8, 29, 27, 49] contend that AI research is being rapidly privatised and narrowed towards deep learning (DL) at the expense of other relatively unexplored domains. This narrowing may explain why a method based on human-selected keywords that are related to DL produces the characteristics so strikingly as the rise in patents may reflect the most recent trends in applied AI research and technology. But it remains open to which extent this method will be able to cover the full scope of future AI inventions in fields that are, at present, relatively unexplored but represent relevant subfields of AI.
Our results have important implications for innovation policy and research, as they demonstrate how the choice of AI classification approach can impact the outcome of economic and innovation policy analyses that track inventions through the economy. As an example, in 2021 the UK government launched a package of economic, policy, and regulatory reforms, dubbed the National Artificial Intelligence Strategy, to make the UK a ‘global AI superpower’ and plan for the long-term needs of AI technologies [7]. Given that some classification methods suggest that AI inventions are plateauing (science and USPTO), while others show that it is increasingly taking off (keywords and WIPO), we recommend using multiple techniques to counteract the dependence of policy conclusions on the choice of the method.
The rest of this paper is structured as follows: Section 2 describes previous attempts to measure GPTs in patent data while Section 3 motivates the GPT measures we use to compare our classification methods. Section 4 provides details on our data and methods, while Section 5 describes our four AI classification approaches. We present our results in Section 6 and discuss the implications of our findings in Section 7. Section 8 concludes.
2 Literature Review
In this section, we summarise the characteristics of a GPT and how they have been studied in the literature. Then, we review the evidence claiming AI to be a GPT.
2.1 What is a GPT?
[9] introduce the concept of a GPT as a technology which pervades the economy and spurs innovation, both endogenously and through complementarities. Well-established GPTs, such as electricity and ICT, drive economic growth and, thus, much research has focused on their early identification. In general, GPTs are said to share three characteristics: pervasiveness throughout the economy, capacity for rapid intrinsic improvement, and the ability to spawn spillover productivity across sectors though complementarities [9, 32].
The first of these criteria refers to GPTs’ ability to engender new methods of production or innovation throughout the economy. Due to their pervasiveness, GPTs inspire a wave of technological innovation, as they open the gateway to new methods of production and invention. Many impactful technologies, such as nuclear power and fMRI, lack the generality required to pervade a significant number of sectors [4, 11].
The second criterion refers to GPTs’ inherent capacity to evolve through a series of rapid endogenous improvements. In contrast, the final criteria captures how GPTs spawn spillover gains in productivity across a range of industries through their ability to augment and complement extant products and processes. Many GPTs act as agents of creative destruction by restructuring established processes throughout the economy [32].
Altogether, these criteria necessitate a longer time period for GPTs to evolve, spread and establish their full impact [32]. Once they have iterated to their most impactful permutation, GPTs then rely on supporting infrastructure and secondary inventions to restructure production processes throughout the economy.
2.2 AI as a GPT
Our study focuses on the range of technical advances most recently dominated by deep neural networks and, more generally, machine learning. These technologies, are rooted in decades of research and inventions on making machines solve complex human-like and other tasks by automation. We will loosely refer to these technologies as AI, since AI includes much more than the techniques from the last few years [29]. As we will see, there are several different ways to make the concept of AI more specific used in the literature. Although still under debate, many economists already model AI as a GPT for improved prediction and pattern recognition across a range of complex and non-linear contexts [4, 17]. Previous discussion of AI as a GPT have used patent data [14] and firm-level non-patent data [28], which we detail below.
Given its non-specific field of application, AI can be viewed is viewed as powerful technologies for the latest step in the automation process and a novel mechanism for hypothesis formation and data mining [2]. Indeed, some economists model AI as a ‘general purpose meta-technology’ [40, 4] that has the capacity to revolutionise the process of discovery and invention, much like the patent.
However, the development of modern AI has been characterised by alternating periods of optimism and subsequent ‘AI winters’. The roots of modern AI stem back to the 1950s, when a series of inventions later led to breakthroughs in the ability of computers to perform reasoning and solve complex problems [43]. High expectations coupled with limited computing power and funding withdrawal saw a slowdown in AI innovation during both the late 1970s and again in the 1990s, forming periods now referred to as ‘AI winters’ [43].
3 Measuring GPTs
Currently, there exists a number of alternative metrics to capture GPT characteristics. Given the lack of consensus, many believe GPTs should be better identified as sophisticated networks of technologies sharing ‘underlying principles and mutual dependencies’ [39].
Historically, patent growth rates have been used to capture the endogenous elaboration of technologies similar to GPTs [37, 26, 39]. [39] uses patent growth rates, co-classifications, and a text-mining algorithm to successfully reproduce the canonical GPTs contained within the broad USPTO categories of electricity and computer communication. However, the author finds great heterogeneity within these pools of innovations, which contain both dynamic and stagnant innovations. Moreover, the author notes that the identification of more diffuse and diverse GPTs, such as AI, may require ‘bottom-up’ classification approaches using lower levels of aggregation that can scan multiple technological classes for common principles.
[23] attempt to capture GPTs by measuring the patent growth rates and unbiased generality measures for the most-cited US patents and the patents which cite them. The authors also find great heterogeneity between patents, which underscores the need for multiple metrics to satisfactorily capture GPTs.
In the next section, we motivate our selection of patent measures for GPT characteristics and connect each with empirical facts about AI’s dissemination and the three canonical GPT features.
3.1 Growth
For more than a decade, AI methods have become more powerful and complex as a result of new technical methods, increased data availability, and improved hardware. Consequently, AI innovation has shifted away from specific application-based methods to more generalised learning-orientated systems [15]. With this refinement, the performance of many sub-fields of AI, such as image and text recognition, have seen remarkable improvements in performance [12]. This is reflected in the exponential growth of patenting activity referencing terms such as machine learning and deep learning (see Supplementary Information, Figure 10).
Based on these observations, we measure improvements in AI via the growth rates of each group of patents and changes to their share of all patents, from 1990 to 2020 [23, 39]. We also look at the growth of the patents that cite such technologies: the ‘GPT hypothesis’ in previous work has been that inventions that build on GPT-like technologies should spawn more new inventions [23].
Let denote the number of patents in a group at time , indexed by year. We compute the growth rate as
| (1) |
3.2 Generality
AI has already begun to pervade a myriad of industries as it expands beyond computer science into such diverse fields as structural biology, transport, and imaging [15]. In the early 1990s, AI methods remained largely confined to computer science. However, over the past decade, the majority of patents referencing these technologies have appeared in secondary domains [15]. Based on the work of [46], we capture this stylised fact through the ‘generality’ of patents, measuring the dissemination of AI across different technology fields.
To do so, we build on patent citation data and assume that a forward citation link entails information about the use of a patent in a subsequent innovation [25]. To operationalise wide usefulness, we rely on a modified version of the generality metric by [46] and [23] given by
| (2) |
where is the sum of citations to patents labelled as AI by classification approach from technology class , whereby we use the CPC one- section level as class. The number of citations excludes citations within the same class: is the number of patents in approach and is the number of different CPC classes. Our approach differs to that of [46] as we apply the method to each group of AI patents belonging to a variety of CPC sections. For the main analysis, we focus on one- CPC sections, as these are more technologically distant than three- or four- classes and subclasses, whose results we also report.
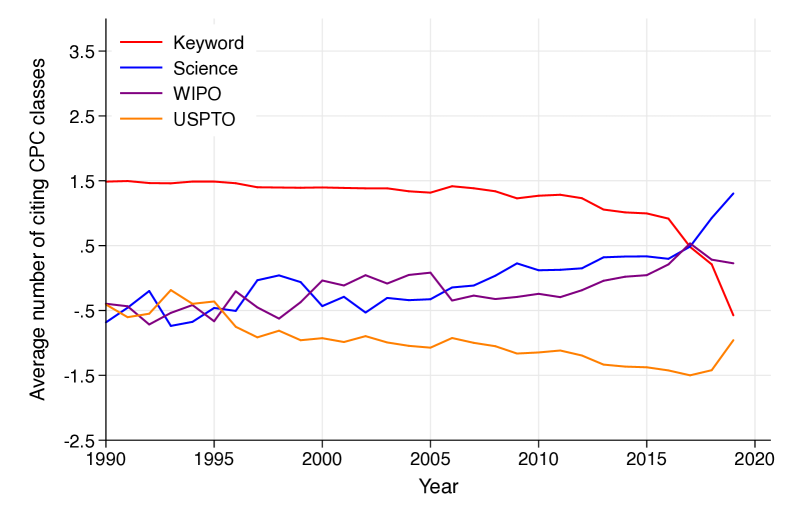
Our generality measure is calculated for the entire group of patents in with unique patents. To address concerns that this metric may be affected by differences in the group size, we additionally calculate patent-level metrics given by the average number of citing classes, i.e.
| (3) |
where if patent in is cited by at least one patent in technology class out of the total number of classes at level with s in the code. Again, we exclude within-class citations and present results at both the one- CPC section level () and higher orders of disaggregation ( or ).
3.3 Complementarity
Thirdly, GPTs augment existing products and processes in a range of novel contexts to generate productive complementarities throughout the economy [9, 39]. AI technologies have been shown to complement and rely on secondary innovations, such as cloud computing and big data, which increase access to larger and more affordable data-sets [11]. Furthermore, because diverse AI systems share similar underlying structures and can share information, advances in one application of ML, such as machine vision, can spur innovations in other fields, such as autonomous vehicles.
Following the approach of [39], we measure the extent to which AI patents enhance and supplement other innovations through the diversity of their technology class co-occurrences. For our analysis, we calculate the share of three- and four- CPC codes () assigned to the patents in each group of AI patents. Specifically, we calculate the following diversity measure over time is
| (4) |
where denotes each of the four patent classification approaches, is the classification level and is year. refers to the number of CPC codes found in use for a particular group of patents, where the codes include digits. Note that there are 136 and 674 CPC codes, respectively at the three- and four-digit level (according to the February 2022 version of CPC codes).
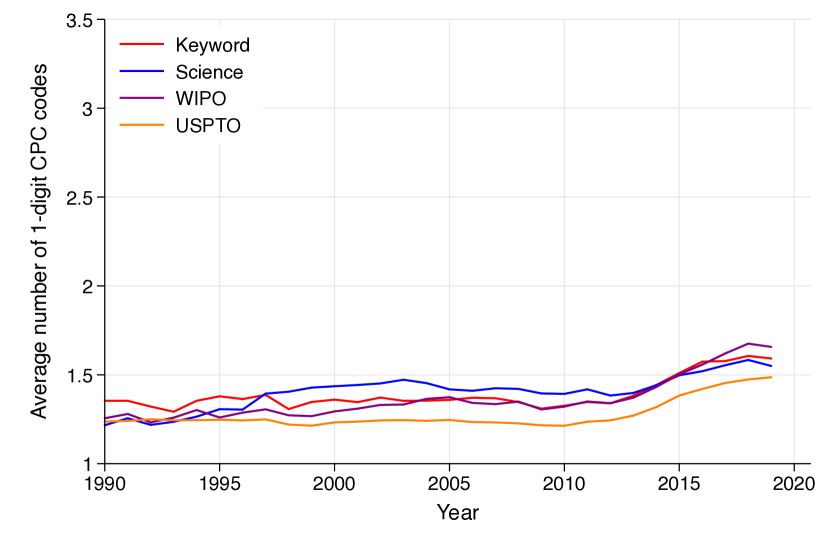
As the above measure could be biased by patent volume, we also calculate the average number of distinct one-, three-, and four-digit CPC codes per patent per year. The diversity per patent over time is
| (5) |
where represent the technology class represented by one-, three-, or four-digit CPC codes. The time series graphs for the latter measures depict how an average patent’s complementarity across technology sections evolves over time.
4 Data
We apply our methods to all patents granted by the USPTO from 1990-2019. For the analysis, we create four groups of AI patents for each classification method and complement each with supplementary information.
From PATSTAT (Spring 2021 edition, [18]) we sourced patent grant dates and from the USPTO we downloaded the Master classification file (April 2021 version) which contains CPC classifications of patents.111https://bulkdata.uspto.gov/data/patent/classification/cpc/ We added further data on patent-to-patent citations and patent titles from GooglePats obtained in an earlier project [24]. For our analysis, we supplemented the citation data with citation year and the technology classes of both the citing and cited patent. In doing so, we obtained networks which represent citations from technology fields at different levels of aggregation to our four sets of AI patents. We also made use of the Reliance on Science database [34] for citation data between patents and science.
5 Measuring AI
In our analysis, we compare four methodologically and conceptually distinct approaches to identifying AI innovation in patents based on (1) keyword search, (2) science citations, (3) the WIPO, and the (4) USPTO method. Here, we introduce these classification approaches in detail.
5.1 Keyword Search
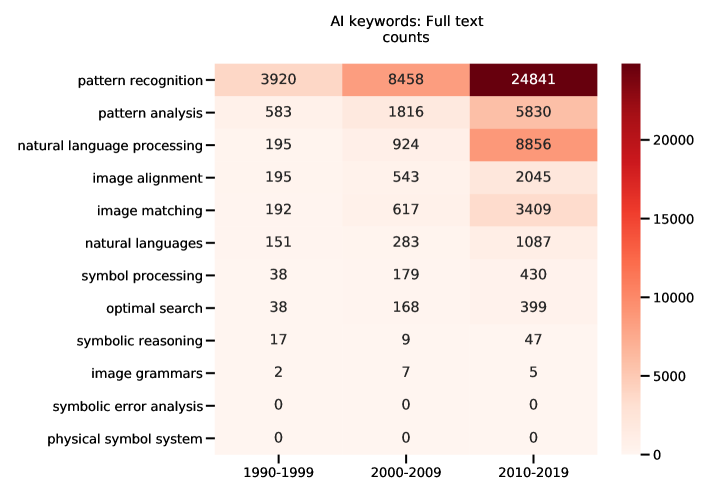
Our first classification technique is a straight-forward approach based on keyword search, in which researchers use their discretion to develop a set of terms that reflect the most recent developments in AI. In this paper, we use the set of keywords provided in the appendix of [14].222While we use the keywords from [14], we do not fully replicate their approach. They use two subsets of patents: (1) patents classified by the USPC code 706 (Artificial Intelligence) and 901 (Robots); and (2) patents identified by searching titles for the selected keywords. Here we use patents identified by keyword search only, but we extend our search to match keywords also from abstract, claims, and description. We do not use the USPC classification codes since the WIPO method takes a more comprehensive approach combining keywords with IPC or CPC classifications. Also, with our extensive keyword search, we miss only a few patents which are in the first group (i.e., USPC 706 and 901) but not in the second group of [14]. The keywords used in this paper focus on three sub-fields of AI: symbolic systems, learning algorithms, and robotics (see Table 9 for the full list of keywords). According to the authors, the symbolic systems represent ‘complex concepts through logical manipulation of symbolic representations’ and include ‘natural language processing’ and ‘pattern recognition’. Learning algorithms include core analytic techniques such as neural networks, deep learning, and machine learning. The last category, robotics, is related to automation or applications of AI (e.g. computer vision and sensory networks).
We search for these keywords in patent titles, abstracts, claims, and descriptions using USPTO data. We match the resulting list with patents granted by the USPTO between 1990 and 2019. The main advantage of the keyword approach is its simplicity and ease of implementation. Moreover, carefully chosen keywords can capture recent changes in the AI field. However, the success of this approach depends on the judgement and familiarity of the researcher to the field of AI. Missing important keywords could lead to under-representation of a sub-field. Our approach yields 67,187 patents.
5.2 Science Citations
This classification approach harnesses the scientific basis of patents. In particular, we classify a patent as an AI patent if it makes at least one citation to a scientific paper in the scientific field of ‘Computer Science; Artificial Intelligence’ (short, AI paper) as categorised by the Web of Science (WoS). Scientific citations are added to patent documents for multiple reasons such as describing the technological content of the invention or distinguishing the legal claim from other publicly available knowledge [38, 36, 44, 5, 33, see ]. A citation link to an AI paper indicates that the patent is technologically related to AI because it builds on scientific advancements in this field. A limitation of this approach is that it only identifies AI patents within the subset of patents that make citations to science.
For this method, we use data from the Reliance on Science (RoS) database [33, 34, 35] which comprises a mapping from patents to scientific articles indexed in Microsoft Academic Graph (MAG) [42]. Scientific articles are tagged by the WoS fields indicating the field of science into which an article is grouped.333Note that this assignment was made at the paper level using a probabilistic mapping which is different from the journal-based categorization of Clarivate Analytics (Web of Science).
The citation links in the RoS database cover citations made by both the patent applicant and examiner, as well as citations indicated at both the front page and body of the patent document. [33] identified citations through a sequential probabilistic text recognition technique. Each citation link is tagged with a confidence score indicating the reliability of the matching approach. In the RoS data, roughly one third (34%) of all US patents granted in 2019 can be attributed with at least one citation to science.
In our study, we identified AI papers by their WoS categories and extracted all patents with at least one citation link to an AI paper. We kept only citation links with a reliability score greater than three, which corresponds to a precision rate of 99.5% and a recall of 93%. This approach yields 178,004 AI patents.
5.3 World Intellectual Property Organization (WIPO) Method
The WIPO methodology for classifying AI patents was published in 2019 and validated by a team of patent experts [50, 51]. The aim behind the methodology is to capture three aspects of AI innovation: (1) core AI techniques (deep learning, other learning methods, various type of logic, clustering, etc.); (2) functional applications of AI that can be used to simulate human-like cognitive capacities (such as vision, language, or decision-making); and (3) end-user application fields (such as automation in business, health, or military).
This methodology is based on both a keyword search of patent texts and the use of patent classification codes (CPC and IPC). In this technique, some patents are classified based on only a subset of the technological codes, or keywords, whilst others are identified by a combination of both.
The list of keywords used in this approach covers core AI methods as well as computing and mathematical concepts used in such technologies. These keywords are matched to the text in the patent titles, abstracts, and claims.
This approach identifies 158,652 patents.
5.4 United States Patent and Trademark Office (USPTO) Classification
The USPTO approach uses a supervised machine learning (ML) classifier to identify AI patents [20, see ]. This ML model is trained to classify eight components of AI technologies, namely: machine learning, evolutionary computation, natural language processing, speech, vision, knowledge processing, planning/control, and AI hardware. The ML model is trained on the abstracts and claims of a seed (positive set) and an anti-seed (negative set). The seeds are chosen carefully for each respective component by taking an intersection of CPC, IPC, and USPC codes, as well as Derwent’s World Patents IndexTM. The seeds are expanded based on patent families, CPC codes, and citations to identify all patents linked to the seed set. The anti-seed set is selected randomly from all remaining patents. For training, each text is pre-processed and embedded via the Word2Vec algorithm. The ML models also encode backward and forward citations in a citation vector. The predictions from the ML model are further validated using a small subset of patents that are manually examined.
Published in August 2021, the resulting dataset contains 13.2 million USPTO patents and pre-grant publications issued or published between 1976 and 2020. For consistency with our other approaches, we only consider patents granted between 1990 and 2019 and exclude pre-grant publications. The remaining data yields 595,047 patents.
6 Results
In this section, we report our findings that show to which extent each patent classification approach generates GPT characteristics for AI inventions. We begin by investigating the volume of patents identified by each of the four classification methods and how these evolve over time. We then examine a number of metrics related to the markers of GPTs, namely: growth, generality, and complementarity.
6.1 Volume and Time Trends
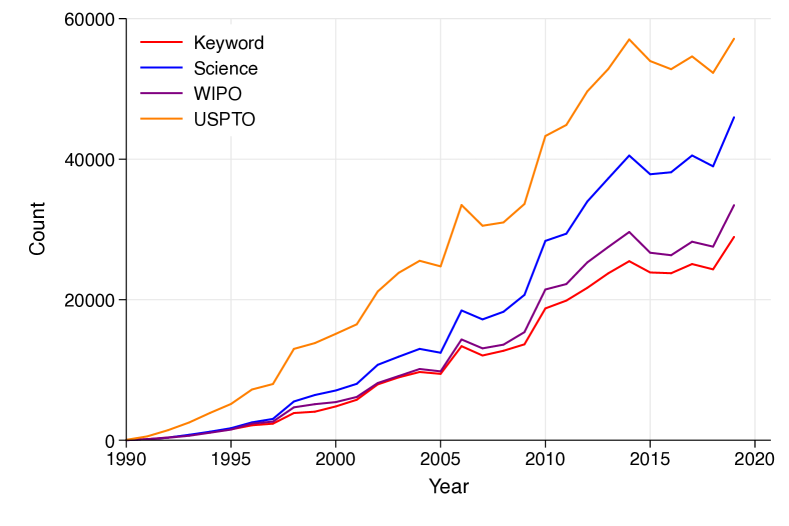
Table 1 shows the number of patents identified by each of the four approaches. Summing across all four classification methods, we identify a total of 735,565 patents as AI. Notably, the four methods differ substantially by volume. The science and WIPO approaches both identify 178,004 and 158,652 patents respectively, whilst the keyword-based pool is much smaller with only 67,187 patents. The USPTO approach, in contrast, is vast in scope and identifies 595,047 AI patents.
| Keyword | Science | WIPO | USPTO | |
| No. of patents | 67,187 | 178,004 | 158,652 | 595,047 |
-
•
Notes: The table reports the number of unique utility patents granted by the USPTO in 1990-2019.
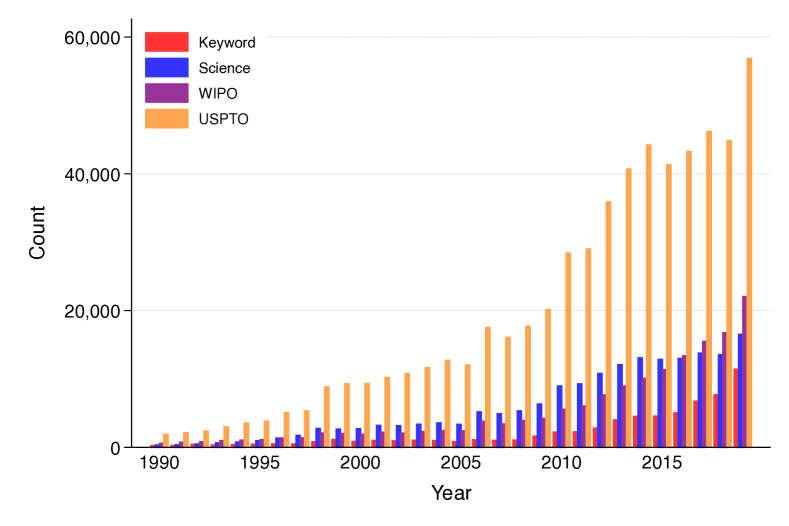
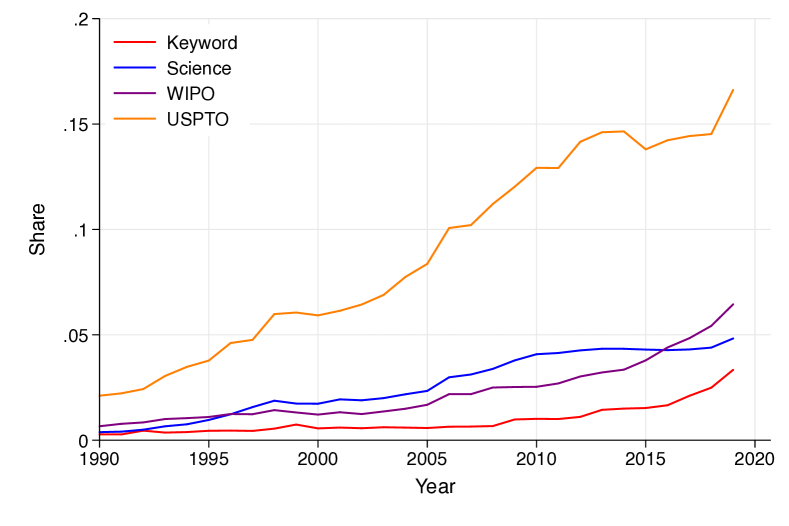
Figure 1 shows the pace of AI innovation as suggested by each of the four approaches. Figure 1(a) plots the raw count of patents, which again shows the the extent to which the volume of USPTO patents dominates. Represented as a share of all granted patents in the US, the USPTO approach identifies roughly 16.6% of all patents as AI in 2019 (Figure 1(b)). For all approaches, we find that this share increased over time from 1-2% in the 1990s to 3-17% in 2019.
To quantify the overlaps and differences between each pair of approaches, we compute Jaccard similarities and illustrate their evolution over time.444The Jaccard similarity for two sets of patents is given by with where if both sets do not overlap and if both sets are identical. In other terms, the overlap between the sets can range from 0% to 100%. In Figure 2, we plot the evolution of the Jaccard similarity for pairwise comparisons of different methods. All approaches show a relatively low pairwise overlap ranging at or below 20%. The WIPO approach shows the highest agreement with each of the other approaches. The WIPO-keyword pair and the science-USPTO pair experienced the most pronounced increase in similarity over the period of study. The keyword approach demonstrates the lowest Jaccard similarity to the other classification approaches.
Looking across all patents, we find that only 10,859 or 1.36% of all unique granted patents are uniformly identified as AI patents by all four approaches.
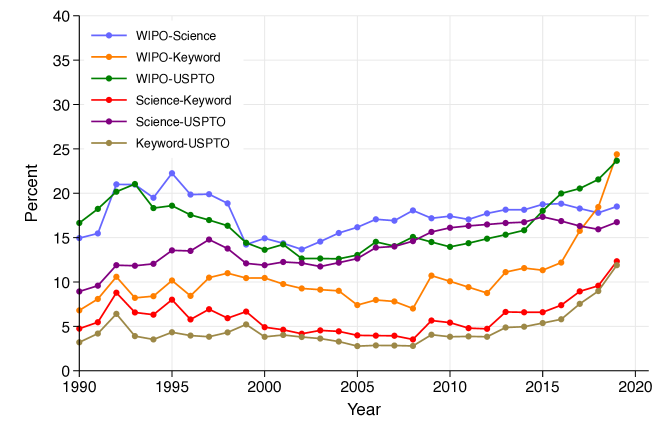
Notes: This figure shows the evolution of the Jaccard similarities computed for each year in our dataset. We see that the four approaches agree, at best, on 20% of their overall patents.
6.2 Growth
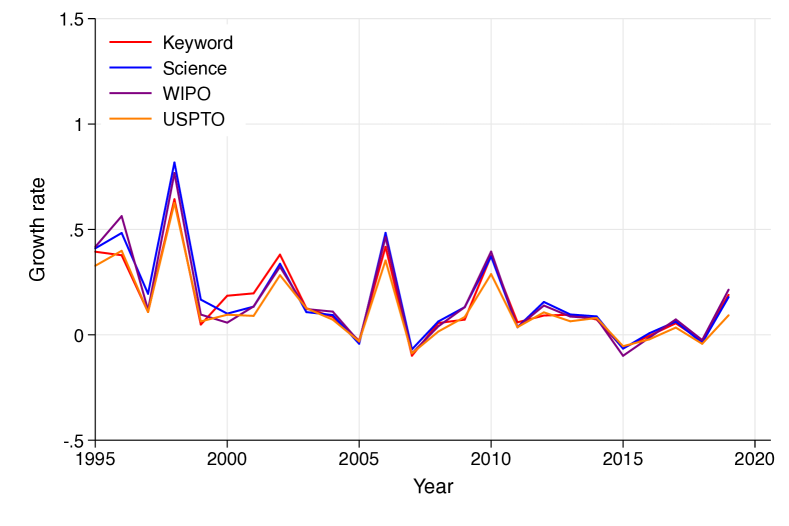
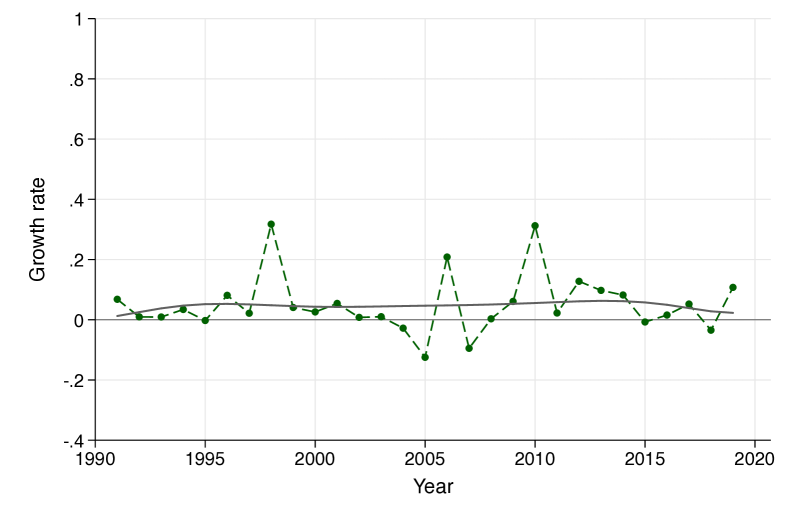
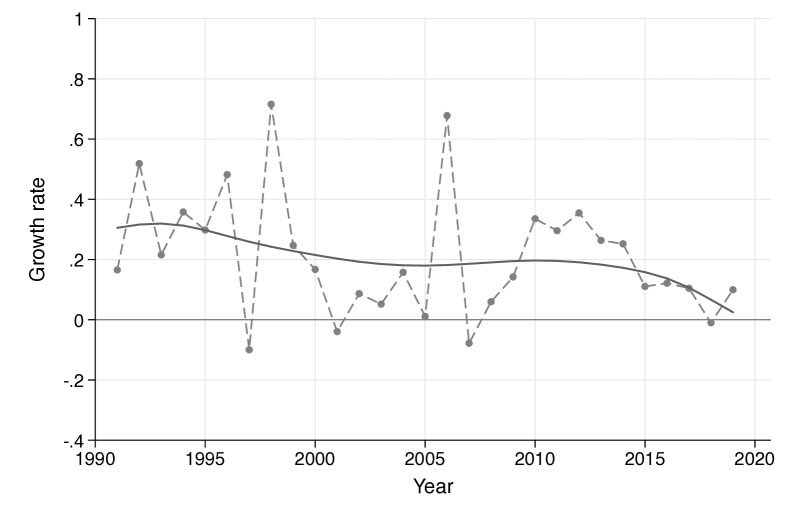
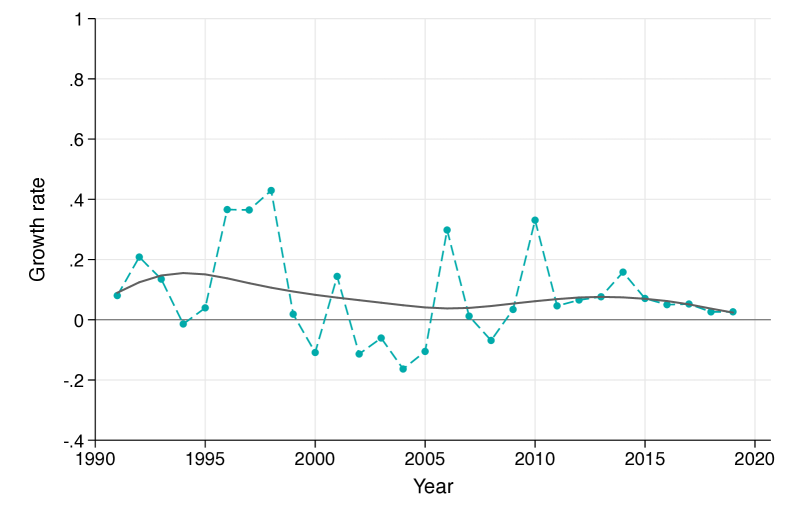
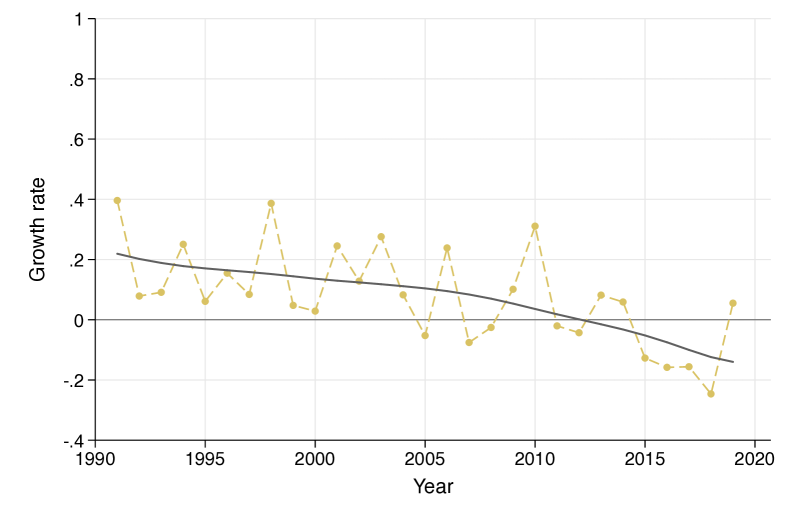
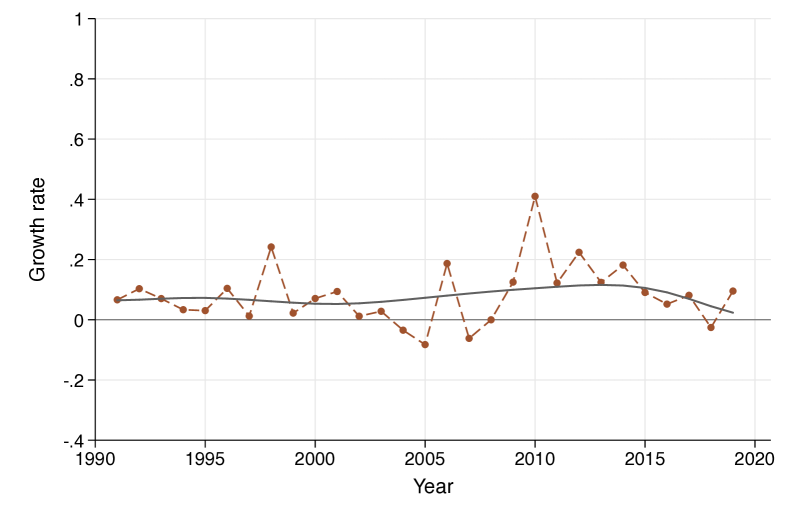
We next investigate the GPT feature of a high intrinsic growth rate, defined as the rate of change of patents between consecutive years. Figure 3 shows the growth rates, with corresponding to . We also include lowess[13] (local regression) smoother fits to the data in each plot to observe the overall pattern. In the figure, we find both similarities as well as differences.
First, each group of patents produces positive growth rates in most years, as anticipated by our earlier discussion of GPTs. Second, each classification approach demonstrates a dip in growth during the early 2000s before taking off again in recent years. However, a comparison with control groups shows that patenting decreased across many sectors during this period (see Figure 12 in Appendix C.1.1). Third, two of the smaller groups produced by the keyword and WIPO approaches capture an accelerating growth rate in the last few years, in contrast to the larger USPTO pool. Taken together, we see positive growth rates and differences in time trends between the approaches.
In the Supplementary Information (Figures 12), we study control groups that have been discussed in the literature as potentially demonstrating characteristics of GPTs. Figure 12 shows that the AI approaches represent at least as high, or higher, growth rates than several other control groups. We additionally make a series of significance test using a Wilcoxon signed-rank test that indicates whether the observed differences in average growth rates are significant (Appendix C.2.1). We find that the growth patterns of the AI samples cannot be statistically distinguished from our GPT benchmark candidates, although we observe the patterns of growth to be significantly higher than those of average patents.555Note that these tests rely on a very small number of observations and growth patterns of the four AI samples that fluctuate and differ across the three decades. Generally, we find that the differences in the average growth rates are not significant across different AI samples, except for the USPTO approach which shows significantly lower growth rates.
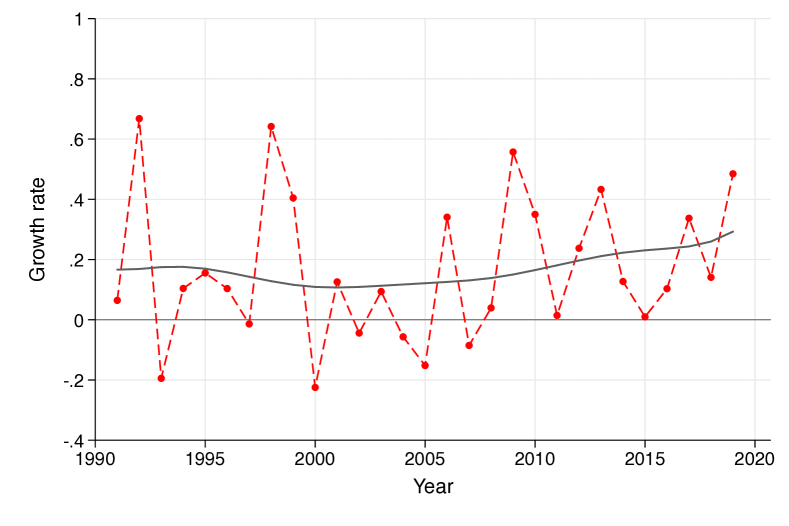
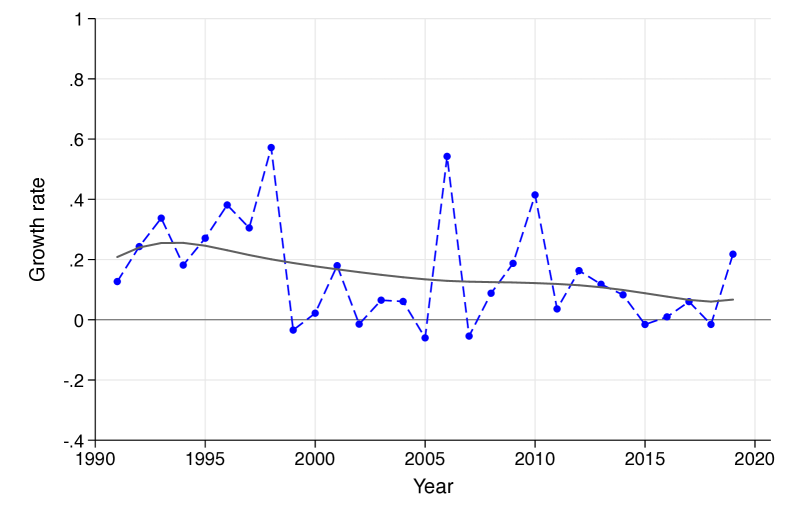
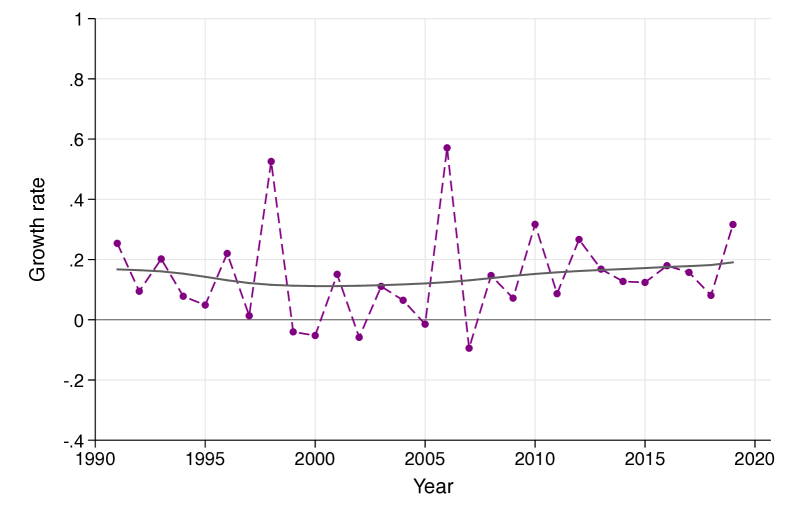
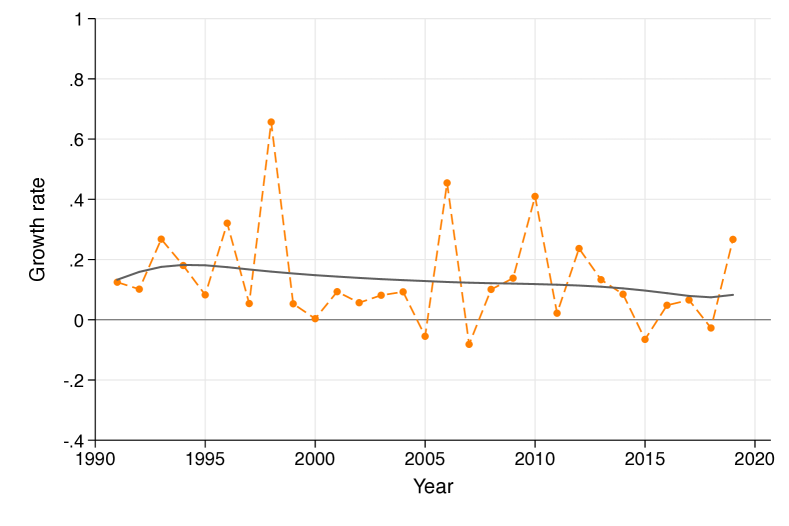
Notes: The four AI approaches have different growth patterns over time. The averages for all are positive, but the keyword and WIPO approach both have increasing growth rates.
| Keyword | Science | WIPO | USPTO | |
| Avg. growth rate | 0.16 | 0.15 | 0.14 | 0.13 |
- •
Figure 4 shows that the patents citing AI (excluding those patents that themselves are AI by the respective classification approach) have similar profiles over time. The size ranking also corresponds with the counts and shares in previous plots, with growth rates that have, on average, been positive. This gives support to each approach in capturing a growing number of spillovers. The significance tests in 17 indicate that the differences between the triple keyword-science-WIPO cannot be statistically distinguished, except for keyword showing the slowest uptake in the 1990s, but to take off thereafter. However, all three approaches consistently score significantly higher than the group of patents citing to USPTO AI patents. Figure 4(b) suggests a high similarity in the time profiles and growth series. This suggests that the AI definitions capture different aspects of a larger group of similar technologies.
Notes: Panel (a) shows actual number of AI citing patents. Panel (b) shows growth rates plotted from 1995 and onwards.
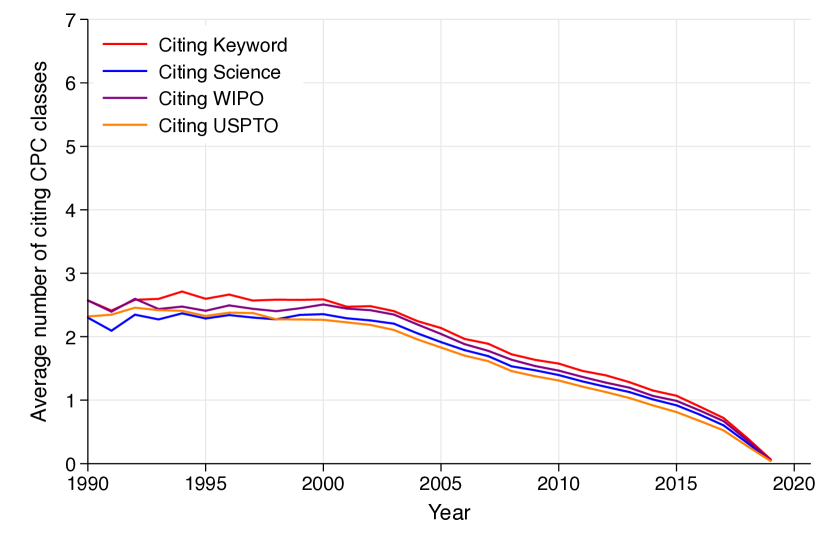
6.3 Generality
We use two indicators to evaluate the generality of AI innovations, i.e., the extent to which these inventions are used in diverse technology fields. First, we assess the generality index as defined in Equation (2). In Table 3 we record this index value for all approaches at different levels of aggregation, calculated over the entire time period. The keyword approach shows the highest level of generality across all levels of aggregation. Hence, citations from other technology fields to keyword AI patents are most equally distributed across different technology fields. The WIPO and science produce similar generality indices, with a slightly higher value for science patents. The USPTO group produces the lowest generality index across all CPC levels.
| Keyword | Science | WIPO | USPTO | |
|---|---|---|---|---|
| 1 digit | 0.76 | 0.73 | 0.72 | 0.68 |
| 3 digit | 0.91 | 0.87 | 0.87 | 0.84 |
| 4 digit | 0.96 | 0.95 | 0.94 | 0.93 |
-
•
Notes: The generality index is defined as share of citations to patents in different CPC classes at different aggregation levels (see 3.2). Citations within the same class are excluded.
| Keyword | Science | WIPO | USPTO | |
|---|---|---|---|---|
| 1 digit | 2.15 | 1.83 | 1.82 | 1.68 |
| 3 digit | 5.18 | 4.14 | 4.39 | 3.91 |
| 4 digit | 8.90 | 7.41 | 8.04 | 7.13 |
-
•
Notes: This table shows the numbers of different CPC classes making a citation to an average patent of the respective group. Citations within the same class are excluded.
In Table 4, we present the second GPT measure of wide usefulness based on the average number of unique technology classes citing to an AI patent. For this metric, we calculate the mean annual average number of citing classes. This accounts for the different number of annual patents and avoids an over-representation of the generality of patents in more recent years, as the number of patents is steeply increasing over time. At all levels of aggregation, the keyword patents are the most general. At the one-digit level, science scores second, closely followed by WIPO. WIPO scores higher at the three- and four-digit level. The USPTO patents demonstrate the lowest number of unique one-, three-, and four-digit patent citations.
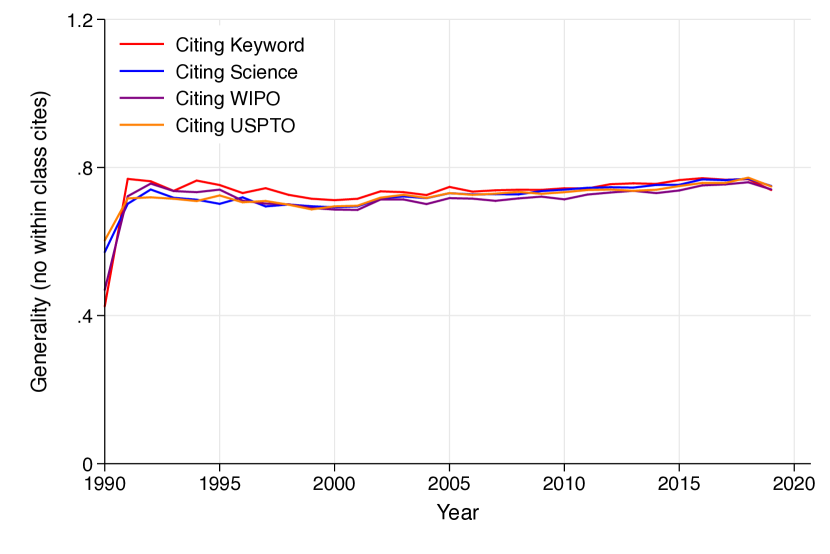
In Figure 5(a) and 5(b) we show the evolution of the generality index over time, with 5(b) showing the z-scaled version. The figures confirm that the keyword patents are consistently the most general during the whole period, with the science-based and WIPO approach producing similar, but lower, results. Again, the USPTO patents show the lowest generality. Towards the end of the time period, the decline in generality of the keyword and USPTO methods needs to be considered with caution, as the absolute number of citations of recently granted patents is lower when the time window to be cited is small.
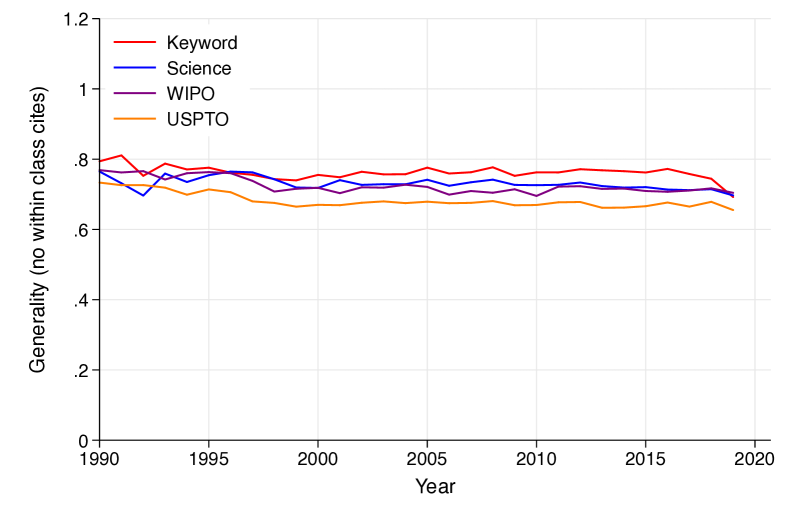
Notes: The z-scored value equals the level of the generality index minus its average across the four approaches divided by the standard deviation for each year.
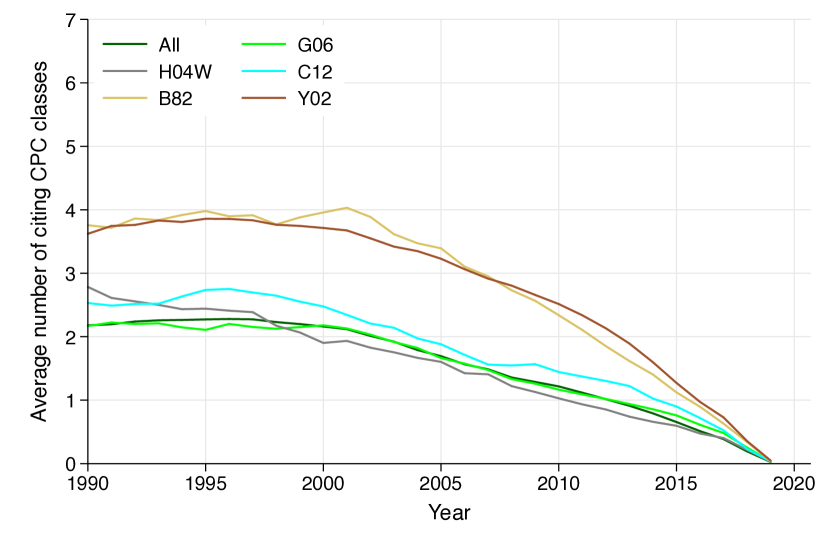
We also calculate the generality index for all patents as well as a set of benchmark patents that have been deemed as GPT in the literature. Table 10 shows the generality index across all patents is higher than AI categories. Among other groups, biochemistry/genetic engineering, nanotechnology, and climate innovations related patents have high generality score. Figure 13(b) shows that the time-series pattern of the generality score is quite stable except for some end-of-the-period fluctuations. For our second measure of generality we find that AI patents show more generality than the entire patent universe at any level of CPC codes (Table 11). Biochemistry/genetic engineering and climate innovations-related patents show high patent-level generality. These numbers show that our generality measures are working well, at least for some of the known GPT candidates.
In the Appendix C.2.2, we show the results of a series of significance tests for the differences in the time series results. These tests confirm that highest score of the keyword and the lowest of the USPTO method are statistically significant, while the differences between generality scores of the science and WIPO approaches are not significant at the one-digit level.
Furthermore, we provide additional results on the generality of the ‘descendants’ of AI patents, i.e., those patents that cite AI patents, but are not themselves AI (Appendix C.3). These patents produce a similar pattern of results between the classification approaches, although the differences are smaller.
| Keyword | Science | WIPO | USPTO | |
|---|---|---|---|---|
| 1 digit | 2.71 | 2.42 | 2.41 | 2.26 |
| 3 digit | 5.99 | 5.00 | 5.23 | 4.74 |
| 4 digit | 9.92 | 8.54 | 9.05 | 8.21 |
-
•
Notes: This table shows the numbers of different CPC classes making a citation to an average patent of the respective group conditional on the patent being cited at least once. Citations within the same class are excluded.
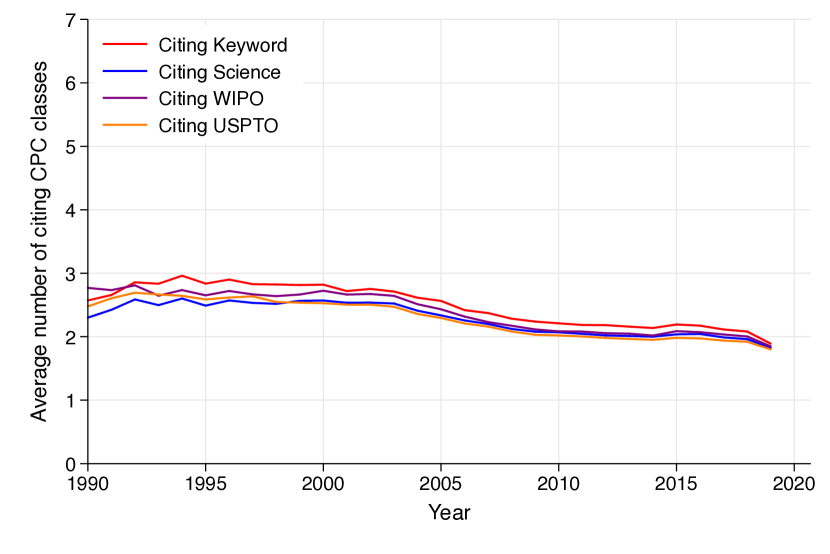
As an additional check, we also report the number of unique citing technology classes for the set of AI patents that are cited at least once (Table 5). Interpreting backward citations as a proxy for the technological value of a patent [30], this alternative measure focuses only on high-value patents. Imposing this restriction, we find the keyword-based patents once again show the highest generality across all levels of aggregation. Science scores slightly higher than WIPO at the one-digit level and vice versa at the three- and four-digit level. The USPTO approach shows the least generality.

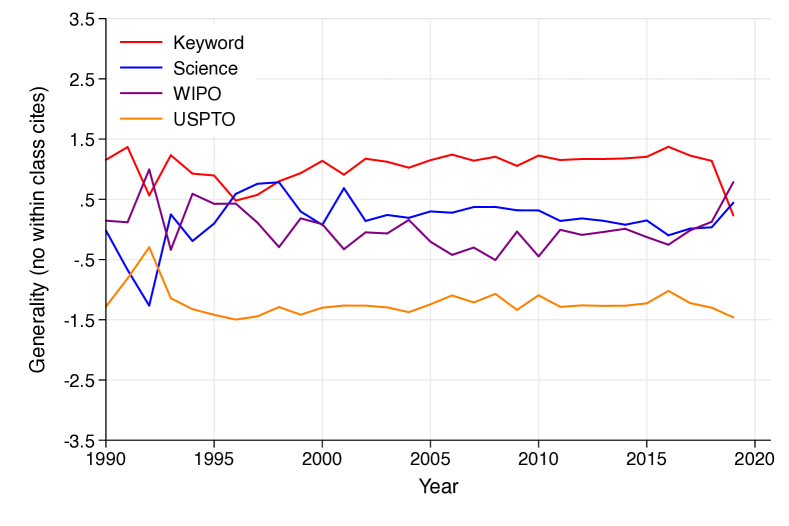
Notes: The z-scored value equals the level of the generality index minus its average across the four approaches divided by the standard deviation for each year.
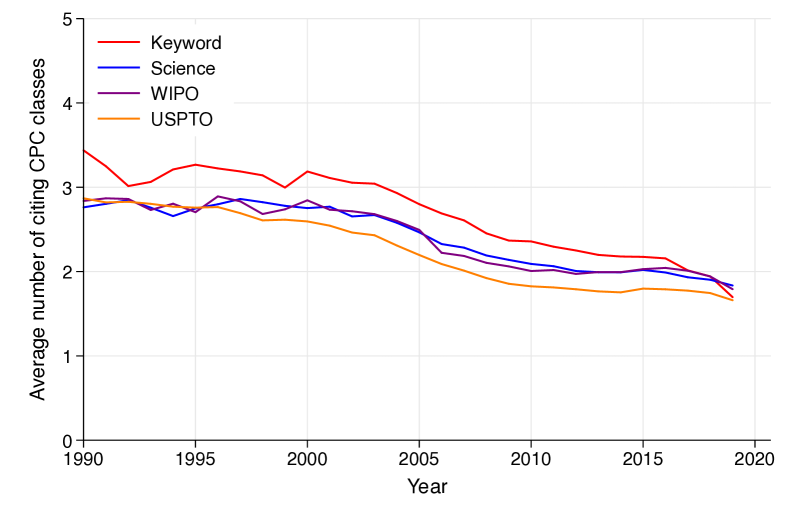
Figure 6 and the significance tests shown in Appendix C.2.2 confirm that the keyword sample of AI patents shows a significantly larger number of different citing CPC classes compared to the other three methods. Notably, time series of citation data are sensitive to truncation towards the end of the period, as more recently granted patents have a shorter period of being cited. Looking at the z-score scaled data 6(b) and 6(d), we find that the science approach is least sensitive to this truncation.
| Period | Keyword | Science | WIPO | USPTO |
|---|---|---|---|---|
| 1990-1999 | 13.72 | 13.26 | 13.77 | 13.64 |
| 2000-2009 | 9.84 | 9.08 | 9.38 | 9.34 |
| 2010-2019 | 4.26 | 4.15 | 4.19 | 4.33 |
-
•
Notes: This table shows the average number of years taken until a patent in the sample is cited. The average number of years is lower during the more recent decade as the maximal time lag is truncated when our data ends in 2019.
An analysis of the average citation lags confirms this observation (Table 6): keyword patents show the longest citation lag, i.e. patented inventions captured by this approach take more time to be used subsequently. Once again, the time series of the average number of citing classes is sensitive to truncation, as the time of being cited is short. Importantly, [23] argue that long citation lags are a characteristic property of GPTs, when their early ‘learning and destruction’ phase relies on the accretion of complementary innovations and structural changes of products and processes [17].
Altogether, the keyword classification approach produces a set of AI patents with the highest level of generality across different metrics.
6.4 Complementarity
We examine the co-occurrence of technology classes of AI patents to understand how strongly they complement existing or novel products and processes. If AI can be combined with many other fields of technology, we would expect to observe that AI patents are classified across a diverse pool of technological classes.
Figure 7 shows the percentage of three- and four-digit CPC classes associated with each pool of AI patents. In panel (a), USPTO patents span the most diverse pool of technology classes, with CPC classes ranging from 70-90% of all possible three-digit codes. This result, however, could be caused by the large number of AI patents identified by the USPTO approach. The other three approaches identify a substantially smaller pool of AI patents (see Table 1). Still, these patents cover a large share (80-90%) of three-digit codes by 2019. Panel (b) in the same figure shows the share of four-digit CPC classes. Starting around 2010, the share of technology classes embedded in keyword, science, and WIPO patents rapidly increased. Although USPTO patents represent the most diverse portfolio — at 78% of all technology classes in 2019 — the gap to the other three approaches has narrowed in recent years. Our significance tests show that the differences between the triple keyword-science-WIPO are statistically insignificant, but all score significantly lower than USPTO patents (see Table 37 and 39).
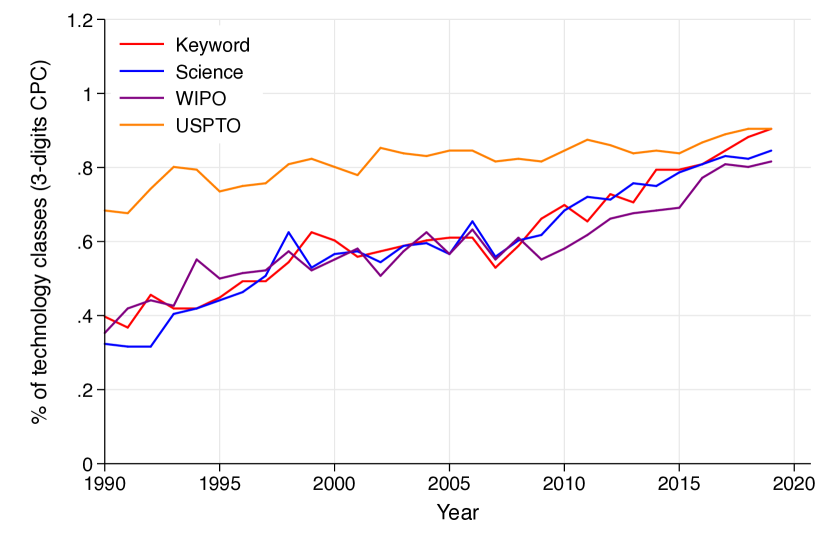
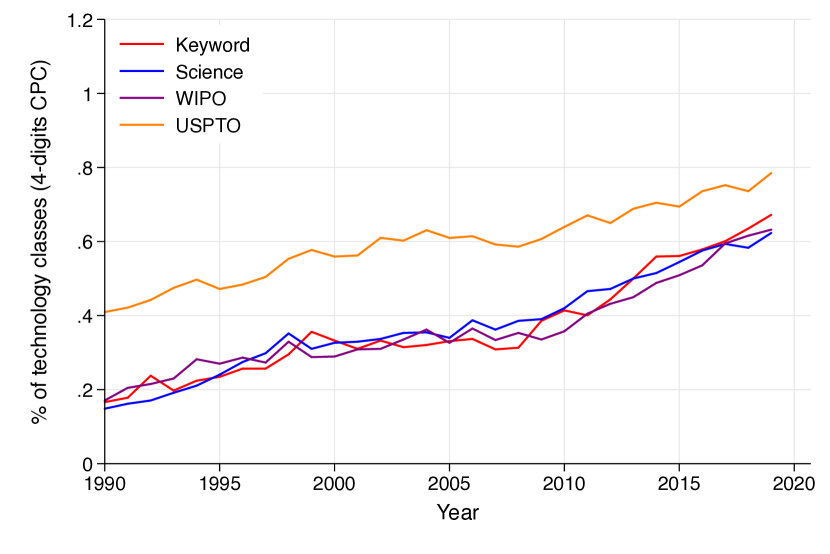
Note: Panel (a) shows the percentage of three-digit CPC codes and panel (b) shows the percentage of four-digit CPC as a share of all codes in the respective category. Note that the total number of three-digit and four-digit CPC codes are 136 and 674, respectively according to the February 2022 version.
To understand whether individual patents from each group are becoming more multidisciplinary, we calculate the annual averages of the number of one-, three- and four-digit CPC codes per patent. Table 7 shows that an average WIPO patent is associated with 1.64 three-digit classes and 2.05 four-digit classes across all years. An average keyword or science patent is associated with slightly fewer classes, whereas the USPTO patents appear to be the least multidisciplinary by this metric. The highest score of the WIPO method at the four-digit level and the weak diversity performance of the USPTO approach are statistically significant.
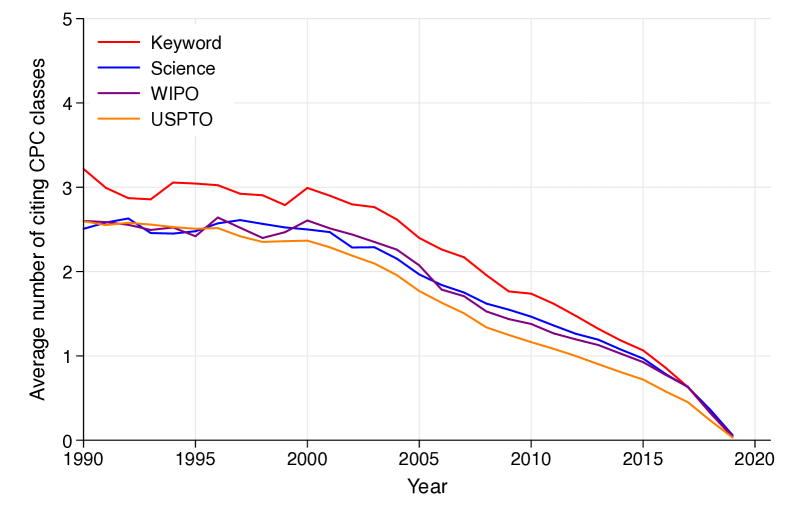
At the one-digit level, an average keyword and science patent show both similarly high numbers of co-classifications (1.39-1.40) and cannot be statistically distinguished from each other. The other approaches rank significantly lower with the USPTO approach showing the lowest level of diversity. In Figure 8, we check how the average number of one-digit level technology classes per patent vary over time. All panels demonstrate a rising number of technology classes per patent towards the second half of the last decade, with the most profound increase for WIPO patents towards the end of the period. The significance tests in Table 41, 43, and 45 suggest that the keyword and science methods show statistically indistiguishable patterns at the one- and three-digit level. At other levels of aggregation the differences diminish, except for the lower scoring of the USPTO method and the highest score of the WIPO method at the four-digit level.
| Keyword | Science | WIPO | USPTO | |
|---|---|---|---|---|
| 1 digit | 1.39 | 1.40 | 1.36 | 1.27 |
| 3 digit | 1.61 | 1.64 | 1.64 | 1.43 |
| 4 digit | 1.88 | 1.97 | 2.05 | 1.64 |
-
•
Note: The table shows the average of annual average number of technology classes by one-, three- or four-digit CPC per patent.
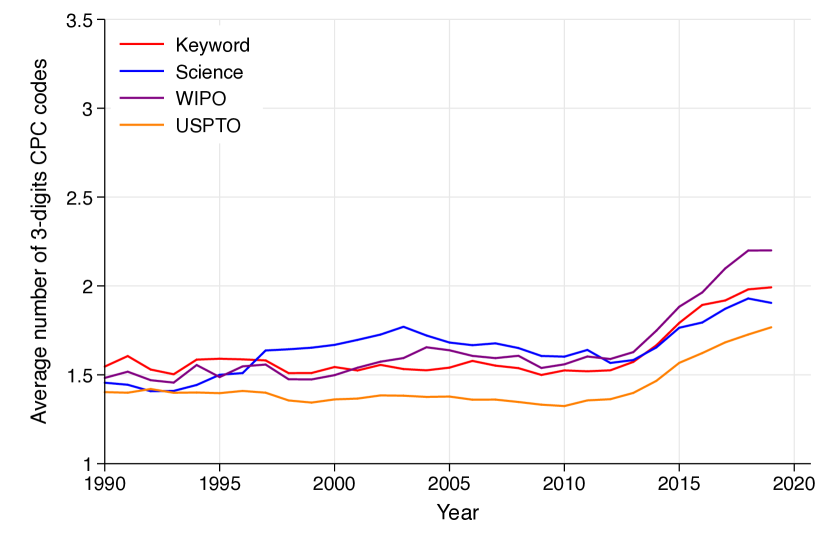
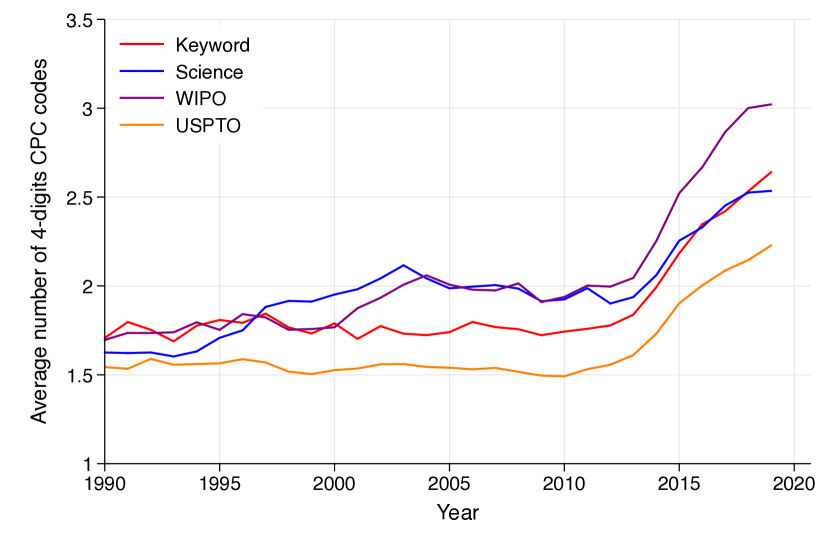
In summation, although the USPTO patents show a high diversity across many technology classes, the other three approaches produce the dynamics of increasingly diverse patent pools over time. It is remarkable that the keyword approach with only 67,186 AI patents cover almost 90% of all possible three-digit CPC codes and 67% of all possible four-digit CPC codes.
Examining the diversity of average patents, we find widespread, recent increases in the number of technology classes per patent. In recent years, the WIPO approach seems to capture the most multidisciplinary patents, which could be an artefact of the way the WIPO approach was designed, by considering different aspects of AI, including its techniques, applications, and fields (see Section 5.3).
In Appendix C.1.1, we also use these measures for a set of benchmark patent groups to see how well they capture the technological diversity. We find that our measures are performing equally well in capturing the increasing diversity of other GPTs suggested in the literature.
7 Discussion
7.1 Key Findings
Our analysis finds striking differences along with some similarities between four approaches to classifying patented AI innovations. As summarised in Table 8, the keyword approach produces the patent pool with the highest growth rates, generality and second-highest level of complementarity. The WIPO and science pools produce similar levels of each characteristics, but WIPO being stronger when it comes to innovation complementarity. The USPTO patents least profoundly demonstrate each of the three GPT characteristics.
| Keyword | USPTO | WIPO | Science | Metric | Based on | |
|---|---|---|---|---|---|---|
| Growth | Growth rate | Counts | ||||
| Generality | Generality index | Citations | ||||
| Complementarity | Avg. # tech. classes | CPC codes |
- •
Remarkably, the keyword approach generates the most profound evidence of each of the three GPT characteristics using a much smaller (68k) set of patents than the other approaches (158-959k). Both the WIPO and science-based patent groups demonstrate increasing generality, complementarities, and growth of AI innovation over time, yet these methods rely on more complex classification and face limitations with regards to patent coverage.
Despite relying on the most computationally-intensive ML approach and covering the largest group of patents, the USPTO patents are the least diverse, have the lowest growth rates, and exhibit the fewest complementarities.
Notably, each approach robustly reproduces key time-trends in AI innovation, including a substantial uptick in the number of patents citing an increasingly diverse spread of AI patents after 2010. All methods successfully reproduce stagnating generality of average AI patents and decreasing number of distinct citing technological classes since 2000.
7.2 Results in a Wider Context
Our results highlight that the extent to which AI constitutes a GPT is sensitive to the classification technique used. Moreover, our results call into question the literature that takes as given that AI is a GPT that is projected to expand in the ensuing years [15, 21, 12].
Relying on the USPTO classification method, it can be said that average patents now show the lowest generality index and there has been no growth in the number of three-digit CPC codes assigned an average AI patent since 2000. Moreover, by this method, the growth of AI patenting has plateaued after 2010 —a result that may generate questions over new, large-scale initiatives designed to bolster AI research.
Recent breakthroughs in the technology, data, and resources that underpin AI and its potential applications have spurred an international race between countries to become the global AI leader. In this context, the UK has recently launched the National Artificial Intelligence Strategy, demonstrating how hefty investments and significant policy decisions are founded on great expectations of future AI innovation. The policy itself is designed to bolster the ‘long-term needs of AI technologies’ to ready the economy for the ‘Age of AI’ [7], yet by the USPTO’s own method of classification methods, it can be said that AI innovation began to slow back in 2010.
From a research efficiency perspective, our results raise interesting questions as to whether human reasoning used to define relevant keywords can outperform more sophisticated and computationally complex methods. The small, simple, and tractable keyword approach may be desirable for researchers aiming to catch emerging GPTs. Small patent groups may indicate a clearer distinction from other patents and, because such technologies are ‘new’, there is greater potential for future growth, compared to the USPTO approach which suggests that 16.6% of all US patents today are based on AI. This being said, other classification approaches may be better suited to other questions surrounding the knowledge base of innovations (science) or the trajectory of an innovation through the universe of technologies (USPTO).
During our analysis, we discovered that the straight-forward keyword method reproduced from [14] may be further simplified. We found that the majority of patents can be identified using a narrower set of four terms (machine learning, neural network, robot, pattern recognition), rather than the original list of over forty words.
Finally, the phenomena of ‘AI narrowing’, as highlighted in [29], suggests that AI innovation has become significantly less diverse during the time period of our analysis. The authors suggest that the concentration of AI research within a small group of private firms is leading to the premature narrowing of its GPT potential. The authors argue that the intensive focus on DL techniques since 2010, combined with innovation path dependency, has reduced incentives for such leaders to explore alternative methods. The authors argue that this ‘locking in’ of AI to a subset of DL techniques is driving under-investment in other applications, including ethical and environmentally conscious AI. Their investigation of arXiv AI research reveals a sharp turn towards computer vision and language AI dominated by Deep Neural Networks (DNNs) as well as a stagnation of various metrics of AI research diversity.
The keyword and WIPO approaches both include terms closely related to ML and DL and may be the most sensitive to this premature narrowing. However, this is not visible in our results which instead show stabilised generality and increasingly diverse co-classifications since 2010. Another possible explanation is that the concentration on a few keywords is a hype that unfolds with a time lag, and that incentives support using certain keywords. Descriptions of inventions could be affected by this hype. On the other hand, this is made more difficult by the fact that approaches using keywords match key sections in patents that are carefully reviewed for inventiveness. A recent focus on certain techniques may simply represent a technological trend whereby existing keywords may soon be supplanted by new inventions.
7.3 Limitations of Our Approach
Our evaluation is subject to two major caveats. First, the performance of the different approaches to capture the GPT-like characteristics of AI may be dependent on the time period chosen. Given that our aim is to inform researchers who are interested in the impact of AI, we have chosen to investigate the period from 1990-2019, when AI began to grow and disseminate more widely [15]. Given that the performance of the keyword approach may reflect the popularity of a narrow set of technological buzzwords, our results may differ in other time periods.
Second, we also emphasise that the evaluation of different classification methods depends on the intended purpose. Here, we aim to provide guidance for researchers interested in studying the economic impact of AI innovation that they take to be a GPT. Other methods may be more appropriate to study the dissemination of AI-related applications or the knowledge origins of AI. For example, the USPTO approach tells an interesting story, suggesting that 14% of all patented inventions in the US today already rely on AI; the science approach in these contexts would provide interesting extrapolation to the early origins of AI research in the 1950s.
Ultimately, our results suggest that the extent to which AI can be seen as a GPT is sensitive to the chosen classification method. This underscores the importance of balancing multiple classification techniques when motivating political and economic innovations in support of AI’s projected future impact. Furthermore, we raise the potential that those wishing to show AI as a strong GPT could do so by leveraging a more keyword-based classification approach.
8 Concluding Remarks
In this paper, we have performed a systematic analysis of four separate approaches to identifying patented AI innovations. Ultimately, we demonstrate how sensitive each key GPT-like feature of AI is to the classification method chosen.
Our results provide guidance to policy-makers and innovation scholars on how to identify patented AI innovations. For researchers interested in studying the GPT-like characteristics of AI, a simple keyword-based approach may be more successful at producing a narrowly defined set of patented technologies that demonstrates the canonical GPT features of intrinsic growth, wide usefulness, and innovation complementarity.
Our work provides important caveats to those making policy and funding decisions for the future pace of AI innovation, such as the recently released UK National Artificial Intelligence Strategy [7]. Ultimately, we underscore the need for multiple AI classification techniques in order to counteract the dependence of significant policy conclusions on the choice of classification approach.
Acknowledgements
The authors thankfully acknowledge valuable feedback received from the participants of the OMPTEC-FoW and INET complexity group meetings. K.H. and T.T. thankfully acknowledge support from OMPTEC and Citi. V. V. acknowledges support from Intelligence Advanced Research Projects Activity (IARPA), via contract no. 2019-1902010003, for developing capabilities that this work builds upon. L. B. gratefully acknowledges support from the General Sir John Monash Foundation.
References
- [1] Daron Acemoglu, David Autor, Jonathon Hazell and Pascual Restrepo “AI and jobs: Evidence from online vacancies”, 2020 DOI: 10.3386/w28257
- [2] Philippe Aghion, Benjamin F Jones and Charles I Jones “Artificial intelligence and economic growth” In The economics of artificial intelligence: An agenda University of Chicago Press, 2018, pp. 237–282 DOI: 10.7208/chicago/9780226613475.001.0001
- [3] Ajay Agrawal, Joshua Gans and Avi Goldfarb “Economic policy for artificial intelligence” In Innovation Policy and the Economy 19.1 University of Chicago Press Chicago, IL, 2019, pp. 139–159 DOI: 10.1086/699935
- [4] Ajay Agrawal, John McHale and Alexander Oettl “Finding needles in haystacks: Artificial intelligence and recombinant growth” In The economics of artificial intelligence: An agenda University of Chicago Press, 2018, pp. 149–174 DOI: 10.7208/chicago/9780226613475.003.0005
- [5] Mohammad Ahmadpoor and Benjamin F Jones “The dual frontier: Patented inventions and prior scientific advance” In Science 357.6351 American Association for the Advancement of Science, 2017, pp. 583–587 DOI: 10.1126/science.aam9527
- [6] Dean Alderucci, Lee Branstetter, Eduard Hovy, Andrew Runge and Nikolas Zolas “Quantifying the impact of AI on productivity and labor demand: Evidence from US census microdata” In Allied Social Science Associations - ASSA 2020 Annual Meeting, 2020
- [7] Office Artificial Intelligence “National AI Strategy”, 2021 URL: https://www.gov.uk/government/publications/national-ai-strategy/national-ai-strategy-html-version
- [8] Stefano Bianchini, Moritz Müller and Pierre Pelletier “Deep learning in science” In arXiv preprint arXiv:2009.01575, 2020 DOI: 10.48550/arXiv.2009.01575
- [9] Timothy F Bresnahan and Manuel Trajtenberg “General purpose technologies ’Engines of growth’?” In Journal of econometrics 65.1 Elsevier, 1995, pp. 83–108 DOI: 10.1016/0304-4076(94)01598-T
- [10] Erik Brynjolfsson and Tom Mitchell “What can machine learning do? Workforce implications” In Science 358.6370 American Association for the Advancement of Science, 2017, pp. 1530–1534 DOI: 10.1126/science.aap8062
- [11] Erik Brynjolfsson, Daniel Rock and Chad Syverson “Artificial intelligence and the modern productivity paradox” In The economics of artificial intelligence: An agenda 23 University of Chicago Press, 2019 DOI: 10.3386/w24001
- [12] Erik Brynjolfsson, Daniel Rock and Chad Syverson “The productivity J-curve: How intangibles complement general purpose technologies” In American Economic Journal: Macroeconomics 13.1, 2021, pp. 333–72 DOI: 10.1257/mac.20180386
- [13] William S Cleveland “Robust locally weighted regression and smoothing scatterplots” In Journal of the American statistical association 74.368 Taylor & Francis, 1979, pp. 829–836
- [14] Iain M Cockburn, Rebecca Henderson and Scott Stern “The impact of artificial intelligence on innovation”, Working Paper Series, 2018 DOI: 10.3386/w24449
- [15] Iain M Cockburn, Rebecca Henderson and Scott Stern “The Impact of Artificial Intelligence on Innovation: an Exploratory Analysis” In The Economics of Artificial Intelligence University of Chicago Press, 2019, pp. 115–148 DOI: 10.7208/9780226613475-006
- [16] Diego Comin and Marti Mestieri “If technology has arrived everywhere, why has income diverged?” In American Economic Journal: Macroeconomics 10.3, 2018, pp. 137–78 DOI: 10.1257/mac.20150175
- [17] Nicholas Crafts “Artificial intelligence as a general-purpose technology: an historical perspective” In Oxford Review of Economic Policy 37.3 Oxford University Press UK, 2021, pp. 521–536 DOI: 10.1093/oxrep/grab012
- [18] EPO “PATSTAT online (Version 2.7.2), Patent information for experts [Data set]”, 2021 URL: https://data.epo.org/expert-services/index.html
- [19] Carl Benedikt Frey and Michael A Osborne “The future of employment: How susceptible are jobs to computerisation?” In Technological forecasting and social change 114 Elsevier, 2017, pp. 254–280 DOI: 10.1016/j.techfore.2016.08.019
- [20] Alexander V Giczy, Nicholas A Pairolero and Andrew Toole “Identifying artificial intelligence (AI) invention: A novel AI patent dataset. USPTO Economic Working Paper No. 2021-2” In The Journal of Technology Transfer, 2021 DOI: 10.2139/ssrn.3866793
- [21] Avi Goldfarb, Bledi Taska and Florenta Teodoridis “Could machine learning be a general-purpose technology? Evidence from online job postings” In SSRN, 2019 DOI: 10.2139/ssrn.3468822
- [22] Thomas Gries and Wim Naude “Artificial intelligence, jobs, inequality and productivity: Does aggregate demand matter?”, 2018 URL: https://ideas.repec.org/p/unm/unumer/2018047.html
- [23] Bronwyn H Hall and Manuel Trajtenberg “Chapter 14: Uncovering General Purpose Technologies with Patent Data” In New Frontiers in the Economics of Innovation and New Technology Essays in Honour of Paul A. David Cheltenham, UK: Edward Elgar Publishing, 2006 DOI: 10.4337/9781845427924.00022
- [24] Kerstin Hötte, Anton Pichler and François Lafond “The rise of science in low-carbon energy technologies” In Renewable and Sustainable Energy Reviews 139 Elsevier, 2021, pp. 110654 DOI: 10.1016/j.rser.2020.110654
- [25] Adam B Jaffe and Gaetan De Rassenfosse “Patent citation data in social science research: Overview and best practices” In Research handbook on the economics of intellectual property law Edward Elgar Publishing, 2019 DOI: 10.4337/9781789903997.00043
- [26] Boyan Jovanovic and Peter L Rousseau “General purpose technologies”, 2005 DOI: 10.3386/w11093
- [27] Roman Jurowetzki, Daniel Hain, Juan Mateos-Garcia and Konstantinos Stathoulopoulos “The Privatization of AI Research (-ers): Causes and Potential Consequences–From university-industry interaction to public research brain-drain?” In arXiv preprint, 2021 DOI: 10.48550/ARXIV.2102.01648
- [28] Joel Klinger, Juan C Mateos-Garcia and Konstantinos Stathoulopoulos “Deep learning, deep change? Mapping the development of the Artificial Intelligence General Purpose Technology” In Mapping the Development of the Artificial Intelligence General Purpose Technology (August 17, 2018), 2018
- [29] Joel Klinger, Juan C Mateos-Garcia and Konstantinos Stathoulopoulos “A narrowing of AI research?”, 2020 DOI: 10.2139/ssrn.3698698
- [30] Leonid Kogan, Dimitris Papanikolaou, Amit Seru and Noah Stoffman “Technological innovation, resource allocation, and growth” In The Quarterly Journal of Economics 132.2 Oxford Academic, 2017, pp. 665–712 DOI: 10.1093/qje/qjw040
- [31] PM Krafft, Meg Young, Michael Katell, Karen Huang and Ghislain Bugingo “Defining AI in policy versus practice” In Proceedings of the AAAI/ACM Conference on AI, Ethics, and Society, 2020, pp. 72–78 DOI: 10.1145/3375627.3375835
- [32] Richard G Lipsey, Kenneth I Carlaw and Clifford T Bekar “Economic transformations: general purpose technologies and long-term economic growth” Oxford University Press, Oxford, 2005 URL: https://EconPapers.repec.org/RePEc:oxp:obooks:9780199290895
- [33] Matt Marx and Aaron Fuegi “Reliance on Science: Worldwide Front-Page Patent Citations to Scientific Articles” November 15, 2019, 2019 DOI: 10.2139/ssrn.3331686
- [34] Matt Marx and Aaron Fuegi “Reliance on science: Worldwide front-page patent citations to scientific articles” In Strategic Management Journal 41.9 Wiley Online Library, 2020, pp. 1572–1594 DOI: 10.1002/smj.3145
- [35] Matt Marx and Aaron Fuegi “Reliance on Science in Patenting (Version v30) [Data set]”, 2021 DOI: 10.5281/zenodo.4850763
- [36] Martin Meyer “Does science push technology? Patents citing scientific literature” In Research Policy 29.3 Elsevier, 2000, pp. 409–434 DOI: 10.1016/S0048-7333(99)00040-2
- [37] Petra Moser and Tom Nicholas “Was electricity a general purpose technology? Evidence from historical patent citations” In American Economic Review 94.2, 2004, pp. 388–394 DOI: 10.1257/0002828041301407
- [38] Francis Narin, Kimberly S Hamilton and Dominic Olivastro “Linkage between agency-supported research and patented industrial technology” In Research Evaluation 5.3 Beech Tree Publishing, 1995, pp. 183–187 DOI: 10.1093/rev/5.3.183
- [39] Sergio Petralia “Mapping general purpose technologies with patent data” In Research Policy 49.7 Elsevier, 2020, pp. 104013 DOI: 10.1016/j.respol.2020.104013
- [40] Paul Romer “Economic Growth”, 2008
- [41] Joseph A Schumpeter “Development” post-hum published and introduced by Knudsen, Thorbjørn In Journal of Economic Literature 43, 2005, pp. 108–120 DOI: 10.1257/0022051053737825
- [42] Arnab Sinha, Zhihong Shen, Yang Song, Hao Ma, Darrin Eide, Bo-June (Paul) Hsu and Kuansan Wang “An Overview of Microsoft Academic Service (MAS) and Applications”, 2015 DOI: 10.1145/2740908.2742839
- [43] Russell Stuart and Peter Norvig “Artificial intelligence: a modern approach” Upper Saddle River, NJ, USA: Prentice Hall, 2003
- [44] Robert JW Tijssen “Global and domestic utilization of industrial relevant science: patent citation analysis of science–technology interactions and knowledge flows” In Research Policy 30.1 Elsevier, 2001, pp. 35–54 DOI: 10.1016/S0048-7333(99)00080-3
- [45] Manuel Trajtenberg “AI as the next GPT: a Political-Economy Perspective”, 2018 DOI: 10.3386/w24245
- [46] Manuel Trajtenberg, Rebecca Henderson and Adam Jaffe “University versus corporate patents: A window on the basicness of invention” In Economics of Innovation and New Technology 5.1 Taylor & Francis, 1997, pp. 19–50 DOI: 10.1080/10438599700000006
- [47] YM Valdes and Ilja J Rudyk “Patents and the fourth industrial revolution”, 2017 URL: https://www.epo.org/service-support/publications.html?pubid=163#tab3
- [48] Michael Webb “The impact of artificial intelligence on the labor market”, 2019 DOI: 10.2139/ssrn.3482150
- [49] Meredith Whittaker “The steep cost of capture” In Interactions 28.6 ACM New York, NY, USA, 2021, pp. 50–55 DOI: 10.1145/3488666
- [50] WIPO “Technology Trends 2019: Artificial Intelligence: Data collection method and clustering scheme: Background paper” In Geneva: World Intellectual Property Organization, 2019 URL: https://www.wipo.int/export/sites/www/tech_trends/en/artificial_intelligence/docs/techtrends_ai_methodology.pdf
- [51] WIPO “WIPO Technology Trends 2019: Artificial Intelligence”, 2019 URL: https://www.wipo.int/edocs/pubdocs/en/wipo_pub_1055.pdf
Appendix A List of Keywords Used in Keyword Approach
| Symbols | Learning | Robotics |
|---|---|---|
| natural language processing | machine learning | computer vision |
| image grammars | neural networks | robot |
| pattern recognition | reinforcement learning | robots |
| image matching | logic theorist | robot systems |
| symbolic reasoning | bayesian belief networks | robotics |
| symbolic error analysis | unsupervised learning | robotic |
| pattern analysis | deep learning | collaborative systems |
| symbol processing | knowledge representation and reasoning | humanoid robotics |
| physical symbol system | crowdsourcing and human computation | sensor network |
| natural languages | neuromorphic computing | sensor networks |
| pattern analysis | decision making | sensor data fusion |
| image alignment | machine intelligence | systems and control theory |
| optimal search | neural network | layered control systems |
| symbolic reasoning | ||
| symbolic error analysis |
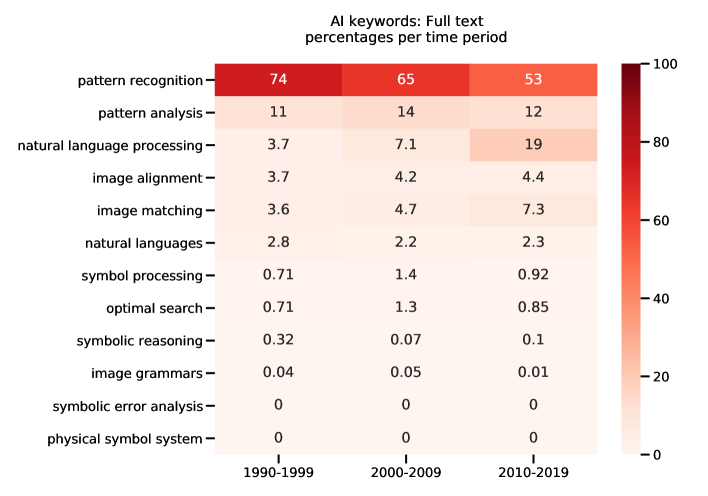
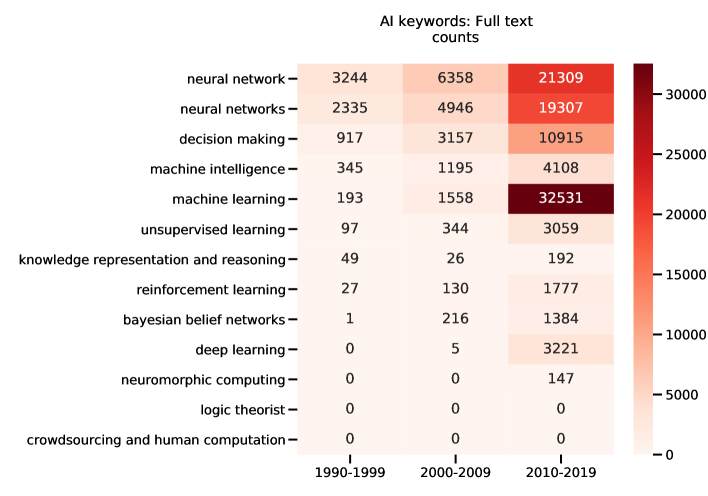
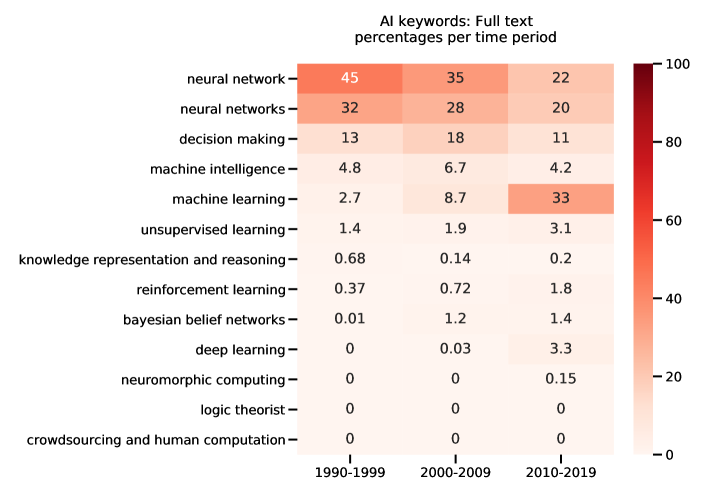
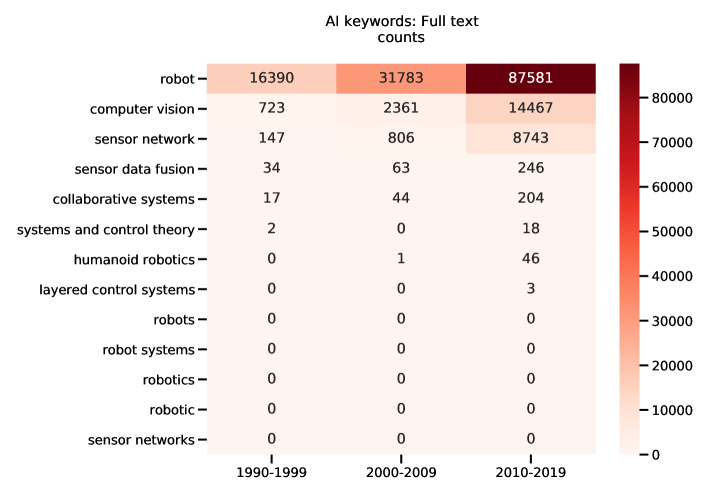
Appendix B A Study of AI Keywords in Patent Texts
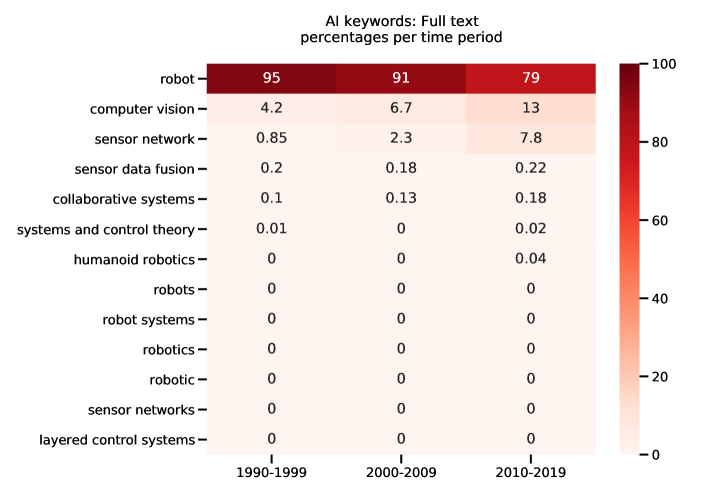
We split all the patent texts into three time periods (1990-1999, 2000-2009, 2010-2019) and search through the texts for keywords. Then, in each period (and for each category) we counts the unique number of matching documents and what percentages of the AI patents match according to this keyword. Figures 9, 10, and 11 below illustrate both counts and shares.
Appendix C Additional Results
C.1 Comparison to Benchmarks
The following figures reproduce time series of growth rates, counts, and shares for additional groups of patents. The benchmarks were identified in previous discussions of GPT technologies in the literature (nanotechnology, biochemistry, green technologies, computing). Climate innovations were also included as a group of technologies where one can expect wide diversity, as climate innovation can be expected to cover many sectors of the economy.
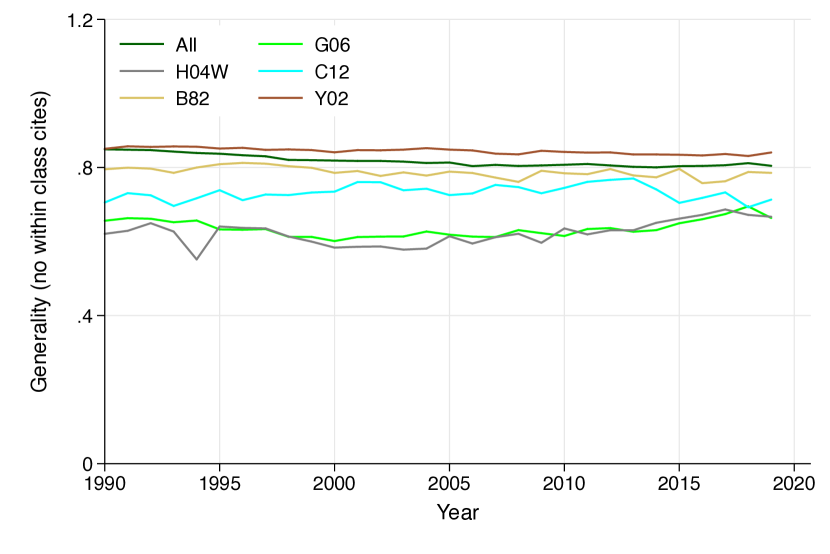
C.1.1 Growth

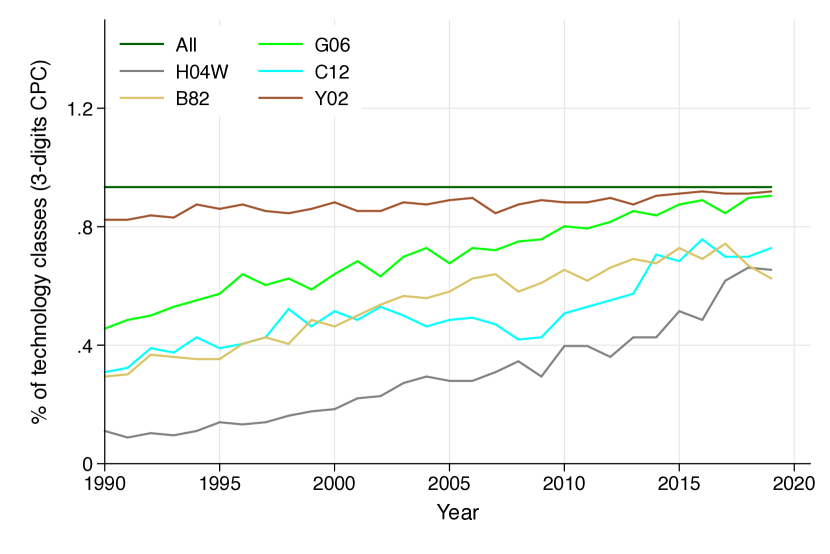
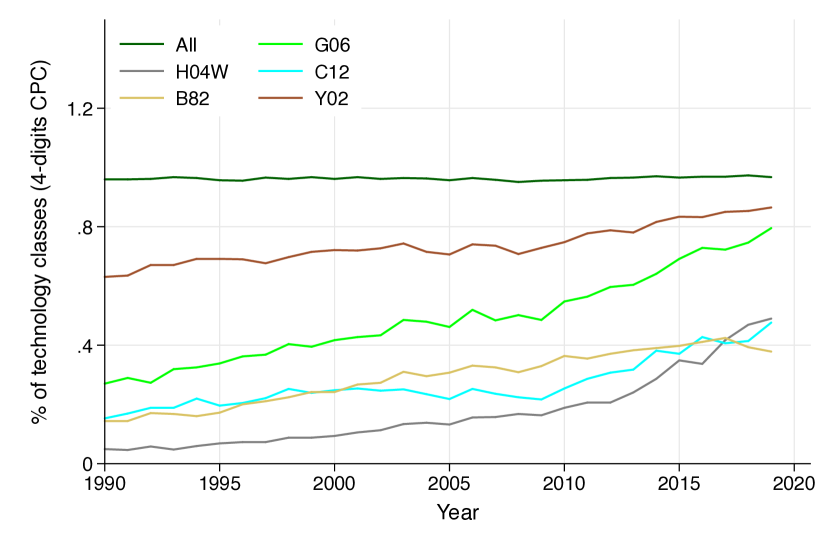
Note: ‘All’ refers to all patents, G06, H04W, B82, C12, and Y02 refers to computing, wireless communications, biochemistry/genetic engineering, nanotechnology, and climate innovations-related patents, respectively.
C.1.2 Generality
| All | G06 | H04W | C12 | B82 | Y02 | |
|---|---|---|---|---|---|---|
| 1 digit | 0.82 | 0.62 | 0.62 | 0.74 | 0.79 | 0.85 |
| 3 digit | 0.95 | 0.82 | 0.82 | 0.85 | 0.92 | 0.95 |
| 4 digit | 0.82 | 0.62 | 0.62 | 0.74 | 0.79 | 0.85 |
-
•
Notes: The generality index is defined as share of citations to patents in different CPC classes at different aggregation levels (see 3.2). Citations within the same class are excluded. ‘All’ refers to all patents, G06, H04W, B82, C12, and Y02 refers to computing, wireless communications, biochemistry/genetic engineering, nanotechnology, and climate innovations-related patents, respectively.
| All | G06 | H04W | C12 | B82 | Y02 | |
|---|---|---|---|---|---|---|
| 1 digit | 1.27 | 1.00 | 0.68 | 1.46 | 2.36 | 1.99 |
| 3 digit | 2.48 | 1.99 | 1.19 | 2.52 | 4.39 | 3.32 |
| 4 digit | 3.97 | 3.31 | 2.80 | 4.18 | 6.42 | 5.10 |
-
•
Notes: The table shows number of different CPC classes making a citation to an average patent of the respective group. Citations within the same class are excluded. ‘All’ refers to all patents, G06, H04W, B82, C12, and Y02 refers to computing, wireless communications, biochemistry/genetic engineering, nanotechnology, and climate innovations-related patents, respectively.
Note: ‘All’ refers to all patents, G06, H04W, B82, C12, and Y02 refers to computing, wireless communications, biochemistry/genetic engineering, nanotechnology, and climate innovations-related patents, respectively.
| All | G06 | H04W | C12 | B82 | Y02 | |
|---|---|---|---|---|---|---|
| 1 digit | 2.39 | 2.03 | 2.00 | 2.78 | 3.35 | 3.29 |
| 3 digit | 4.28 | 3.78 | 3.35 | 4.60 | 6.22 | 5.48 |
| 4 digit | 6.44 | 5.96 | 5.63 | 7.47 | 9.08 | 8.42 |
-
•
Notes: The table reports numbers of different CPC classes making a citation to an average patent of the respective group that receives at least one citation. Citations within the same class are excluded. ‘All’ refers to all patents, G06, H04W, B82, C12, and Y02 refers to computing, wireless communications, biochemistry/genetic engineering, nanotechnology, and climate innovations-related patents, respectively.
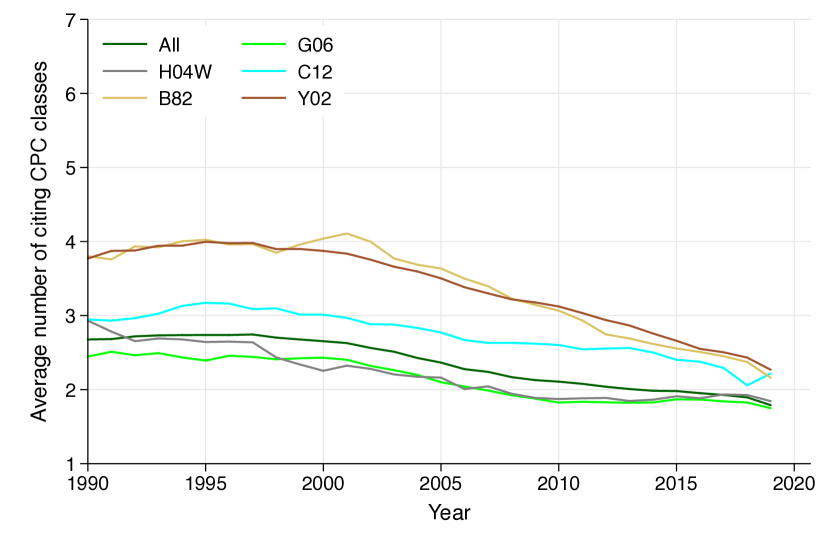
Note: ‘All’ refers to all patents, G06, H04W, B82, C12, and Y02 refers to computing, wireless communications, biochemistry/genetic engineering, nanotechnology, and climate innovations-related patents, respectively.
| Period | All | G06 | H04W | C12 | B82 | Y02 |
|---|---|---|---|---|---|---|
| 1990-1999 | 13.57 | 12.78 | 12.47 | 14.58 | 12.14 | 13.49 |
| 2000-2009 | 9.19 | 9.00 | 8.75 | 10.15 | 8.58 | 8.92 |
| 2010-2019 | 4.29 | 4.19 | 3.83 | 4.29 | 4.33 | 4.08 |
Notes: This table shows the average number of years it takes until a patent in the sample is cited. The average number of years is lower during the more recent decade as the maximal time lag is truncated since our data ends in 2019. ‘All’ refers to all patents, G06, H04W, B82, C12, and Y02 refers to computing, wireless communications, biochemistry/genetic engineering, nanotechnology, and climate innovations-related patents, respectively.
C.1.3 Complementarity
Note: Panel (a) shows the percentage of three-digit CPC codes and panel (b) shows the percentage of four-digit CPC as a share of all codes in the respective category. Note that the total number of three-digit and four-digit CPC codes are 136 and 674, respectively. ‘All’ refers to all patents, G06, H04W, B82, C12, and Y02 refers to computing, wireless communications, biochemistry/genetic engineering, nanotechnology, and climate innovations-related patents, respectively.
| All | G06 | H04W | C12 | B82 | Y02 | |
|---|---|---|---|---|---|---|
| 1 digit | 1.36 | 1.36 | 1.32 | 1.80 | 2.48 | 2.47 |
| 3 digit | 1.54 | 1.62 | 1.43 | 2.32 | 3.03 | 2.85 |
| 4 digit | 1.80 | 1.81 | 2.26 | 2.93 | 3.50 | 3.39 |
-
•
Note: The table shows the average of annual average number of technology classes by one-, three- or four-digit CPC per patent. ‘All’ refers to all patents, G06, H04W, B82, C12, and Y02 refers to computing, wireless communications, biochemistry/genetic engineering, nanotechnology, and climate innovations-related patents, respectively.
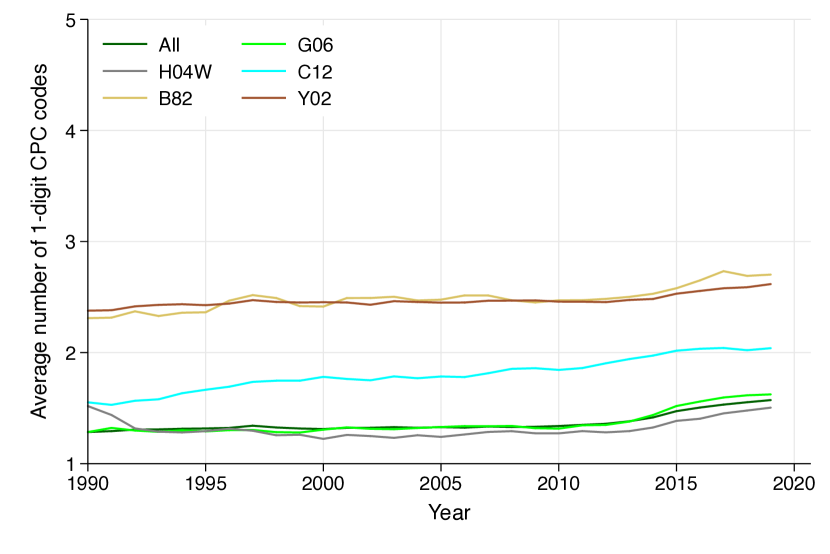

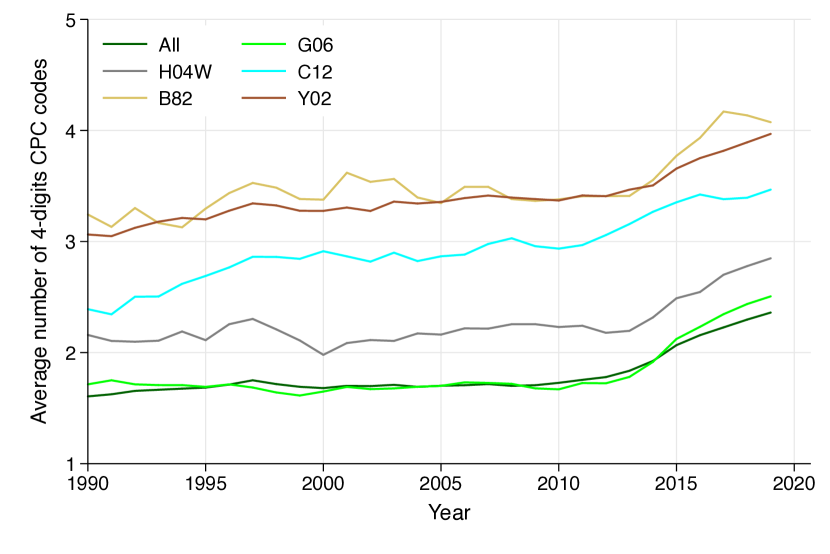
Note: ‘All’ refers to all patents, G06, H04W, B82, C12, and Y02 refers to computing, wireless communications, biochemistry/genetic engineering, nanotechnology, and climate-related patents, respectively.
C.2 Significance Tests
Here, we provide the results of a series of pair-wise Wilcoxon signed rank tests showing whether the differences in the means reported in Table 2, 3, 4, 5, 7 are significant.
C.2.1 Growth
| period | pair | Keyword | Science | WIPO | USPTO | All | G06 | H04W | C12 | B82 |
|---|---|---|---|---|---|---|---|---|---|---|
| 1990-2019 | Science | 1.00 | ||||||||
| 1990-2019 | WIPO | 1.00 | 1.00 | |||||||
| 1990-2019 | USPTO | 1.00 | 1.00 | 1.00 | ||||||
| 1990-2019 | All | 0.07 | 0.00 | 0.00 | 0.00 | |||||
| 1990-2019 | G06 | 1.00 | 1.00 | 1.00 | 1.00 | 0.00 | ||||
| 1990-2019 | H04W | 1.00 | 0.64 | 0.77 | 0.17 | 0.00 | 0.04 | |||
| 1990-2019 | C12 | 0.91 | 0.08 | 0.41 | 0.79 | 1.00 | 0.78 | 0.01 | ||
| 1990-2019 | B82 | 1.00 | 0.29 | 1.00 | 0.71 | 1.00 | 0.90 | 0.05 | 1.00 | |
| 1990-2019 | Y02 | 1.00 | 0.63 | 0.33 | 0.70 | 0.03 | 0.91 | 0.00 | 1.00 | 1.00 |
| 1990-1999 | Science | 1.00 | ||||||||
| 1990-1999 | WIPO | 1.00 | 0.96 | |||||||
| 1990-1999 | USPTO | 1.00 | 1.00 | 1.00 | ||||||
| 1990-1999 | All | 1.00 | 0.47 | 1.00 | 0.18 | |||||
| 1990-1999 | G06 | 1.00 | 1.00 | 1.00 | 1.00 | 0.47 | ||||
| 1990-1999 | H04W | 1.00 | 1.00 | 1.00 | 1.00 | 0.47 | 0.96 | |||
| 1990-1999 | C12 | 1.00 | 1.00 | 1.00 | 1.00 | 1.00 | 1.00 | 1.00 | ||
| 1990-1999 | B82 | 1.00 | 1.00 | 1.00 | 1.00 | 0.18 | 1.00 | 1.00 | 1.00 | |
| 1990-1999 | Y02 | 1.00 | 0.33 | 1.00 | 0.33 | 1.00 | 0.18 | 0.47 | 1.00 | 0.47 |
| 2000-2009 | Science | 1.00 | ||||||||
| 2000-2009 | WIPO | 1.00 | 1.00 | |||||||
| 2000-2009 | USPTO | 1.00 | 1.00 | 1.00 | ||||||
| 2000-2009 | All | 1.00 | 0.43 | 1.00 | 0.26 | |||||
| 2000-2009 | G06 | 1.00 | 1.00 | 1.00 | 1.00 | 0.56 | ||||
| 2000-2009 | H04W | 1.00 | 1.00 | 1.00 | 1.00 | 1.00 | 1.00 | |||
| 2000-2009 | C12 | 1.00 | 0.43 | 1.00 | 0.78 | 1.00 | 1.00 | 1.00 | ||
| 2000-2009 | B82 | 1.00 | 1.00 | 1.00 | 1.00 | 0.43 | 1.00 | 1.00 | 1.00 | |
| 2000-2009 | Y02 | 1.00 | 1.00 | 1.00 | 1.00 | 1.00 | 1.00 | 1.00 | 1.00 | 1.00 |
| 2010-2019 | Science | 0.55 | ||||||||
| 2010-2019 | WIPO | 1.00 | 0.74 | |||||||
| 2010-2019 | USPTO | 0.89 | 1.00 | 0.89 | ||||||
| 2010-2019 | All | 0.14 | 0.74 | 0.09 | 0.98 | |||||
| 2010-2019 | G06 | 0.89 | 1.00 | 0.30 | 1.00 | 0.09 | ||||
| 2010-2019 | H04W | 1.00 | 0.98 | 1.00 | 1.00 | 0.14 | 1.00 | |||
| 2010-2019 | C12 | 1.00 | 1.00 | 0.30 | 1.00 | 1.00 | 1.00 | 0.19 | ||
| 2010-2019 | B82 | 0.09 | 0.09 | 0.09 | 0.09 | 0.09 | 0.09 | 0.09 | 0.40 | |
| 2010-2019 | Y02 | 1.00 | 1.00 | 1.00 | 1.00 | 0.19 | 1.00 | 0.89 | 0.74 | 0.09 |
| Keyword | Science | WIPO | USPTO | All | G06 | H04W | C12 | B82 | Y02 | |
|---|---|---|---|---|---|---|---|---|---|---|
| Mean 1990-2019 | 0.16 | 0.15 | 0.14 | 0.13 | 0.05 | 0.13 | 0.21 | 0.08 | 0.08 | 0.08 |
| Median 1990-2019 | 0.10 | 0.12 | 0.12 | 0.09 | 0.03 | 0.08 | 0.17 | 0.05 | 0.08 | 0.07 |
| St.dev. 1990-2019 | 0.24 | 0.17 | 0.16 | 0.16 | 0.10 | 0.15 | 0.20 | 0.15 | 0.16 | 0.10 |
| Mean 1990-1999 | 0.21 | 0.26 | 0.16 | 0.20 | 0.06 | 0.19 | 0.32 | 0.18 | 0.17 | 0.08 |
| Median 1990-1999 | 0.10 | 0.27 | 0.09 | 0.12 | 0.03 | 0.16 | 0.30 | 0.13 | 0.09 | 0.07 |
| St.dev. 1990-1999 | 0.29 | 0.17 | 0.17 | 0.19 | 0.10 | 0.18 | 0.23 | 0.17 | 0.14 | 0.07 |
| Mean 2000-2009 | 0.06 | 0.10 | 0.09 | 0.09 | 0.01 | 0.08 | 0.12 | -0.01 | 0.09 | 0.03 |
| Median 2000-2009 | -0.00 | 0.06 | 0.07 | 0.09 | 0.01 | 0.07 | 0.07 | -0.06 | 0.09 | 0.02 |
| St.dev. 2000-2009 | 0.24 | 0.18 | 0.19 | 0.15 | 0.09 | 0.15 | 0.21 | 0.14 | 0.13 | 0.09 |
| Mean 2010-2019 | 0.22 | 0.11 | 0.18 | 0.12 | 0.08 | 0.12 | 0.19 | 0.09 | -0.02 | 0.14 |
| Median 2010-2019 | 0.19 | 0.07 | 0.16 | 0.08 | 0.07 | 0.09 | 0.19 | 0.06 | -0.03 | 0.11 |
| St.dev. 2010-2019 | 0.17 | 0.13 | 0.09 | 0.15 | 0.10 | 0.12 | 0.12 | 0.09 | 0.16 | 0.12 |
| period | pair | Keyword | Science | WIPO | USPTO | G06 | H04W | C12 | B82 |
|---|---|---|---|---|---|---|---|---|---|
| 1990-2019 | Science | 0.65 | |||||||
| 1990-2019 | WIPO | 1.00 | 1.00 | ||||||
| 1990-2019 | USPTO | 0.67 | 0.00 | 0.01 | |||||
| 1990-2019 | G06 | 0.09 | 0.00 | 0.00 | 1.00 | ||||
| 1990-2019 | H04W | 0.17 | 0.85 | 1.00 | 0.01 | 0.00 | |||
| 1990-2019 | C12 | 1.00 | 0.65 | 1.00 | 1.00 | 1.00 | 0.11 | ||
| 1990-2019 | B82 | 1.00 | 1.00 | 1.00 | 1.00 | 1.00 | 1.00 | 1.00 | |
| 1990-2019 | Y02 | 1.00 | 0.12 | 1.00 | 1.00 | 1.00 | 0.05 | 1.00 | 1.00 |
| 1990-1999 | Science | 0.14 | |||||||
| 1990-1999 | WIPO | 0.14 | 1.00 | ||||||
| 1990-1999 | USPTO | 1.00 | 0.14 | 0.24 | |||||
| 1990-1999 | G06 | 1.00 | 1.00 | 0.14 | 1.00 | ||||
| 1990-1999 | H04W | 0.24 | 1.00 | 1.00 | 1.00 | 0.14 | |||
| 1990-1999 | C12 | 1.00 | 1.00 | 1.00 | 1.00 | 1.00 | 0.79 | ||
| 1990-1999 | B82 | 1.00 | 1.00 | 1.00 | 1.00 | 1.00 | 1.00 | 1.00 | |
| 1990-1999 | Y02 | 1.00 | 1.00 | 1.00 | 1.00 | 1.00 | 1.00 | 1.00 | 1.00 |
| 2000-2009 | Science | 1.00 | |||||||
| 2000-2009 | WIPO | 1.00 | 1.00 | ||||||
| 2000-2009 | USPTO | 1.00 | 0.70 | 1.00 | |||||
| 2000-2009 | G06 | 1.00 | 1.00 | 1.00 | 1.00 | ||||
| 2000-2009 | H04W | 1.00 | 1.00 | 1.00 | 1.00 | 0.96 | |||
| 2000-2009 | C12 | 1.00 | 1.00 | 1.00 | 1.00 | 1.00 | 1.00 | ||
| 2000-2009 | B82 | 1.00 | 1.00 | 1.00 | 1.00 | 1.00 | 1.00 | 1.00 | |
| 2000-2009 | Y02 | 0.96 | 1.00 | 1.00 | 1.00 | 1.00 | 1.00 | 1.00 | 1.00 |
| 2010-2019 | Science | 1.00 | |||||||
| 2010-2019 | WIPO | 1.00 | 1.00 | ||||||
| 2010-2019 | USPTO | 1.00 | 0.66 | 1.00 | |||||
| 2010-2019 | G06 | 1.00 | 0.21 | 0.66 | 1.00 | ||||
| 2010-2019 | H04W | 1.00 | 1.00 | 1.00 | 1.00 | 0.48 | |||
| 2010-2019 | C12 | 1.00 | 1.00 | 1.00 | 1.00 | 1.00 | 1.00 | ||
| 2010-2019 | B82 | 1.00 | 1.00 | 1.00 | 1.00 | 1.00 | 1.00 | 1.00 | |
| 2010-2019 | Y02 | 1.00 | 1.00 | 1.00 | 1.00 | 1.00 | 1.00 | 1.00 | 1.00 |
| Keyword | Science | WIPO | USPTO | G06 | H04W | C12 | B82 | Y02 | |
|---|---|---|---|---|---|---|---|---|---|
| Mean 1990-2019 | 0.30 | 0.75 | 1.74 | 0.53 | 0.96 | 1.29 | 0.70 | 1.67 | 0.70 |
| Median 1990-2019 | 0.11 | 0.13 | 0.12 | 0.09 | 0.11 | 0.19 | 0.08 | 0.12 | 0.10 |
| St.dev. 1990-2019 | 0.48 | 2.56 | 8.01 | 1.71 | 4.08 | 5.34 | 2.58 | 7.77 | 2.65 |
| Mean 1990-1999 | 0.73 | 2.15 | 5.38 | 1.52 | 2.91 | 3.89 | 2.07 | 5.14 | 2.07 |
| Median 1990-1999 | 0.54 | 0.58 | 0.68 | 0.54 | 0.44 | 0.73 | 0.43 | 0.39 | 0.40 |
| St.dev. 1990-1999 | 0.68 | 4.43 | 14.24 | 2.93 | 7.21 | 9.43 | 4.50 | 13.83 | 4.63 |
| Mean 2000-2009 | 0.14 | 0.13 | 0.13 | 0.10 | 0.11 | 0.17 | 0.11 | 0.16 | 0.10 |
| Median 2000-2009 | 0.11 | 0.10 | 0.12 | 0.09 | 0.09 | 0.12 | 0.04 | 0.13 | 0.09 |
| St.dev. 2000-2009 | 0.16 | 0.16 | 0.16 | 0.13 | 0.13 | 0.19 | 0.22 | 0.17 | 0.15 |
| Mean 2010-2019 | 0.08 | 0.09 | 0.09 | 0.06 | 0.05 | 0.09 | 0.07 | 0.07 | 0.07 |
| Median 2010-2019 | 0.07 | 0.07 | 0.08 | 0.05 | 0.05 | 0.09 | 0.06 | 0.06 | 0.07 |
| St.dev. 2010-2019 | 0.12 | 0.13 | 0.14 | 0.10 | 0.10 | 0.13 | 0.15 | 0.13 | 0.10 |
C.2.2 Generality
| Period | 1-digit | Keyword | Science | WIPO | USPTO | All | G06 | H04W | C12 | B82 |
|---|---|---|---|---|---|---|---|---|---|---|
| 1990-2019 | Science | 0.00 | ||||||||
| 1990-2019 | WIPO | 0.00 | 0.05 | |||||||
| 1990-2019 | USPTO | 0.00 | 0.00 | 0.00 | ||||||
| 1990-2019 | All | 0.00 | 0.00 | 0.00 | 0.00 | |||||
| 1990-2019 | G06 | 0.00 | 0.00 | 0.00 | 0.00 | 0.00 | ||||
| 1990-2019 | H04W | 0.00 | 0.00 | 0.00 | 0.00 | 0.00 | 0.03 | |||
| 1990-2019 | C12 | 0.00 | 0.47 | 0.47 | 0.00 | 0.00 | 0.00 | 0.00 | ||
| 1990-2019 | B82 | 0.00 | 0.00 | 0.00 | 0.00 | 0.00 | 0.00 | 0.00 | 0.00 | |
| 1990-2019 | Y02 | 0.00 | 0.00 | 0.00 | 0.00 | 0.00 | 0.00 | 0.00 | 0.00 | 0.00 |
| 1990-1999 | Science | 0.14 | ||||||||
| 1990-1999 | WIPO | 0.11 | 0.77 | |||||||
| 1990-1999 | USPTO | 0.09 | 0.09 | 0.09 | ||||||
| 1990-1999 | All | 0.09 | 0.09 | 0.09 | 0.09 | |||||
| 1990-1999 | G06 | 0.09 | 0.09 | 0.09 | 0.09 | 0.09 | ||||
| 1990-1999 | H04W | 0.09 | 0.09 | 0.09 | 0.09 | 0.09 | 0.25 | |||
| 1990-1999 | C12 | 0.09 | 0.20 | 0.14 | 0.32 | 0.09 | 0.09 | 0.09 | ||
| 1990-1999 | B82 | 0.14 | 0.09 | 0.09 | 0.09 | 0.09 | 0.09 | 0.09 | 0.09 | |
| 1990-1999 | Y02 | 0.09 | 0.09 | 0.09 | 0.09 | 0.09 | 0.09 | 0.09 | 0.09 | 0.09 |
| 2000-2009 | Science | 0.09 | ||||||||
| 2000-2009 | WIPO | 0.09 | 0.09 | |||||||
| 2000-2009 | USPTO | 0.09 | 0.09 | 0.09 | ||||||
| 2000-2009 | All | 0.09 | 0.09 | 0.09 | 0.09 | |||||
| 2000-2009 | G06 | 0.09 | 0.09 | 0.09 | 0.09 | 0.09 | ||||
| 2000-2009 | H04W | 0.09 | 0.09 | 0.09 | 0.09 | 0.09 | 0.09 | |||
| 2000-2009 | C12 | 0.09 | 0.09 | 0.09 | 0.09 | 0.09 | 0.09 | 0.09 | ||
| 2000-2009 | B82 | 0.09 | 0.09 | 0.09 | 0.09 | 0.09 | 0.09 | 0.09 | 0.09 | |
| 2000-2009 | Y02 | 0.09 | 0.09 | 0.09 | 0.09 | 0.09 | 0.09 | 0.09 | 0.09 | 0.09 |
| 2010-2019 | Science | 0.09 | ||||||||
| 2010-2019 | WIPO | 0.09 | 0.22 | |||||||
| 2010-2019 | USPTO | 0.09 | 0.09 | 0.09 | ||||||
| 2010-2019 | All | 0.09 | 0.09 | 0.09 | 0.09 | |||||
| 2010-2019 | G06 | 0.09 | 0.09 | 0.09 | 0.22 | 0.09 | ||||
| 2010-2019 | H04W | 0.09 | 0.09 | 0.09 | 0.22 | 0.09 | 0.49 | |||
| 2010-2019 | C12 | 0.22 | 0.22 | 0.19 | 0.09 | 0.09 | 0.09 | 0.09 | ||
| 2010-2019 | B82 | 0.11 | 0.09 | 0.09 | 0.09 | 0.09 | 0.09 | 0.09 | 0.09 | |
| 2010-2019 | Y02 | 0.09 | 0.09 | 0.09 | 0.09 | 0.09 | 0.09 | 0.09 | 0.09 | 0.09 |
| Keyword | Science | WIPO | USPTO | All | G06 | H04W | C12 | B82 | Y02 | |
|---|---|---|---|---|---|---|---|---|---|---|
| Mean 1990-2019 | 0.76 | 0.73 | 0.72 | 0.68 | 0.82 | 0.64 | 0.62 | 0.73 | 0.79 | 0.84 |
| Median 1990-2019 | 0.76 | 0.73 | 0.72 | 0.68 | 0.81 | 0.63 | 0.62 | 0.73 | 0.79 | 0.85 |
| St.dev. 1990-2019 | 0.02 | 0.02 | 0.02 | 0.02 | 0.02 | 0.02 | 0.03 | 0.02 | 0.01 | 0.01 |
| Mean 1990-1999 | 0.77 | 0.74 | 0.75 | 0.7 | 0.84 | 0.64 | 0.62 | 0.72 | 0.8 | 0.85 |
| Median 1990-1999 | 0.77 | 0.75 | 0.76 | 0.71 | 0.84 | 0.64 | 0.63 | 0.73 | 0.8 | 0.85 |
| St.dev. 1990-1999 | 0.02 | 0.02 | 0.02 | 0.02 | 0.01 | 0.02 | 0.03 | 0.01 | 0.01 | 0 |
| Mean 2000-2009 | 0.76 | 0.73 | 0.71 | 0.67 | 0.81 | 0.62 | 0.6 | 0.74 | 0.78 | 0.84 |
| Median 2000-2009 | 0.76 | 0.73 | 0.72 | 0.68 | 0.81 | 0.61 | 0.59 | 0.74 | 0.79 | 0.85 |
| St.dev. 2000-2009 | 0.01 | 0.01 | 0.01 | 0 | 0.01 | 0.01 | 0.02 | 0.01 | 0.01 | 0.01 |
| Mean 2010-2019 | 0.76 | 0.72 | 0.71 | 0.67 | 0.81 | 0.65 | 0.65 | 0.73 | 0.78 | 0.84 |
| Median 2010-2019 | 0.76 | 0.72 | 0.71 | 0.67 | 0.8 | 0.64 | 0.66 | 0.74 | 0.78 | 0.84 |
| St.dev. 2010-2019 | 0.02 | 0.01 | 0.01 | 0.01 | 0 | 0.02 | 0.02 | 0.03 | 0.01 | 0 |
| Period | 3-digit | Keyword | Science | WIPO | USPTO | All | G06 | H04W | C12 | B82 |
|---|---|---|---|---|---|---|---|---|---|---|
| 1990-2019 | Science | 0.00 | ||||||||
| 1990-2019 | WIPO | 0.00 | 0.90 | |||||||
| 1990-2019 | USPTO | 0.00 | 0.00 | 0.00 | ||||||
| 1990-2019 | All | 0.00 | 0.00 | 0.00 | 0.00 | |||||
| 1990-2019 | G06 | 0.00 | 0.00 | 0.00 | 0.00 | 0.00 | ||||
| 1990-2019 | H04W | 0.00 | 0.00 | 0.00 | 0.23 | 0.00 | 0.90 | |||
| 1990-2019 | C12 | 0.00 | 0.03 | 0.01 | 0.14 | 0.00 | 0.00 | 0.00 | ||
| 1990-2019 | B82 | 0.14 | 0.00 | 0.00 | 0.00 | 0.00 | 0.00 | 0.00 | 0.00 | |
| 1990-2019 | Y02 | 0.00 | 0.00 | 0.00 | 0.00 | 0.34 | 0.00 | 0.00 | 0.00 | 0.00 |
| 1990-1999 | Science | 0.09 | ||||||||
| 1990-1999 | WIPO | 0.09 | 1.00 | |||||||
| 1990-1999 | USPTO | 0.09 | 0.10 | 0.09 | ||||||
| 1990-1999 | All | 0.09 | 0.09 | 0.09 | 0.09 | |||||
| 1990-1999 | G06 | 0.09 | 0.09 | 0.09 | 0.09 | 0.09 | ||||
| 1990-1999 | H04W | 0.09 | 0.09 | 0.09 | 0.09 | 0.09 | 1.00 | |||
| 1990-1999 | C12 | 0.09 | 0.09 | 0.09 | 0.22 | 0.09 | 1.00 | 1.00 | ||
| 1990-1999 | B82 | 1.00 | 0.09 | 0.09 | 0.09 | 0.09 | 0.09 | 0.09 | 0.09 | |
| 1990-1999 | Y02 | 0.09 | 0.09 | 0.09 | 0.09 | 0.09 | 0.09 | 0.09 | 0.09 | 0.09 |
| 2000-2009 | Science | 0.09 | ||||||||
| 2000-2009 | WIPO | 0.09 | 0.19 | |||||||
| 2000-2009 | USPTO | 0.09 | 0.09 | 0.09 | ||||||
| 2000-2009 | All | 0.09 | 0.09 | 0.09 | 0.09 | |||||
| 2000-2009 | G06 | 0.09 | 0.09 | 0.09 | 0.09 | 0.09 | ||||
| 2000-2009 | H04W | 0.09 | 0.09 | 0.09 | 0.09 | 0.09 | 1.00 | |||
| 2000-2009 | C12 | 0.09 | 0.09 | 0.10 | 0.09 | 0.09 | 0.09 | 0.09 | ||
| 2000-2009 | B82 | 0.11 | 0.09 | 0.09 | 0.09 | 0.09 | 0.09 | 0.09 | 0.09 | |
| 2000-2009 | Y02 | 0.09 | 0.09 | 0.09 | 0.09 | 1.00 | 0.09 | 0.09 | 0.09 | 0.09 |
| 2010-2019 | Science | 0.09 | ||||||||
| 2010-2019 | WIPO | 0.09 | 0.59 | |||||||
| 2010-2019 | USPTO | 0.09 | 0.09 | 0.09 | ||||||
| 2010-2019 | All | 0.09 | 0.09 | 0.09 | 0.09 | |||||
| 2010-2019 | G06 | 0.09 | 0.09 | 0.09 | 1.00 | 0.09 | ||||
| 2010-2019 | H04W | 0.09 | 0.97 | 0.09 | 0.59 | 0.09 | 0.16 | |||
| 2010-2019 | C12 | 0.09 | 0.09 | 1.00 | 0.09 | 0.09 | 0.09 | 0.12 | ||
| 2010-2019 | B82 | 0.97 | 0.09 | 0.09 | 0.09 | 0.09 | 0.09 | 0.09 | 0.09 | |
| 2010-2019 | Y02 | 0.09 | 0.09 | 0.09 | 0.09 | 0.97 | 0.09 | 0.09 | 0.09 | 0.09 |
| Keyword | Science | WIPO | USPTO | All | G06 | H04W | C12 | B82 | Y02 | |
|---|---|---|---|---|---|---|---|---|---|---|
| Mean 1990-2019 | 0.9 | 0.87 | 0.87 | 0.84 | 0.95 | 0.82 | 0.82 | 0.85 | 0.91 | 0.94 |
| Median 1990-2019 | 0.9 | 0.86 | 0.86 | 0.83 | 0.95 | 0.82 | 0.82 | 0.85 | 0.92 | 0.94 |
| St.dev. 1990-2019 | 0.02 | 0.02 | 0.02 | 0.02 | 0.01 | 0.02 | 0.02 | 0.01 | 0.01 | 0.01 |
| Mean 1990-1999 | 0.92 | 0.88 | 0.89 | 0.86 | 0.96 | 0.84 | 0.83 | 0.84 | 0.92 | 0.95 |
| Median 1990-1999 | 0.92 | 0.88 | 0.89 | 0.87 | 0.96 | 0.85 | 0.83 | 0.84 | 0.92 | 0.95 |
| St.dev. 1990-1999 | 0.02 | 0.01 | 0.02 | 0.02 | 0.01 | 0.02 | 0.02 | 0.01 | 0.01 | 0 |
| Mean 2000-2009 | 0.9 | 0.87 | 0.86 | 0.83 | 0.94 | 0.81 | 0.81 | 0.85 | 0.91 | 0.95 |
| Median 2000-2009 | 0.9 | 0.87 | 0.86 | 0.83 | 0.95 | 0.81 | 0.81 | 0.85 | 0.92 | 0.94 |
| St.dev. 2000-2009 | 0.01 | 0.01 | 0.01 | 0.01 | 0 | 0.01 | 0.01 | 0.01 | 0.01 | 0 |
| Mean 2010-2019 | 0.89 | 0.85 | 0.86 | 0.81 | 0.94 | 0.82 | 0.83 | 0.86 | 0.9 | 0.94 |
| Median 2010-2019 | 0.9 | 0.85 | 0.86 | 0.81 | 0.94 | 0.82 | 0.84 | 0.86 | 0.9 | 0.94 |
| St.dev. 2010-2019 | 0.02 | 0.01 | 0.01 | 0.01 | 0 | 0.01 | 0.02 | 0.01 | 0.02 | 0.01 |
| Period | 4-digit | Keyword | Science | WIPO | USPTO | All | G06 | H04W | C12 | B82 |
|---|---|---|---|---|---|---|---|---|---|---|
| 1990-2019 | Science | 0.00 | ||||||||
| 1990-2019 | WIPO | 0.00 | 0.00 | |||||||
| 1990-2019 | USPTO | 0.00 | 0.00 | 0.00 | ||||||
| 1990-2019 | All | 0.00 | 0.00 | 0.00 | 0.00 | |||||
| 1990-2019 | G06 | 0.00 | 0.00 | 0.00 | 0.00 | 0.00 | ||||
| 1990-2019 | H04W | 0.00 | 0.00 | 0.00 | 0.00 | 0.00 | 0.00 | |||
| 1990-2019 | C12 | 0.00 | 0.00 | 0.42 | 0.01 | 0.00 | 0.00 | 0.00 | ||
| 1990-2019 | B82 | 0.04 | 0.04 | 0.01 | 0.00 | 0.00 | 0.00 | 0.00 | 0.00 | |
| 1990-2019 | Y02 | 0.00 | 0.00 | 0.00 | 0.00 | 0.00 | 0.00 | 0.00 | 0.00 | 0.00 |
| 1990-1999 | Science | 0.09 | ||||||||
| 1990-1999 | WIPO | 0.09 | 0.42 | |||||||
| 1990-1999 | USPTO | 0.09 | 0.97 | 1.00 | ||||||
| 1990-1999 | All | 0.09 | 0.09 | 0.09 | 0.09 | |||||
| 1990-1999 | G06 | 0.09 | 0.09 | 0.09 | 0.09 | 0.09 | ||||
| 1990-1999 | H04W | 0.09 | 0.09 | 0.09 | 0.09 | 0.09 | 0.09 | |||
| 1990-1999 | C12 | 0.09 | 0.09 | 0.10 | 0.39 | 0.09 | 0.09 | 0.09 | ||
| 1990-1999 | B82 | 1.00 | 0.09 | 0.09 | 0.09 | 0.09 | 0.09 | 0.09 | 0.09 | |
| 1990-1999 | Y02 | 0.09 | 0.09 | 0.09 | 0.09 | 0.64 | 0.09 | 0.09 | 0.09 | 0.09 |
| 2000-2009 | Science | 0.09 | ||||||||
| 2000-2009 | WIPO | 0.09 | 0.09 | |||||||
| 2000-2009 | USPTO | 0.09 | 0.09 | 0.09 | ||||||
| 2000-2009 | All | 0.09 | 0.09 | 0.09 | 0.09 | |||||
| 2000-2009 | G06 | 0.09 | 0.09 | 0.09 | 0.09 | 0.09 | ||||
| 2000-2009 | H04W | 0.09 | 0.09 | 0.09 | 0.09 | 0.09 | 0.09 | |||
| 2000-2009 | C12 | 0.09 | 0.10 | 0.09 | 0.09 | 0.09 | 0.09 | 0.09 | ||
| 2000-2009 | B82 | 0.23 | 0.09 | 0.09 | 0.09 | 0.09 | 0.09 | 0.09 | 0.09 | |
| 2000-2009 | Y02 | 0.09 | 0.09 | 0.09 | 0.09 | 0.09 | 0.09 | 0.09 | 0.09 | 0.09 |
| 2010-2019 | Science | 1.00 | ||||||||
| 2010-2019 | WIPO | 0.67 | 0.58 | |||||||
| 2010-2019 | USPTO | 0.09 | 0.09 | 0.09 | ||||||
| 2010-2019 | All | 0.09 | 0.09 | 0.09 | 0.09 | |||||
| 2010-2019 | G06 | 0.09 | 0.09 | 0.09 | 1.00 | 0.09 | ||||
| 2010-2019 | H04W | 0.09 | 0.09 | 0.09 | 0.09 | 0.09 | 0.09 | |||
| 2010-2019 | C12 | 0.09 | 0.49 | 1.00 | 0.09 | 0.09 | 0.09 | 0.09 | ||
| 2010-2019 | B82 | 0.21 | 1.00 | 1.00 | 0.18 | 0.09 | 0.18 | 0.09 | 1.00 | |
| 2010-2019 | Y02 | 0.09 | 0.09 | 0.09 | 0.09 | 1.00 | 0.09 | 0.09 | 0.09 | 0.09 |
| Keyword | Science | WIPO | USPTO | All | G06 | H04W | C12 | B82 | Y02 | |
| Mean 1990-2019 | 0.96 | 0.95 | 0.94 | 0.93 | 0.98 | 0.92 | 0.89 | 0.94 | 0.95 | 0.98 |
| Median 1990-2019 | 0.96 | 0.95 | 0.94 | 0.93 | 0.98 | 0.92 | 0.88 | 0.94 | 0.95 | 0.98 |
| St.dev. 1990-2019 | 0.01 | 0.01 | 0.01 | 0.01 | 0 | 0.01 | 0.01 | 0.01 | 0.02 | 0.01 |
| Mean 1990-1999 | 0.96 | 0.95 | 0.95 | 0.95 | 0.99 | 0.93 | 0.89 | 0.94 | 0.96 | 0.99 |
| Median 1990-1999 | 0.97 | 0.95 | 0.95 | 0.95 | 0.98 | 0.93 | 0.89 | 0.94 | 0.97 | 0.99 |
| St.dev. 1990-1999 | 0.01 | 0.01 | 0.01 | 0.01 | 0 | 0.01 | 0.01 | 0 | 0 | 0 |
| Mean 2000-2009 | 0.96 | 0.94 | 0.94 | 0.93 | 0.98 | 0.92 | 0.88 | 0.94 | 0.95 | 0.98 |
| Median 2000-2009 | 0.96 | 0.95 | 0.94 | 0.93 | 0.98 | 0.92 | 0.88 | 0.94 | 0.95 | 0.98 |
| St.dev. 2000-2009 | 0 | 0 | 0 | 0 | 0 | 0 | 0 | 0 | 0.01 | 0 |
| Mean 2010-2019 | 0.95 | 0.94 | 0.94 | 0.92 | 0.98 | 0.92 | 0.89 | 0.93 | 0.94 | 0.98 |
| Median 2010-2019 | 0.95 | 0.94 | 0.94 | 0.92 | 0.98 | 0.92 | 0.89 | 0.94 | 0.94 | 0.98 |
| St.dev. 2010-2019 | 0.01 | 0 | 0.01 | 0 | 0 | 0 | 0.01 | 0.01 | 0.02 | 0.01 |
| Period | 1-digit | Keyword | Science | WIPO | USPTO | All | G06 | H04W | C12 | B82 |
|---|---|---|---|---|---|---|---|---|---|---|
| 1990-2019 | Science | 0.00 | ||||||||
| 1990-2019 | WIPO | 0.00 | 1.00 | |||||||
| 1990-2019 | USPTO | 0.00 | 0.00 | 0.00 | ||||||
| 1990-2019 | All | 0.00 | 0.00 | 0.00 | 0.00 | |||||
| 1990-2019 | G06 | 0.00 | 0.00 | 0.00 | 0.01 | 1.00 | ||||
| 1990-2019 | H04W | 0.00 | 0.00 | 0.00 | 0.00 | 1.00 | 1.00 | |||
| 1990-2019 | C12 | 0.00 | 1.00 | 1.00 | 0.00 | 0.00 | 0.00 | 0.00 | ||
| 1990-2019 | B82 | 0.00 | 0.00 | 0.00 | 0.00 | 0.00 | 0.00 | 0.00 | 0.00 | |
| 1990-2019 | Y02 | 0.00 | 0.00 | 0.00 | 0.00 | 0.00 | 0.00 | 0.00 | 0.00 | 1.00 |
| 1990-1999 | Science | 0.09 | ||||||||
| 1990-1999 | WIPO | 0.09 | 1.00 | |||||||
| 1990-1999 | USPTO | 0.09 | 1.00 | 1.00 | ||||||
| 1990-1999 | All | 0.09 | 0.09 | 0.09 | 0.09 | |||||
| 1990-1999 | G06 | 0.09 | 0.09 | 0.09 | 0.09 | 0.09 | ||||
| 1990-1999 | H04W | 0.09 | 1.00 | 1.00 | 1.00 | 0.21 | 0.09 | |||
| 1990-1999 | C12 | 0.09 | 1.00 | 0.84 | 0.84 | 0.09 | 0.09 | 0.84 | ||
| 1990-1999 | B82 | 0.09 | 0.09 | 0.09 | 0.09 | 0.09 | 0.09 | 0.09 | 0.09 | |
| 1990-1999 | Y02 | 0.09 | 0.09 | 0.09 | 0.09 | 0.09 | 0.09 | 0.09 | 0.09 | 0.12 |
| 2000-2009 | Science | 0.09 | ||||||||
| 2000-2009 | WIPO | 0.09 | 0.75 | |||||||
| 2000-2009 | USPTO | 0.09 | 0.09 | 0.09 | ||||||
| 2000-2009 | All | 0.09 | 0.09 | 0.09 | 0.09 | |||||
| 2000-2009 | G06 | 0.09 | 0.09 | 0.09 | 0.09 | 0.92 | ||||
| 2000-2009 | H04W | 0.09 | 0.09 | 0.09 | 0.09 | 0.09 | 0.09 | |||
| 2000-2009 | C12 | 0.09 | 0.09 | 0.09 | 0.09 | 0.09 | 0.09 | 0.09 | ||
| 2000-2009 | B82 | 0.09 | 0.09 | 0.09 | 0.09 | 0.09 | 0.09 | 0.09 | 0.09 | |
| 2000-2009 | Y02 | 0.09 | 0.09 | 0.09 | 0.09 | 0.09 | 0.09 | 0.09 | 0.09 | 0.11 |
| 2010-2019 | Science | 0.22 | ||||||||
| 2010-2019 | WIPO | 0.22 | 0.09 | |||||||
| 2010-2019 | USPTO | 0.09 | 0.09 | 0.09 | ||||||
| 2010-2019 | All | 0.09 | 0.09 | 0.09 | 0.75 | |||||
| 2010-2019 | G06 | 0.09 | 0.09 | 0.09 | 0.09 | 0.22 | ||||
| 2010-2019 | H04W | 0.09 | 0.09 | 0.09 | 0.09 | 0.22 | 0.09 | |||
| 2010-2019 | C12 | 0.09 | 0.25 | 1.00 | 0.09 | 0.09 | 0.09 | 0.09 | ||
| 2010-2019 | B82 | 0.09 | 0.22 | 0.10 | 0.09 | 0.09 | 0.09 | 0.09 | 0.09 | |
| 2010-2019 | Y02 | 0.09 | 0.10 | 0.09 | 0.09 | 0.09 | 0.09 | 0.09 | 0.09 | 0.09 |
| Keyword | Science | WIPO | USPTO | All | G06 | H04W | C12 | B82 | Y02 | |
|---|---|---|---|---|---|---|---|---|---|---|
| Mean 1990-2019 | 2.15 | 1.83 | 1.82 | 1.68 | 1.55 | 1.54 | 1.54 | 1.81 | 2.82 | 2.8 |
| Median 1990-2019 | 2.51 | 2.06 | 2.17 | 1.86 | 1.74 | 1.74 | 1.64 | 1.93 | 3.43 | 3.29 |
| St.dev. 1990-2019 | 0.93 | 0.76 | 0.79 | 0.82 | 0.72 | 0.68 | 0.81 | 0.8 | 1.27 | 1.17 |
| Mean 1990-1999 | 2.97 | 2.54 | 2.52 | 2.5 | 2.24 | 2.17 | 2.44 | 2.61 | 3.85 | 3.78 |
| Median 1990-1999 | 2.96 | 2.54 | 2.52 | 2.52 | 2.25 | 2.16 | 2.44 | 2.59 | 3.87 | 3.79 |
| St.dev. 1990-1999 | 0.12 | 0.06 | 0.08 | 0.09 | 0.04 | 0.04 | 0.21 | 0.1 | 0.08 | 0.07 |
| Mean 2000-2009 | 2.46 | 2.04 | 2.07 | 1.84 | 1.74 | 1.74 | 1.59 | 1.94 | 3.37 | 3.24 |
| Median 2000-2009 | 2.51 | 2.06 | 2.17 | 1.86 | 1.74 | 1.74 | 1.64 | 1.93 | 3.43 | 3.29 |
| St.dev. 2000-2009 | 0.42 | 0.35 | 0.43 | 0.4 | 0.31 | 0.33 | 0.28 | 0.34 | 0.52 | 0.37 |
| Mean 2010-2019 | 1.03 | 0.92 | 0.87 | 0.7 | 0.68 | 0.72 | 0.59 | 0.88 | 1.23 | 1.38 |
| Median 2010-2019 | 1.12 | 1.02 | 0.98 | 0.76 | 0.72 | 0.81 | 0.63 | 0.96 | 1.26 | 1.43 |
| St.dev. 2010-2019 | 0.56 | 0.45 | 0.43 | 0.37 | 0.4 | 0.37 | 0.32 | 0.49 | 0.76 | 0.85 |
| Period | 3-digit | Keyword | Science | WIPO | USPTO | All | G06 | H04W | C12 | B82 |
|---|---|---|---|---|---|---|---|---|---|---|
| 1990-2019 | Science | 0.00 | ||||||||
| 1990-2019 | WIPO | 0.00 | 0.00 | |||||||
| 1990-2019 | USPTO | 0.00 | 0.00 | 0.00 | ||||||
| 1990-2019 | All | 0.00 | 0.00 | 0.00 | 0.00 | |||||
| 1990-2019 | G06 | 0.00 | 0.00 | 0.00 | 0.00 | 0.00 | ||||
| 1990-2019 | H04W | 0.00 | 0.00 | 0.00 | 0.00 | 0.82 | 0.04 | |||
| 1990-2019 | C12 | 0.00 | 0.00 | 0.00 | 0.00 | 0.00 | 0.01 | 0.44 | ||
| 1990-2019 | B82 | 0.03 | 0.00 | 0.00 | 0.00 | 0.00 | 0.00 | 0.00 | 0.00 | |
| 1990-2019 | Y02 | 0.02 | 0.00 | 0.00 | 0.00 | 0.00 | 0.00 | 0.00 | 0.00 | 0.00 |
| 1990-1999 | Science | 0.09 | ||||||||
| 1990-1999 | WIPO | 0.09 | 0.34 | |||||||
| 1990-1999 | USPTO | 0.09 | 0.70 | 0.32 | ||||||
| 1990-1999 | All | 0.09 | 0.09 | 0.09 | 0.09 | |||||
| 1990-1999 | G06 | 0.09 | 0.09 | 0.09 | 0.09 | 0.09 | ||||
| 1990-1999 | H04W | 0.09 | 0.09 | 0.09 | 0.09 | 0.09 | 0.58 | |||
| 1990-1999 | C12 | 0.09 | 0.09 | 0.09 | 0.09 | 0.09 | 0.09 | 0.16 | ||
| 1990-1999 | B82 | 0.64 | 0.09 | 0.09 | 0.09 | 0.09 | 0.09 | 0.09 | 0.09 | |
| 1990-1999 | Y02 | 0.09 | 0.10 | 0.09 | 0.09 | 0.09 | 0.09 | 0.09 | 0.09 | 0.09 |
| 2000-2009 | Science | 0.09 | ||||||||
| 2000-2009 | WIPO | 0.09 | 0.09 | |||||||
| 2000-2009 | USPTO | 0.09 | 0.09 | 0.09 | ||||||
| 2000-2009 | All | 0.09 | 0.09 | 0.09 | 0.09 | |||||
| 2000-2009 | G06 | 0.09 | 0.09 | 0.09 | 0.09 | 0.09 | ||||
| 2000-2009 | H04W | 0.09 | 0.09 | 0.09 | 0.09 | 0.09 | 0.09 | |||
| 2000-2009 | C12 | 0.09 | 0.09 | 0.09 | 0.09 | 0.13 | 0.09 | 0.09 | ||
| 2000-2009 | B82 | 0.09 | 0.09 | 0.09 | 0.09 | 0.09 | 0.09 | 0.09 | 0.09 | |
| 2000-2009 | Y02 | 0.13 | 0.09 | 0.09 | 0.09 | 0.09 | 0.09 | 0.09 | 0.09 | 0.09 |
| 2010-2019 | Science | 0.25 | ||||||||
| 2010-2019 | WIPO | 0.27 | 0.67 | |||||||
| 2010-2019 | USPTO | 0.09 | 0.09 | 0.09 | ||||||
| 2010-2019 | All | 0.09 | 0.09 | 0.09 | 0.09 | |||||
| 2010-2019 | G06 | 0.09 | 0.09 | 0.09 | 1.00 | 0.25 | ||||
| 2010-2019 | H04W | 0.09 | 0.09 | 0.09 | 0.09 | 0.25 | 0.09 | |||
| 2010-2019 | C12 | 0.09 | 0.09 | 0.09 | 0.19 | 0.09 | 0.67 | 0.15 | ||
| 2010-2019 | B82 | 0.58 | 1.00 | 1.00 | 0.09 | 0.09 | 0.09 | 0.09 | 0.09 | |
| 2010-2019 | Y02 | 1.00 | 0.67 | 0.67 | 0.09 | 0.09 | 0.09 | 0.09 | 0.09 | 0.09 |
| Keyword | Science | WIPO | USPTO | All | G06 | H04W | C12 | B82 | Y02 | |
|---|---|---|---|---|---|---|---|---|---|---|
| Mean 1990-2019 | 5.18 | 4.14 | 4.39 | 3.91 | 3.1 | 3.47 | 3.23 | 3.24 | 5.51 | 4.9 |
| Median 1990-2019 | 6.01 | 4.54 | 5.12 | 4.15 | 3.43 | 3.74 | 3.25 | 3.37 | 6.78 | 5.73 |
| St.dev. 1990-2019 | 2.59 | 2.07 | 2.22 | 2.27 | 1.61 | 1.87 | 2.05 | 1.66 | 2.89 | 2.31 |
| Mean 1990-1999 | 7.61 | 6.28 | 6.48 | 6.32 | 4.71 | 5.39 | 5.62 | 5.02 | 7.86 | 7.01 |
| Median 1990-1999 | 7.65 | 6.16 | 6.48 | 6.38 | 4.73 | 5.42 | 5.73 | 4.95 | 7.94 | 7.09 |
| St.dev. 1990-1999 | 0.37 | 0.39 | 0.27 | 0.26 | 0.1 | 0.17 | 0.68 | 0.25 | 0.38 | 0.23 |
| Mean 2000-2009 | 5.91 | 4.46 | 4.99 | 4.18 | 3.44 | 3.79 | 3.13 | 3.4 | 6.79 | 5.64 |
| Median 2000-2009 | 6.01 | 4.54 | 5.12 | 4.15 | 3.43 | 3.74 | 3.25 | 3.37 | 6.78 | 5.73 |
| St.dev. 2000-2009 | 1.28 | 0.92 | 1.3 | 1.22 | 0.77 | 1.02 | 0.77 | 0.74 | 1.61 | 0.88 |
| Mean 2010-2019 | 2 | 1.67 | 1.7 | 1.23 | 1.16 | 1.24 | 0.93 | 1.31 | 1.89 | 2.06 |
| Median 2010-2019 | 2.11 | 1.79 | 1.85 | 1.28 | 1.19 | 1.35 | 0.96 | 1.39 | 1.82 | 2.05 |
| St.dev. 2010-2019 | 1.22 | 0.9 | 0.93 | 0.72 | 0.72 | 0.69 | 0.53 | 0.78 | 1.28 | 1.34 |
| Period | 4-digit | Keyword | Science | WIPO | USPTO | All | G06 | H04W | C12 | B82 |
|---|---|---|---|---|---|---|---|---|---|---|
| 1990-2019 | Science | 0.00 | ||||||||
| 1990-2019 | WIPO | 0.00 | 0.00 | |||||||
| 1990-2019 | USPTO | 0.00 | 0.16 | 0.00 | ||||||
| 1990-2019 | All | 0.00 | 0.00 | 0.00 | 0.00 | |||||
| 1990-2019 | G06 | 0.00 | 0.00 | 0.00 | 0.00 | 0.00 | ||||
| 1990-2019 | H04W | 0.00 | 0.82 | 0.28 | 0.06 | 0.00 | 0.00 | |||
| 1990-2019 | C12 | 0.00 | 0.00 | 0.00 | 0.00 | 0.00 | 0.04 | 0.00 | ||
| 1990-2019 | B82 | 0.00 | 0.09 | 0.57 | 0.00 | 0.00 | 0.00 | 0.16 | 0.00 | |
| 1990-2019 | Y02 | 0.00 | 0.16 | 0.16 | 0.08 | 0.00 | 0.00 | 0.74 | 0.00 | 0.09 |
| 1990-1999 | Science | 0.09 | ||||||||
| 1990-1999 | WIPO | 0.09 | 0.95 | |||||||
| 1990-1999 | USPTO | 0.09 | 1.00 | 1.00 | ||||||
| 1990-1999 | All | 0.09 | 0.09 | 0.09 | 0.09 | |||||
| 1990-1999 | G06 | 0.09 | 0.09 | 0.09 | 0.09 | 0.09 | ||||
| 1990-1999 | H04W | 1.00 | 0.09 | 0.77 | 0.09 | 0.09 | 0.09 | |||
| 1990-1999 | C12 | 0.09 | 0.09 | 0.09 | 0.09 | 0.09 | 1.00 | 0.09 | ||
| 1990-1999 | B82 | 0.09 | 0.95 | 1.00 | 0.77 | 0.09 | 0.09 | 1.00 | 0.09 | |
| 1990-1999 | Y02 | 0.09 | 1.00 | 0.09 | 0.84 | 0.09 | 0.09 | 0.25 | 0.09 | 0.09 |
| 2000-2009 | Science | 0.09 | ||||||||
| 2000-2009 | WIPO | 0.09 | 0.09 | |||||||
| 2000-2009 | USPTO | 0.09 | 0.80 | 0.09 | ||||||
| 2000-2009 | All | 0.09 | 0.09 | 0.09 | 0.09 | |||||
| 2000-2009 | G06 | 0.09 | 0.09 | 0.09 | 0.09 | 0.09 | ||||
| 2000-2009 | H04W | 0.09 | 0.09 | 0.09 | 1.00 | 0.09 | 0.09 | |||
| 2000-2009 | C12 | 0.09 | 0.09 | 0.09 | 0.09 | 1.00 | 0.09 | 0.09 | ||
| 2000-2009 | B82 | 1.00 | 0.09 | 0.09 | 0.09 | 0.09 | 0.09 | 0.09 | 0.09 | |
| 2000-2009 | Y02 | 0.09 | 0.09 | 0.93 | 0.09 | 0.09 | 0.09 | 0.09 | 0.09 | 0.12 |
| 2010-2019 | Science | 0.18 | ||||||||
| 2010-2019 | WIPO | 0.19 | 0.18 | |||||||
| 2010-2019 | USPTO | 0.09 | 0.09 | 0.09 | ||||||
| 2010-2019 | All | 0.09 | 0.09 | 0.09 | 0.09 | |||||
| 2010-2019 | G06 | 0.09 | 0.09 | 0.09 | 0.12 | 0.09 | ||||
| 2010-2019 | H04W | 0.09 | 0.09 | 0.09 | 0.09 | 0.09 | 0.09 | |||
| 2010-2019 | C12 | 0.09 | 0.09 | 0.09 | 0.18 | 0.09 | 1.00 | 0.09 | ||
| 2010-2019 | B82 | 0.09 | 0.09 | 0.09 | 0.18 | 0.09 | 0.14 | 0.77 | 0.09 | |
| 2010-2019 | Y02 | 0.09 | 1.00 | 1.00 | 0.09 | 0.09 | 0.09 | 0.12 | 0.09 | 0.09 |
| Keyword | Science | WIPO | USPTO | All | G06 | H04W | C12 | B82 | Y02 | |
|---|---|---|---|---|---|---|---|---|---|---|
| Mean 1990-2019 | 8.9 | 7.41 | 8.04 | 7.13 | 4.96 | 5.83 | 7.52 | 5.48 | 8.28 | 7.66 |
| Median 1990-2019 | 10.49 | 8.12 | 9.44 | 7.58 | 5.49 | 6.31 | 7.81 | 5.47 | 10.06 | 9.03 |
| St.dev. 1990-2019 | 4.48 | 3.76 | 4.12 | 4.21 | 2.59 | 3.2 | 4.63 | 3.01 | 4.65 | 3.76 |
| Mean 1990-1999 | 13.02 | 11.31 | 11.81 | 11.54 | 7.53 | 9.06 | 12.82 | 8.82 | 12.19 | 11.06 |
| Median 1990-1999 | 13.11 | 11.08 | 11.85 | 11.7 | 7.57 | 9.06 | 13.16 | 8.76 | 12.21 | 11.22 |
| St.dev. 1990-1999 | 0.51 | 0.67 | 0.41 | 0.31 | 0.23 | 0.16 | 1.28 | 0.51 | 0.86 | 0.51 |
| Mean 2000-2009 | 10.31 | 8 | 9.28 | 7.7 | 5.54 | 6.43 | 7.53 | 5.58 | 10.14 | 8.9 |
| Median 2000-2009 | 10.49 | 8.12 | 9.44 | 7.58 | 5.49 | 6.31 | 7.81 | 5.47 | 10.06 | 9.03 |
| St.dev. 2000-2009 | 2.26 | 1.69 | 2.51 | 2.37 | 1.28 | 1.83 | 1.82 | 1.34 | 2.84 | 1.56 |
| Mean 2010-2019 | 3.39 | 2.93 | 3.04 | 2.14 | 1.83 | 2.01 | 2.22 | 2.05 | 2.51 | 3.01 |
| Median 2010-2019 | 3.51 | 3.09 | 3.28 | 2.22 | 1.87 | 2.16 | 2.26 | 2.14 | 2.39 | 2.92 |
| St.dev. 2010-2019 | 2.13 | 1.64 | 1.74 | 1.32 | 1.17 | 1.18 | 1.34 | 1.25 | 1.75 | 2.04 |
| Period | 1-digit | Keyword | Science | WIPO | USPTO | All | G06 | H04W | C12 | B82 |
|---|---|---|---|---|---|---|---|---|---|---|
| 1990-2019 | Science | 0.00 | ||||||||
| 1990-2019 | WIPO | 0.00 | 1.00 | |||||||
| 1990-2019 | USPTO | 0.00 | 0.00 | 0.00 | ||||||
| 1990-2019 | All | 0.00 | 0.00 | 0.05 | 0.00 | |||||
| 1990-2019 | G06 | 0.00 | 0.00 | 0.00 | 0.02 | 0.00 | ||||
| 1990-2019 | H04W | 0.00 | 0.00 | 0.00 | 0.76 | 0.00 | 0.02 | |||
| 1990-2019 | C12 | 1.00 | 0.00 | 0.00 | 0.00 | 0.00 | 0.00 | 0.00 | ||
| 1990-2019 | B82 | 0.00 | 0.00 | 0.00 | 0.00 | 0.00 | 0.00 | 0.00 | 0.00 | |
| 1990-2019 | Y02 | 0.00 | 0.00 | 0.00 | 0.00 | 0.00 | 0.00 | 0.00 | 0.00 | 1.00 |
| 1990-1999 | Science | 0.09 | ||||||||
| 1990-1999 | WIPO | 0.09 | 1.00 | |||||||
| 1990-1999 | USPTO | 0.09 | 1.00 | 0.79 | ||||||
| 1990-1999 | All | 0.09 | 0.14 | 0.22 | 1.00 | |||||
| 1990-1999 | G06 | 0.09 | 0.09 | 0.09 | 0.09 | 0.09 | ||||
| 1990-1999 | H04W | 0.09 | 0.26 | 0.14 | 0.11 | 0.97 | 0.09 | |||
| 1990-1999 | C12 | 0.09 | 0.09 | 0.09 | 0.09 | 0.09 | 0.09 | 0.09 | ||
| 1990-1999 | B82 | 0.09 | 0.09 | 0.09 | 0.09 | 0.09 | 0.09 | 0.09 | 0.09 | |
| 1990-1999 | Y02 | 0.09 | 0.09 | 0.09 | 0.09 | 0.09 | 0.09 | 0.09 | 0.09 | 1.00 |
| 2000-2009 | Science | 0.09 | ||||||||
| 2000-2009 | WIPO | 0.09 | 0.97 | |||||||
| 2000-2009 | USPTO | 0.09 | 0.09 | 0.09 | ||||||
| 2000-2009 | All | 0.09 | 0.09 | 0.34 | 0.09 | |||||
| 2000-2009 | G06 | 0.09 | 0.09 | 0.09 | 0.09 | 0.09 | ||||
| 2000-2009 | H04W | 0.09 | 0.09 | 0.09 | 0.14 | 0.09 | 0.97 | |||
| 2000-2009 | C12 | 0.97 | 0.09 | 0.09 | 0.09 | 0.09 | 0.09 | 0.09 | ||
| 2000-2009 | B82 | 0.09 | 0.09 | 0.09 | 0.09 | 0.09 | 0.09 | 0.09 | 0.09 | |
| 2000-2009 | Y02 | 0.09 | 0.09 | 0.09 | 0.09 | 0.09 | 0.09 | 0.09 | 0.09 | 0.09 |
| 2010-2019 | Science | 0.09 | ||||||||
| 2010-2019 | WIPO | 0.09 | 1.00 | |||||||
| 2010-2019 | USPTO | 0.09 | 0.09 | 0.09 | ||||||
| 2010-2019 | All | 0.09 | 1.00 | 1.00 | 0.09 | |||||
| 2010-2019 | G06 | 0.09 | 0.09 | 0.09 | 0.09 | 0.09 | ||||
| 2010-2019 | H04W | 0.09 | 0.14 | 0.09 | 0.09 | 0.14 | 0.09 | |||
| 2010-2019 | C12 | 0.09 | 0.09 | 0.09 | 0.09 | 0.09 | 0.09 | 0.09 | ||
| 2010-2019 | B82 | 0.09 | 0.09 | 0.09 | 0.09 | 0.09 | 0.09 | 0.09 | 0.09 | |
| 2010-2019 | Y02 | 0.09 | 0.09 | 0.09 | 0.09 | 0.09 | 0.09 | 0.09 | 0.09 | 0.09 |
| Keyword | Science | WIPO | USPTO | All | G06 | H04W | C12 | B82 | Y02 | |
|---|---|---|---|---|---|---|---|---|---|---|
| Mean 1990-2019 | 2.71 | 2.42 | 2.41 | 2.26 | 2.36 | 2.14 | 2.22 | 2.75 | 3.39 | 3.39 |
| Median 1990-2019 | 2.87 | 2.52 | 2.55 | 2.25 | 2.4 | 2.15 | 2.17 | 2.8 | 3.66 | 3.55 |
| St.dev. 1990-2019 | 0.49 | 0.36 | 0.38 | 0.44 | 0.33 | 0.28 | 0.35 | 0.3 | 0.62 | 0.55 |
| Mean 1990-1999 | 3.18 | 2.78 | 2.8 | 2.75 | 2.71 | 2.45 | 2.64 | 3.05 | 3.92 | 3.92 |
| Median 1990-1999 | 3.2 | 2.79 | 2.82 | 2.77 | 2.73 | 2.44 | 2.65 | 3.06 | 3.95 | 3.92 |
| St.dev. 1990-1999 | 0.13 | 0.06 | 0.08 | 0.09 | 0.03 | 0.04 | 0.16 | 0.09 | 0.09 | 0.07 |
| Mean 2000-2009 | 2.82 | 2.48 | 2.46 | 2.24 | 2.4 | 2.15 | 2.13 | 2.79 | 3.65 | 3.53 |
| Median 2000-2009 | 2.87 | 2.52 | 2.55 | 2.25 | 2.4 | 2.15 | 2.17 | 2.8 | 3.66 | 3.55 |
| St.dev. 2000-2009 | 0.29 | 0.23 | 0.29 | 0.27 | 0.19 | 0.2 | 0.15 | 0.15 | 0.34 | 0.25 |
| Mean 2010-2019 | 2.13 | 1.98 | 1.98 | 1.77 | 1.98 | 1.83 | 1.88 | 2.41 | 2.61 | 2.71 |
| Median 2010-2019 | 2.18 | 1.99 | 2 | 1.78 | 1.98 | 1.83 | 1.88 | 2.45 | 2.59 | 2.71 |
| St.dev. 2010-2019 | 0.19 | 0.08 | 0.07 | 0.05 | 0.09 | 0.03 | 0.03 | 0.18 | 0.27 | 0.28 |
| Period | 3-digit | Keyword | Science | WIPO | USPTO | All | G06 | H04W | C12 | B82 |
|---|---|---|---|---|---|---|---|---|---|---|
| 1990-2019 | Science | 0.00 | ||||||||
| 1990-2019 | WIPO | 0.00 | 0.00 | |||||||
| 1990-2019 | USPTO | 0.00 | 0.00 | 0.00 | ||||||
| 1990-2019 | All | 0.00 | 0.00 | 0.00 | 0.03 | |||||
| 1990-2019 | G06 | 0.00 | 0.00 | 0.00 | 0.00 | 0.50 | ||||
| 1990-2019 | H04W | 0.00 | 0.00 | 0.00 | 0.00 | 0.79 | 0.79 | |||
| 1990-2019 | C12 | 0.00 | 0.00 | 0.00 | 0.50 | 0.00 | 0.04 | 0.05 | ||
| 1990-2019 | B82 | 0.00 | 0.00 | 0.00 | 0.00 | 0.00 | 0.00 | 0.00 | 0.00 | |
| 1990-2019 | Y02 | 0.27 | 0.00 | 0.00 | 0.00 | 0.00 | 0.00 | 0.00 | 0.00 | 0.00 |
| 1990-1999 | Science | 0.09 | ||||||||
| 1990-1999 | WIPO | 0.09 | 0.92 | |||||||
| 1990-1999 | USPTO | 0.09 | 0.97 | 0.96 | ||||||
| 1990-1999 | All | 0.09 | 0.09 | 0.09 | 0.09 | |||||
| 1990-1999 | G06 | 0.09 | 0.09 | 0.09 | 0.09 | 0.09 | ||||
| 1990-1999 | H04W | 0.09 | 0.09 | 0.09 | 0.09 | 0.16 | 0.97 | |||
| 1990-1999 | C12 | 0.09 | 0.09 | 0.09 | 0.09 | 0.09 | 0.97 | 0.97 | ||
| 1990-1999 | B82 | 0.97 | 0.09 | 0.09 | 0.09 | 0.09 | 0.09 | 0.09 | 0.09 | |
| 1990-1999 | Y02 | 0.09 | 0.14 | 0.14 | 0.11 | 0.09 | 0.09 | 0.09 | 0.09 | 0.09 |
| 2000-2009 | Science | 0.09 | ||||||||
| 2000-2009 | WIPO | 0.09 | 0.09 | |||||||
| 2000-2009 | USPTO | 0.09 | 0.09 | 0.09 | ||||||
| 2000-2009 | All | 0.09 | 0.09 | 0.09 | 0.10 | |||||
| 2000-2009 | G06 | 0.09 | 0.09 | 0.09 | 0.09 | 1.00 | ||||
| 2000-2009 | H04W | 0.09 | 0.09 | 0.09 | 0.09 | 0.09 | 0.09 | |||
| 2000-2009 | C12 | 0.09 | 0.09 | 0.09 | 1.00 | 0.09 | 0.26 | 0.09 | ||
| 2000-2009 | B82 | 0.09 | 0.09 | 0.09 | 0.09 | 0.09 | 0.09 | 0.09 | 0.09 | |
| 2000-2009 | Y02 | 0.26 | 0.09 | 0.09 | 0.09 | 0.09 | 0.09 | 0.09 | 0.09 | 0.09 |
| 2010-2019 | Science | 0.21 | ||||||||
| 2010-2019 | WIPO | 0.33 | 0.33 | |||||||
| 2010-2019 | USPTO | 0.09 | 0.09 | 0.09 | ||||||
| 2010-2019 | All | 0.09 | 0.09 | 0.09 | 0.09 | |||||
| 2010-2019 | G06 | 0.09 | 0.09 | 0.09 | 0.93 | 0.09 | ||||
| 2010-2019 | H04W | 0.09 | 0.09 | 0.09 | 1.00 | 0.53 | 1.00 | |||
| 2010-2019 | C12 | 0.27 | 0.34 | 1.00 | 0.09 | 0.09 | 0.09 | 0.09 | ||
| 2010-2019 | B82 | 0.16 | 0.09 | 0.09 | 0.09 | 0.09 | 0.09 | 0.09 | 0.09 | |
| 2010-2019 | Y02 | 0.09 | 0.09 | 0.09 | 0.09 | 0.09 | 0.09 | 0.09 | 0.09 | 0.50 |
| Keyword | Science | WIPO | USPTO | All | G06 | H04W | C12 | B82 | Y02 | |
|---|---|---|---|---|---|---|---|---|---|---|
| Mean 1990-2019 | 5.99 | 5 | 5.23 | 4.74 | 4.21 | 4.31 | 4.25 | 4.55 | 6.38 | 5.77 |
| Median 1990-2019 | 6.54 | 5.26 | 5.63 | 4.73 | 4.34 | 4.33 | 4.11 | 4.66 | 7.21 | 6.18 |
| St.dev. 1990-2019 | 1.93 | 1.48 | 1.59 | 1.74 | 1.09 | 1.33 | 1.42 | 1.01 | 2.05 | 1.51 |
| Mean 1990-1999 | 7.87 | 6.59 | 6.8 | 6.68 | 5.35 | 5.75 | 5.97 | 5.63 | 7.99 | 7.26 |
| Median 1990-1999 | 7.91 | 6.5 | 6.84 | 6.73 | 5.37 | 5.77 | 6.11 | 5.57 | 8.07 | 7.32 |
| St.dev. 1990-1999 | 0.36 | 0.35 | 0.25 | 0.25 | 0.09 | 0.14 | 0.62 | 0.24 | 0.39 | 0.23 |
| Mean 2000-2009 | 6.45 | 5.16 | 5.54 | 4.78 | 4.36 | 4.39 | 3.99 | 4.65 | 7.31 | 6.14 |
| Median 2000-2009 | 6.54 | 5.26 | 5.63 | 4.73 | 4.34 | 4.33 | 4.11 | 4.66 | 7.23 | 6.18 |
| St.dev. 2000-2009 | 1.07 | 0.77 | 1.07 | 1.02 | 0.6 | 0.83 | 0.58 | 0.46 | 1.31 | 0.71 |
| Mean 2010-2019 | 3.65 | 3.25 | 3.35 | 2.75 | 2.92 | 2.78 | 2.78 | 3.37 | 3.83 | 3.92 |
| Median 2010-2019 | 3.76 | 3.24 | 3.43 | 2.75 | 2.92 | 2.83 | 2.8 | 3.41 | 3.72 | 3.86 |
| St.dev. 2010-2019 | 0.72 | 0.35 | 0.38 | 0.32 | 0.35 | 0.24 | 0.13 | 0.44 | 0.76 | 0.64 |
| Period | 4-digit | Keyword | Science | WIPO | USPTO | All | G06 | H04W | C12 | B82 |
|---|---|---|---|---|---|---|---|---|---|---|
| 1990-2019 | Science | 0.00 | ||||||||
| 1990-2019 | WIPO | 0.00 | 0.00 | |||||||
| 1990-2019 | USPTO | 0.00 | 0.12 | 0.00 | ||||||
| 1990-2019 | All | 0.00 | 0.00 | 0.00 | 0.00 | |||||
| 1990-2019 | G06 | 0.00 | 0.00 | 0.00 | 0.00 | 0.00 | ||||
| 1990-2019 | H04W | 0.00 | 1.00 | 0.18 | 1.00 | 0.00 | 0.00 | |||
| 1990-2019 | C12 | 0.00 | 0.00 | 0.00 | 0.11 | 0.00 | 0.01 | 0.18 | ||
| 1990-2019 | B82 | 0.01 | 0.01 | 0.15 | 0.00 | 0.00 | 0.00 | 0.04 | 0.00 | |
| 1990-2019 | Y02 | 0.00 | 0.03 | 1.00 | 0.04 | 0.00 | 0.00 | 0.29 | 0.00 | 0.12 |
| 1990-1999 | Science | 0.09 | ||||||||
| 1990-1999 | WIPO | 0.09 | 1.00 | |||||||
| 1990-1999 | USPTO | 0.09 | 0.59 | 1.00 | ||||||
| 1990-1999 | All | 0.09 | 0.09 | 0.09 | 0.09 | |||||
| 1990-1999 | G06 | 0.09 | 0.09 | 0.09 | 0.09 | 0.09 | ||||
| 1990-1999 | H04W | 1.00 | 0.09 | 1.00 | 0.48 | 0.09 | 0.09 | |||
| 1990-1999 | C12 | 0.09 | 0.09 | 0.09 | 0.09 | 0.09 | 1.00 | 0.09 | ||
| 1990-1999 | B82 | 0.09 | 1.00 | 1.00 | 1.00 | 0.09 | 0.09 | 1.00 | 0.09 | |
| 1990-1999 | Y02 | 0.09 | 1.00 | 0.29 | 0.71 | 0.09 | 0.09 | 0.38 | 0.09 | 0.09 |
| 2000-2009 | Science | 0.09 | ||||||||
| 2000-2009 | WIPO | 0.09 | 0.09 | |||||||
| 2000-2009 | USPTO | 0.09 | 0.32 | 0.09 | ||||||
| 2000-2009 | All | 0.09 | 0.09 | 0.09 | 0.09 | |||||
| 2000-2009 | G06 | 0.09 | 0.09 | 0.09 | 0.09 | 0.10 | ||||
| 2000-2009 | H04W | 0.09 | 0.09 | 0.09 | 0.09 | 0.09 | 0.09 | |||
| 2000-2009 | C12 | 0.09 | 0.09 | 0.09 | 0.22 | 0.09 | 1.00 | 0.32 | ||
| 2000-2009 | B82 | 1.00 | 0.09 | 0.09 | 0.09 | 0.09 | 0.09 | 0.09 | 0.09 | |
| 2000-2009 | Y02 | 0.09 | 0.09 | 1.00 | 0.09 | 0.09 | 0.09 | 0.09 | 0.09 | 0.09 |
| 2010-2019 | Science | 0.45 | ||||||||
| 2010-2019 | WIPO | 1.00 | 0.41 | |||||||
| 2010-2019 | USPTO | 0.09 | 0.09 | 0.09 | ||||||
| 2010-2019 | All | 0.09 | 0.09 | 0.09 | 0.09 | |||||
| 2010-2019 | G06 | 0.09 | 0.09 | 0.09 | 1.00 | 1.00 | ||||
| 2010-2019 | H04W | 0.09 | 0.09 | 0.09 | 1.00 | 0.41 | 0.16 | |||
| 2010-2019 | C12 | 0.45 | 1.00 | 0.84 | 0.09 | 0.09 | 0.09 | 0.09 | ||
| 2010-2019 | B82 | 0.10 | 1.00 | 0.84 | 0.09 | 0.09 | 0.09 | 0.09 | 1.00 | |
| 2010-2019 | Y02 | 1.00 | 0.09 | 0.41 | 0.09 | 0.09 | 0.09 | 0.09 | 0.09 | 0.09 |
| Keyword | Science | WIPO | USPTO | All | G06 | H04W | C12 | B82 | Y02 | |
|---|---|---|---|---|---|---|---|---|---|---|
| Mean 1990-2019 | 9.92 | 8.54 | 9.05 | 8.21 | 6.36 | 6.95 | 8.35 | 7.41 | 9.43 | 8.92 |
| Median 1990-2019 | 11.14 | 9.13 | 9.98 | 8.32 | 6.65 | 7.11 | 8.16 | 7.4 | 10.7 | 9.74 |
| St.dev. 1990-2019 | 3.61 | 2.94 | 3.2 | 3.48 | 1.9 | 2.45 | 3.81 | 2.07 | 3.61 | 2.68 |
| Mean 1990-1999 | 13.3 | 11.63 | 12.06 | 11.99 | 8.29 | 9.52 | 12.9 | 9.69 | 12.39 | 11.45 |
| Median 1990-1999 | 13.34 | 11.45 | 12.07 | 12.09 | 8.35 | 9.51 | 13.21 | 9.61 | 12.47 | 11.65 |
| St.dev. 1990-1999 | 0.55 | 0.6 | 0.43 | 0.28 | 0.24 | 0.16 | 1.26 | 0.49 | 0.88 | 0.53 |
| Mean 2000-2009 | 10.94 | 8.95 | 9.87 | 8.47 | 6.7 | 7.24 | 7.92 | 7.47 | 10.9 | 9.68 |
| Median 2000-2009 | 11.14 | 9.13 | 9.98 | 8.32 | 6.65 | 7.11 | 8.16 | 7.4 | 10.73 | 9.74 |
| St.dev. 2000-2009 | 2.04 | 1.53 | 2.23 | 2.11 | 1.06 | 1.59 | 1.62 | 0.92 | 2.44 | 1.3 |
| Mean 2010-2019 | 5.51 | 5.04 | 5.22 | 4.18 | 4.08 | 4.1 | 4.22 | 5.06 | 5 | 5.62 |
| Median 2010-2019 | 5.66 | 4.99 | 5.34 | 4.21 | 4.11 | 4.21 | 4.25 | 5.12 | 4.87 | 5.51 |
| St.dev. 2010-2019 | 1.42 | 0.83 | 0.89 | 0.74 | 0.68 | 0.57 | 0.54 | 0.87 | 1.15 | 1.18 |
C.2.3 Complementarity
| Period | 3-digit | Keyword | Science | WIPO | USPTO | All | G06 | H04W | C12 | B82 |
|---|---|---|---|---|---|---|---|---|---|---|
| 1990-2019 | Science | 0.29 | ||||||||
| 1990-2019 | WIPO | 0.15 | 0.29 | |||||||
| 1990-2019 | USPTO | 0.00 | 0.00 | 0.00 | ||||||
| 1990-2019 | All | 0.00 | 0.00 | 0.00 | 0.00 | |||||
| 1990-2019 | G06 | 0.00 | 0.00 | 0.00 | 0.00 | 0.00 | ||||
| 1990-2019 | H04W | 0.00 | 0.00 | 0.00 | 0.00 | 0.00 | 0.00 | |||
| 1990-2019 | C12 | 0.00 | 0.00 | 0.00 | 0.00 | 0.00 | 0.00 | 0.00 | ||
| 1990-2019 | B82 | 0.00 | 0.00 | 0.01 | 0.00 | 0.00 | 0.00 | 0.00 | 0.29 | |
| 1990-2019 | Y02 | 0.00 | 0.00 | 0.00 | 0.00 | 0.00 | 0.00 | 0.00 | 0.00 | 0.00 |
| 1990-1999 | Science | 0.32 | ||||||||
| 1990-1999 | WIPO | 0.32 | 0.14 | |||||||
| 1990-1999 | USPTO | 0.09 | 0.09 | 0.13 | ||||||
| 1990-1999 | All | 0.13 | 0.13 | 0.13 | 0.09 | |||||
| 1990-1999 | G06 | 0.10 | 0.13 | 0.13 | 0.13 | 0.09 | ||||
| 1990-1999 | H04W | 0.13 | 0.09 | 0.09 | 0.09 | 0.13 | 0.09 | |||
| 1990-1999 | C12 | 0.10 | 0.32 | 0.09 | 0.09 | 0.13 | 0.09 | 0.13 | ||
| 1990-1999 | B82 | 0.13 | 0.13 | 0.09 | 0.09 | 0.13 | 0.09 | 0.09 | 0.17 | |
| 1990-1999 | Y02 | 0.09 | 0.09 | 0.13 | 0.13 | 0.13 | 0.09 | 0.09 | 0.13 | 0.09 |
| 2000-2009 | Science | 1.00 | ||||||||
| 2000-2009 | WIPO | 1.00 | 0.77 | |||||||
| 2000-2009 | USPTO | 0.18 | 0.09 | 0.18 | ||||||
| 2000-2009 | All | 0.18 | 0.18 | 0.18 | 0.18 | |||||
| 2000-2009 | G06 | 0.18 | 0.18 | 0.18 | 0.18 | 0.18 | ||||
| 2000-2009 | H04W | 0.18 | 0.09 | 0.09 | 0.18 | 0.18 | 0.09 | |||
| 2000-2009 | C12 | 0.09 | 0.09 | 0.12 | 0.09 | 0.18 | 0.09 | 0.09 | ||
| 2000-2009 | B82 | 0.63 | 0.63 | 1.00 | 0.09 | 0.18 | 0.18 | 0.18 | 0.18 | |
| 2000-2009 | Y02 | 0.18 | 0.09 | 0.09 | 0.18 | 0.18 | 0.18 | 0.18 | 0.09 | 0.18 |
| 2010-2019 | Science | 0.88 | ||||||||
| 2010-2019 | WIPO | 0.09 | 0.13 | |||||||
| 2010-2019 | USPTO | 0.13 | 0.09 | 0.09 | ||||||
| 2010-2019 | All | 0.13 | 0.09 | 0.09 | 0.13 | |||||
| 2010-2019 | G06 | 0.13 | 0.13 | 0.13 | 0.88 | 0.09 | ||||
| 2010-2019 | H04W | 0.09 | 0.09 | 0.09 | 0.09 | 0.13 | 0.09 | |||
| 2010-2019 | C12 | 0.09 | 0.09 | 0.13 | 0.09 | 0.13 | 0.13 | 0.09 | ||
| 2010-2019 | B82 | 0.09 | 0.09 | 0.88 | 0.09 | 0.13 | 0.09 | 0.13 | 0.88 | |
| 2010-2019 | Y02 | 0.09 | 0.09 | 0.09 | 0.13 | 0.13 | 0.13 | 0.13 | 0.13 | 0.13 |
| Keyword | Science | WIPO | USPTO | All | G06 | H04W | C12 | B82 | Y02 | |
|---|---|---|---|---|---|---|---|---|---|---|
| Mean 1990-2019 | 0.61 | 0.6 | 0.59 | 0.82 | 0.93 | 0.7 | 0.3 | 0.51 | 0.54 | 0.87 |
| Median 1990-2019 | 0.6 | 0.59 | 0.57 | 0.83 | 0.93 | 0.71 | 0.28 | 0.49 | 0.57 | 0.88 |
| St.dev. 1990-2019 | 0.15 | 0.16 | 0.12 | 0.06 | 0 | 0.13 | 0.17 | 0.12 | 0.14 | 0.03 |
| Mean 1990-1999 | 0.47 | 0.43 | 0.48 | 0.76 | 0.93 | 0.56 | 0.13 | 0.4 | 0.37 | 0.85 |
| Median 1990-1999 | 0.45 | 0.43 | 0.51 | 0.75 | 0.93 | 0.56 | 0.12 | 0.4 | 0.36 | 0.85 |
| St.dev. 1990-1999 | 0.08 | 0.1 | 0.07 | 0.05 | 0 | 0.06 | 0.03 | 0.06 | 0.06 | 0.02 |
| Mean 2000-2009 | 0.59 | 0.59 | 0.57 | 0.82 | 0.93 | 0.7 | 0.27 | 0.48 | 0.57 | 0.87 |
| Median 2000-2009 | 0.6 | 0.58 | 0.57 | 0.83 | 0.93 | 0.71 | 0.28 | 0.49 | 0.57 | 0.88 |
| St.dev. 2000-2009 | 0.04 | 0.03 | 0.04 | 0.02 | 0 | 0.04 | 0.05 | 0.04 | 0.05 | 0.02 |
| Mean 2010-2019 | 0.78 | 0.77 | 0.71 | 0.87 | 0.93 | 0.85 | 0.49 | 0.64 | 0.68 | 0.9 |
| Median 2010-2019 | 0.79 | 0.77 | 0.69 | 0.86 | 0.93 | 0.85 | 0.46 | 0.69 | 0.67 | 0.91 |
| St.dev. 2010-2019 | 0.08 | 0.06 | 0.08 | 0.03 | 0 | 0.04 | 0.11 | 0.09 | 0.04 | 0.02 |
| Period | 4-digit | Keyword | Science | WIPO | USPTO | All | G06 | H04W | C12 | B82 |
|---|---|---|---|---|---|---|---|---|---|---|
| 1990-2019 | Science | 0.83 | ||||||||
| 1990-2019 | WIPO | 0.83 | 0.33 | |||||||
| 1990-2019 | USPTO | 0.00 | 0.00 | 0.00 | ||||||
| 1990-2019 | All | 0.00 | 0.00 | 0.00 | 0.00 | |||||
| 1990-2019 | G06 | 0.00 | 0.00 | 0.00 | 0.00 | 0.00 | ||||
| 1990-2019 | H04W | 0.00 | 0.00 | 0.00 | 0.00 | 0.00 | 0.00 | |||
| 1990-2019 | C12 | 0.00 | 0.00 | 0.00 | 0.00 | 0.00 | 0.00 | 0.00 | ||
| 1990-2019 | B82 | 0.00 | 0.00 | 0.00 | 0.00 | 0.00 | 0.00 | 0.00 | 0.31 | |
| 1990-2019 | Y02 | 0.00 | 0.00 | 0.00 | 0.00 | 0.00 | 0.00 | 0.00 | 0.00 | 0.00 |
| 1990-1999 | Science | 0.77 | ||||||||
| 1990-1999 | WIPO | 0.48 | 0.42 | |||||||
| 1990-1999 | USPTO | 0.09 | 0.09 | 0.09 | ||||||
| 1990-1999 | All | 0.09 | 0.09 | 0.09 | 0.09 | |||||
| 1990-1999 | G06 | 0.09 | 0.09 | 0.09 | 0.09 | 0.09 | ||||
| 1990-1999 | H04W | 0.09 | 0.09 | 0.09 | 0.09 | 0.09 | 0.09 | |||
| 1990-1999 | C12 | 0.09 | 0.48 | 0.09 | 0.09 | 0.09 | 0.09 | 0.09 | ||
| 1990-1999 | B82 | 0.09 | 0.09 | 0.09 | 0.09 | 0.09 | 0.09 | 0.09 | 0.09 | |
| 1990-1999 | Y02 | 0.09 | 0.09 | 0.09 | 0.09 | 0.09 | 0.09 | 0.09 | 0.09 | 0.09 |
| 2000-2009 | Science | 0.09 | ||||||||
| 2000-2009 | WIPO | 0.92 | 0.09 | |||||||
| 2000-2009 | USPTO | 0.09 | 0.09 | 0.09 | ||||||
| 2000-2009 | All | 0.09 | 0.09 | 0.09 | 0.09 | |||||
| 2000-2009 | G06 | 0.09 | 0.09 | 0.09 | 0.09 | 0.09 | ||||
| 2000-2009 | H04W | 0.09 | 0.09 | 0.09 | 0.09 | 0.09 | 0.09 | |||
| 2000-2009 | C12 | 0.09 | 0.09 | 0.09 | 0.09 | 0.09 | 0.09 | 0.09 | ||
| 2000-2009 | B82 | 0.09 | 0.09 | 0.09 | 0.09 | 0.09 | 0.09 | 0.09 | 0.09 | |
| 2000-2009 | Y02 | 0.09 | 0.09 | 0.09 | 0.09 | 0.09 | 0.09 | 0.09 | 0.09 | 0.09 |
| 2010-2019 | Science | 0.48 | ||||||||
| 2010-2019 | WIPO | 0.09 | 0.22 | |||||||
| 2010-2019 | USPTO | 0.09 | 0.09 | 0.09 | ||||||
| 2010-2019 | All | 0.09 | 0.09 | 0.09 | 0.09 | |||||
| 2010-2019 | G06 | 0.09 | 0.09 | 0.09 | 0.22 | 0.09 | ||||
| 2010-2019 | H04W | 0.09 | 0.09 | 0.09 | 0.09 | 0.09 | 0.09 | |||
| 2010-2019 | C12 | 0.09 | 0.09 | 0.09 | 0.09 | 0.09 | 0.09 | 0.22 | ||
| 2010-2019 | B82 | 0.09 | 0.09 | 0.09 | 0.09 | 0.09 | 0.09 | 0.25 | 0.46 | |
| 2010-2019 | Y02 | 0.09 | 0.09 | 0.09 | 0.09 | 0.09 | 0.09 | 0.09 | 0.09 | 0.09 |
| Keyword | Science | WIPO | USPTO | All | G06 | H04W | C12 | B82 | Y02 | |
|---|---|---|---|---|---|---|---|---|---|---|
| Mean 1990-2019 | 0.37 | 0.37 | 0.36 | 0.6 | 0.96 | 0.49 | 0.17 | 0.27 | 0.29 | 0.74 |
| Median 1990-2019 | 0.33 | 0.35 | 0.33 | 0.6 | 0.96 | 0.48 | 0.14 | 0.25 | 0.31 | 0.72 |
| St.dev. 1990-2019 | 0.14 | 0.13 | 0.12 | 0.1 | 0.01 | 0.15 | 0.13 | 0.08 | 0.09 | 0.06 |
| Mean 1990-1999 | 0.24 | 0.24 | 0.25 | 0.48 | 0.96 | 0.33 | 0.06 | 0.2 | 0.18 | 0.68 |
| Median 1990-1999 | 0.24 | 0.23 | 0.27 | 0.48 | 0.96 | 0.33 | 0.06 | 0.2 | 0.17 | 0.68 |
| St.dev. 1990-1999 | 0.06 | 0.07 | 0.05 | 0.05 | 0 | 0.05 | 0.02 | 0.03 | 0.03 | 0.03 |
| Mean 2000-2009 | 0.33 | 0.36 | 0.33 | 0.6 | 0.96 | 0.47 | 0.14 | 0.24 | 0.3 | 0.72 |
| Median 2000-2009 | 0.33 | 0.35 | 0.33 | 0.6 | 0.96 | 0.48 | 0.14 | 0.24 | 0.31 | 0.72 |
| St.dev. 2000-2009 | 0.02 | 0.02 | 0.02 | 0.02 | 0 | 0.03 | 0.03 | 0.01 | 0.03 | 0.01 |
| Mean 2010-2019 | 0.54 | 0.53 | 0.5 | 0.71 | 0.97 | 0.66 | 0.32 | 0.36 | 0.39 | 0.81 |
| Median 2010-2019 | 0.56 | 0.53 | 0.5 | 0.7 | 0.97 | 0.67 | 0.31 | 0.38 | 0.39 | 0.82 |
| St.dev. 2010-2019 | 0.09 | 0.07 | 0.09 | 0.05 | 0.01 | 0.08 | 0.11 | 0.07 | 0.02 | 0.04 |
| Period | 1-digit | Keyword | Science | WIPO | USPTO | All | G06 | H04W | C12 | B82 |
|---|---|---|---|---|---|---|---|---|---|---|
| 1990-2019 | Science | 1.00 | ||||||||
| 1990-2019 | WIPO | 0.02 | 0.05 | |||||||
| 1990-2019 | USPTO | 0.00 | 0.00 | 0.00 | ||||||
| 1990-2019 | All | 0.00 | 0.02 | 1.00 | 0.00 | |||||
| 1990-2019 | G06 | 0.00 | 0.06 | 1.00 | 0.00 | 1.00 | ||||
| 1990-2019 | H04W | 0.00 | 0.01 | 0.03 | 0.00 | 0.00 | 0.00 | |||
| 1990-2019 | C12 | 0.00 | 0.00 | 0.00 | 0.00 | 0.00 | 0.00 | 0.00 | ||
| 1990-2019 | B82 | 0.00 | 0.00 | 0.00 | 0.00 | 0.00 | 0.00 | 0.00 | 0.00 | |
| 1990-2019 | Y02 | 0.00 | 0.00 | 0.00 | 0.00 | 0.00 | 0.00 | 0.00 | 0.00 | 0.82 |
| 1990-1999 | Science | 1.00 | ||||||||
| 1990-1999 | WIPO | 0.09 | 1.00 | |||||||
| 1990-1999 | USPTO | 0.09 | 0.84 | 0.15 | ||||||
| 1990-1999 | All | 0.25 | 1.00 | 0.09 | 0.09 | |||||
| 1990-1999 | G06 | 0.09 | 1.00 | 0.15 | 0.09 | 0.45 | ||||
| 1990-1999 | H04W | 1.00 | 1.00 | 0.84 | 0.09 | 1.00 | 1.00 | |||
| 1990-1999 | C12 | 0.09 | 0.09 | 0.09 | 0.09 | 0.09 | 0.09 | 0.09 | ||
| 1990-1999 | B82 | 0.09 | 0.09 | 0.09 | 0.09 | 0.09 | 0.09 | 0.09 | 0.09 | |
| 1990-1999 | Y02 | 0.09 | 0.09 | 0.09 | 0.09 | 0.09 | 0.09 | 0.09 | 0.09 | 0.71 |
| 2000-2009 | Science | 0.09 | ||||||||
| 2000-2009 | WIPO | 0.29 | 0.09 | |||||||
| 2000-2009 | USPTO | 0.09 | 0.09 | 0.09 | ||||||
| 2000-2009 | All | 0.09 | 0.09 | 0.83 | 0.09 | |||||
| 2000-2009 | G06 | 0.09 | 0.09 | 0.83 | 0.09 | 0.83 | ||||
| 2000-2009 | H04W | 0.09 | 0.09 | 0.09 | 0.29 | 0.09 | 0.09 | |||
| 2000-2009 | C12 | 0.09 | 0.09 | 0.09 | 0.09 | 0.09 | 0.09 | 0.09 | ||
| 2000-2009 | B82 | 0.09 | 0.09 | 0.09 | 0.09 | 0.09 | 0.09 | 0.09 | 0.09 | |
| 2000-2009 | Y02 | 0.09 | 0.09 | 0.09 | 0.09 | 0.09 | 0.09 | 0.09 | 0.09 | 0.29 |
| 2010-2019 | Science | 1.00 | ||||||||
| 2010-2019 | WIPO | 1.00 | 1.00 | |||||||
| 2010-2019 | USPTO | 0.09 | 0.09 | 0.09 | ||||||
| 2010-2019 | All | 0.58 | 0.11 | 0.84 | 0.09 | |||||
| 2010-2019 | G06 | 1.00 | 1.00 | 1.00 | 0.09 | 0.84 | ||||
| 2010-2019 | H04W | 0.09 | 0.09 | 0.09 | 0.27 | 0.09 | 0.09 | |||
| 2010-2019 | C12 | 0.09 | 0.09 | 0.09 | 0.09 | 0.09 | 0.09 | 0.09 | ||
| 2010-2019 | B82 | 0.09 | 0.09 | 0.09 | 0.09 | 0.09 | 0.09 | 0.09 | 0.09 | |
| 2010-2019 | Y02 | 0.09 | 0.09 | 0.09 | 0.09 | 0.09 | 0.09 | 0.09 | 0.09 | 0.09 |
| Keyword | Science | WIPO | USPTO | All | G06 | H04W | C12 | B82 | Y02 | |
|---|---|---|---|---|---|---|---|---|---|---|
| Mean 1990-2019 | 1.39 | 1.4 | 1.36 | 1.27 | 1.36 | 1.36 | 1.32 | 1.8 | 2.48 | 2.47 |
| Median 1990-2019 | 1.36 | 1.42 | 1.33 | 1.24 | 1.33 | 1.32 | 1.29 | 1.78 | 2.48 | 2.46 |
| St.dev. 1990-2019 | 0.09 | 0.1 | 0.12 | 0.08 | 0.08 | 0.11 | 0.08 | 0.15 | 0.11 | 0.05 |
| Mean 1990-1999 | 1.35 | 1.3 | 1.27 | 1.24 | 1.31 | 1.29 | 1.33 | 1.64 | 2.39 | 2.43 |
| Median 1990-1999 | 1.35 | 1.28 | 1.27 | 1.24 | 1.32 | 1.29 | 1.29 | 1.65 | 2.37 | 2.43 |
| St.dev. 1990-1999 | 0.03 | 0.08 | 0.02 | 0.01 | 0.02 | 0.01 | 0.08 | 0.08 | 0.08 | 0.03 |
| Mean 2000-2009 | 1.35 | 1.43 | 1.33 | 1.24 | 1.33 | 1.32 | 1.26 | 1.79 | 2.48 | 2.46 |
| Median 2000-2009 | 1.36 | 1.43 | 1.33 | 1.24 | 1.33 | 1.32 | 1.26 | 1.78 | 2.48 | 2.45 |
| St.dev. 2000-2009 | 0.02 | 0.02 | 0.03 | 0.01 | 0.01 | 0.01 | 0.02 | 0.04 | 0.03 | 0.01 |
| Mean 2010-2019 | 1.47 | 1.47 | 1.48 | 1.35 | 1.45 | 1.47 | 1.37 | 1.97 | 2.58 | 2.52 |
| Median 2010-2019 | 1.48 | 1.47 | 1.47 | 1.35 | 1.44 | 1.48 | 1.36 | 1.99 | 2.55 | 2.51 |
| St.dev. 2010-2019 | 0.11 | 0.08 | 0.14 | 0.11 | 0.09 | 0.12 | 0.09 | 0.08 | 0.1 | 0.06 |
| Period | 3-digit | Keyword | Science | WIPO | USPTO | All | G06 | H04W | C12 | B82 |
|---|---|---|---|---|---|---|---|---|---|---|
| 1990-2019 | Science | 0.65 | ||||||||
| 1990-2019 | WIPO | 0.38 | 0.87 | |||||||
| 1990-2019 | USPTO | 0.00 | 0.00 | 0.00 | ||||||
| 1990-2019 | All | 0.00 | 0.00 | 0.00 | 0.00 | |||||
| 1990-2019 | G06 | 0.79 | 0.79 | 0.46 | 0.00 | 0.00 | ||||
| 1990-2019 | H04W | 0.00 | 0.00 | 0.00 | 0.79 | 0.00 | 0.00 | |||
| 1990-2019 | C12 | 0.00 | 0.00 | 0.00 | 0.00 | 0.00 | 0.00 | 0.00 | ||
| 1990-2019 | B82 | 0.00 | 0.00 | 0.00 | 0.00 | 0.00 | 0.00 | 0.00 | 0.00 | |
| 1990-2019 | Y02 | 0.00 | 0.00 | 0.00 | 0.00 | 0.00 | 0.00 | 0.00 | 0.00 | 0.00 |
| 1990-1999 | Science | 1.00 | ||||||||
| 1990-1999 | WIPO | 0.09 | 1.00 | |||||||
| 1990-1999 | USPTO | 0.09 | 0.09 | 0.09 | ||||||
| 1990-1999 | All | 0.09 | 1.00 | 0.76 | 0.09 | |||||
| 1990-1999 | G06 | 1.00 | 1.00 | 0.09 | 0.09 | 0.09 | ||||
| 1990-1999 | H04W | 0.09 | 1.00 | 0.49 | 1.00 | 1.00 | 0.09 | |||
| 1990-1999 | C12 | 0.09 | 0.09 | 0.09 | 0.09 | 0.09 | 0.09 | 0.09 | ||
| 1990-1999 | B82 | 0.09 | 0.09 | 0.09 | 0.09 | 0.09 | 0.09 | 0.09 | 0.09 | |
| 1990-1999 | Y02 | 0.09 | 0.09 | 0.09 | 0.09 | 0.09 | 0.09 | 0.09 | 0.09 | 0.09 |
| 2000-2009 | Science | 0.09 | ||||||||
| 2000-2009 | WIPO | 0.09 | 0.09 | |||||||
| 2000-2009 | USPTO | 0.09 | 0.09 | 0.09 | ||||||
| 2000-2009 | All | 0.09 | 0.09 | 0.09 | 0.09 | |||||
| 2000-2009 | G06 | 0.92 | 0.09 | 0.09 | 0.09 | 0.09 | ||||
| 2000-2009 | H04W | 0.09 | 0.09 | 0.09 | 0.86 | 0.09 | 0.09 | |||
| 2000-2009 | C12 | 0.09 | 0.09 | 0.09 | 0.09 | 0.09 | 0.09 | 0.09 | ||
| 2000-2009 | B82 | 0.09 | 0.09 | 0.09 | 0.09 | 0.09 | 0.09 | 0.09 | 0.09 | |
| 2000-2009 | Y02 | 0.09 | 0.09 | 0.09 | 0.09 | 0.09 | 0.09 | 0.09 | 0.09 | 0.09 |
| 2010-2019 | Science | 1.00 | ||||||||
| 2010-2019 | WIPO | 0.09 | 0.10 | |||||||
| 2010-2019 | USPTO | 0.09 | 0.09 | 0.09 | ||||||
| 2010-2019 | All | 0.09 | 0.09 | 0.09 | 0.09 | |||||
| 2010-2019 | G06 | 0.32 | 1.00 | 0.09 | 0.09 | 0.09 | ||||
| 2010-2019 | H04W | 0.09 | 0.09 | 0.09 | 0.10 | 0.09 | 0.09 | |||
| 2010-2019 | C12 | 0.09 | 0.09 | 0.09 | 0.09 | 0.09 | 0.09 | 0.09 | ||
| 2010-2019 | B82 | 0.09 | 0.09 | 0.09 | 0.09 | 0.09 | 0.09 | 0.09 | 0.09 | |
| 2010-2019 | Y02 | 0.09 | 0.09 | 0.09 | 0.09 | 0.09 | 0.09 | 0.09 | 0.09 | 0.09 |
| Keyword | Science | WIPO | USPTO | All | G06 | H04W | C12 | B82 | Y02 | |
|---|---|---|---|---|---|---|---|---|---|---|
| Mean 1990-2019 | 1.61 | 1.64 | 1.64 | 1.43 | 1.54 | 1.62 | 1.43 | 2.32 | 3.03 | 2.85 |
| Median 1990-2019 | 1.55 | 1.65 | 1.58 | 1.39 | 1.48 | 1.56 | 1.39 | 2.35 | 2.99 | 2.81 |
| St.dev. 1990-2019 | 0.15 | 0.14 | 0.21 | 0.12 | 0.12 | 0.15 | 0.11 | 0.16 | 0.19 | 0.12 |
| Mean 1990-1999 | 1.55 | 1.51 | 1.5 | 1.39 | 1.48 | 1.57 | 1.43 | 2.16 | 2.88 | 2.77 |
| Median 1990-1999 | 1.56 | 1.48 | 1.48 | 1.4 | 1.48 | 1.57 | 1.4 | 2.16 | 2.86 | 2.79 |
| St.dev. 1990-1999 | 0.04 | 0.1 | 0.04 | 0.02 | 0.03 | 0.04 | 0.09 | 0.15 | 0.09 | 0.06 |
| Mean 2000-2009 | 1.54 | 1.69 | 1.58 | 1.36 | 1.48 | 1.54 | 1.35 | 2.36 | 3.01 | 2.81 |
| Median 2000-2009 | 1.54 | 1.68 | 1.59 | 1.36 | 1.48 | 1.54 | 1.35 | 2.36 | 3.01 | 2.81 |
| St.dev. 2000-2009 | 0.02 | 0.05 | 0.05 | 0.02 | 0.01 | 0.02 | 0.03 | 0.04 | 0.07 | 0.03 |
| Mean 2010-2019 | 1.74 | 1.73 | 1.85 | 1.53 | 1.67 | 1.75 | 1.49 | 2.46 | 3.2 | 2.96 |
| Median 2010-2019 | 1.73 | 1.71 | 1.82 | 1.52 | 1.65 | 1.74 | 1.46 | 2.48 | 3.15 | 2.91 |
| St.dev. 2010-2019 | 0.2 | 0.14 | 0.26 | 0.17 | 0.15 | 0.21 | 0.14 | 0.08 | 0.22 | 0.14 |
| Period | 4-digit | Keyword | Science | WIPO | USPTO | All | G06 | H04W | C12 | B82 |
|---|---|---|---|---|---|---|---|---|---|---|
| 1990-2019 | Science | 0.01 | ||||||||
| 1990-2019 | WIPO | 0.00 | 0.10 | |||||||
| 1990-2019 | USPTO | 0.00 | 0.00 | 0.00 | ||||||
| 1990-2019 | All | 0.00 | 0.00 | 0.00 | 0.00 | |||||
| 1990-2019 | G06 | 0.00 | 0.00 | 0.00 | 0.00 | 0.52 | ||||
| 1990-2019 | H04W | 0.00 | 0.00 | 0.00 | 0.00 | 0.00 | 0.00 | |||
| 1990-2019 | C12 | 0.00 | 0.00 | 0.00 | 0.00 | 0.00 | 0.00 | 0.00 | ||
| 1990-2019 | B82 | 0.00 | 0.00 | 0.00 | 0.00 | 0.00 | 0.00 | 0.00 | 0.00 | |
| 1990-2019 | Y02 | 0.00 | 0.00 | 0.00 | 0.00 | 0.00 | 0.00 | 0.00 | 0.00 | 0.00 |
| 1990-1999 | Science | 1.00 | ||||||||
| 1990-1999 | WIPO | 1.00 | 1.00 | |||||||
| 1990-1999 | USPTO | 0.09 | 0.09 | 0.09 | ||||||
| 1990-1999 | All | 0.09 | 1.00 | 0.09 | 0.09 | |||||
| 1990-1999 | G06 | 0.09 | 1.00 | 0.09 | 0.09 | 1.00 | ||||
| 1990-1999 | H04W | 0.09 | 0.09 | 0.09 | 0.09 | 0.09 | 0.09 | |||
| 1990-1999 | C12 | 0.09 | 0.09 | 0.09 | 0.09 | 0.09 | 0.09 | 0.09 | ||
| 1990-1999 | B82 | 0.09 | 0.09 | 0.09 | 0.09 | 0.09 | 0.09 | 0.09 | 0.09 | |
| 1990-1999 | Y02 | 0.09 | 0.09 | 0.09 | 0.09 | 0.09 | 0.09 | 0.09 | 0.09 | 0.10 |
| 2000-2009 | Science | 0.09 | ||||||||
| 2000-2009 | WIPO | 0.09 | 0.26 | |||||||
| 2000-2009 | USPTO | 0.09 | 0.09 | 0.09 | ||||||
| 2000-2009 | All | 0.09 | 0.09 | 0.09 | 0.09 | |||||
| 2000-2009 | G06 | 0.09 | 0.09 | 0.09 | 0.09 | 0.28 | ||||
| 2000-2009 | H04W | 0.09 | 0.09 | 0.09 | 0.09 | 0.09 | 0.09 | |||
| 2000-2009 | C12 | 0.09 | 0.09 | 0.09 | 0.09 | 0.09 | 0.09 | 0.09 | ||
| 2000-2009 | B82 | 0.09 | 0.09 | 0.09 | 0.09 | 0.09 | 0.09 | 0.09 | 0.09 | |
| 2000-2009 | Y02 | 0.09 | 0.09 | 0.09 | 0.09 | 0.09 | 0.09 | 0.09 | 0.09 | 0.09 |
| 2010-2019 | Science | 0.25 | ||||||||
| 2010-2019 | WIPO | 0.09 | 0.09 | |||||||
| 2010-2019 | USPTO | 0.09 | 0.09 | 0.09 | ||||||
| 2010-2019 | All | 0.09 | 0.09 | 0.09 | 0.09 | |||||
| 2010-2019 | G06 | 0.09 | 0.09 | 0.09 | 0.09 | 0.64 | ||||
| 2010-2019 | H04W | 0.09 | 0.09 | 0.70 | 0.09 | 0.09 | 0.09 | |||
| 2010-2019 | C12 | 0.09 | 0.09 | 0.09 | 0.09 | 0.09 | 0.09 | 0.09 | ||
| 2010-2019 | B82 | 0.09 | 0.09 | 0.09 | 0.09 | 0.09 | 0.09 | 0.09 | 0.09 | |
| 2010-2019 | Y02 | 0.09 | 0.09 | 0.09 | 0.09 | 0.09 | 0.09 | 0.09 | 0.09 | 0.15 |
| Keyword | Science | WIPO | USPTO | All | G06 | H04W | C12 | B82 | Y02 | |
|---|---|---|---|---|---|---|---|---|---|---|
| Mean 1990-2019 | 1.88 | 1.97 | 2.05 | 1.64 | 1.8 | 1.81 | 2.26 | 2.93 | 3.5 | 3.39 |
| Median 1990-2019 | 1.77 | 1.97 | 1.96 | 1.56 | 1.71 | 1.71 | 2.2 | 2.89 | 3.41 | 3.36 |
| St.dev. 1990-2019 | 0.26 | 0.25 | 0.38 | 0.21 | 0.21 | 0.25 | 0.21 | 0.3 | 0.27 | 0.23 |
| Mean 1990-1999 | 1.77 | 1.73 | 1.76 | 1.55 | 1.68 | 1.69 | 2.16 | 2.64 | 3.31 | 3.2 |
| Median 1990-1999 | 1.77 | 1.67 | 1.75 | 1.56 | 1.68 | 1.71 | 2.14 | 2.65 | 3.3 | 3.21 |
| St.dev. 1990-1999 | 0.05 | 0.13 | 0.04 | 0.03 | 0.04 | 0.04 | 0.07 | 0.2 | 0.14 | 0.1 |
| Mean 2000-2009 | 1.75 | 2 | 1.95 | 1.53 | 1.7 | 1.69 | 2.16 | 2.9 | 3.46 | 3.35 |
| Median 2000-2009 | 1.75 | 1.99 | 1.98 | 1.54 | 1.7 | 1.69 | 2.17 | 2.89 | 3.44 | 3.36 |
| St.dev. 2000-2009 | 0.03 | 0.06 | 0.09 | 0.02 | 0.01 | 0.03 | 0.09 | 0.07 | 0.1 | 0.05 |
| Mean 2010-2019 | 2.12 | 2.19 | 2.43 | 1.83 | 2.01 | 2.05 | 2.45 | 3.24 | 3.72 | 3.63 |
| Median 2010-2019 | 2.09 | 2.16 | 2.39 | 1.82 | 2 | 2.02 | 2.4 | 3.31 | 3.66 | 3.58 |
| St.dev. 2010-2019 | 0.35 | 0.26 | 0.44 | 0.28 | 0.24 | 0.32 | 0.26 | 0.2 | 0.33 | 0.22 |
C.3 Generality of AI Descendants
In this section, we report additional results for the wide-ranging usefulness of technological descendants of AI, i.e. those patents that cite an AI patent but are not AI themselves. This serves as an additional indicator of the wide spread of AI in a range of different products and processes. The results confirm the persistence of the ranking, indicating the highest generality of keyword patents across different indicators.
| Citing Keyword | Citing Science | Citing WIPO | Citing USPTO | |
|---|---|---|---|---|
| 1 digit | 0.74 | 0.73 | 0.72 | 0.72 |
| 3 digit | 0.89 | 0.87 | 0.87 | 0.88 |
| 4 digit | 0.96 | 0.95 | 0.95 | 0.95 |
| Citing Keyword | Citing Science | Citing WIPO | Citing USPTO | |
|---|---|---|---|---|
| 1 digit | 1.32 | 1.15 | 1.23 | 1.16 |
| 3 digit | 2.75 | 2.27 | 2.57 | 2.33 |
| 4 digit | 4.82 | 3.99 | 4.57 | 4.06 |
| Citing Keyword | Citing Science | Citing WIPO | Citing USPTO | |
|---|---|---|---|---|
| 1 digit | 2.35 | 2.17 | 2.24 | 2.17 |
| 3 digit | 4.60 | 4.04 | 4.39 | 4.10 |
| 4 digit | 7.51 | 6.60 | 7.29 | 6.63 |
| Period | Citing Keyword | Citing Science | Citing WIPO | Citing USPTO |
|---|---|---|---|---|
| 1990-1999 | 12.79 | 12.59 | 12.66 | 12.47 |
| 2000-2009 | 8.95 | 9.03 | 9.01 | 8.84 |
| 2010-2019 | 4.30 | 4.29 | 4.22 | 4.28 |