Thermal and non-thermal X-ray emission from the rotation-powered radio/-ray pulsar PSR J17401000
Abstract
We report the results of new XMM-Newton observations of the middle-aged ( yr) radio pulsar PSR J17401000 carried out in 2017-2018. These long pointings (530 ks) show that the non-thermal emission, well described by a power-law spectrum with photon index , is pulsed with a 30% pulsed fraction above 2 keV. The thermal emission can be well fit with the sum of two blackbodies of temperatures eV and eV, and emitting radii km and km (for a distance of 1.2 kpc). We found no evidence for absorption lines as those observed in the shorter XMM-Newton observations (67 ks) of this pulsar carried out in 2006. The X-ray thermal and non-thermal components peak in anti-phase and none of them is seen to coincide in phase with the radio pulse. This, coupled with the small difference in the emission radii of the two thermal components, disfavors an interpretation in which the dipolar polar cap is heated by magnetospheric backward accelerated particles. Comparison with the other thermally emitting isolated neutron stars with spectra well described by the sum of two components at different temperatures shows that the ratios / and / are similar for objects of different classes. The observed values cannot be reproduced with simple temperature distributions, such as those caused by a dipolar field, indicating the presence of more complicated thermal maps.
keywords:
pulsar: general – pulsar: individual: PSR J17401000, PSR B105552 – stars: neutron – X-rays: stars1 Introduction
The radio pulsar PSR J17401000 was discovered in 2000 in a survey performed with the Arecibo radiotelescope (McLaughlin et al., 2002). Its timing parameters ( s, s s-1) imply that PSR J17401000 is an ordinary rotation-powered pulsar (RPP) with characteristic age yr, spin-down luminosity erg s-1, and dipolar magnetic field G at the neutron star surface. Its distance, inferred from the dispersion measure using the Yao et al. (2017) electron-density model of the Galaxy, is about 1.2 kpc.
This pulsar has a particularly high Galactic latitude of that, for the distance quoted above, corresponds to a height of pc above the Galactic plane. If PSR J17401000 was born within the scale-height of massive stars in the Galactic disk and its true age is not much longer than , a projected velocity of 2800 km s-1 is required. This seems unlikely, given that the average velocity of pulsars is about 500 km s-1 and the tail of the distribution extends no further than 2000 km s-1 (Hobbs et al., 2005). Halpern et al. (2013) derived an upper limit of 60 mas yr-1 for its proper motion based on Chandra observations with a 10 years separation. This corresponds to a projected velocity smaller than 350 ( kpc) km s-1. Furthermore, diffuse X-ray emission extending 5–7’ to the South-West direction, if interpreted as a nebula trailing the pulsar, implies a motion towards the Galactic plane (Kargaltsev et al., 2008; Benbow et al., 2021). It is thus more likely that PSR J17401000 was born in the Galactic halo from a runaway massive star or through accretion-induced collapse of a halo population star (McLaughlin et al., 2002; Halpern et al., 2013). Such a possibility is shared with only two other young ( Myr) and distant ( kpc) pulsars, i.e. PSR B091906 (Chatterjee et al., 2001) and 1RXS J141256.0792204 aka Calvera (Mereghetti et al., 2021, and references therein).
PSR J17401000 was first detected in X-rays with the Chandra satellite in 2001 and later observed with two XMM-Newton pointings yielding a 67 ks exposure time in total (Kargaltsev et al., 2008). Using these data, Kargaltsev et al. (2012) discovered an absorption line in the phase-resolved X-ray spectrum. The line properties appeared to vary as a function of the pulsar spin phase, thus ruling out an instrumental/calibration effect. Phase-dependent spectral lines had been reported earlier for sources belonging to some peculiar classes of isolated neutron stars (INSs), i.e. the X-ray dim isolated neutron stars (XDINSs, Kaplan, 2008; Turolla, 2009) and the central compact objects (CCOs, De Luca, 2017). Conversely, this was the first evidence for such a feature in an ordinary RPP; lines in other RPPs were later found in PSR B113316 (Rigoselli & Mereghetti, 2018) and PSR B065614 (Arumugasamy et al., 2018). Recently, PSR J17401000 was detected also at -ray energies by integrating ten years of Fermi-LAT data (Fermi-LAT collaboration et al., 2022), with evidence of pulsations reported in Smith et al. (2019).
Here we report the results of new XMM-Newton observations of PSR J17401000 carried out in 2017-2018. Thanks to a nearly tenfold increase in the exposure time, these data represent a significant improvement compared to the 2006 observations, allowing a better characterisation of the pulsar spectral and timing properties.
2 Observations and data analysis
PSR J17401000 was observed four times by XMM-Newton in 2017-2018, using the same setting for the European Photon Imaging Cameras (EPIC) instrument in all observations. The EPIC-MOS1/2 cameras (Turner et al., 2001) were operated in full-window mode (time resolution 2.6 s) with medium and thin optical filter, while the EPIC-pn camera (Strüder et al., 2001) was in small-window mode (time resolution 5.7 ms) with the thin filter. Only the latter could be used for the timing analysis and phase-resolved spectroscopy. A log of the XMM-Newton pointings of PSR J17401000 is given in Table 1, where, for completeness, we include also the two previous observations.
The data reduction was performed using the epproc and emproc pipelines of version 18 of the Science Analysis System (SAS)111https://www.cosmos.esa.int/web/xmm-newton/sas. Time intervals of high background were removed with the espfilt task with standard parameters, resulting in the net exposure times given in Table 1.
For the timing analysis, we selected single- and multiple-pixel events (pattern4 for the EPIC-pn and 12 for the -MOS). We converted the time of arrivals to the Solar System barycentre using the JPL DE405 ephemeris with the tool barycen. The same event selection was used for the EPIC-MOS spectral analysis, while that of the EPIC-pn was done using only single-pixel events in order to reduce the background at the lowest energies (task espfilt with standard parameters).
We selected source counts in a circular region of radius 30′′, while the background was chosen far away from the pulsar and avoiding the region of the tail emission (the latter was assessed using the EPIC-MOS images, where the tail can be seen better thanks to their larger size).
The spectral analysis was performed using XSPEC (version 12.11.0). The spectra from the EPIC-pn camera were rebinned using the grppha tool with a minimum of 300 (phase-averaged) or 100 (phase-resolved) counts per bin, while those from the EPIC-MOS cameras with a minimum of 50 counts per bin. The interstellar medium absorption was accounted for using the tbabs models with cross sections and abundances of Wilms et al. (2000). We give all the errors at confidence level.
| Obs. ID | Start time | End time | Net Exposure time (ks) | Modes and filters | ||||
|---|---|---|---|---|---|---|---|---|
| (UTC) | (UTC) | EPIC-pn | EPIC-MOS1 | EPIC-MOS2 | EPIC-pn | EPIC-MOS1 | EPIC-MOS2 | |
| 0403570101 | 2006-09-28 00:45:51 | 2006-09-28 12:14:28 | 27.60 | 38.34 | 38.67 | SW-TN | FW-TN | FW-TN |
| 0403570201 | 2006-09-30 01:08:41 | 2006-09-30 08:20:33 | 17.63 | 24.30 | 24.43 | SW-TN | FW-ME | FW-ME |
| 0803080201 | 2017-09-20 16:25:12 | 2017-09-22 04:50:12 | 67.73 | 88.01 | 89.06 | SW-TN | FW-TN | FW-TN |
| 0803080301 | 2017-10-04 15:25:30 | 2017-10-06 04:02:10 | 76.49 | 100.70 | 101.43 | SW-TN | FW-TN | FW-TN |
| 0803080401 | 2018-03-05 04:41:46 | 2018-03-06 16:46:46 | 47.69 | 64.59 | 71.43 | SW-TN | FW-TN | FW-TN |
| 0803080501 | 2018-04-04 00:23:42 | 2018-04-05 15:12:03 | 76.98 | 108.39 | 118.00 | SW-TN | FW-TN | FW-TN |
| 0842820101 | 2019-06-20 18:22:24 | 2019-06-21 17:40:39 | 47.20 | 66.39 | 66.14 | SW-TN | FW-ME | FW-ME |
| 0842820201 | 2019-07-09 00:17:40 | 2019-07-09 22:29:35 | 51.91 | 73.40 | 74.35 | SW-TN | FW-ME | FW-ME |
3 Results
| MJD range | ||
|---|---|---|
| Epoch zero | ||
| (Hz) | ||
| ( Hz s-1) | ||
| ( Hz s-2) | ||
| Reference | McLaughlin et al. (2002) | This work |
3.1 Timing analysis
In order to obtain the relative phase alignment of the X-ray pulse profiles with those at other wavelengths, we have phase aligned the data using a radio derived ephemeris from the Lovell Telescope at Jodrell Bank Observatory. PSR J17401000 has been observed at a centre frequency of 1520 MHz with the Lovell Telescope since 2007, at a roughly weekly cadence, and typical rms residual of 200 s. We use tempo2 to fit a timing model with spin frequency and two derivatives to data taken between 2017-03-26 and 2018-05-23, with the best-fit parameters given in Table 2. For consistency between the X-ray and radio software tools, the definition of zero phase was set to MJD 58116, at infinite frequency, at the solar system barycentre, although this does not correspond to any special feature on either the radio or X-ray light curves. For comparison, a 1520 MHz radio pulse profile from a 350 s Lovell Telescope observation on 2018-04-10 was also aligned with this ephemeris and dedispersed to infinite frequency using psrchive. The pulsar exhibits significant red spin noise which prevents us from extrapolating the timing of the pulsar back to earlier X-ray observations, and so the previously published ephemeris was used for the 2006 observation, also listed in Table 2. They are significantly different because of a glitch that occurred in 2012 (Basu et al., 2022).
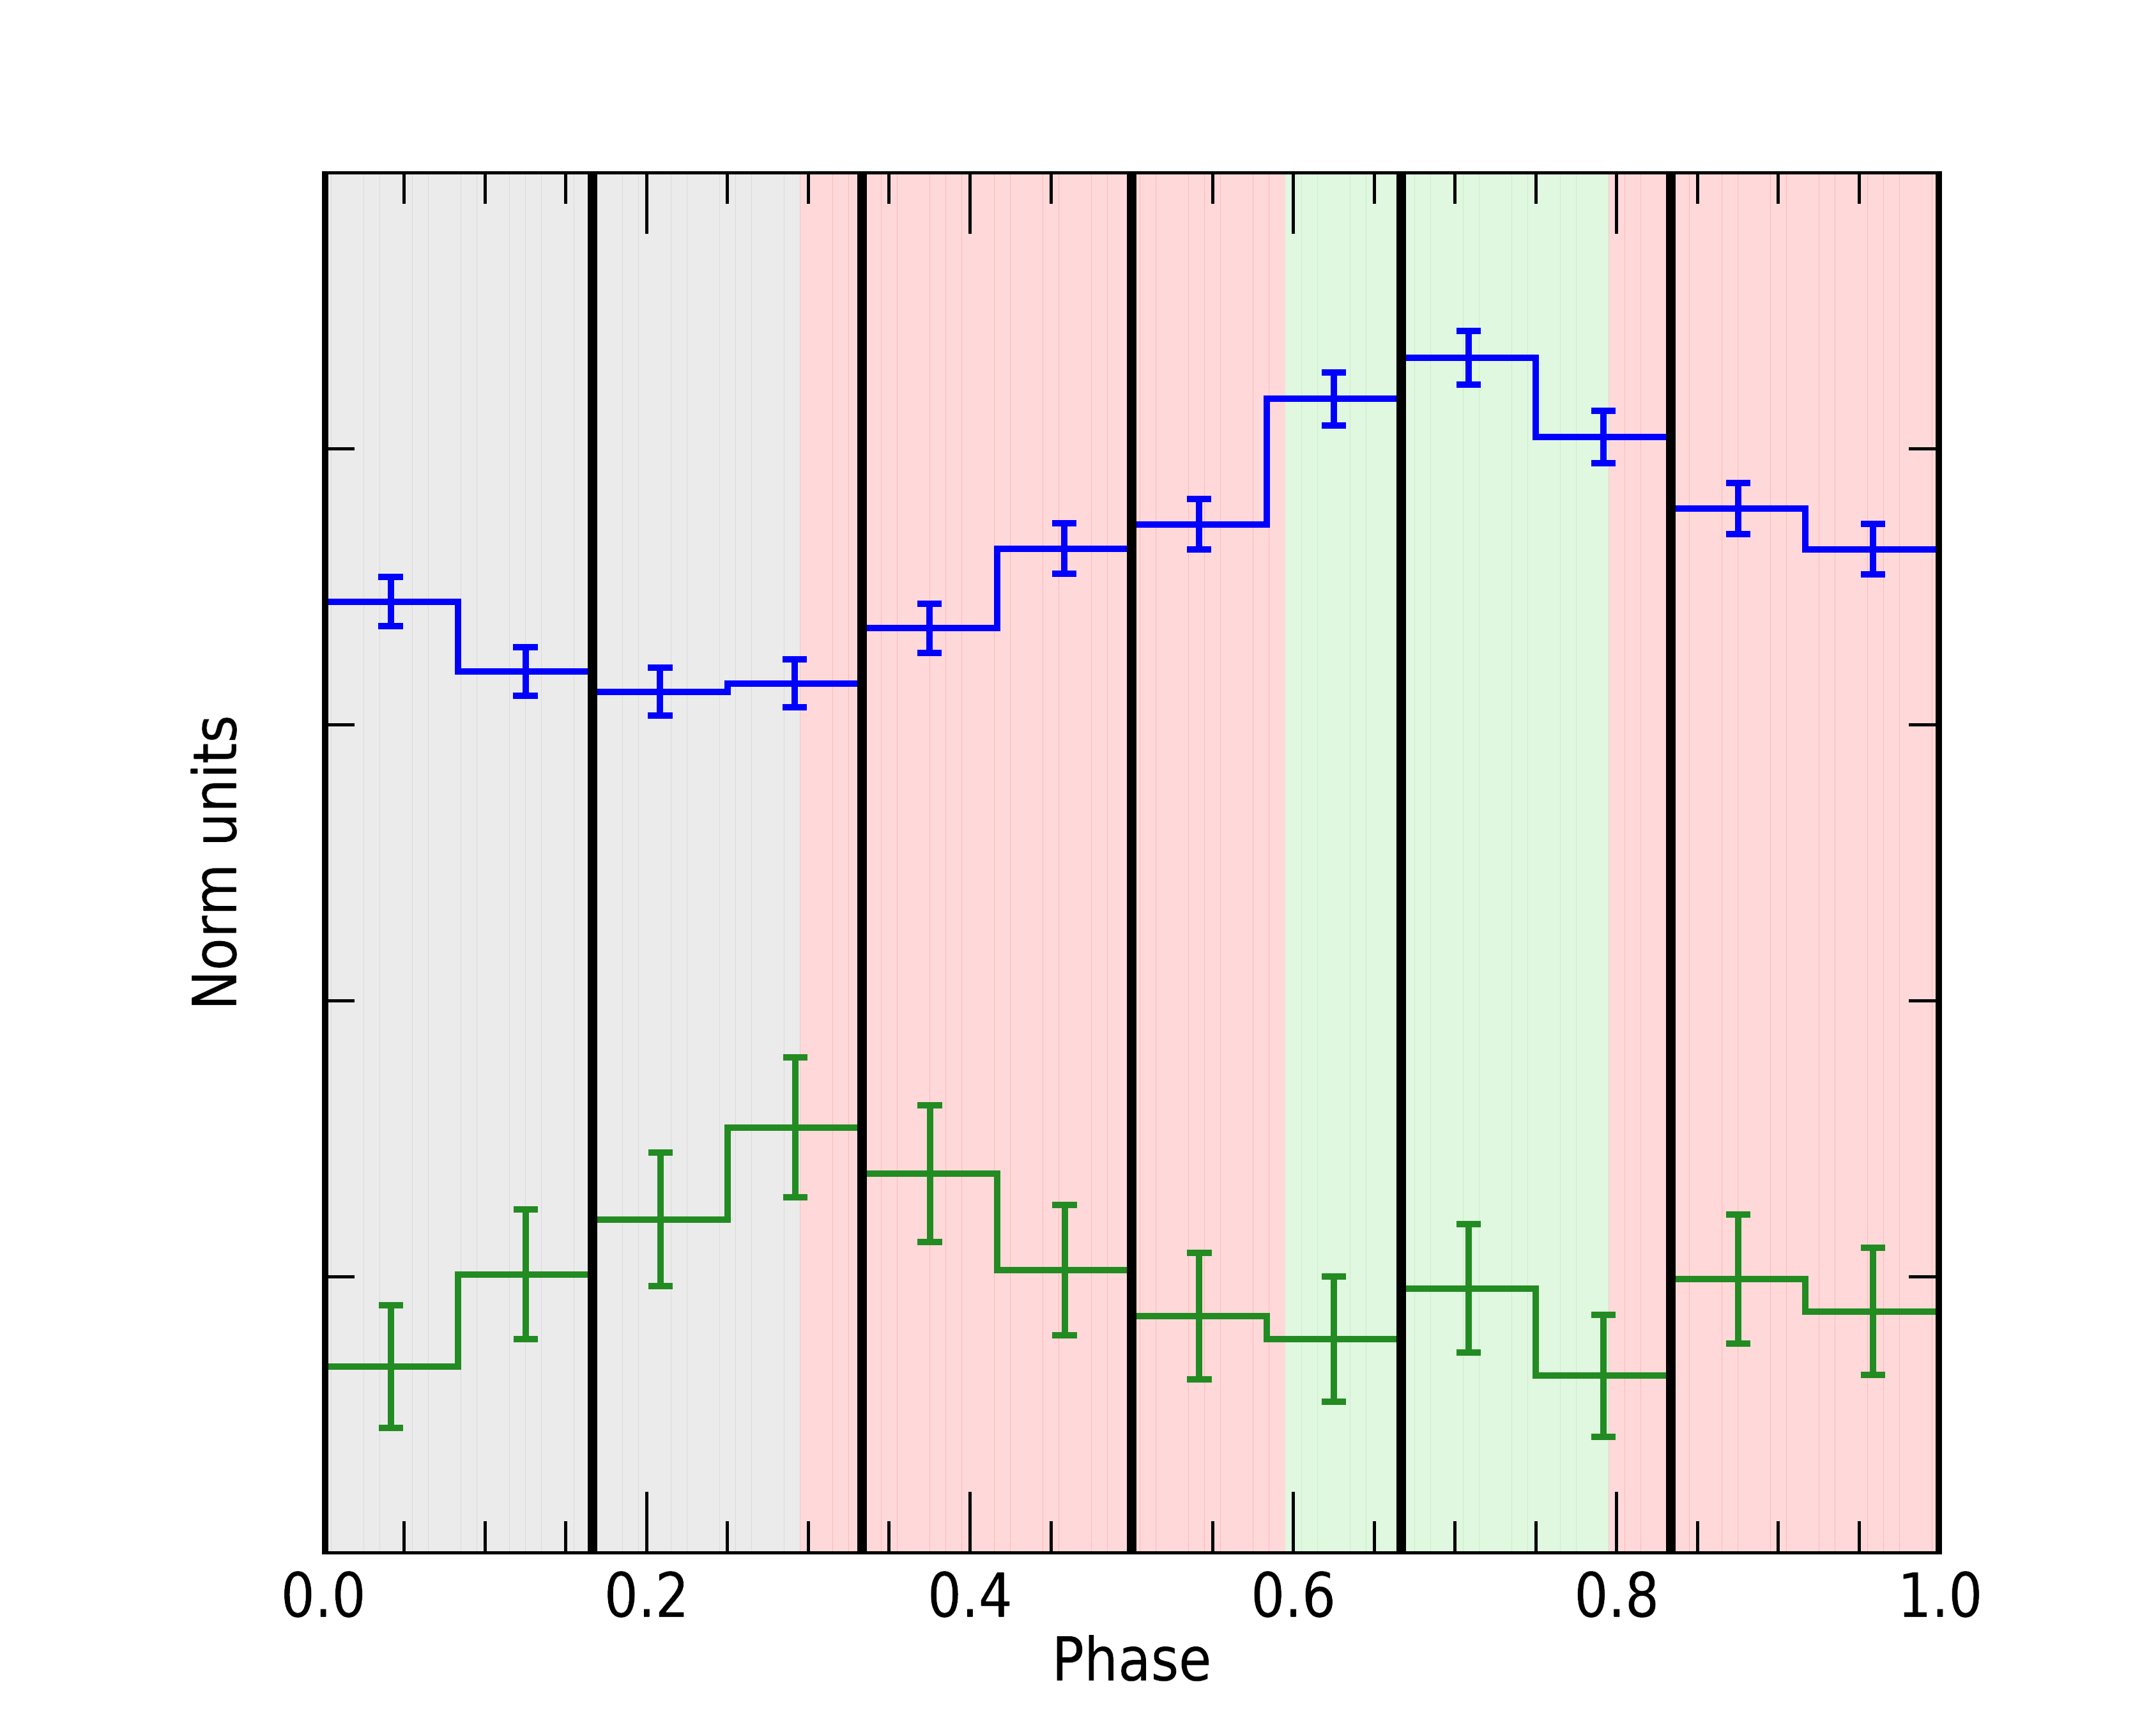
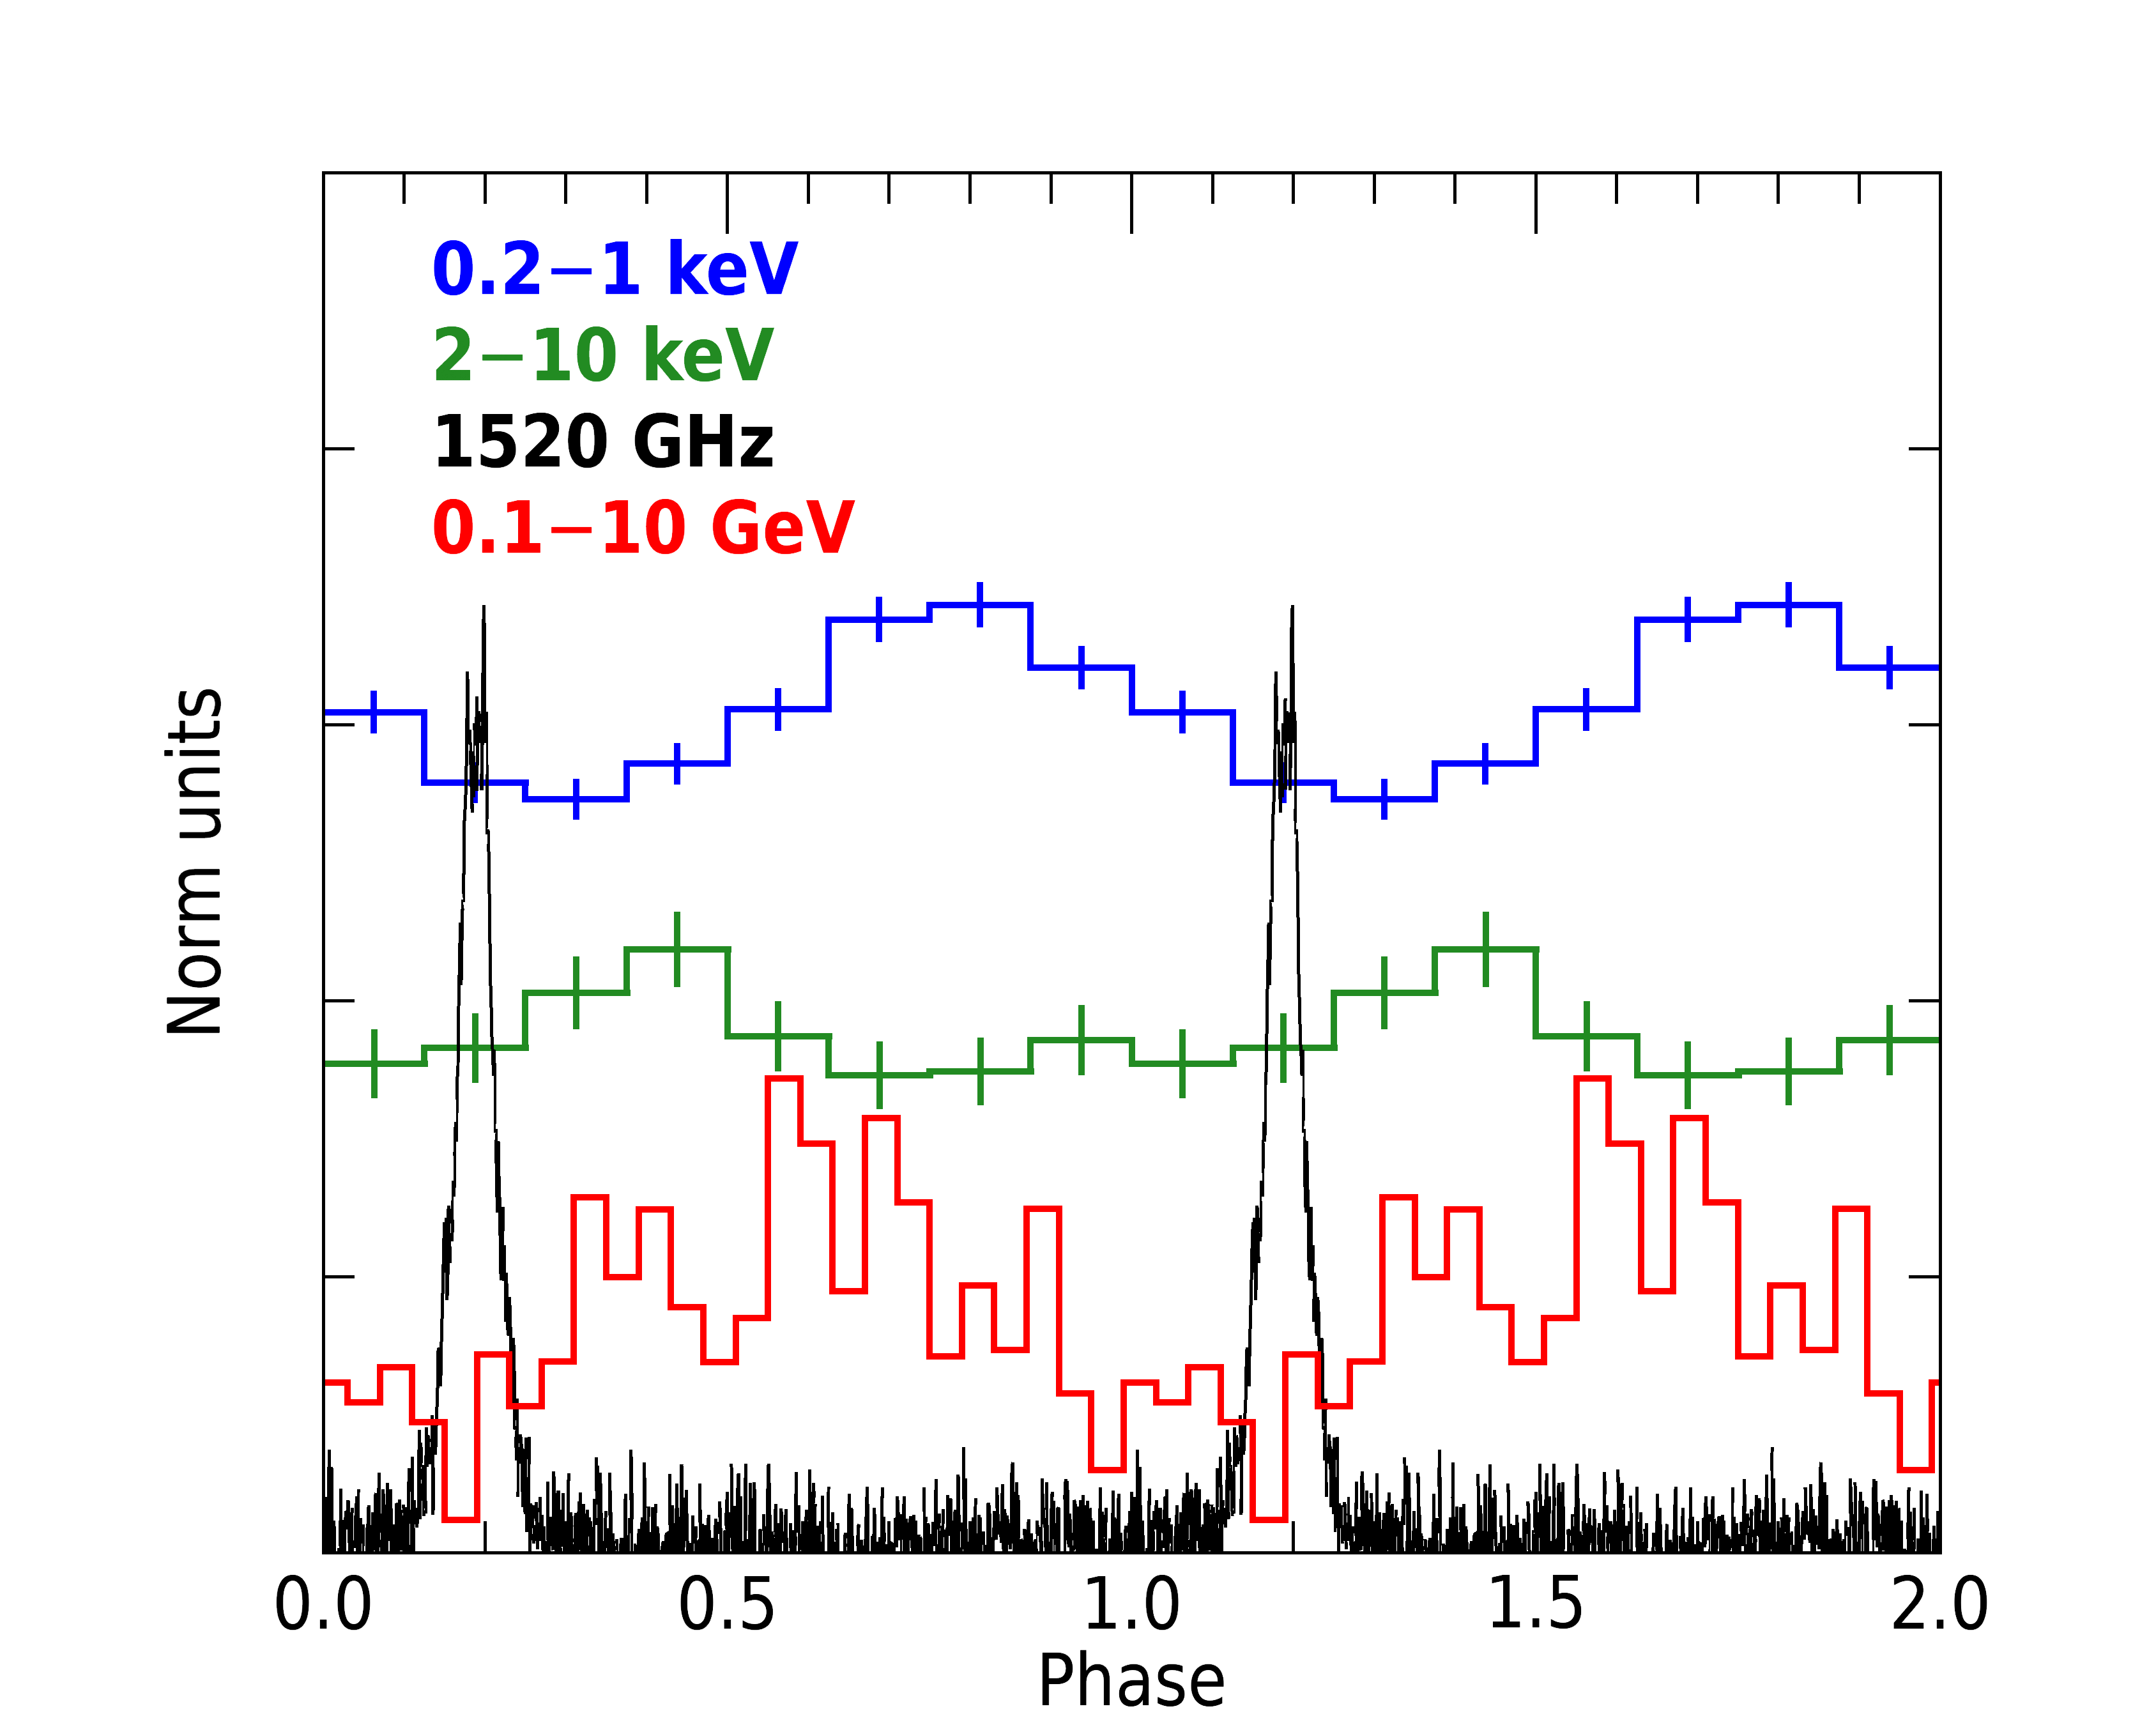
The X-ray light curves obtained by folding all the 2017-2018 data with the radio ephemeris are shown in Figure 1. We show the pulse profile in two energy ranges, 0.2–1 keV and 2–10 keV, and we highlight the phase bins used in the phase-resolved spectral analysis (see Sections 3.2.2 and 3.2.3).
As an independent cross-check we also performed searches for pulsations in the four individual observations based only on the X-ray data. We used the 0.3–1 keV range, where the source is brightest and the background is negligible, and searched in the 6.4893–6.4897 Hz frequency range with the -test (Buccheri et al., 1983). The pulsations were significantly detected in all the observations, with best periods consistent, within their errors, with the more precise values reported in Table 2.
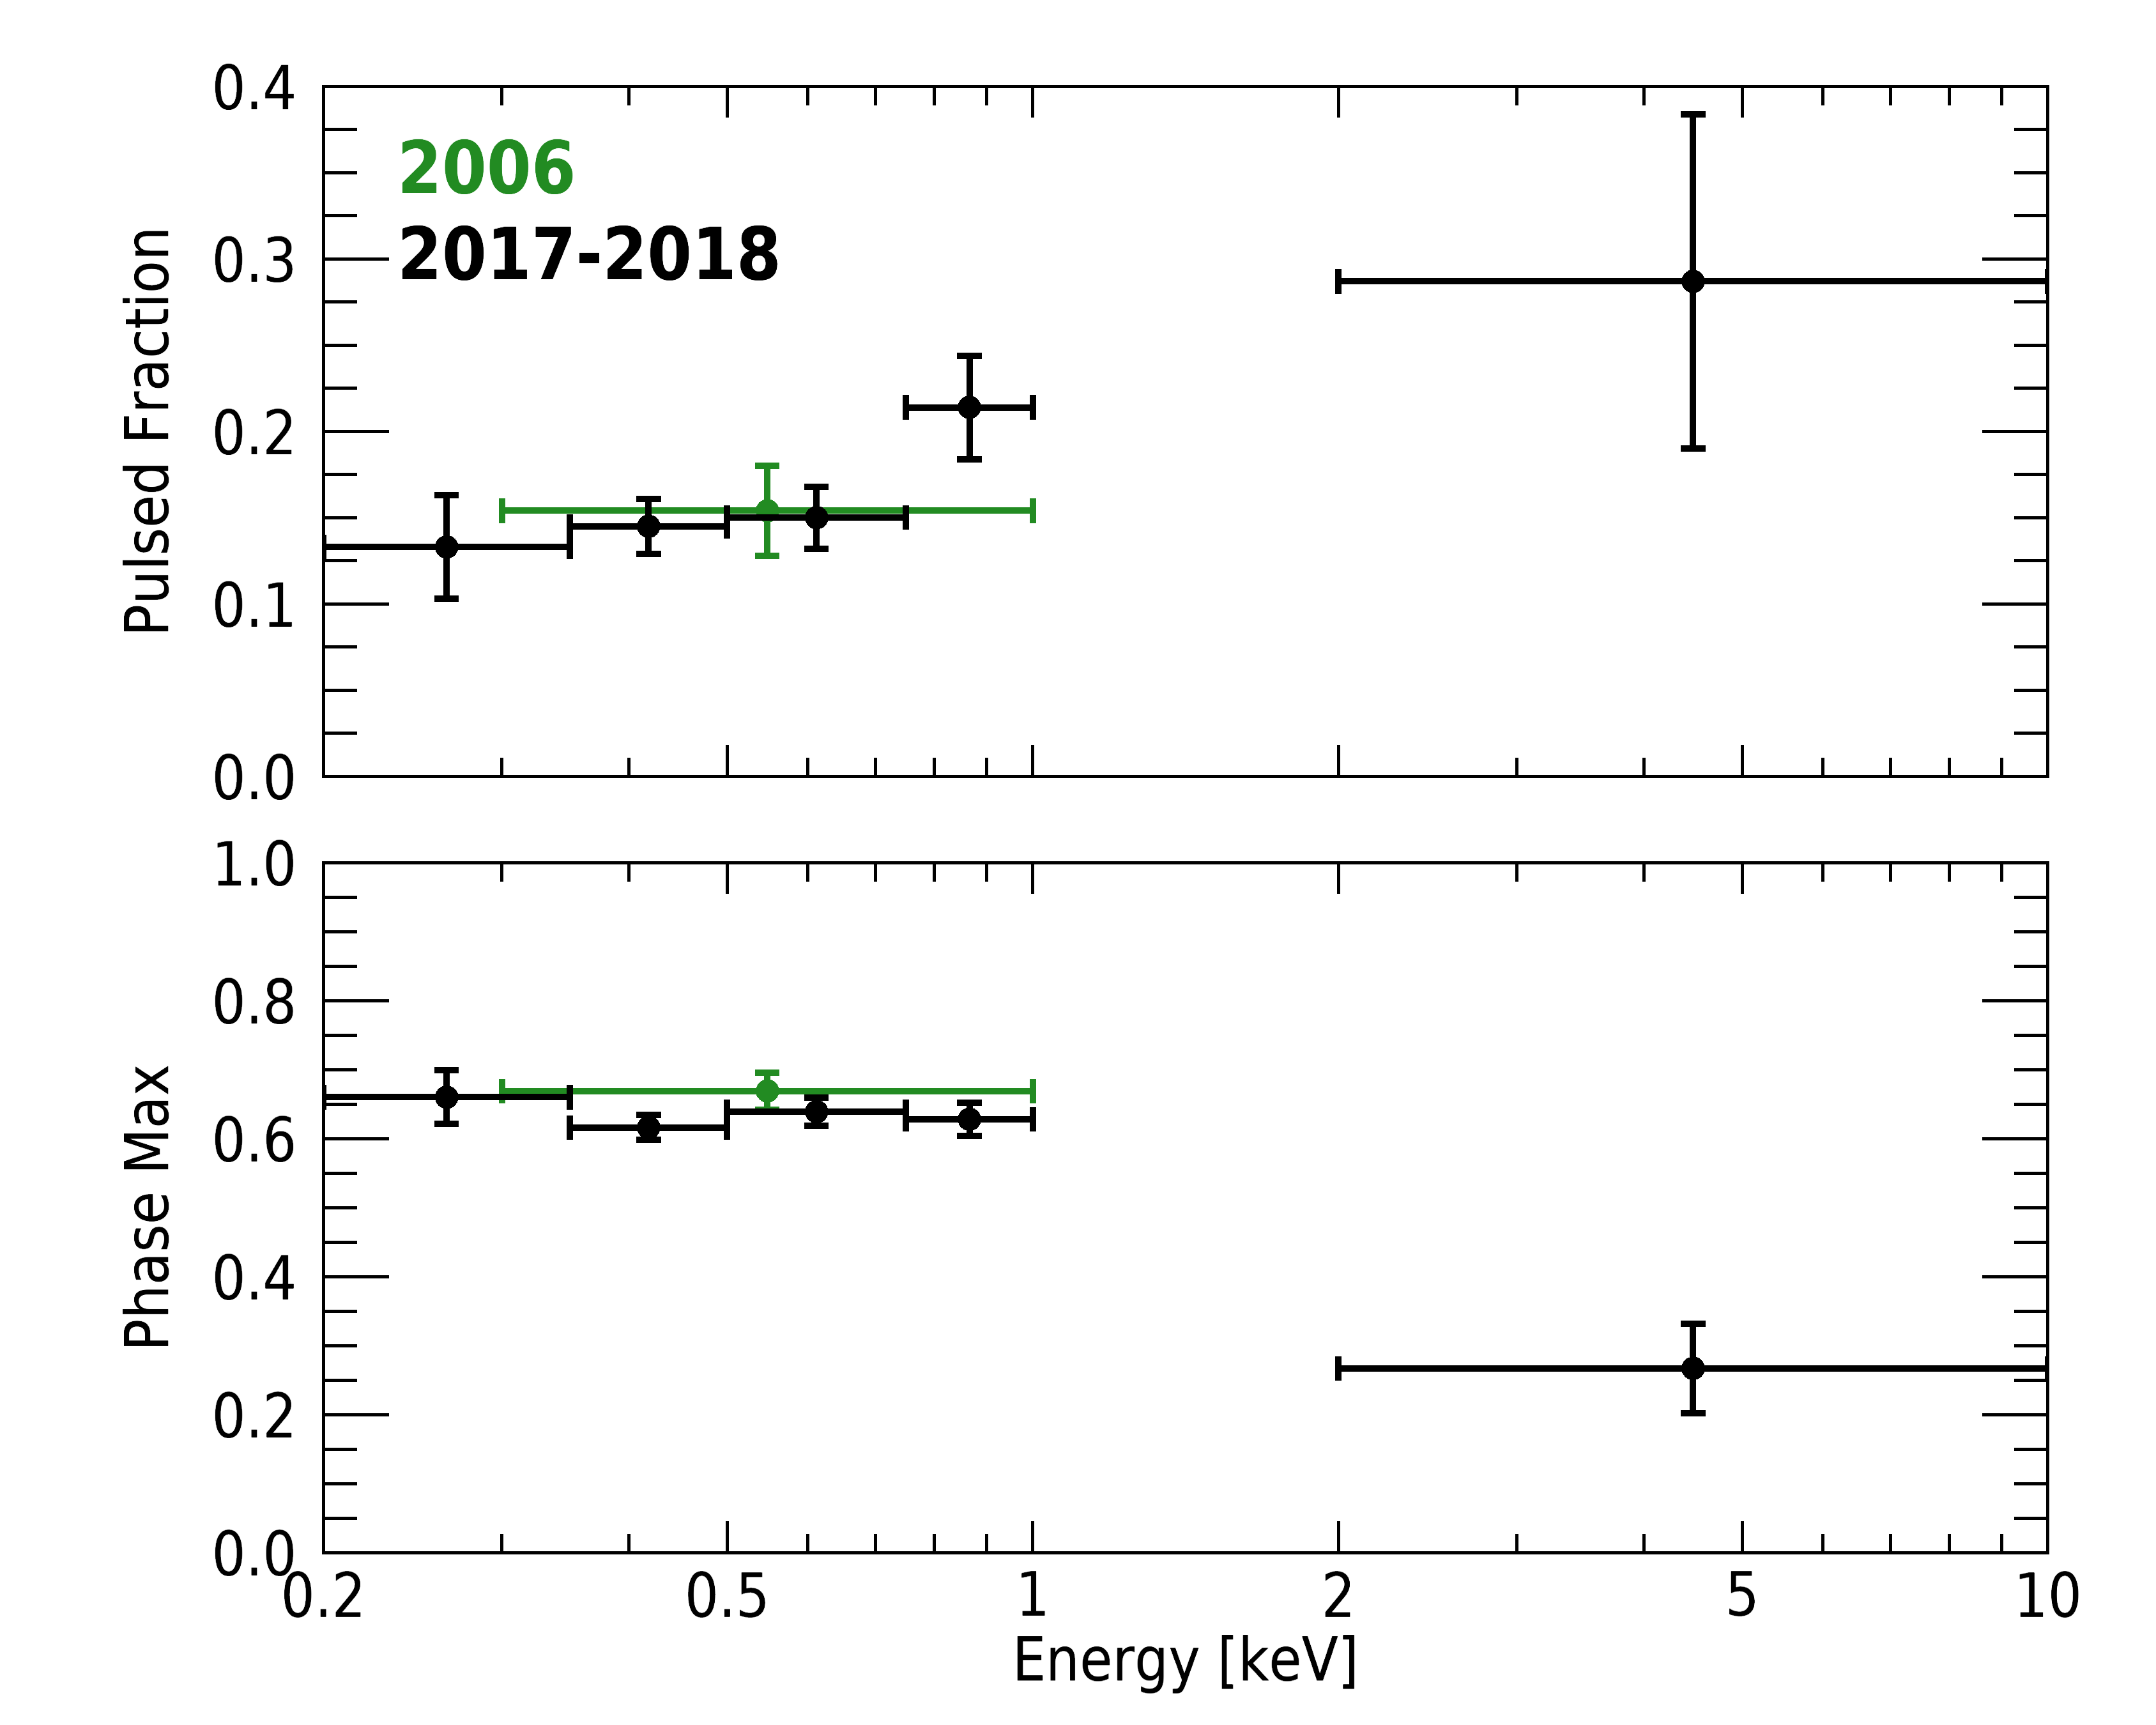
To study the energy-dependence of the pulsed flux, we extracted background-subtracted pulse profiles in different energy ranges and fitted them with the function
| (1) |
where is the phase of the maximum. We define the pulsed fraction as PF=. The fits gave always a good description of the pulse profiles, but in the range 1–2 keV the data could be well fit also by a constant function ( for 7 dof wrt for 5 dof in the case of Eq. 1).
The derived values of the PF and , for each energy bin, are shown in Figure 2. The PF is approximately constant below 0.75 keV (, then it increases between 0.75–1 keV ( and between 2–10 keV (. There is a difference of about between the phases of the maximum in the soft and hard energy ranges. The apparent lack of pulsations between 1 and 2 keV could be due to the phase difference of the two spectral components that contribute equally in this intermediate energy range. For comparison, we plotted in Figure 2 also the values that we derived from the 2006 data, where the pulsations can be seen only integrating the whole 0.3–1 keV range.
3.2 Spectral analysis
After checking that no substantial differences were present in the spectra of the four 2017-2018 observations, we combined them into one single spectrum for the EPIC-pn and one for the sum of the two EPIC-MOS. In the following all the results refer to these summed spectra.
3.2.1 Phase-averaged spectra
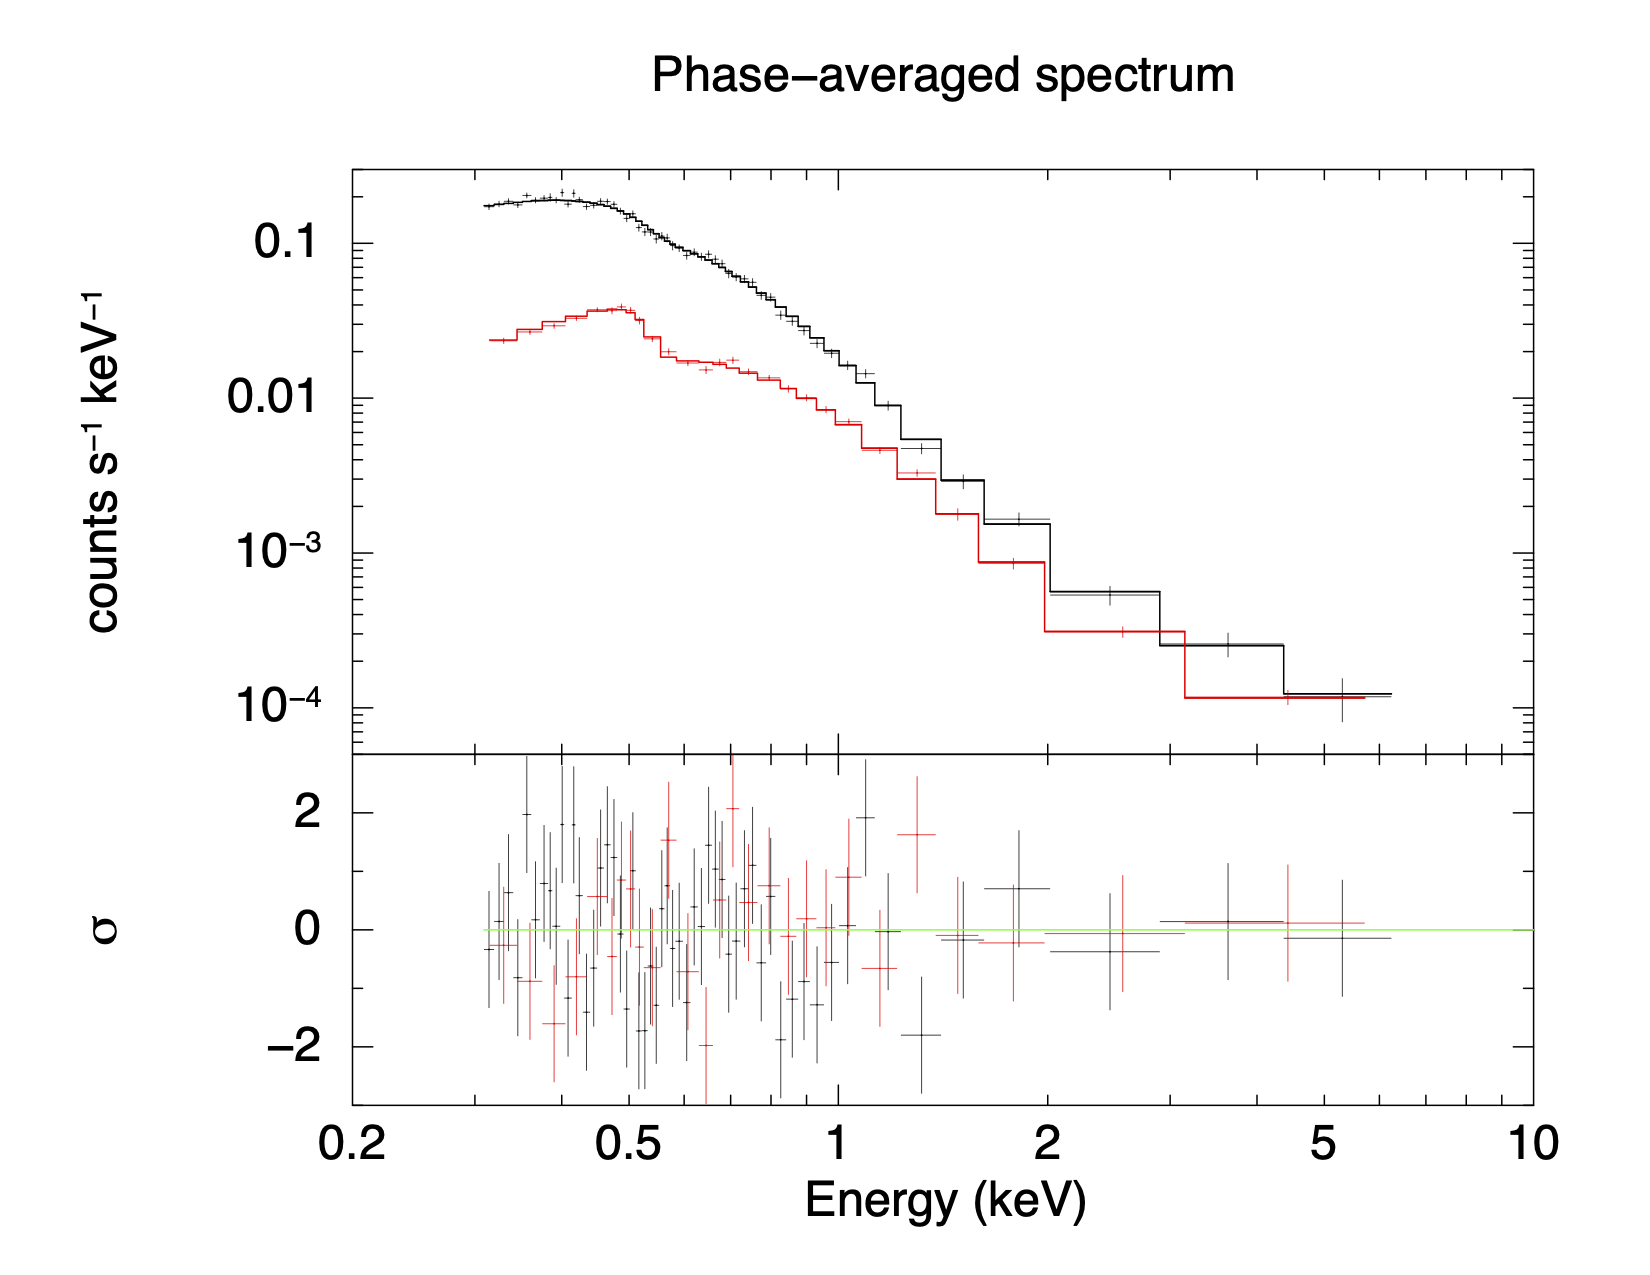
The EPIC-pn and -MOS spectra were fitted together in the 0.3–7 keV range with the model used in previous works (Kargaltsev et al., 2012), which consists of three components, two blackbodies and a power law (2BB+PL), modified by interstellar absorption. We included a normalisation factor to account for possible cross-calibration uncertainties between the three cameras.
We obtained an acceptable fit with a power-law photon index , blackbody temperatures eV, eV, and emitting radii km, km (for kpc). The best-fit absorption column density is cm-2, and is consistent with the DM-based value (DM , Bilous et al. 2016) of cm-2 obtained with the usual assumption of a 10% ionization of the interstellar medium (He et al., 2013). Our measurement of is also consistent with the total Hi column density for the source position ( cm-2) according to the sky map of HI4PI Collaboration et al. (2016). The best-fit model is shown in Figure 3 and all the parameters are summarised in Table 3.
A good fit was also found with a magnetised atmosphere model plus a power law. We used the nsmaxg models of XSPEC, that were computed for a partially ionized, strongly magnetised hydrogen atmosphere (Ho et al., 2008; Ho, 2014). We fixed and km; the best-fit normalisation is related only to the star distance. We considered models that have a surface temperature and magnetic field distributions according to the magnetic dipole model. We explored models with G at the pole and angles between the line of sight and magnetic axis of 0∘ (123100) or (123190).
The first model can fit well the spectra ( for 76 dof) with MK (that corresponds to an observed temperature eV) and kpc. The second model ( for 76 dof) provides a higher temperature MK ( eV) and a distance of about 1 kpc, that is more consistent with the DM-inferred value. See Table 3 for further details.
3.2.2 Phase-resolved spectra
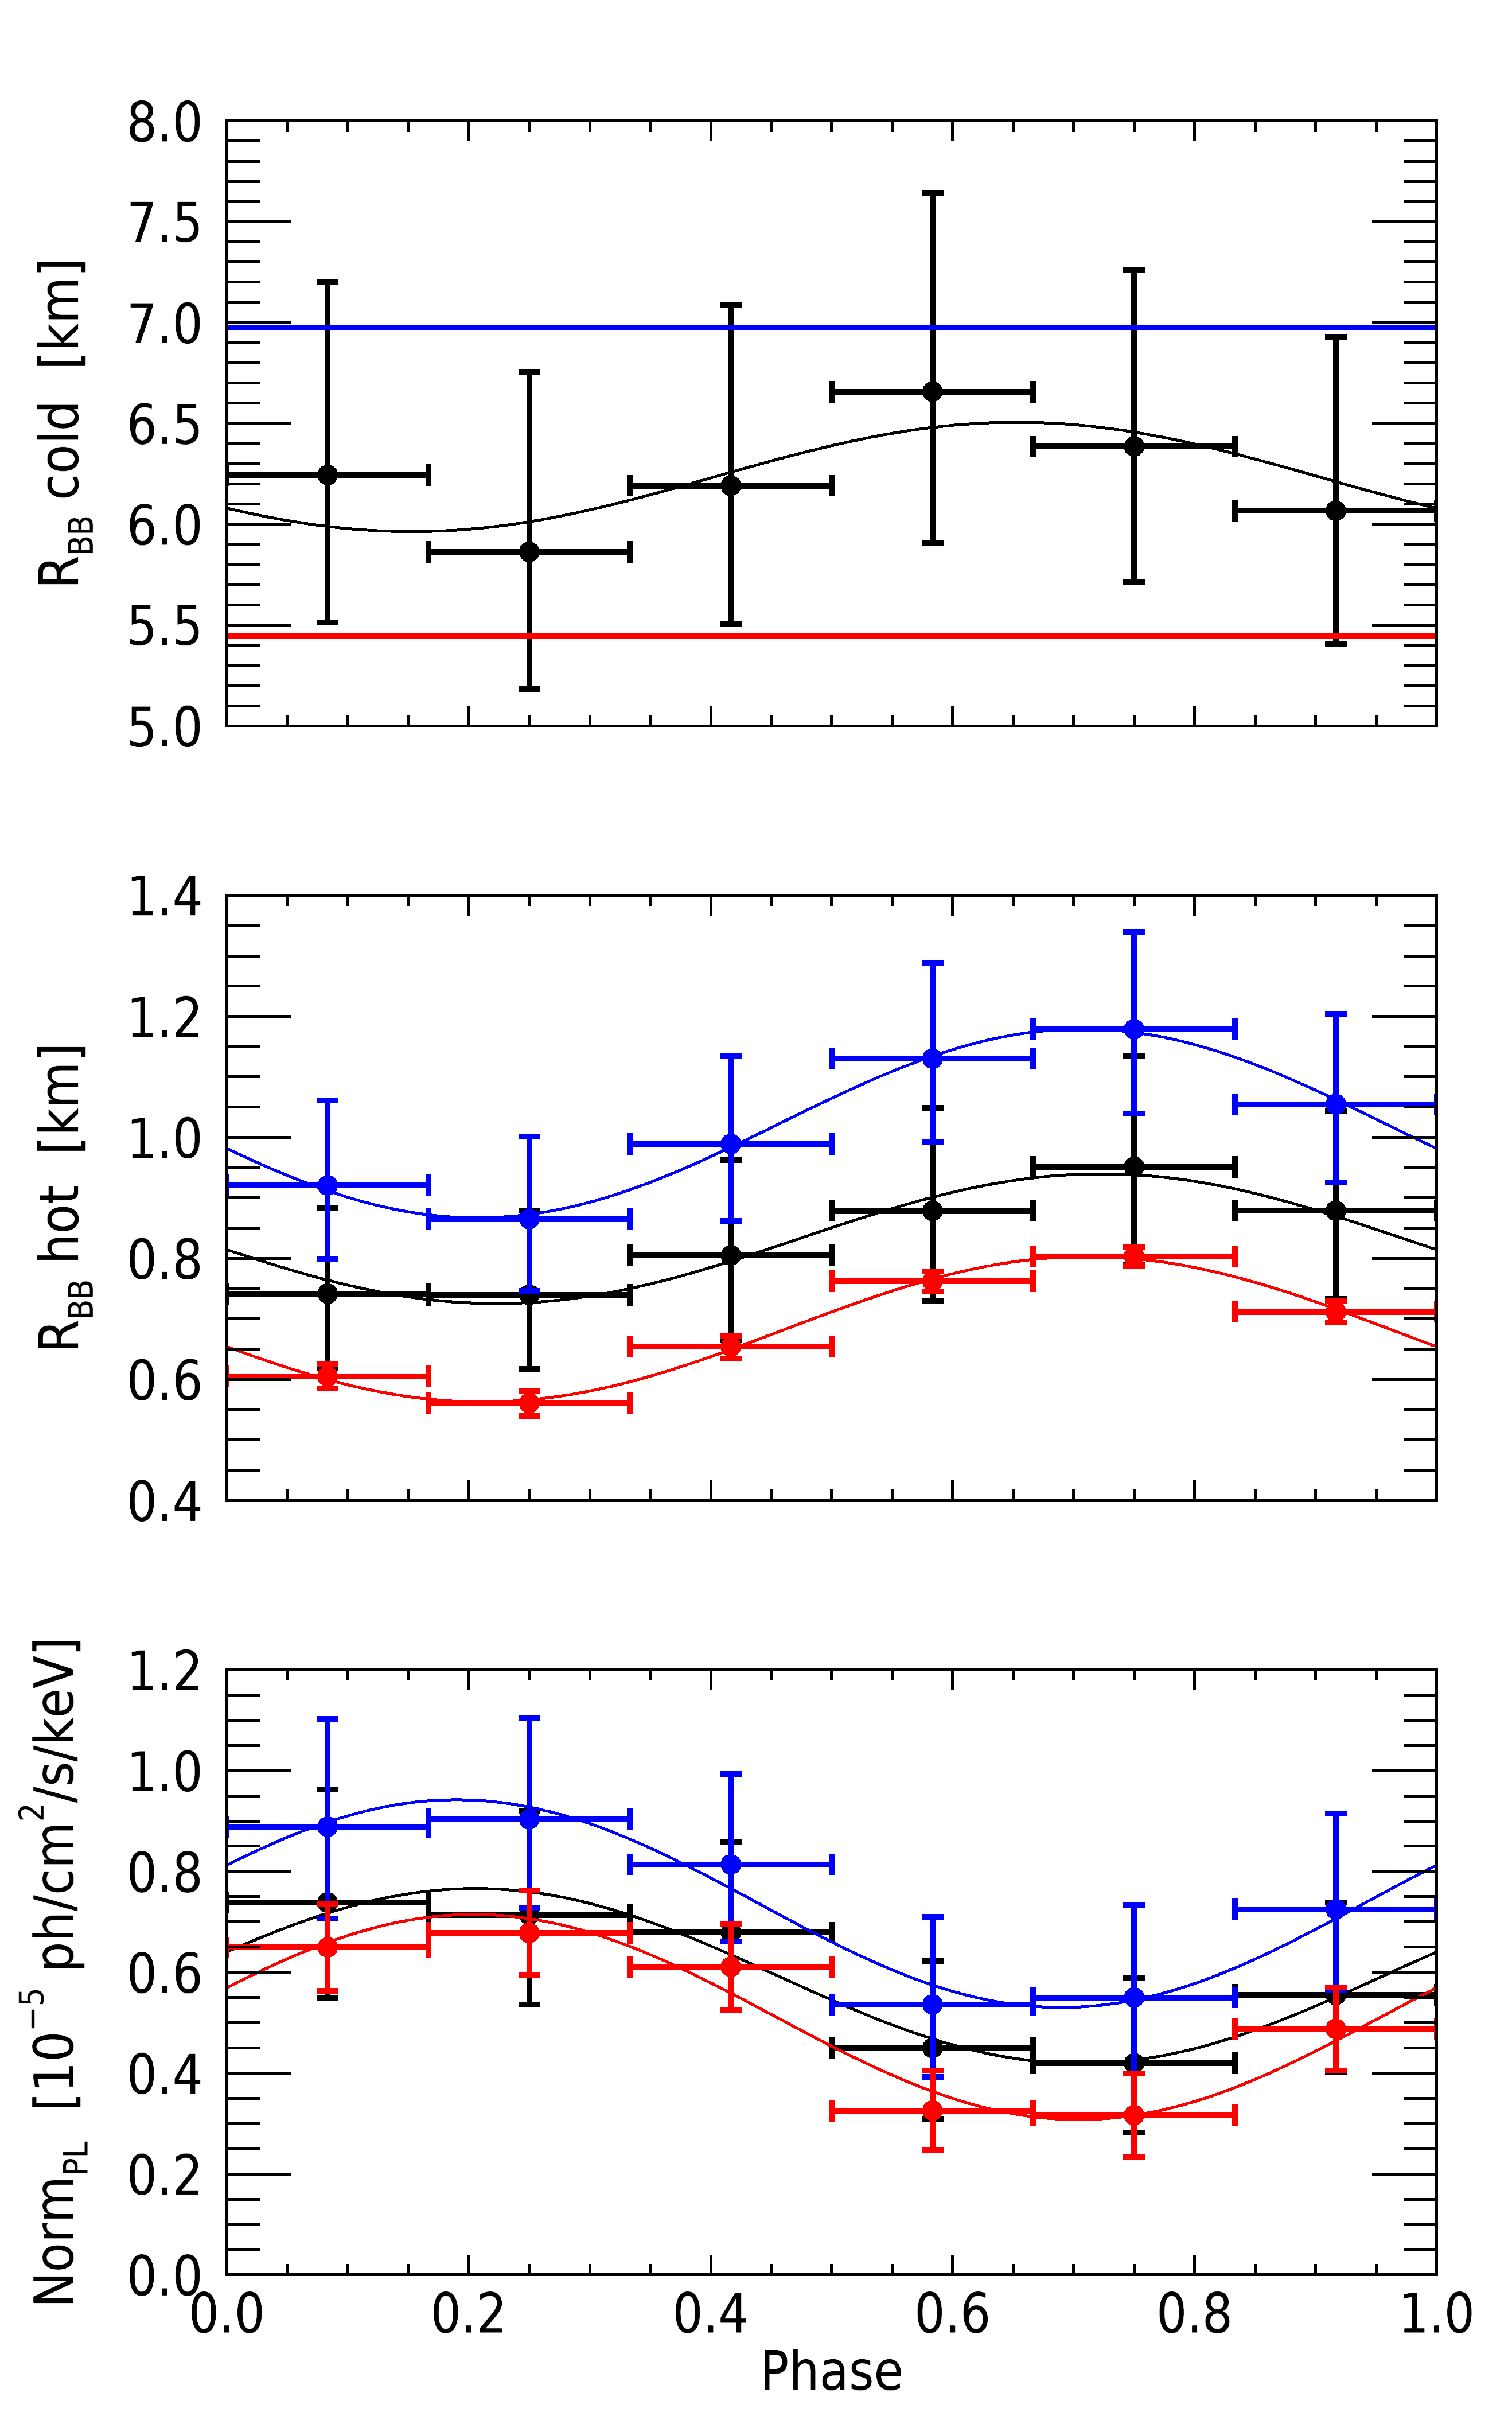
We extracted six spectra corresponding to the six phase intervals shown by the black vertical lines in Figure 1 from the EPIC-pn data and fitted them simultaneously with the same three-components model used for the phase-averaged analysis (2BB+PL).
It was impossible to significantly constrain all the parameters. Therefore, we fixed the absorption to the value derived above, cm-2, and linked the two blackbody temperatures and the power-law index to common values for all the phases.
In this way we obtained the best-fit parameters plotted with the black points in Figure 4 and given in Table 3. A good fit was obtained, but since all the normalisations of the colder blackbody were consistent with the same value, we imposed a common value also for this parameter. The spectral variations can be well reproduced by changing only the relative normalisations of the power law and of the hotter blackbody (blue points in Figure 4).
Finally, we tried a fit with the temperatures of the two blackbodies and the photon index fixed to the phase-averaged values. Only the normalisations of the hot blackbody and of the power law were left free to vary. Also in this case a good fit was obtained (red points in Figure 4).
These results indicate that the three spectral components are present at all the phases, although with different normalisations. The phase dependence of the hotter blackbody and of the non-thermal component reflect the shape of the pulse profiles observed below 1 keV and above 2 keV, respectively. Although this spectral decomposition is clearly not unique, it involves a reasonably small number of free parameters and suggests that the colder thermal emission, with an emitting radius of km and a temperature eV, comes from the bulk of the star’s surface, while the flux from a hotter and smaller region, modulated by the pulsar rotation, accounts for the pulsations seen at low energy. On the other hand, the pulsations at keV can be associated to non-thermal emission from a different region, as indicated by phase shift between the low- and high-energy pulse profiles.
| Model | dof | dof | nhp | ||||||||
|---|---|---|---|---|---|---|---|---|---|---|---|
| 1020 cm-2 | eV | km | eV | km | kpc | a | |||||
| Phase-averaged spectra: | |||||||||||
| 2BB+PL | 1.07 | 74 | 0.32 | ||||||||
| NSMAXG b 123100 +PL | 1.20 | 76 | 0.11 | ||||||||
| NSMAXG b 123190 +PL | 1.16 | 76 | 0.16 | ||||||||
| NSMAXG b 123190 +PL | 1.07 | 76 | 0.17 | ||||||||
| 2BB+PL phase-resolved spectra: | |||||||||||
| Free norm., and linked | variable | variable | variable | 0.92 | 173 | 0.75 | |||||
| linked, and linked | variable | variable | 0.95 | 178 | 0.66 | ||||||
| linked, and fixed | variable | variable | 0.99 | 181 | 0.53 |
Notes. Joint fits of EPIC-pn+MOS1+MOS2 phase-averaged spectra and EPIC-pn phase-resolved spectra of PSR J17401000. Temperatures and radii are observed quantities at infinity. Errors at 1. a Power-law normalization in units of photons cm-2 s-1 keV-1 at 1 keV. b NSMAXG models (Ho et al., 2008; Ho, 2014) with , km, a dipole distribution of the magnetic field ( G at the poles) and consistent temperature distribution, seen with (123100) or (123190). c Fixed value.
3.2.3 Absorption features
No evidence for spectral lines was found in our analysis of the phase-averaged and phase-resolved spectra of PSR J17401000 when the 2BB+PL model was used.
On the other hand, Kargaltsev et al. (2012) reported the presence of a phase-dependent line in the 2006 data, when fitting the continuum with a single blackbody. These authors considered three phase intervals (dip, rise and fall, peak, see Figure 1) and found lines with centre at eV, width eV, and equivalent width eV (dip), eV, eV, eV (rise and fall) and eV, eV, eV (peak). We carried out a search for similar features in the new XMM-Newton observation by extracting three spectra corresponding to the same phase intervals. We fitted them in the 0.2–1.1 keV range with a single blackbody plus a Gaussian absorption line (GBB) and fixed at cm-2, as done by these authors222They limited their analysis to energies below 1.1 keV because of the poor statistics of the 2006 data, so they could neglect the contribution of the power law.. The blackbody parameters were linked between the three spectra, while the line parameters were left free to vary. A good fit ( for 178 dof) was obtained with eV, km and eV. However, the best-fit parameters for the Gaussian components are very different from those found in the 2006 data. We find much larger and shallower lines: (dip), (rise and fall) and keV (peak). As shown by Viganò et al. (2014), broad absorption features with these characteristics can appear when one tries to fit with a single component spectra well described by multiple thermal components, as is the case of PSR J17401000. The fact that the line parameters change with the phase can be understood considering that the underlying continuum is changing.
In order to understand if the difference between our findings and those of Kargaltsev et al. (2012) are due to a long term change in the spectrum, we first repeated the same analysis on the 2006 data. With the GBB model we found eV and km, and the spectral lines have a eV and widths (dip), (rise and fall) and eV (peak). These results are consistent with those of Kargaltsev et al. (2012).
Then we performed simulations to estimate the probability of not revealing in the new data a feature with the properties seen in 2006 if it were still present. To this aim we simulated EPIC-pn spectra for the three phase intervals with the GBB best fit parameters of the 2006 data, but with the total exposure of the 2017-2018 spectra. We fitted them with the same model, forcing the line widths to be either 200 eV (narrow lines) or 200 eV (broad lines), and compared the results computing the maximum-likelihood ratio test (Cash, 1979).
Fitting the real data we obtained and for 178 dof, yielding . The minimum we found after simulations is 36.23, more than three orders of magnitude larger than . This means that our fits of the 2017-2018 data would miss narrow absorption lines by chance is 10-5. Extrapolation of the distribution down to the observed value shows that we would need at least 107 trials to obtain by chance .
Finally, we wanted to address whether the PSR J17401000 spectrum changed over time, or the narrow lines detected in 2006 were statistically consistent with the 2BB+PL model seen in the new observations. We simulated spectra with counts distributed as the 2017-2018 2BB+PL best fit, but with the total exposure of the 2006 observations. As in the previous case, we computed by fitting the simulated spectra with GBB or 2BB models. Fitting the real 2006 data we obtained for 60 dof, and for 63 dof, yielding . Based on the distribution of the values of the simulated data, this corresponds to a chance probability of . This indicates that there is some evidence for a time variation of the phase-resolved spectrum.
4 Discussion
The long exposure time of the new observations allowed us to better characterise the non-thermal emission of PSR J17401000 that was only poorly constrained and not seen to pulsate with the previous observations. This component is well fit by a power law with photon index and has a flux erg s-1 cm-2. The non-thermal luminosity of erg s-1 (for kpc), corresponds to an efficiency of about , to be compared with that in the 0.1–100 GeV range of (Fermi-LAT collaboration et al., 2022).
X-ray pulsations are seen for the first time above 2 keV, with a pulsed fraction of . The phase-resolved spectral analysis showed that this can be described with a flux modulation of a power-law component with fixed slope and maximum flux peaking nearly in anti phase with respect to the thermal emission. In Figure 5 we show also the radio (1520 GHz) and -ray (0.1–10 GeV, Smith et al. 2019) pulse profiles, that have been phase-aligned using radio ephemeris we specifically derived for the epochs of the X-ray observations. The small count statistics of the -ray pulse profile does not allow to draw strong conclusions on its relative alignment with that of the hard X-rays.
On the other hand, the phase difference of between the radio pulse and the maximum of the thermal emission is significant. In a simple scenario, the surface temperature is expected to peak at the magnetic poles, and the radio emission is produced within the open field lines region above the polar caps. Thus one would expect the radio and thermal emission to peak at the same phase. The combination of field-line sweep back and aberration can introduce a phase shift between the radio emission, which comes from a significant height in the magnetosphere, and the thermal X-rays emitted at the star surface. However, in the case of PSR J17401000 the expected shift is only in phase (Romani et al., 2011). This cannot account for the observed difference, thus suggesting that such a simple geometry does not apply to PSR J17401000 and/or the thermal hotter spot does not coincide with the magnetic pole and, instead, the neutron star thermal map is more complex.
The thermal part of the X-ray spectrum of PSR J17401000 can be well fitted by the sum of two blackbodies with temperatures eV and eV. Phase-resolved spectroscopy revealed that the hotter component is modulated by the pulsar rotation. The average flux corresponds to an emitting radius m. The cooler blackbody has an emitting radius of km, constant through the stellar rotation.
Unless the distance is much larger than that implied by the DM, the resulting emitting area of the cooler component is smaller than what is expected from the whole stellar surface. Emitting radii more consistent with the whole surface are instead obtained with atmosphere models. In fact, the results we obtained with the nsmaxg model (Ho et al., 2008; Ho, 2014) gave a radius of km (depending on the assumption on the star distance, see Table 3).
Our independent reanalysis of the 2006 observations, following the same procedure used by Kargaltsev et al. (2012), confirmed the presence of phase-dependent narrow lines. However, we could not find the same features in the 2017-2018 data that have a higher count statistics. Fitting the new spectra with the GBB model, we find that lines compatible with a reasonable fit are much larger and shallower (width of about 300 eV) than those seen in the 2006 data. As shown by Viganò et al. (2014), broad absorption features with these characteristics can appear when one tries to fit with a single component spectra well described by multiple thermal components, as is the case of PSR J17401000. This led us to conclude that the broad lines observed in the 2017-2018 data are only an artifact and they just indicate a non-uniform thermal map (probably non symmetric and also responsible of the observed changes in the line parameters with phase).
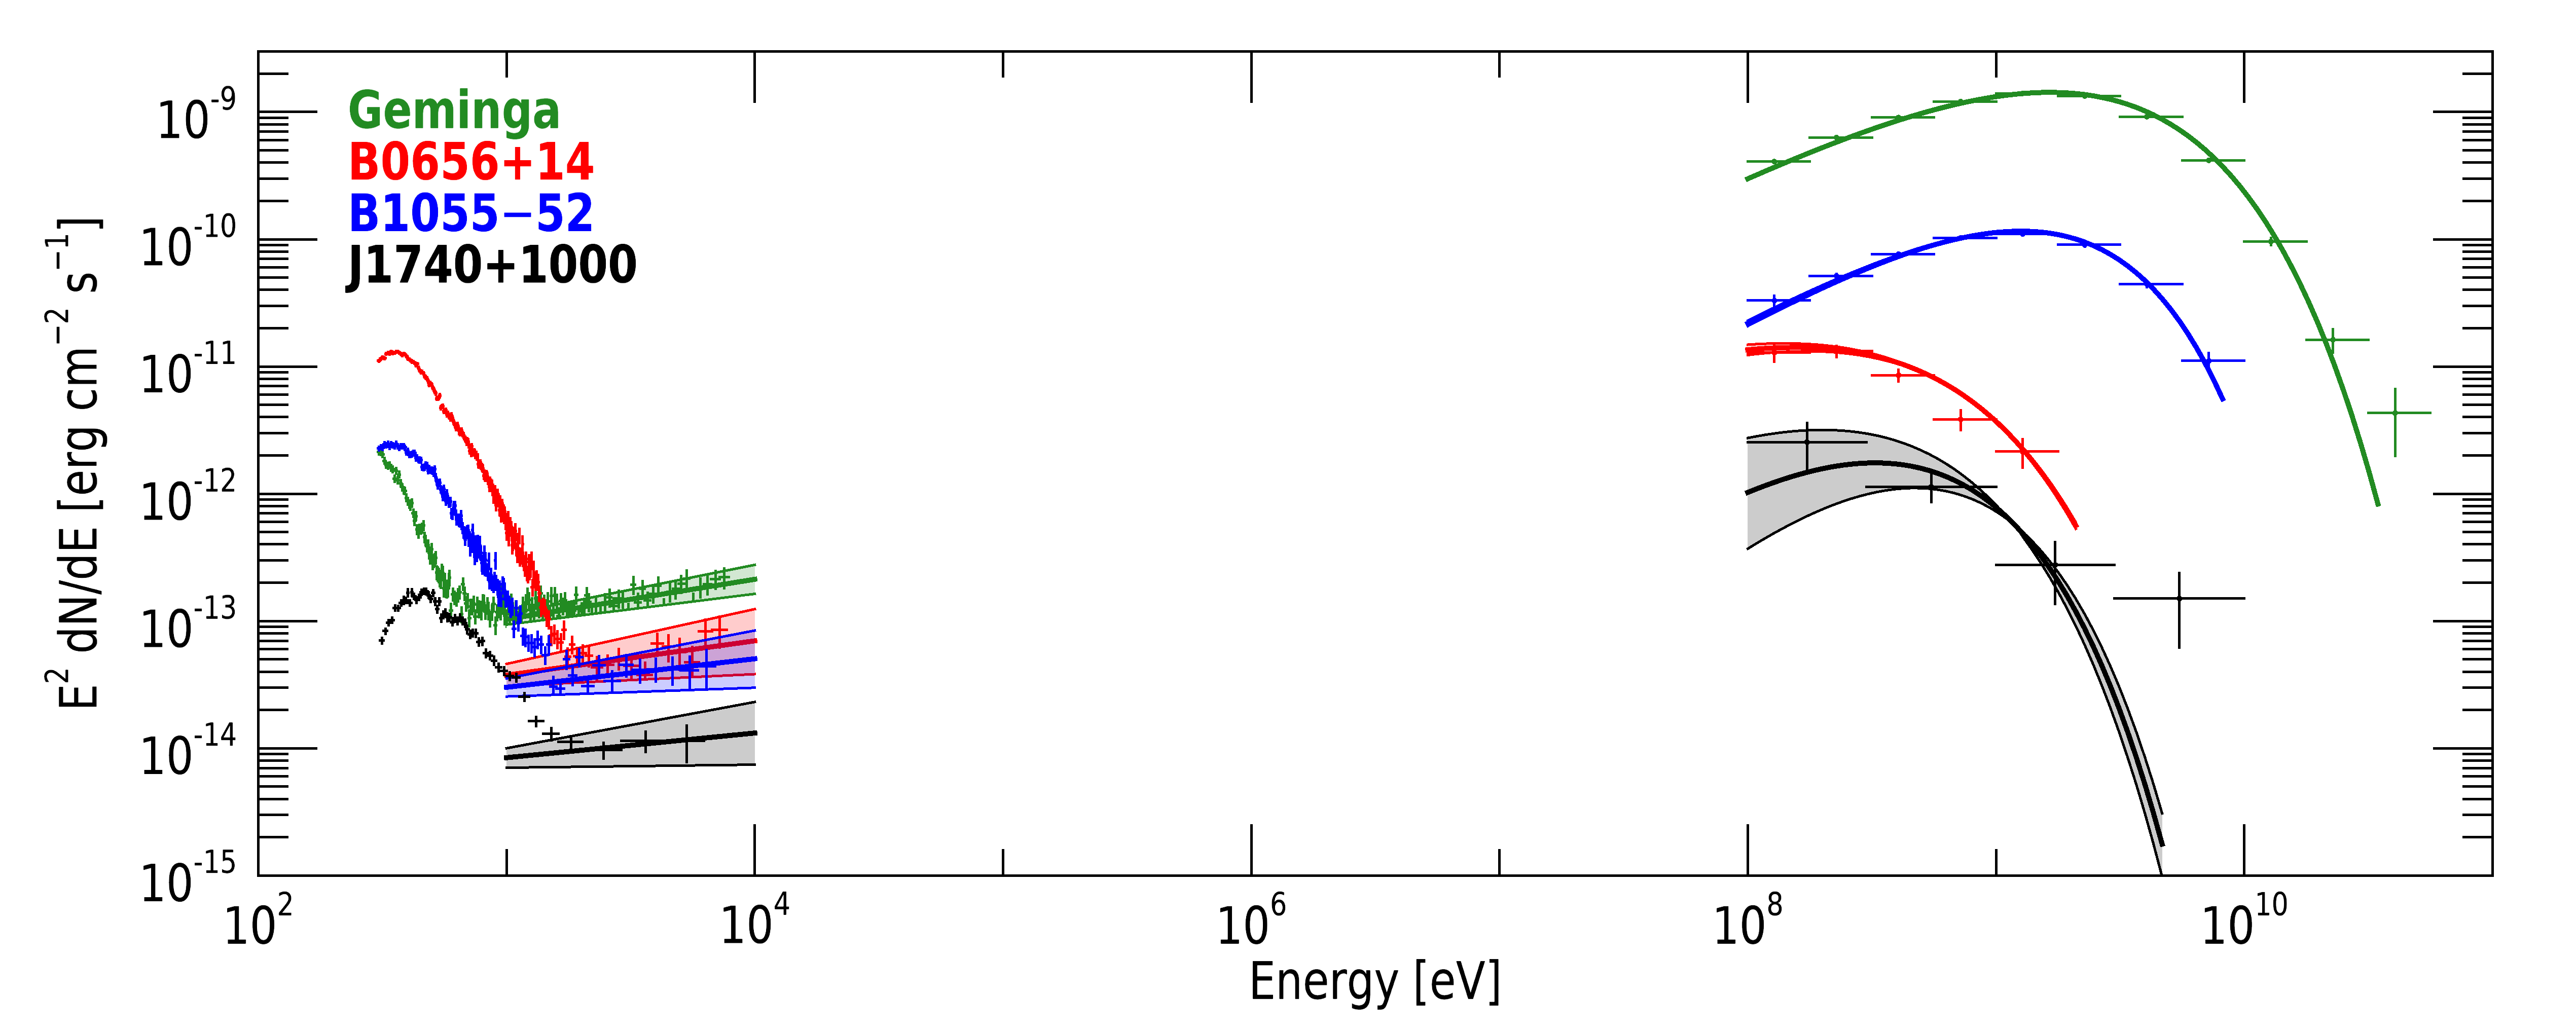
Among the 105 years old RPPs, only three objects in addition to PSR J17401000 have a 2BB+PL spectrum: these are PSR J0633+1746 (Geminga), PSR B0656+14, and PSR B105552 (the so called “Three Musketeers", Becker & Truemper 1997; De Luca et al. 2005). This is due to the fact that only 104–105 years old pulsars have the cooling component visible in the X-ray band, and that long observations are needed to derive good evidence for the presence of three spectral components. Figure 6 shows the high-energy SEDs of the four sources. The X-ray data, obtained with XMM-Newton, are fitted in Mori et al. (2014, Geminga), in Arumugasamy et al. (2018, PSR B0656+14), and in this work (see the Appendix section for PSR B105552). The Fermi-LAT data and best fits are taken from Abdo et al. (2013); Fermi-LAT collaboration et al. (2022).
The non-thermal component of the SED is fitted by a power law in the X-rays and by a cutoff power law in the -rays, but a self consistent unifying interpretation of broad band pulsar spectra is still lacking. Torres (2018); Torres et al. (2019) proposed a synchro-curvature emission model that, with a small number of parameters, can describe the non-thermal spectra of thirty pulsars across seven orders of magnitude in energy. These authors did not find clear correlations between intrinsic pulsar properties and model parameters, but only hints of a relation between the magnetic field strength at the light cylinder and the parallel electric field in the magnetoshpere, that affects the peak energy in the -rays (see also Caraveo, 2014). The synchro-curvature model by Torres (2018); Torres et al. (2019) does not allow to compute the pulse profiles and to predict the phase of the maximum. However, the different trajectories of particles that generate the SED produce a delay in the time of arrivals that can be a significant fraction of the pulsar period and can explain the large phase differences in the X- and -ray pulsed profiles.
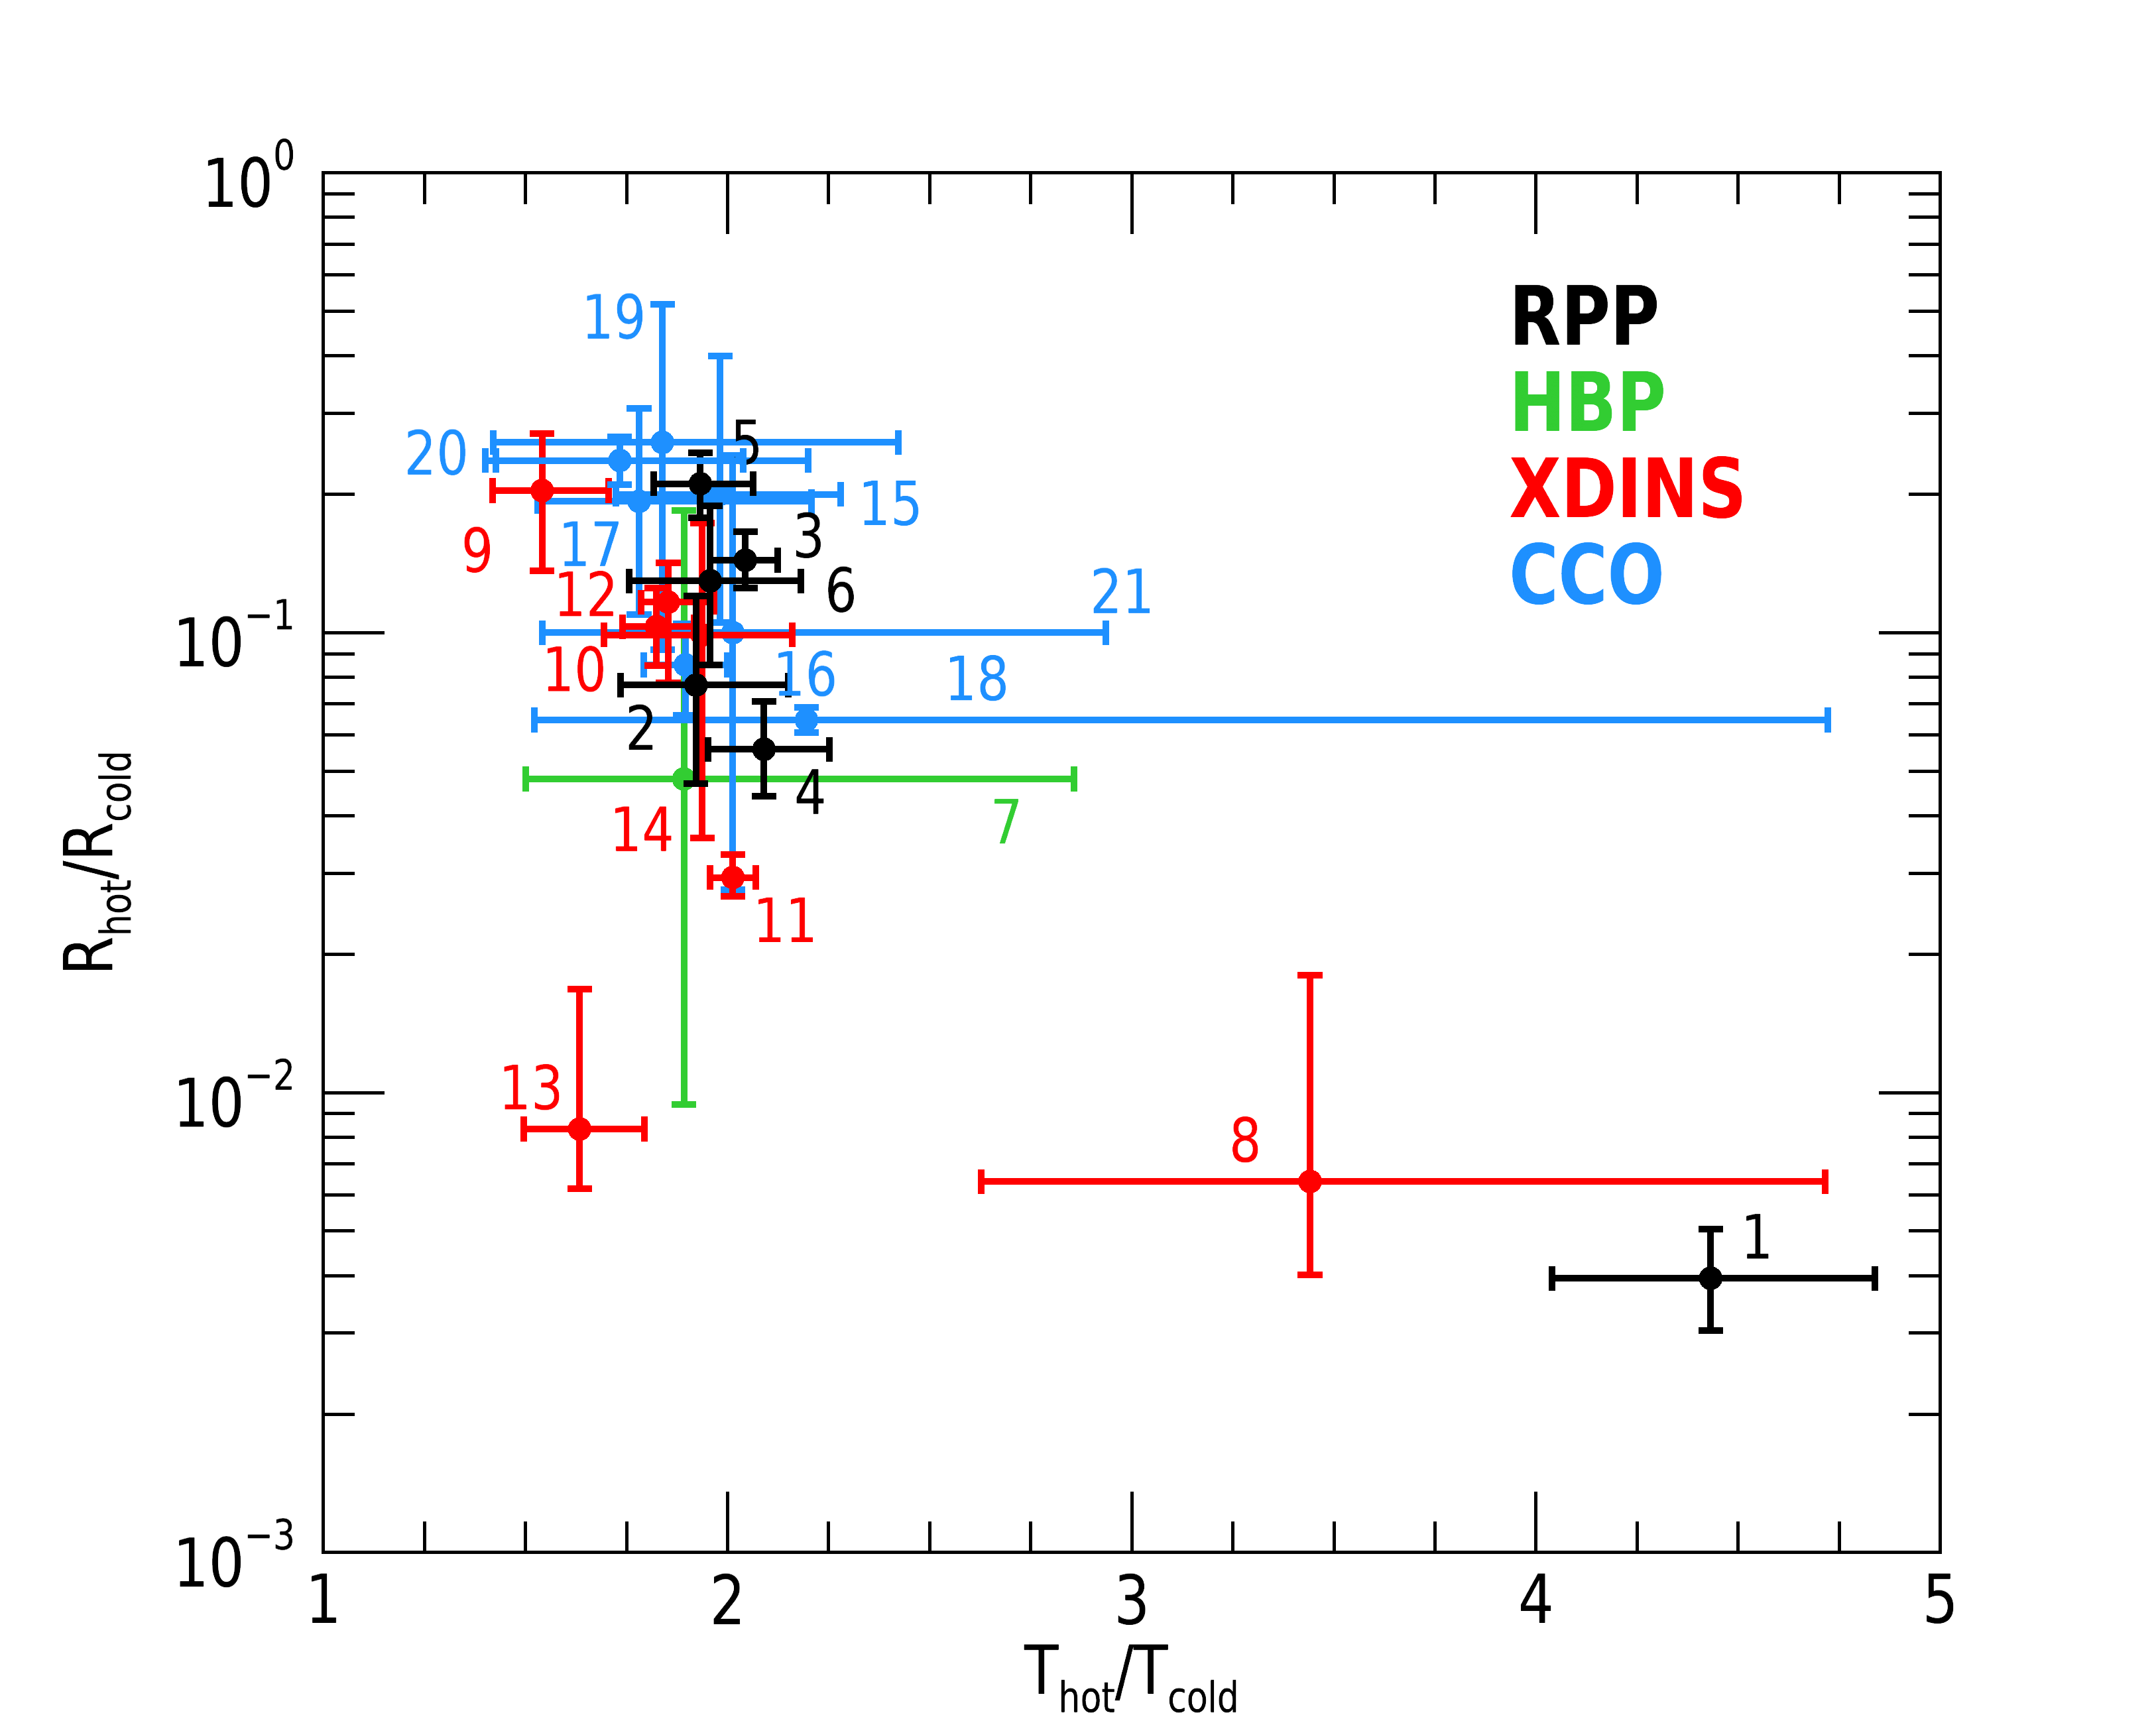
In all these sources, the thermal component of the SED is well fitted by two blackbody components. In the left panel of Figure 7 we plot in black the ratios of emitting radii and temperatures of PSR J17401000 and of the Three Musketeers, the younger Vela pulsar (Manzali et al., 2007) and 1RXS J141256.0+792204 (“Calvera”), for which the lack of non-thermal emission is probably due to unfavourable orientation and/or large distance (Mereghetti et al., 2021). It is very striking to observe that, for all these pulsars except Geminga, the ratio is in the range . Thus it is difficult to interpret the hotter and colder components in terms of emission from a polar cap corresponding to the dipole open lines ( m) and from the whole surface, respectively. Note that this conclusion is independent of the distance, and indicates that the 2BB modelling is simply a first order approximation of a smooth temperature gradient across the star surface. We also plot for comparison other classes of INSs: a high-B pulsar (green), the XDINSs (red) and the CCOs (blue). These neutron stars have very different characteristic ages (from 103 yr of the CCOs to several 105 yr of the XDINSs) and magnetic fields (from 1010 G to 1013 G), but with the exception of RX J0420.05022 and RX J1856.53754, they are placed in the same area of this space parameter. This means that, despite the differences, they have a similar thermal map. This is indeed quite surprising since the surface temperature is expected to evolve in time and to be sensitive to the initial magnetic field configuration in the star crust (see Pons & Viganò 2019 for a review). Recent simulations of INS magneto-thermal evolution in 3D (De Grandis et al., 2020; De Grandis et al., 2021) have shown that if the initial field is axially symmetric, although different from a simple dipole, the ensuing thermal map is itself axisymmetric. Assuming local blackbody emission, the spectrum is well fitted by a 2BB model at all times. At the inferred source age, when the star is in the so-called Hall attractor stage, the temperatures and radii ratios are in agreement with the observed ones. On the other hand, more complicated initial magnetic topologies result in highly asymmetric thermal maps, characterised by a higher pulse fraction, which survive over a timescale 100 kyr. The behaviour shown in Figure 7 is very striking and, in principle, may be explained by the existence of particular sets of configurations, to which the neutron star may evolve independently on its initial state, and that remain stable enough for a relatively long time, that in turns translate into thermal maps well fitted with two thermal components in a very narrow temperature ratio (between 0.5 and 2). A systematic investigation of this scenario, carried out using systematically numerical magneto-thermal simulations, is beyond the scope of this paper, and is matter of future work.
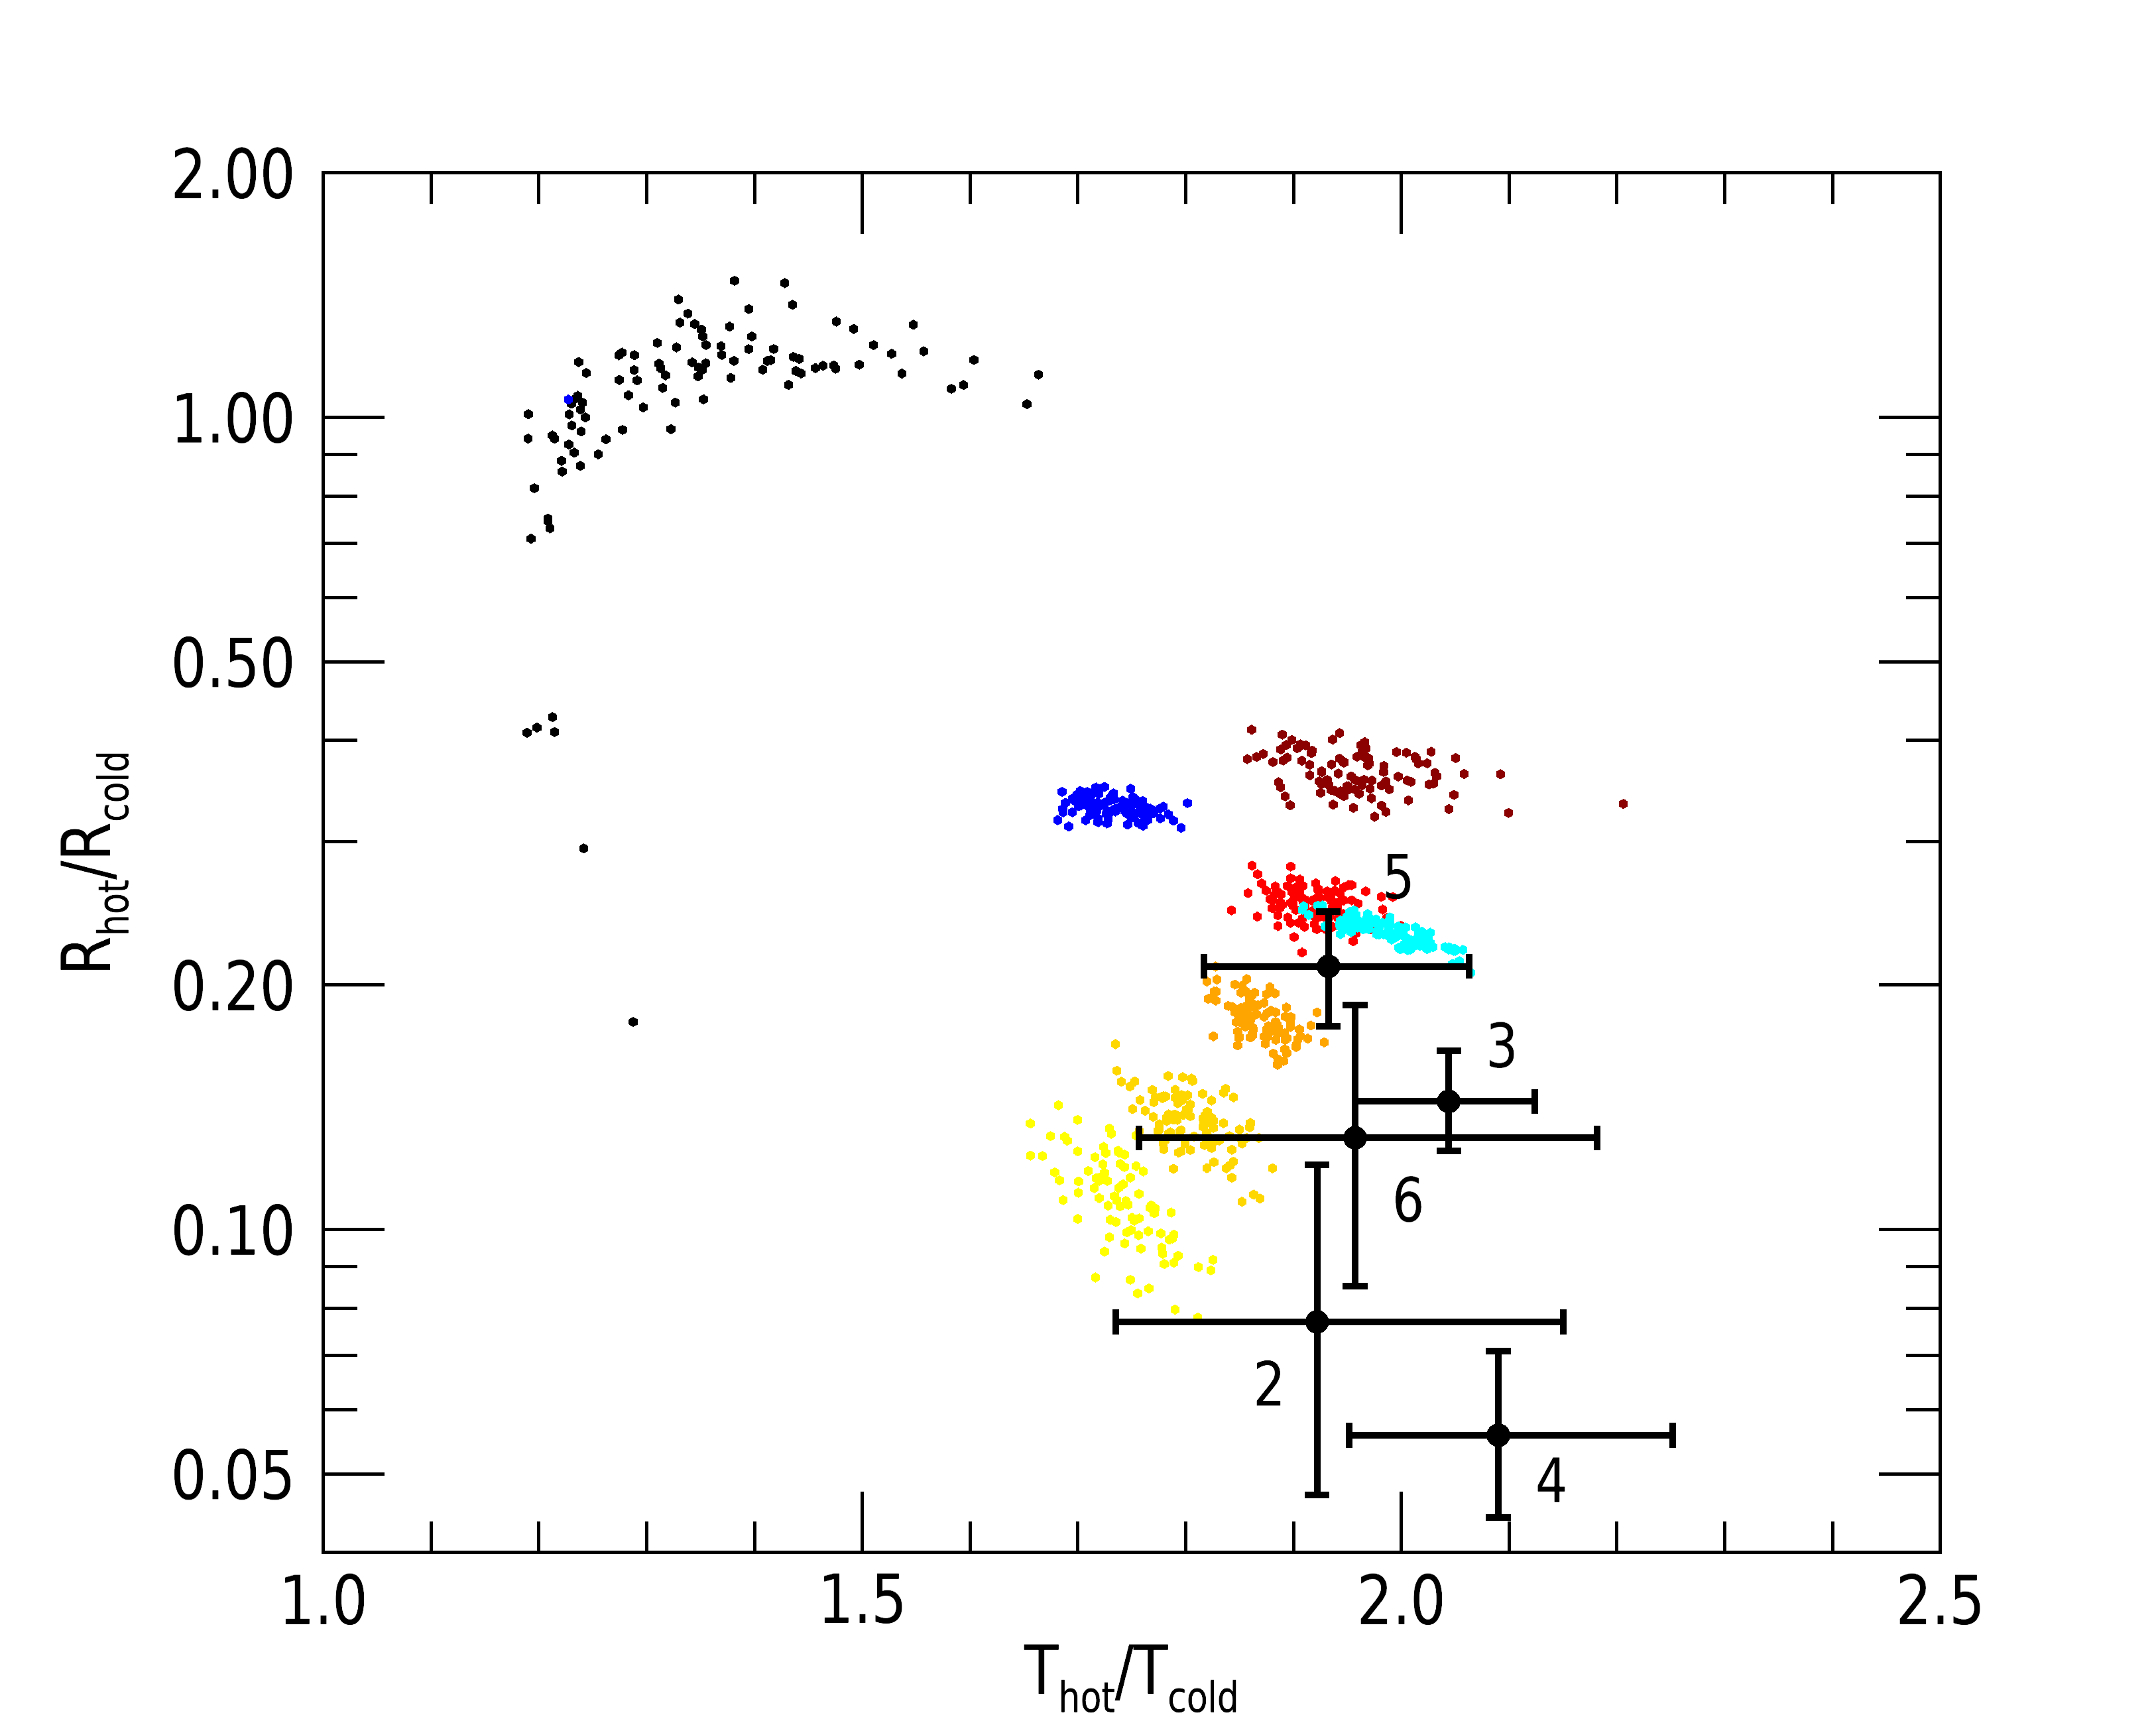
Instead, in this paper we tried to make a more quantitative exploration, by fitting with the 2BB model simulated spectra previously obtained starting from different surface thermal maps and emission models. We found that the simplest case of a blackbody emission with a temperature distribution resulting from a dipolar magnetic field (Greenstein & Hartke, 1983) gives values of the and ratios clearly inconsistent with the observed ones (black dots in Figure 7, right panel). This was also pointed out by Yakovlev (2021). Pérez-Azorín et al. (2006a, b) derived an analytical approximation of the surface temperature distribution for the crust corresponding to an axially-symmetric crustal magnetic field with a strong toroidal component:
| (2) |
where is the magnetic colatitude, is the temperature at the pole, is the minimum temperature reached on the surface of the star (assumed to be 0.1). The parameter depends on the relative strength of the poloidal and toroidal components of the magnetic field and regulates the strength of the temperature gradient between the pole and the equator ( corresponds to the Greenstein & Hartke 1983 distribution). Pérez-Azorín et al. (2006a) found that the temperature distribution for a force-free magnetic field with a toroidal component present in the outer layers resembles Eq. 2 with . We simulated spectra using this temperature distribution and local blackbody emissivity. When fitted with the sum of two blackbodies, in the case , we obtain the blue dots in Figure 7. Increasing results in smaller values of and larger values of . To match the observed data, values of larger than 4000 are needed (cyan dots), indicating a strongly concentrated region of high temperature at the poles. On the other hand, it may be that the existence of the observed narrow ratios in the values is influenced by the assumption on the emission models: it is in fact well known that while using blackbody components to fit neutron stars spectral data one failed to properly account for a hardening caused by atmospheric emission. To test this effect, we used the 123190 nsmaxg model (see Section 3.2.1) to simulate the spectra and indeed we found a better agreement with the observations. This is shown in Figure 7, right panel, where we plot the radii and temperatures ratios obtained by using this atmospheric model and varying from 0.3 MK (yellow dots) to 2 MK (dark red dots). It is therefore very likely that a combination of the two effects, a relatively steep thermal map and atmospheric hardening, is responsible for the observed clustering.
5 Conclusions
Our analysis of new XMM-Newton observations of PSR J17401000 reveals that its X-ray spectrum can be well fitted by the sum of two blackbodies ( eV and eV) and a power law of photon index . Both the thermal and the non-thermal components are pulsed (PF of and , respectively), and can be described by two sinusoidal functions pulsing in anti-phase. This characteristic, plus the size of the inferred emitting radii, indicate that it is difficult to interpret the hotter and colder components in terms of emission from a polar cap corresponding to the dipole open lines and from the whole surface, respectively. It is more likely that the 2BB modelling is simply an approximation of a temperature gradient across the star surface, steeper that the one induced by a dipolar magnetic field. This holds for both local BB emission and assuming that a magnetised atmosphere covers the star. We also found that this characteristic is shared by the majority of thermally-emitting INSs with well studied spectra, with the notable exceptions of RX J0420.05022, RX J1856.53754 and Geminga (in this respect, we note that PSR J17401000 is more similar to the other two Musketeers than Geminga).
Our independent reanalysis of the 2006 observations, with the same procedure of Kargaltsev et al. (2012), confirmed the presence of phase-dependent narrow absorption lines. However, we could not find such features with the same profiles in the higher quality 2017-2018 data. We cannot rule out the possibility that the previous detection was a statistical fluctuation (probability of ). However, such rather small probability favours the possibility that the stellar properties might have slightly changed. This could be related to the glitch that occurred in 2012 (Basu et al., 2022), between the old and the new XMM-Newton observations. We note also that long term variations in the soft X-ray emission of isolated NS has been observed also in RX J0720.43125 (de Vries et al., 2004; Vink et al., 2004).
Finally, we derived the multiwavelength pulse profile of PSR J17401000. While the small count statistics of the recently detected -ray pulse profile (Smith et al., 2019) does not allow to draw strong conclusions on its relative alignment with the non-thermal X-ray pulse, there is a significant misalignment ( in phase) between the radio and the thermal X-ray emission. The combination of field-line sweep back and aberration cannot explain such a phase shift, again suggesting that a simple dipole geometry does not apply to PSR J17401000. Large phase differences between radio and thermal X-rays have been seen also in other middle-aged (e.g. De Luca et al., 2005; Arumugasamy et al., 2018), and old pulsars (Arumugasamy & Mitra, 2019).
Our findings support the mounting evidence that ordinary RPPs may have complicated thermal maps, as already seen for XDINSs and magnetars in quiescence. The latter were successfully interpreted with 3D magneto-thermal simulations of strong and tilted toroidal magnetic fields (De Grandis et al., 2020; De Grandis et al., 2021; Igoshev et al., 2021). It would be interesting to apply similar models also to other classes of INSs and, even more, to investigate the possible cause of the observed clustering in temperatures and radii ratios, that cover sources with a large spread of ages and magnetic field strengths. This will be matter of future study.
Acknowledgements
The scientific results reported in this article are based on data obtained with XMM-Newton and the Lovell Telescope at Jodrell Bank. The data analysis has benefited from the software provided by the NASA’s High Energy Astrophysics Science Archive Research Center (HEASARC). We acknowledge financial support from the Italian Ministry for University and Research through grant 2017LJ39LM “UnIAM” and the INAF “Main-streams” funding grant (DP n.43/18).
Data availability
All the data used in this article are available in public archives.
References
- Abdo et al. (2013) Abdo A. A., et al., 2013, ApJS, 208, 17
- Arumugasamy & Mitra (2019) Arumugasamy P., Mitra D., 2019, MNRAS, 489, 4589
- Arumugasamy et al. (2018) Arumugasamy P., Kargaltsev O., Posselt B., Pavlov G. G., Hare J., 2018, ApJ, 869, 97
- Basu et al. (2022) Basu A., et al., 2022, MNRAS, 510, 4049
- Becker & Truemper (1997) Becker W., Truemper J., 1997, A&A, 326, 682
- Benbow et al. (2021) Benbow W., et al., 2021, ApJ, 916, 117
- Bignami et al. (2003) Bignami G. F., Caraveo P. A., De Luca A., Mereghetti S., 2003, Nature, 423, 725
- Bilous et al. (2016) Bilous A. V., et al., 2016, A&A, 591, A134
- Buccheri et al. (1983) Buccheri R., et al., 1983, A&A, 128, 245
- Caraveo (2014) Caraveo P. A., 2014, ARA&A, 52, 211
- Cash (1979) Cash W., 1979, ApJ, 228, 939
- Cassam-Chenaï et al. (2004) Cassam-Chenaï G., Decourchelle A., Ballet J., Sauvageot J. L., Dubner G., Giacani E., 2004, A&A, 427, 199
- Chatterjee et al. (2001) Chatterjee S., Cordes J. M., Lazio T. J. W., Goss W. M., Fomalont E. B., Benson J. M., 2001, ApJ, 550, 287
- De Grandis et al. (2020) De Grandis D., Turolla R., Wood T. S., Zane S., Taverna R., Gourgouliatos K. N., 2020, ApJ, 903, 40
- De Grandis et al. (2021) De Grandis D., Taverna R., Turolla R., Gnarini A., Popov S. B., Zane S., Wood T. S., 2021, ApJ, 914, 118
- De Luca (2017) De Luca A., 2017, in Journal of Physics Conference Series. p. 012006 (arXiv:1711.07210), doi:10.1088/1742-6596/932/1/012006
- De Luca et al. (2005) De Luca A., Caraveo P. A., Mereghetti S., Negroni M., Bignami G. F., 2005, ApJ, 623, 1051
- Fermi-LAT collaboration et al. (2022) Fermi-LAT collaboration et al., 2022, arXiv e-prints, p. arXiv:2201.11184
- Gotthelf et al. (2010) Gotthelf E. V., Perna R., Halpern J. P., 2010, ApJ, 724, 1316
- Greenstein & Hartke (1983) Greenstein G., Hartke G. J., 1983, ApJ, 271, 283
- HI4PI Collaboration et al. (2016) HI4PI Collaboration et al., 2016, A&A, 594, A116
- Halpern & Gotthelf (2010) Halpern J. P., Gotthelf E. V., 2010, ApJ, 709, 436
- Halpern et al. (2013) Halpern J. P., Bogdanov S., Gotthelf E. V., 2013, ApJ, 778, 120
- He et al. (2013) He C., Ng C.-Y., Kaspi V. M., 2013, ApJ, 768, 64
- Ho (2014) Ho W. C. G., 2014, in Petit P., Jardine M., Spruit H. C., eds, IAU Symposium Vol. 302, Magnetic Fields throughout Stellar Evolution. pp 435–438 (arXiv:1311.5583), doi:10.1017/S1743921314002683
- Ho et al. (2008) Ho W. C. G., Potekhin A. Y., Chabrier G., 2008, ApJS, 178, 102
- Hobbs et al. (2005) Hobbs G., Lorimer D. R., Lyne A. G., Kramer M., 2005, MNRAS, 360, 974
- Igoshev et al. (2021) Igoshev A. P., Hollerbach R., Wood T., Gourgouliatos K. N., 2021, Nature Astronomy, 5, 145
- Kaplan (2008) Kaplan D. L., 2008, in Bassa C., Wang Z., Cumming A., Kaspi V. M., eds, American Institute of Physics Conference Series Vol. 983, 40 Years of Pulsars: Millisecond Pulsars, Magnetars and More. pp 331–339, doi:10.1063/1.2900177
- Kargaltsev et al. (2008) Kargaltsev O., Misanovic Z., Pavlov G. G., Wong J. A., Garmire G. P., 2008, ApJ, 684, 542
- Kargaltsev et al. (2012) Kargaltsev O., Durant M., Misanovic Z., Pavlov G. G., 2012, Science, 337, 946
- Lovchinsky et al. (2011) Lovchinsky I., Slane P., Gaensler B. M., Hughes J. P., Ng C. Y., Lazendic J. S., Gelfand J. D., Brogan C. L., 2011, ApJ, 731, 70
- Manzali et al. (2007) Manzali A., De Luca A., Caraveo P. A., 2007, ApJ, 669, 570
- McLaughlin et al. (2002) McLaughlin M. A., Arzoumanian Z., Cordes J. M., Backer D. C., Lommen A. N., Lorimer D. R., Zepka A. F., 2002, ApJ, 564, 333
- Mereghetti et al. (2021) Mereghetti S., Rigoselli M., Taverna R., Baldeschi L., Crestan S., Turolla R., Zane S., 2021, ApJ, 922, 253
- Mignani et al. (2010) Mignani R. P., Pavlov G. G., Kargaltsev O., 2010, ApJ, 720, 1635
- Mori et al. (2014) Mori K., et al., 2014, ApJ, 793, 88
- Pavlov & Luna (2009) Pavlov G. G., Luna G. J. M., 2009, ApJ, 703, 910
- Pérez-Azorín et al. (2006a) Pérez-Azorín J. F., Miralles J. A., Pons J. A., 2006a, A&A, 451, 1009
- Pérez-Azorín et al. (2006b) Pérez-Azorín J. F., Pons J. A., Miralles J. A., Miniutti G., 2006b, A&A, 459, 175
- Pons & Viganò (2019) Pons J. A., Viganò D., 2019, LRCA, 5, 3
- Rigoselli & Mereghetti (2018) Rigoselli M., Mereghetti S., 2018, A&A, 615, A73
- Rigoselli et al. (2019) Rigoselli M., Mereghetti S., Turolla R., Taverna R., Suleimanov V., Potekhin A. Y., 2019, ApJ, 872, 15
- Romani et al. (2011) Romani R. W., Kerr M., Craig H. A., Johnston S., Cognard I., Smith D. A., 2011, ApJ, 738, 114
- Smith et al. (2019) Smith D. A., et al., 2019, ApJ, 871, 78
- Strüder et al. (2001) Strüder L., et al., 2001, A&A, 365, L18
- Tian et al. (2010) Tian W. W., Li Z., Leahy D. A., Yang J., Yang X. J., Yamazaki R., Lu D., 2010, ApJ, 712, 790
- Torres (2018) Torres D. F., 2018, Nature Astronomy, 2, 247
- Torres et al. (2019) Torres D. F., Viganò D., Coti Zelati F., Li J., 2019, MNRAS, 489, 5494
- Turner et al. (2001) Turner M. J. L., et al., 2001, A&A, 365, L27
- Turolla (2009) Turolla R., 2009, Isolated Neutron Stars: The Challenge of Simplicity. Becker, Werner, p. 141, doi:10.1007/978-3-540-76965-1_7
- Viganò et al. (2014) Viganò D., Perna R., Rea N., Pons J. A., 2014, MNRAS, 443, 31
- Vink et al. (2004) Vink J., de Vries C. P., Méndez M., Verbunt F., 2004, ApJ, 609, L75
- Wilms et al. (2000) Wilms J., Allen A., McCray R., 2000, ApJ, 542, 914
- Yakovlev (2021) Yakovlev D. G., 2021, MNRAS, 506, 4593
- Yao et al. (2017) Yao J. M., Manchester R. N., Wang N., 2017, ApJ, 835, 29
- Yoneyama et al. (2019) Yoneyama T., Hayashida K., Nakajima H., Matsumoto H., 2019, PASJ, 71, 17
- de Vries et al. (2004) de Vries C. P., Vink J., Méndez M., Verbunt F., 2004, A&A, 415, L31
Appendix
X-ray spectral analysis of PSR B105552
In this section we report the spectral analysis of PSR B105552, which has two recent XMM-Newton observations (obs. IDs 0842820101 and 0842820201, see Table 1 for details). We followed the same data reduction processes described in Section 2.
We fitted the EPIC-pn and -MOS phase-averaged spectra of the two epochs in the 0.3–9 keV range with the 2BB+PL model. We obtained an acceptable fit ( for 455 dof, nhp=0.17) with cm-2, blackbody temperatures eV, eV, and emitting radii km, km (for kpc, see Mignani et al. 2010). The power-law photon index is , and the flux between 1–10 keV is erg s-1 cm-2.