M3triCity: Visualizing Evolving Software & Data Cities
Abstract.
The city metaphor for visualizing software systems in 3D has been widely explored and has led to many diverse implementations and approaches. Common among all approaches is a focus on the software artifacts, while the aspects pertaining to the data and information (stored both in databases and files) used by a system are seldom taken into account.
We present M3triCity, an interactive web application whose goal is to visualize object-oriented software systems, their evolution, and the way they access data and information. We illustrate how it can be used for program comprehension and evolution analysis of data-intensive software systems.
Demo video URL: https://youtu.be/uBMvZFIlWtk
1. Introduction
Program comprehension is a fundamental activity for software maintenance and evolution. Developers spend considerably more time reading and understanding existing code rather than writing new code (Minelli et al., 2015). Software visualization is a popular technique to perform program comprehension (Stasko et al., 1997). Many techniques have been proposed, ranging from simple 2D displays, such as polymetric views (Lanza and Ducasse, 2003) and UML diagrams to more complex 3D techniques, even extending into the realm of virtual (VR) and augmented reality (AR) (Fittkau et al., 2015; Moreno-Lumbreras et al., 2021; Merino et al., 2018).
We present M3triCity a web application that visualizes software systems in 3D, focusing on the evolution of systems and how they use and access data (Pfahler et al., 2020; Ardigò et al., 2021). M3triCity leverages the city metaphor (Knight and Munro, 2000; Panas et al., 2003; Panas et al., 2007; Steinbrückner and Lewerentz, 2010; Fittkau et al., 2013; Tymchuk et al., 2015) in the vein of CodeCity (Wettel and Lanza, 2008) and runs on any modern web browser.
2. M3triCity in a Nutshell
In a nutshell, M3triCity is a web-based evolution of CodeCity, which popularized the city-based visualization of software systems through the city metaphor (Wettel and Lanza, 2007) (See Figure 1).
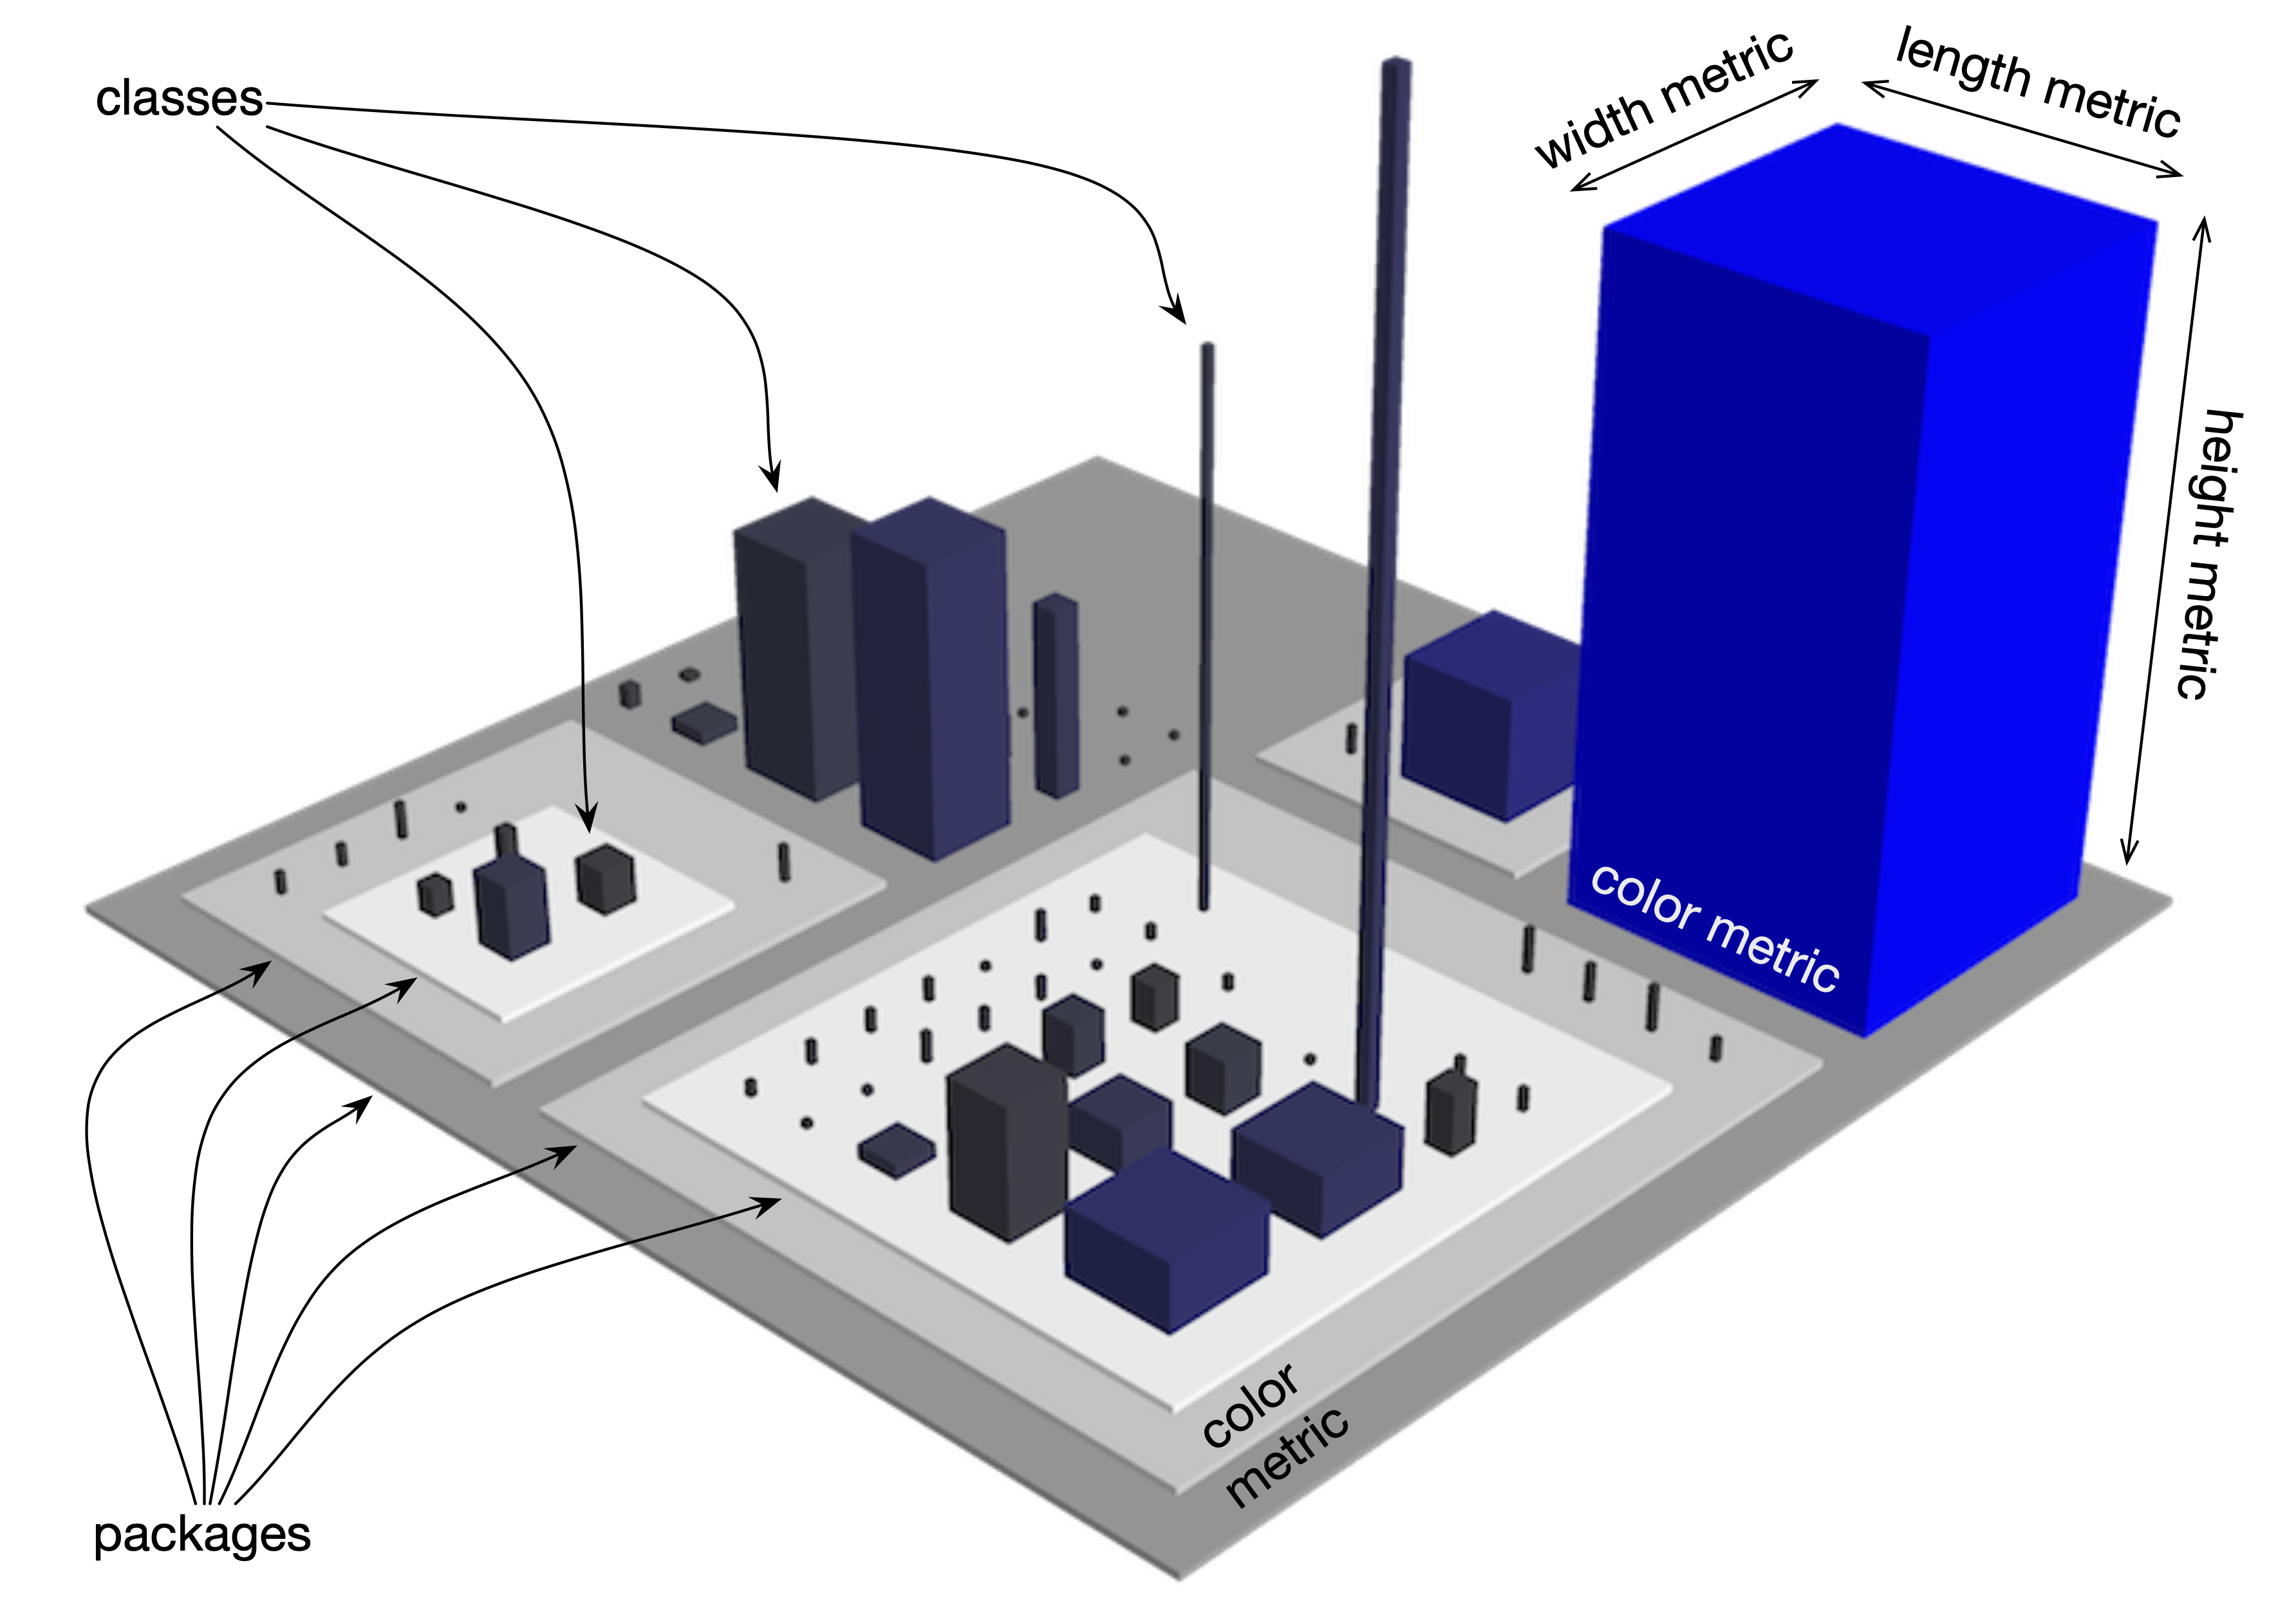
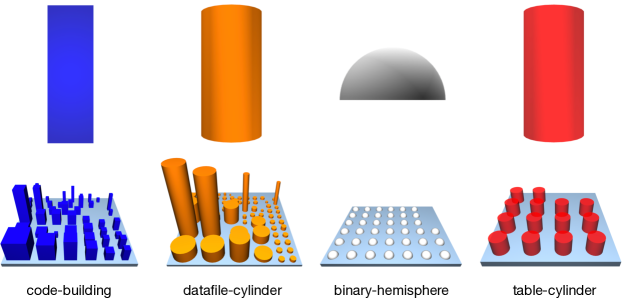
In CodeCity every class is visualized as a building with metrics mapped onto the base, height, and color, while packages were visualized as nested districts. M3triCity expands on it through a number of features and concepts, namely: (i) it distinguishes between the file types and uses different glyphs (i.e., depictions) for them, as we see in Figure 2.
Furthermore, (ii) it takes the evolution of a system into account for the layout of the city structure, as we detail in Section 2.4; (iii) it infers and visualizes the databases used by a system, as we detail in Section 2.2, and (iv) it provides higher accessibility by being publicly available as a web application available at https://metricity.si.usi.ch/v2.
2.1. The User Interface of M3triCity
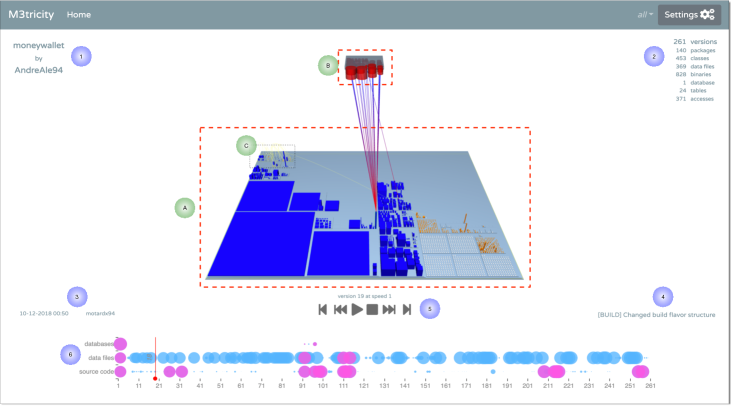
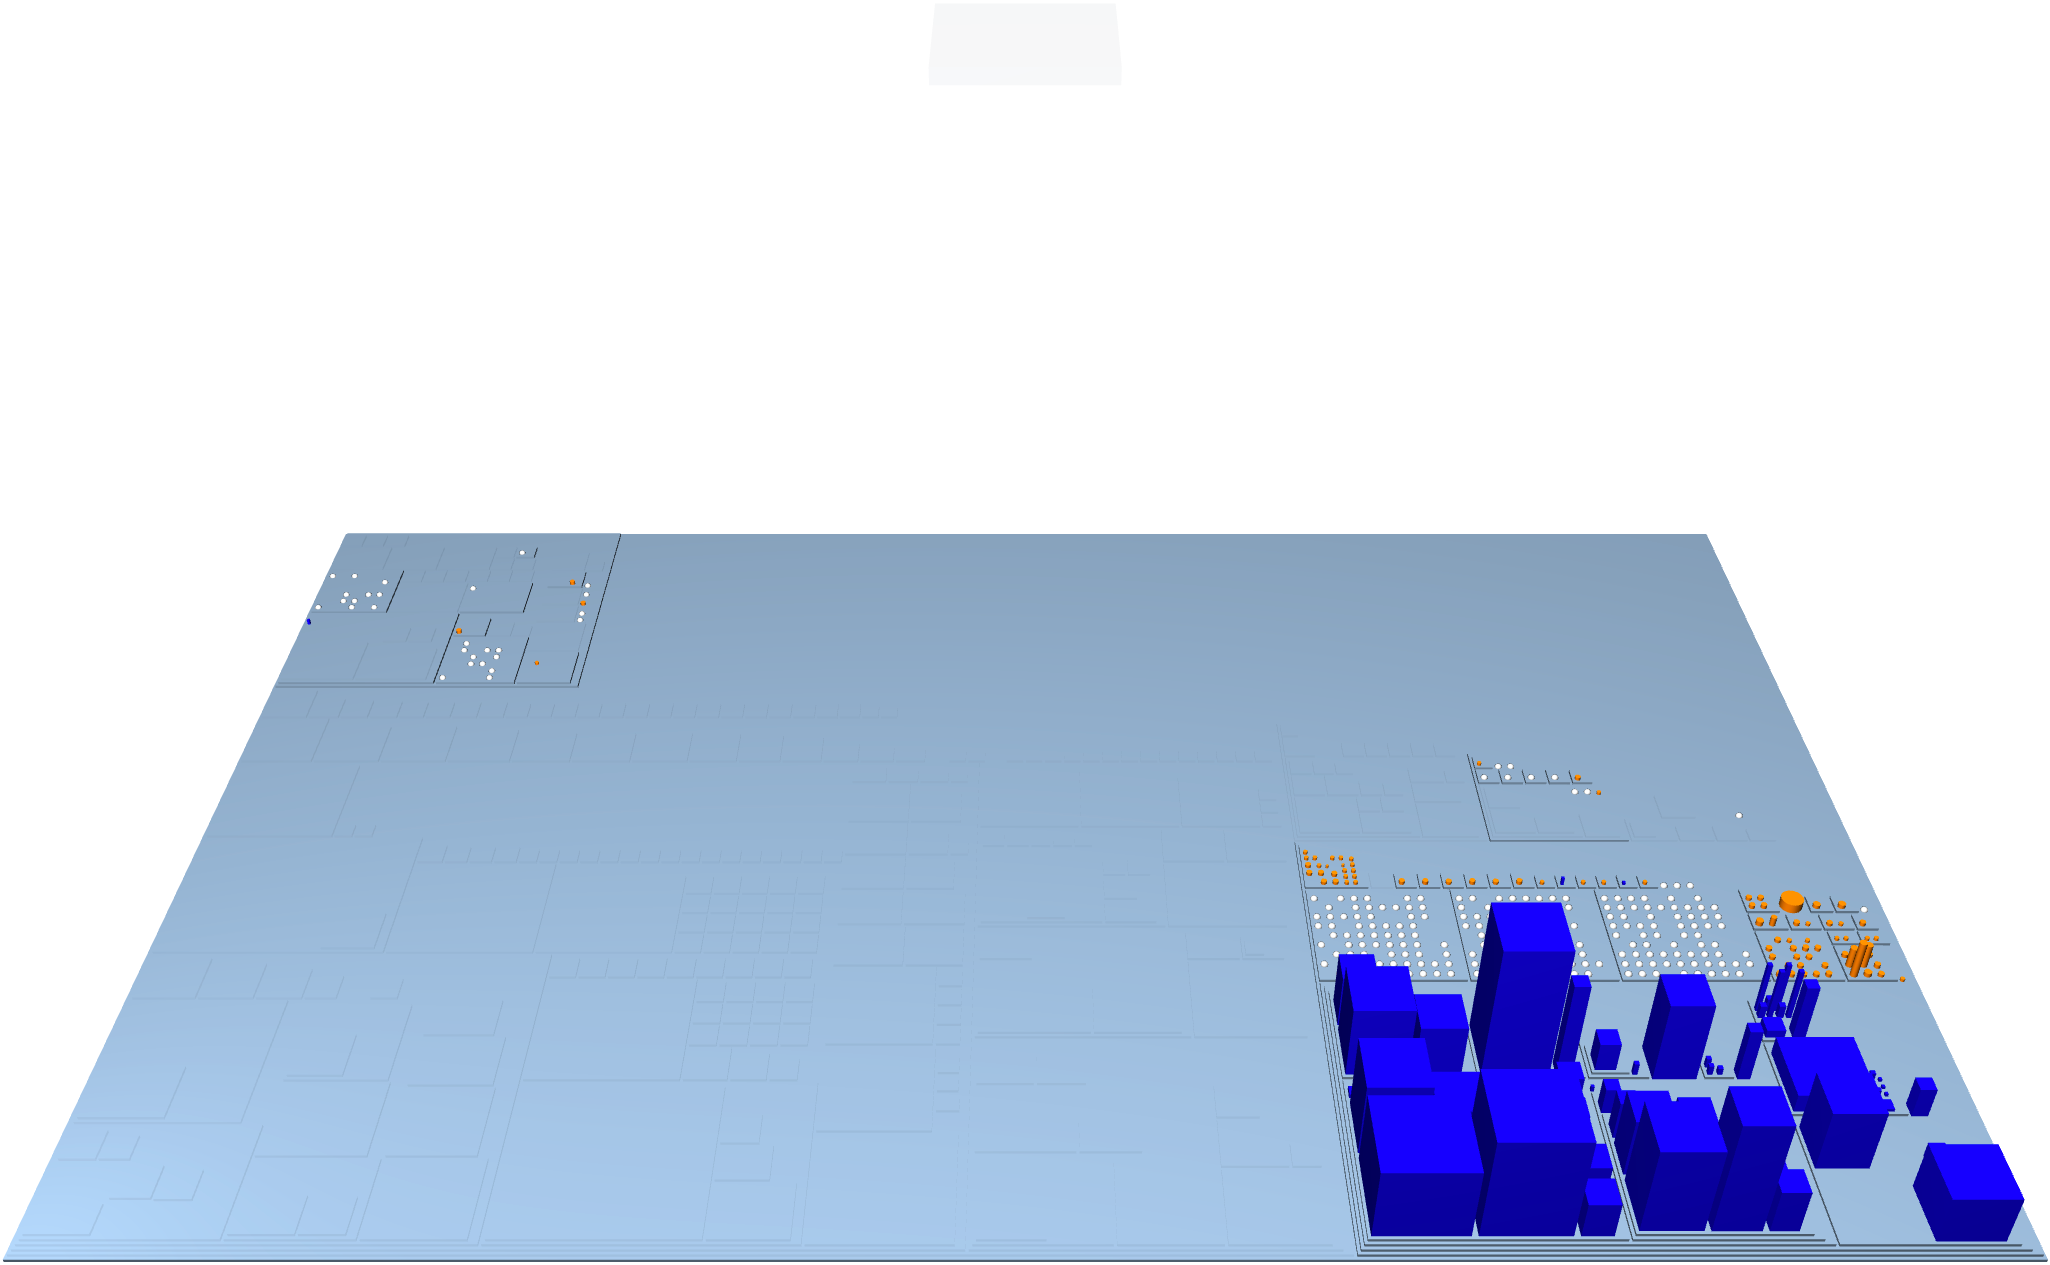
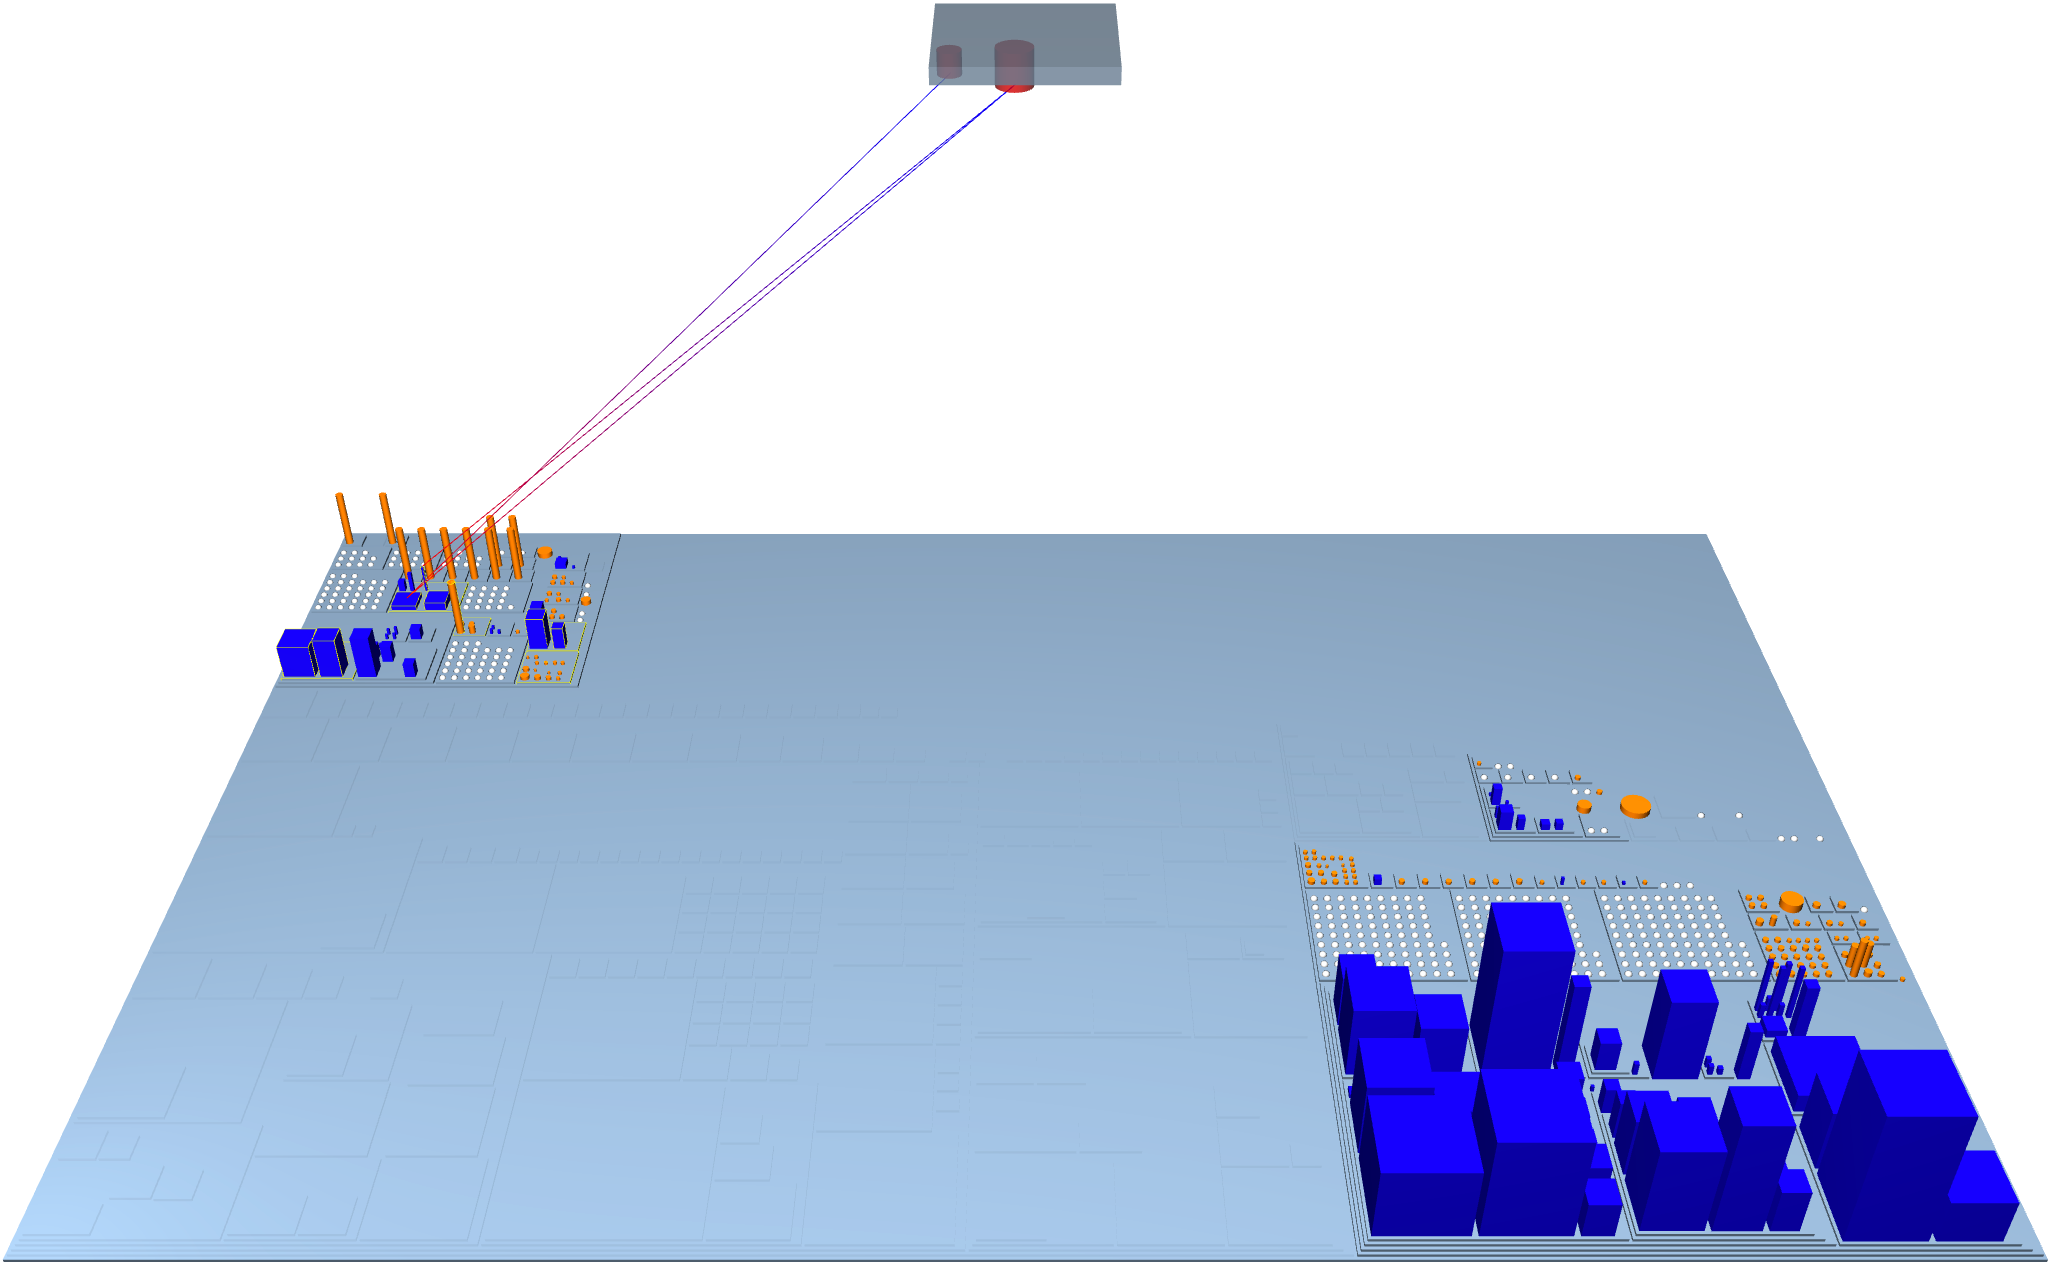
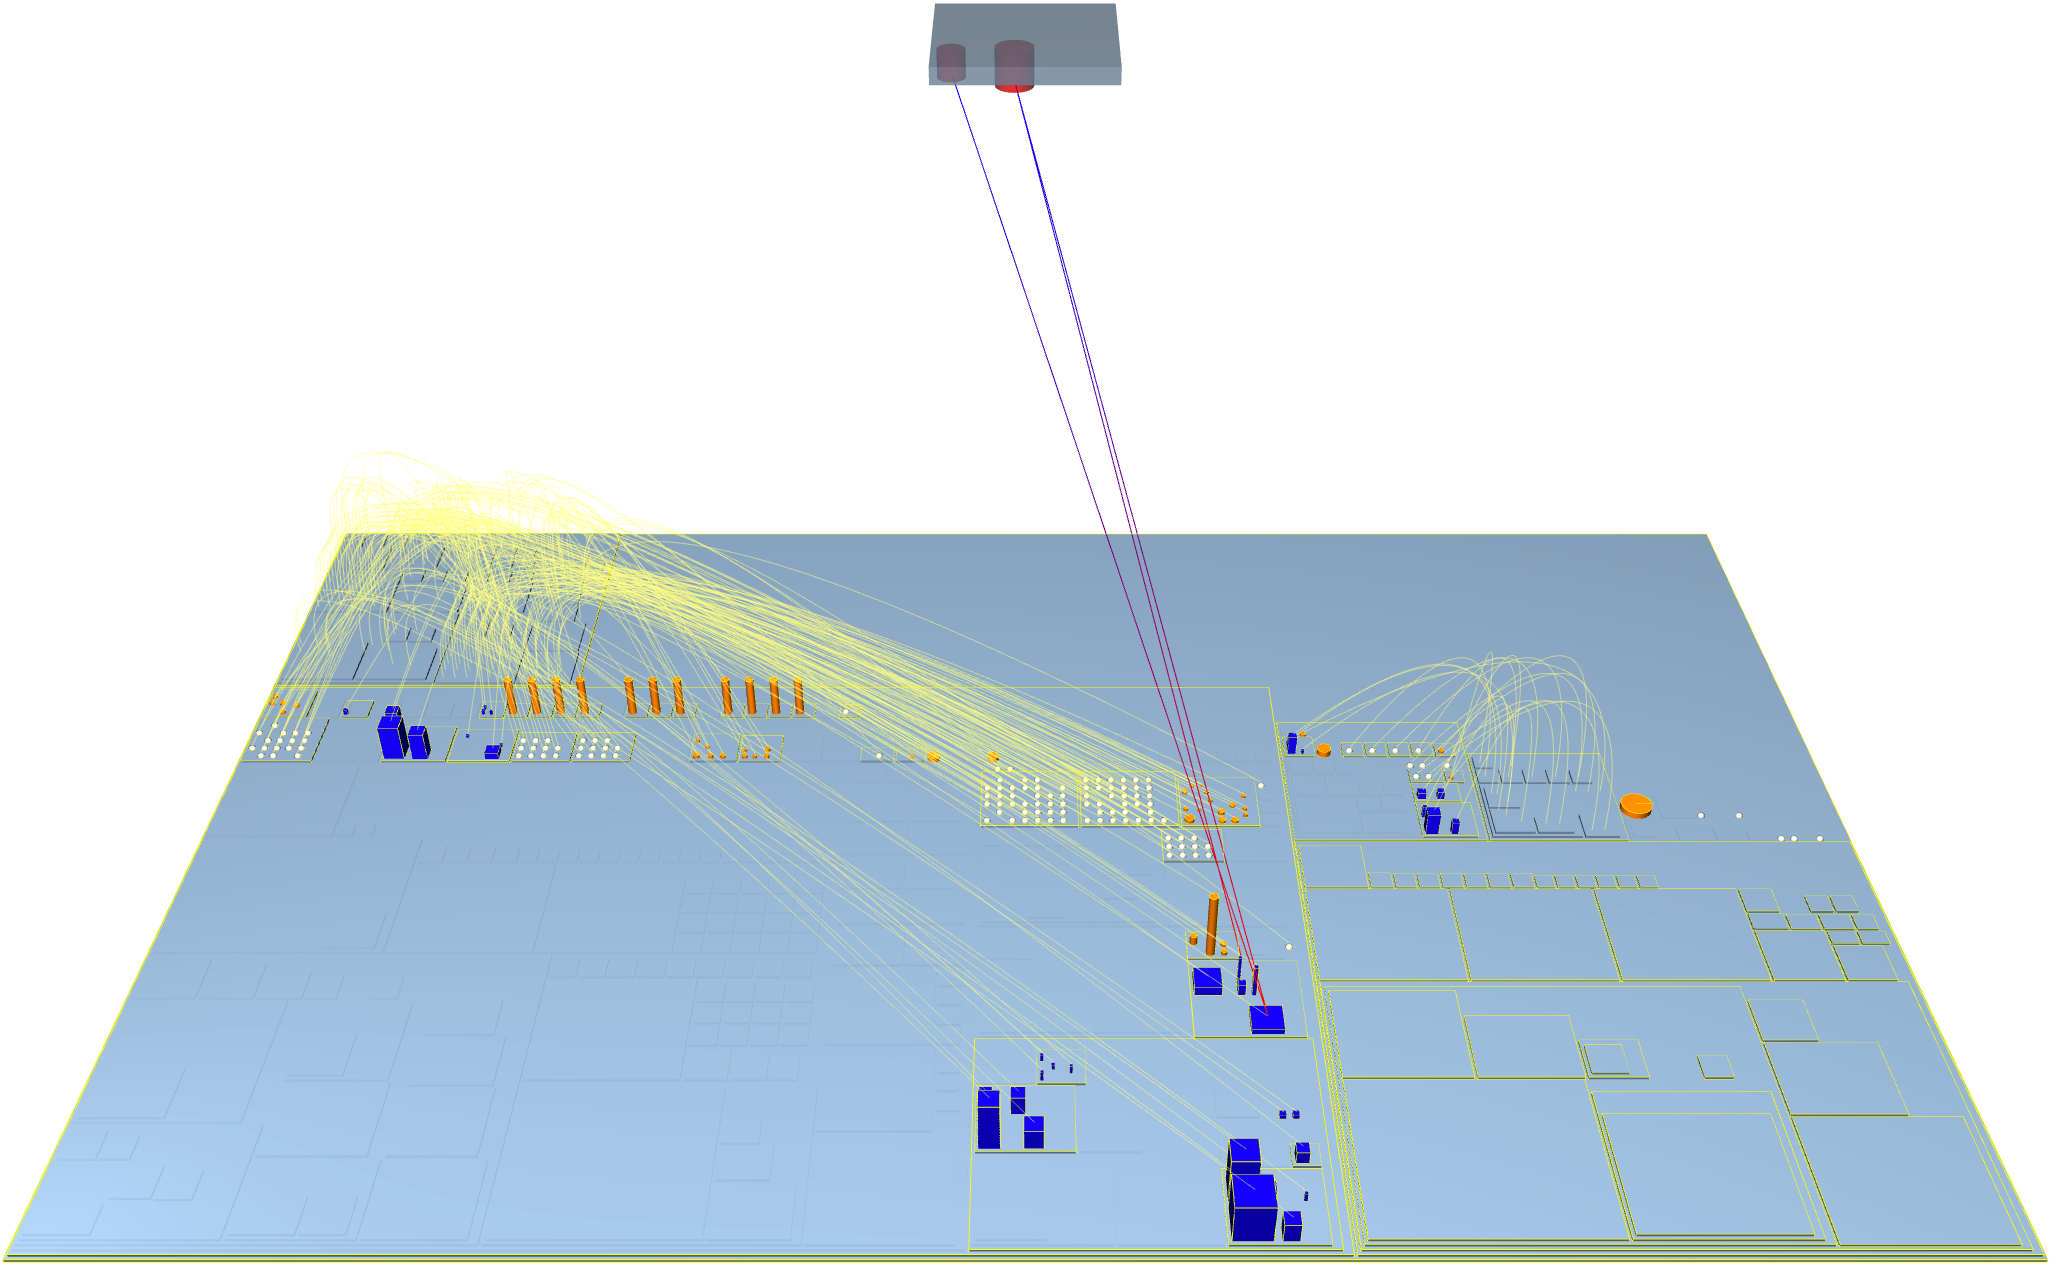
Figure 3 shows the main user interface of M3triCity. At the center we see the software city , with folders and files represented as buildings and nested districts. Above the city the sky is used to visualize the (inferred) database(s) and their tables , where connecting lines represent the accesses performed from the source code.
Various information about the system being visualized is also displayed . As M3triCity is geared towards evolution comprehension, additional panels provide information about the currently visualized commit . To facilitate moving through time M3triCity provides a control panel to easily moving forward/backward between different commits as well as fast back/forwarding and pausing. A timeline at the bottom provides a global overview of the system evolution with additional details pertaining to the commits (i.e., along the timeline), as well as instantaneous access to a specific place in the commit history. The whole city can be rotated, the user can also change its point of view and zoom in and out. Structural changes (i.e., moving of entities) are depicted using yellow curved arcs (see top left annotation with black dots ). When the user clicks on an artifact, it is highlighted both in the main visualization as well as along the timeline, denoting all commits in which the entity was involved. More customizations are also available in the settings panel.
2.2. Modeling Evolving Data-Intensive Systems
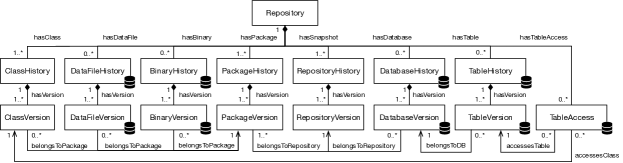
Figure 4 depicts the meta-model of M3triCity. Evolving software artifacts are modeled using “histories” in the vein of Girba’s evolution meta-model (Girba, 2005). For each artifact history, we model each version including binary files and data files (e.g., JSON, XML). Databases are inferred through SQLInspect (Nagy and Cleve, 2018). For each entity, M3triCity computes various metrics, summarized in Table 1.
| Entity | Metric Name | Entity | Metric Name |
|---|---|---|---|
| Class | # Instance Variables | Data File | # Entities |
| # For Loops | # Entity Types | ||
| # Methods | Max # Properties per Entity | ||
| # Lines of Code | Max Nesting Level | ||
| Table | # Columns | Binary | Size |
| # Table Accesses |
2.3. Architecture
Figure 5 shows the architecture of M3triCity.
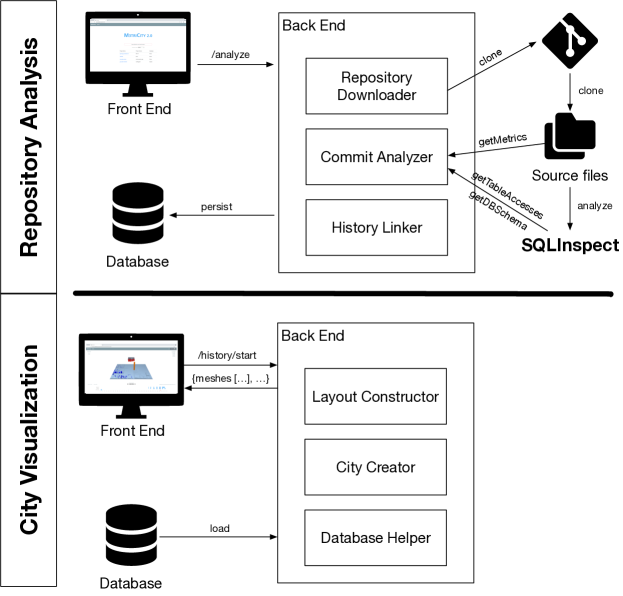
The frontend of M3triCity is implemented in TypeScript.111See https://www.typescriptlang.org It uses Vue.js222See https://vuejs.org for the user interface. The 3D visualization is created using Babylon.js.333See https://www.babylonjs.com The backend is a Spring Boot 444See https://spring.io/projects/spring-boot application implemented using Java 11555See https://docs.oracle.com/en/java/javase/11/docs/api/ and Gradle 6.666See https://docs.gradle.org/6.3/release-notes.html
To start the analysis, the user indicates the URL of a repository and, as an optional parameter, the database type. The frontend contacts the backend through the public REST API endpoint analyze. The execution starts in the module Repository Downloader which contacts git to clone the repository. The Commit Analyzer module iterates through all files of each snapshot of the given repository in chronological order, classifies them, analyzes them and then extracts the metrics. The project uses SQLInspect (Nagy and Cleve, 2018) to reverse engineer the schema of the database and the interactions with the source code. The histories of the entities are created by linking the versions. At last, all information is persisted in a MongoDB database.
2.4. Usage
The user starts the visualization of a city by selecting a processed repository. The repository-related information is loaded from the database with the Database Helper component. The computation of the city layout is handled by the Layout Constructor component which iterates through all the entities of the city. M3triCity considers evolution as a first-class citizen, implementing a history-resistant layout, which allocates a dedicated position to each artifact throughout the lifetime (Pfahler et al., 2020). The City Creator module creates the meshes information that are then sent to the frontend which renders them as 3D meshes.
3. Software City Tales
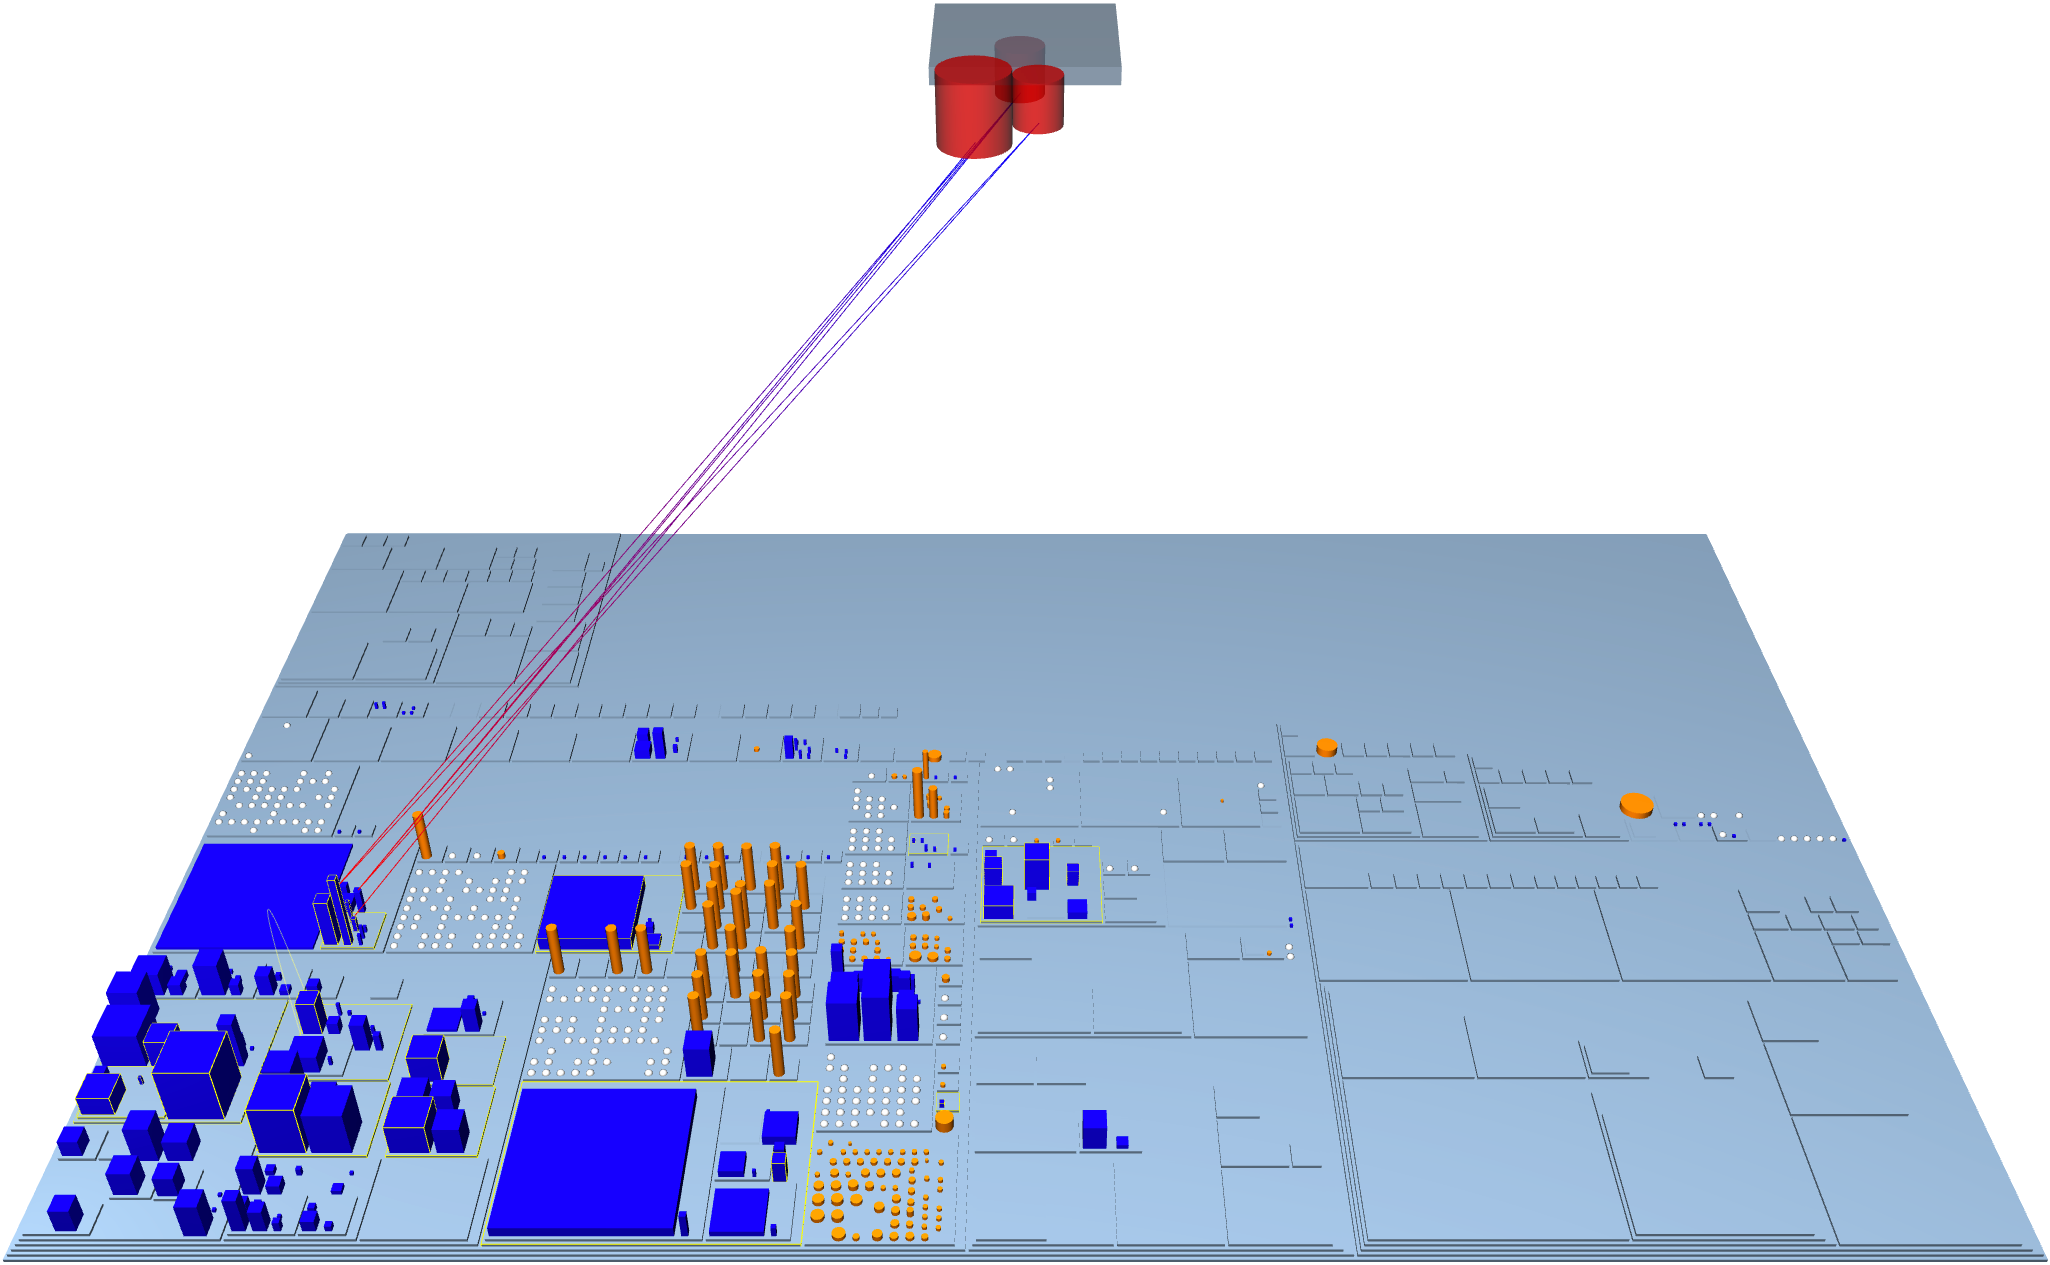
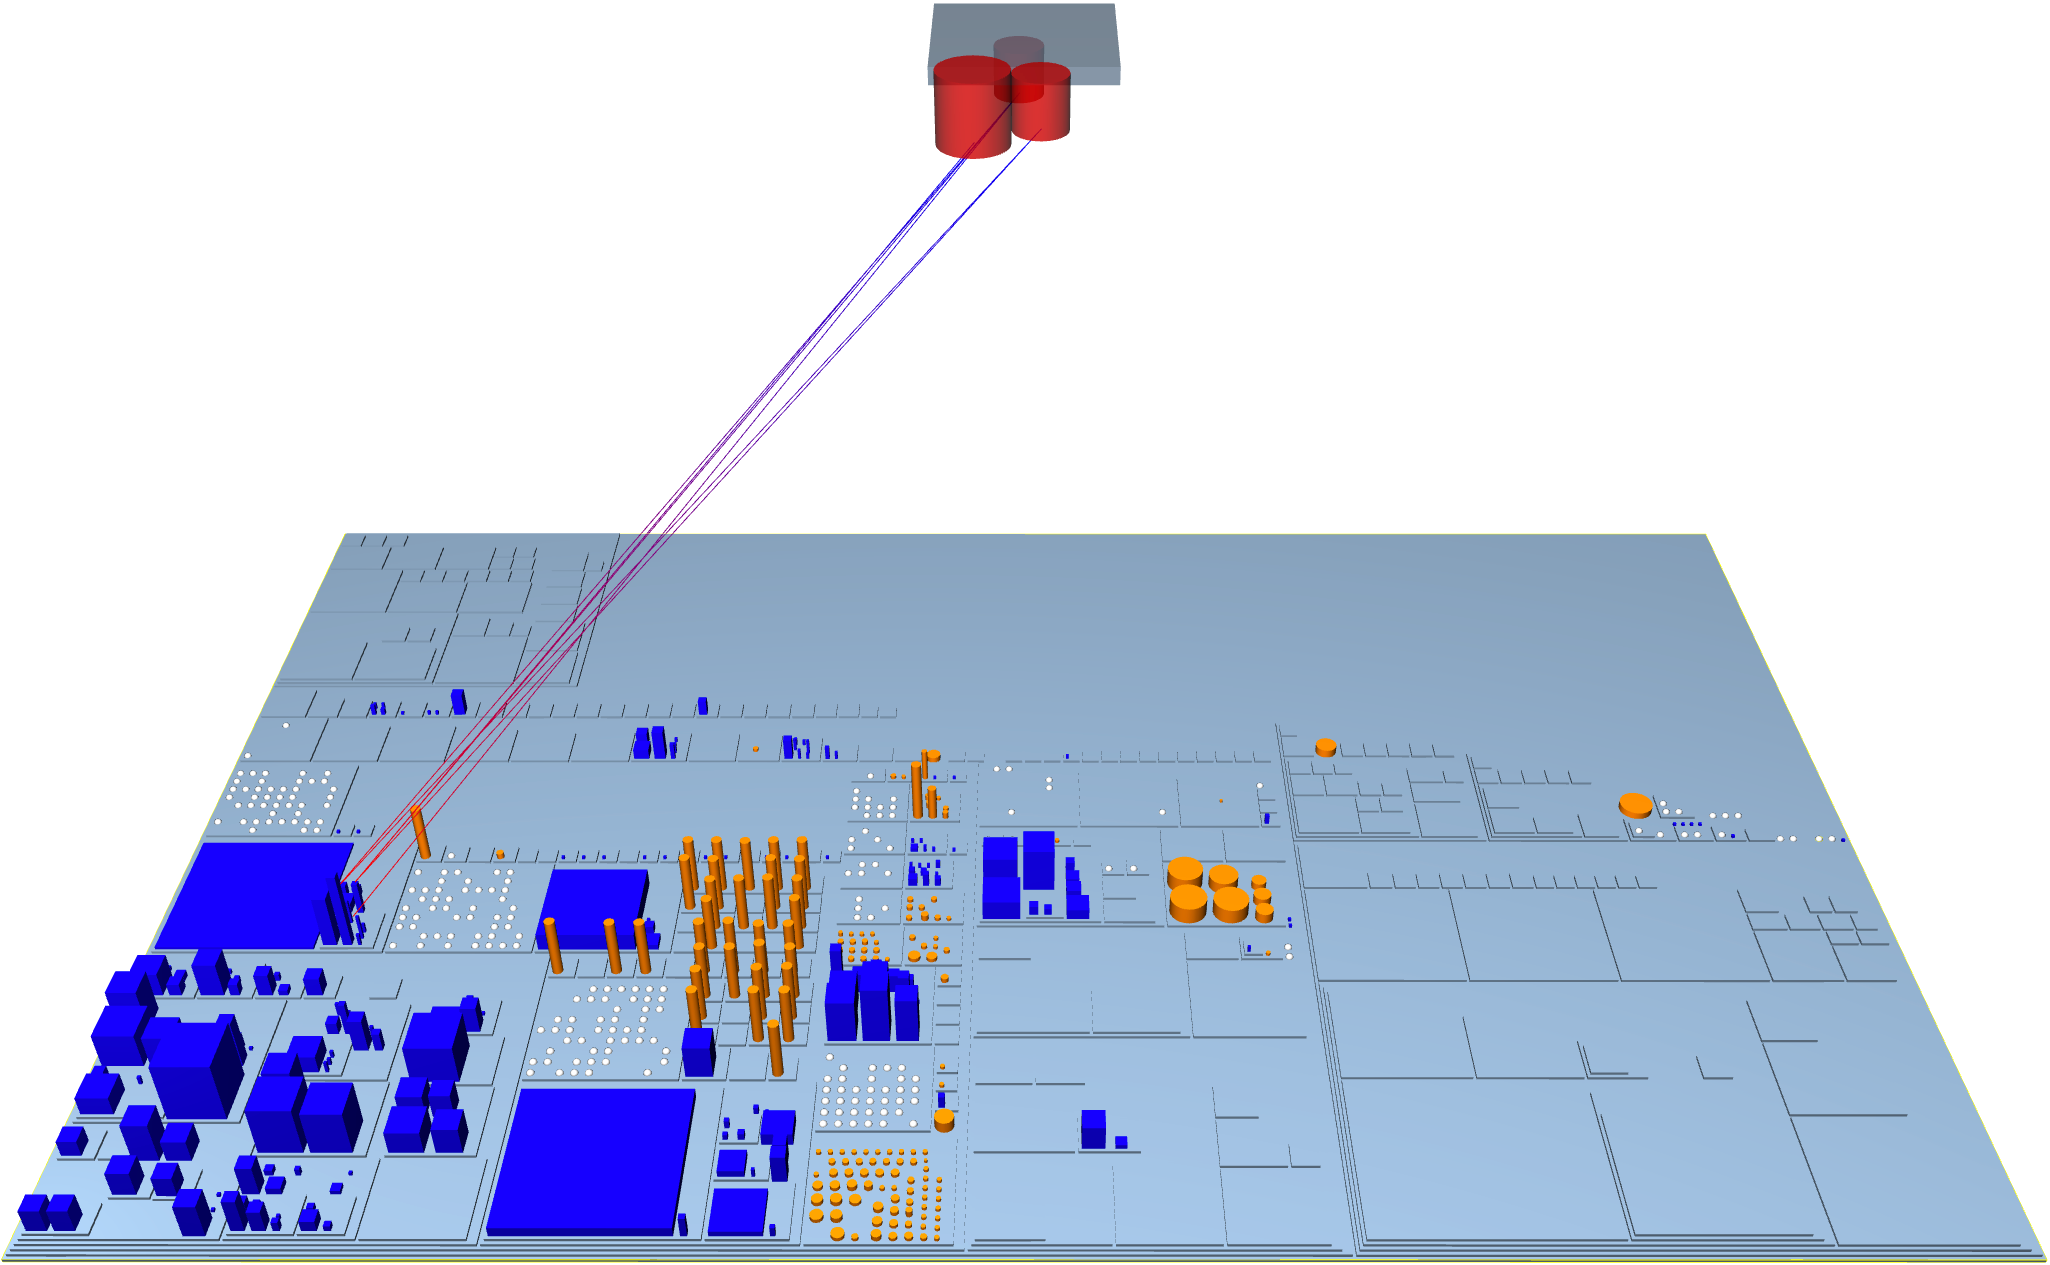
We illustrate how M3triCity can be used to comprehend the evolution of a system, by using the GnuCash-Android 777See https://github.com/codinguser/gnucash-android Android companion app of the GnuCash accounting program as an example. GnuCash-Android allows recording transactions on-the-go to import the data into GnuCash later. The main branch of the project is composed of 1,730 commits by 46 contributors. Figure 6 shows six M3triCity snapshots in the overall evolution.
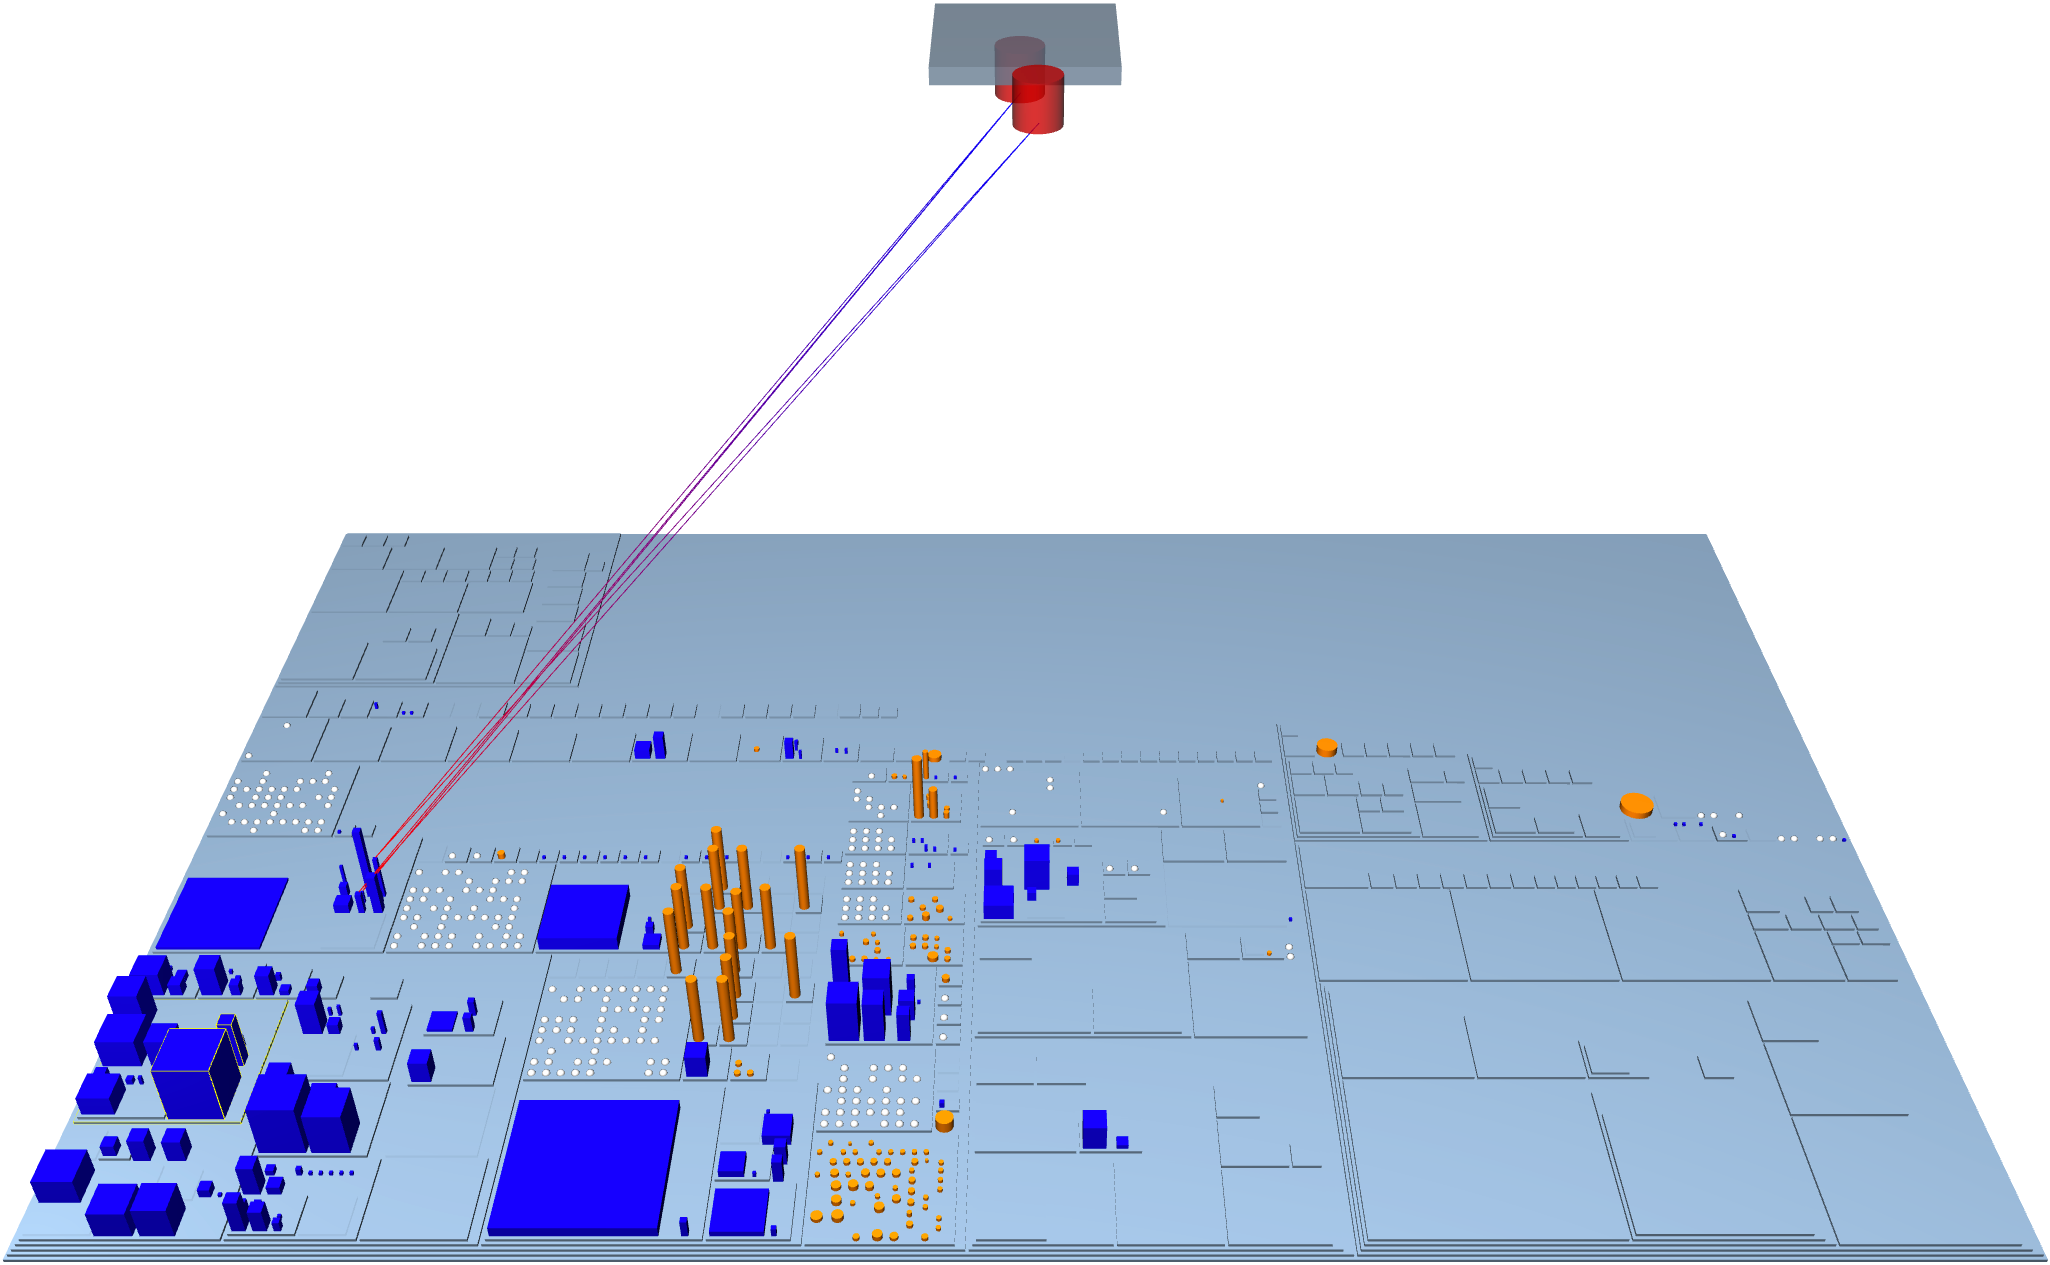
May 13 2012: GnuCash-Android is born (Figure 6(a)). On May 13, 2012, Ngewi Fet creates the project repository with 83 Java classes, 85 data files, and 243 binaries. The source code is mainly located in the com_actionbarsherlock package, nicely divided into sub-packages. The res folder contains three districts of images and several districts of data files. Separately, the module GnucashMobile has one Java class, four data files, and some binaries.
Nov 4 2012: The database is created (Figure 6(b)). The developers added a database which is being used by a part of the system that has been added in the meantime. Test classes are growing as well. Data files have been added, mostly related to text constants that need to be displayed.
Jan 31 2013: GnuCash-Android undergoes a major restructuring (Figure 6(c)). Almost 450 files are deleted, and 220 are moved with the renaming of the folder GnucashMobile to app. The database-related classes are still present but the accesses to the tables are removed.
Sep 18 2015: Controlled evolution (Figure 6(d)). Fast forwarding 2 years, the system keeps evolving: the test suite is expanded, the developers started working on a user interface module. The database co-evolves with the system, with the addition and quick deletion of tables.
Dec 28 2015: Extending the tests (Figure 6(e)). The system evolves mostly with new tests.
Dec 2 2020: Fast forward (Figure 6(f)). Five years later the system has grown considerably, with some classes reaching considerable size in terms of variables and methods. Data file districts have been added, complementing systematic database accesses on a well-organized DB featuring the three major tables transactions, splits, and scheduled_actions.
4. Related Work
Since the seminal works of Reiss (Reiss, 1995) and Young & Munro (Young and Munro, 1998), many approaches to visualize software systems in 3D have been explored. The cities metaphor has been widely used and led to diverse implementations, such as the Software World by Knight et al. (Knight and Munro, 2000), the visualization of communicating architectures by Panas et al. (Panas et al., 2003), Verso by Langelier et al. (Langelier et al., 2005), CodeCity by Wettel et al. (Wettel and Lanza, 2007, 2008), EVO-STREETS by Steinbrückner & Lewerentz (Steinbrückner and Lewerentz, 2010), CodeMetropolis by Balogh & Beszedes (Balogh and Beszedes, 2013), and VR City by Vincur et al. (Vincur et al., 2017).
Only a few approaches considered presenting data(bases) together with the source code, mostly using the city metaphor. Meurice and Cleve presented DAHLIA to visualize database schema evolution (Meurice and Cleve, 2016), which uses the city metaphor where buildings in the city represent database tables. Zirkelbach and Hasselbring presented RACCOON (Zirkelbach and Hasselbring, 2019), which uses the 3D city metaphor to show the structure of a database based on entity-relationship diagrams. Marinescu presented a meta-model containing object-oriented entities, relational entities and object-relational interactions (Marinescu, 2019). M3triCity does not separate source code and data(bases), like existing approaches, but it shows them with their interactions in the same city.
5. Conclusion
M3triCity extends the original city metaphor by considering an important aspect that has been ignored up to now: the data.
Our tool visualizes object-oriented software systems, their evolution, and the way they access data and information. M3triCity expands the original city metaphor by adding a number of features and concepts: using different glyphs to distinguish between the various file types, taking software evolution into account to layout the city, inferring and visualizing the databases used by a system, and providing higher accessibility by being publicly available as a web application.
To demonstrate the usefulness of our approach, we illustrate how M3triCity can be used to comprehend the evolution of a data-intensive system: GnuCash-Android.
Acknowledgements.
We acknowledge the financial support of the Swiss National Science Foundation and the Fonds de la Recherche Scientifique for the project “INSTINCT” (SNF Project No. 190113).References
- (1)
- Ardigò et al. (2021) Susanna Ardigò, Csaba Nagy, Roberto Minelli, and Michele Lanza. 2021. Visualizing Data in Software Cities. In Working Conference on Software Visualization, VISSOFT 2021. IEEE, 145–149.
- Balogh and Beszedes (2013) Gergő Balogh and Arpad Beszedes. 2013. CodeMetropolis - code visualisation in MineCraft. In Proc. 13th Int. Working Conf. Source Code Analysis and Manipulation. IEEE Computer Society, 136–141.
- Fittkau et al. (2015) Florian Fittkau, Alexander Krause, and Wilhelm Hasselbring. 2015. Exploring software cities in virtual reality. In 3rd IEEE Working Conference on Software Visualization, VISSOFT. IEEE Computer Society, 130–134.
- Fittkau et al. (2013) Florian Fittkau, Jan Waller, Christian Wulf, and Wilhelm Hasselbring. 2013. Live trace visualization for comprehending large software landscapes: The ExplorViz approach. In 2013 First IEEE Working Conference on Software Visualization (VISSOFT). IEEE Computer Society, 1–4.
- Girba (2005) Tudor Adrian Girba. 2005. Modeling history to understand software evolution. Ph.D. Dissertation. University of Bern.
- Knight and Munro (2000) Claire Knight and Malcolm Munro. 2000. Virtual but visible software. In Proc. 17th Int. Conf. Information Visualization. IEEE, 198–205.
- Langelier et al. (2005) Guillaume Langelier, Houari Sahraoui, and Pierre Poulin. 2005. Visualization-based Analysis of Quality for Large-scale Software Systems. In Proc. 20th Int. Conf. Automated Software Engineering. ACM, 214–223.
- Lanza and Ducasse (2003) Michele Lanza and Stéphane Ducasse. 2003. Polymetric Views - A Lightweight Visual Approach to Reverse Engineering. IEEE Trans. Software Eng. 29, 9 (2003), 782–795.
- Marinescu (2019) Cristina Marinescu. 2019. Applications of Automated Model’s Extraction in Enterprise Systems. In Proc. 14th Int. Conf. Software Technologies (ICSOFT 2019). SCITEPRESS, 254–261.
- Merino et al. (2018) Leonel Merino, Alexandre Bergel, and Oscar Nierstrasz. 2018. Overcoming Issues of 3D Software Visualization through Immersive Augmented Reality. In Working Conf. on Software Visualization, VISSOFT. IEEE, 54–64.
- Meurice and Cleve (2016) Loup Meurice and Anthony Cleve. 2016. DAHLIA 2.0: A Visual Analyzer of Database Usage in Dynamic and Heterogeneous Systems. In Proc. 2016 Working Conf. Software Visualization (VISSOFT). IEEE, 76–80.
- Minelli et al. (2015) Roberto Minelli, Andrea Mocci, and Michele Lanza. 2015. I know what you did last summer-an investigation of how developers spend their time. In 23rd International Conference on Program Comprehension. IEEE, 25–35.
- Moreno-Lumbreras et al. (2021) David Moreno-Lumbreras, Roberto Minelli, Andrea Villaverde, Jesús M González-Barahona, and Michele Lanza. 2021. CodeCity: On-Screen or in Virtual Reality?. In VISSOFT 2021. IEEE, 12–22.
- Nagy and Cleve (2018) Csaba Nagy and Anthony Cleve. 2018. SQLInspect: a static analyzer to inspect database usage in Java applications. In 40th International Conference on Software Engineering: Companion Proceedings, ICSE. ACM, 93–96.
- Panas et al. (2003) Thomas Panas, R. Berrigan, and John Grundy. 2003. A 3D metaphor for software production visualization. In Proc. 7th Int. Conf. Information Visualization. IEEE Computer Society, 314 – 319.
- Panas et al. (2007) Thomas Panas, Thomas Epperly, Daniel J. Quinlan, Andreas Sæbjørnsen, and Richard W. Vuduc. 2007. Communicating Software Architecture using a Unified Single-View Visualization. In Proc. 12th Int. Conf. Engineering Complex Computer Systems. IEEE Computer Society, 217–228.
- Pfahler et al. (2020) Federico Pfahler, Roberto Minelli, Csaba Nagy, and Michele Lanza. 2020. Visualizing Evolving Software Cities. In Proceedings of VISSOFT 2020 (8th Working Conference on Software Visualization). IEEE CS Press, 22–26.
- Reiss (1995) Steven P. Reiss. 1995. An Engine for the 3D Visualization of Program Information. J. Visual Languages & Computing 6, 3 (1995), 299–323.
- Stasko et al. (1997) John T. Stasko, Marc H. Brown, and Blaine A. Price. 1997. Software Visualization. MIT Press.
- Steinbrückner and Lewerentz (2010) Frank Steinbrückner and Claus Lewerentz. 2010. Representing development history in software cities. In Proceedings of the ACM 2010 Symposium on Software Visualization. ACM, 193–202.
- Tymchuk et al. (2015) Yuriy Tymchuk, Andrea Mocci, and Michele Lanza. 2015. ViDI: The Visual Design Inspector. In 37th IEEE/ACM International Conference on Software Engineering, ICSE. IEEE Computer Society, 653–656.
- Vincur et al. (2017) Juraj Vincur, Pavol Návrat, and Ivan Polásek. 2017. VR City: Software Analysis in Virtual Reality Environment. In Proc. Int. Conf. Software Quality, Reliability and Security Companion. IEEE Computer Society, 509–516.
- Wettel and Lanza (2007) Richard Wettel and Michele Lanza. 2007. Visualizing Software Systems as Cities. In Proc. 4th Int. Workshop on Visualizing Software for Understanding and Analysis. IEEE Computer Society, 92–99.
- Wettel and Lanza (2008) Richard Wettel and Michele Lanza. 2008. CodeCity: 3D Visualization of Large-Scale Software. In Proceedings of ICSE 2008 (30th International Conference on Software Engineering). ACM Press, 921–922.
- Young and Munro (1998) Peter Young and Malcolm Munro. 1998. Visualizing Software in Virtual Reality. In 6th International Workshop on Program Comprehension (IWPC ’98), June 24-26, 1998, Ischia, Italy. IEEE Computer Society, 19–26.
- Zirkelbach and Hasselbring (2019) Christian Zirkelbach and Wilhelm Hasselbring. 2019. Live Visualization of Database Behavior for Large Software Landscapes: The RACCOON Approach. Technical Report. Department of Computer Science, Kiel University.