Weakly Aligned Feature Fusion for Multi-modal Object Detection
Abstract
To achieve accurate and robust object detection in the real-world scenario, various forms of images are incorporated, such as color, thermal, depth, etc. However, multi-modal data often suffer from the position shift problem, i.e. the image pair is not strictly aligned, making one object has different positions in different modalities. For the deep learning method, this problem makes it difficult to fuse multi-modal features and puzzles the CNN training. In this paper, we propose a general multi-modal detector named Aligned Region CNN (AR-CNN) to tackle the position shift problem. Firstly, a region feature alignment module with adjacent similarity constraint is designed to consistently predict the position shift between two modalities and adaptively align the cross-modal region features. Secondly, we propose a novel RoI jitter strategy to improve the robustness to unexpected shift patterns. Thirdly, we present a new multi-modal feature fusion method, which selects the more reliable feature and suppresses the less useful one via feature re-weighting. Additionally, by locating bounding boxes in both modalities and building their relationships, we provide novel multi-modal labelling named KAIST-Paired. Extensive experiments on 2D and 3D object detection, RGB-T and RGB-D datasets demonstrate the effectiveness and robustness of our method.
Index Terms:
multi-modal object detection, pedestrian detection, feature fusion, deep learning.I Introduction

Robust object detection is a crucial ingredient of many computer vision applications in the real world, such as robotics, surveillance, and autonomous driving. Nowadays, smart devices are usually equipped with different sensors (e.g. cameras, thermal cameras, time-of-flight, structured light, LiDAR, Radars), which provide different image forms. Compared to pure RGB data [1, 2, 3], integrating the extra modality is proven to be effective for recognition: infrared camera provides biometric information for around-the-clock pedestrian detection [4, 5, 6] and face recognition [7, 8], and depth channel provides 3D information for object detection [9, 10, 11] and pose estimation [12, 13], etc. Motivated by this, the multi-modal object detection has attracted massive attention, not only towards the improvement of accuracy but also for a better robustness promise.
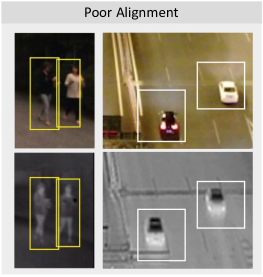
Most existing multi-modal methods [14, 4, 11] detect objects under the alignment assumption, i.e. the image pairs from different modalities are well aligned and have strong pixel-to-pixel correspondence. However, this assumption does not always hold in practice, as shown in Figure 1, which poses great challenges to existing methods. To fill the gap with the alignment assumption and real-world applications, we discuss three main reasons behind the challenges.
First, the alignment quality of image pair is limited by the physical properties of different sensors, e.g. geometrical disparity due to relative displacement [15], mismatched resolutions and field-of-views. For example, the border areas of color images need to be sacrificed since the color camera usually has a higher resolution and larger field view than the thermal camera [4]. This will naturally lead to imperfect calibration and result in alignment error. Second, the calibration and re-calibration processes are important while tortuous, generally require particular hardware such as a special heated calibration board [16, 17, 18], making re-calibration difficult when the device is in operation. Moreover, the alignment is easily impacted by external disturbance (e.g. mechanical vibrations and temperature variation) and hardware aging, which is hard to be avoided when a system starts to operate.
As a result, the multi-modal images are often weakly aligned in practice, thus there is position shift between one object in different modalities, i.e. the position shift problem. The position shift problem degrades the CNN-based detectors mainly in two aspects. First, multi-modal features in the corresponding position are spatially mismatched, which will puzzle the CNN training. Second, the position shift problem makes it difficult to match objects from both input modalities by using a shared bounding box. As a workaround, existing multi-modal datasets [4, 5] use larger bounding boxes to encompass objects from both modalities or annotate objects on a single input modality. Such label bias can lead to bad supervision signals and is harmful to the training process, especially for modern detectors [19, 20, 21, 22] since they generally use the intersection over union (IoU) overlap for foreground/background classification.
Thus, how to robustly locate the object on weakly aligned modalities remains to be a crucial issue for multi-modal object detection, while it is barely touched or studied in the literature. Besides, due to different devices, deployment environments, and operation duration, the priorities of modality information and the patterns of position shifts are ever-changing. Hence it is a very important challenge to cope with the position shift problem using a single model.
In this paper, a novel framework is proposed to tackle the position shift problem in an end-to-end fashion. Specifically, we present a novel Region Feature Alignment (RFA) module to shift and align the to-be-fused region features from input modalities. With this module, the region-based alignment process is inserted in the network and works in a learnable way. To further enhance the robustness to different patterns of position shift, we propose the RoI jitter training strategy, which augments the RoIs of the sensed modality via random jitter.
To validate the effectiveness of our method, we apply the proposed framework on the typical RGB-T (multispectral) pedestrian detection. To better meet the around-the-clock demands, we design a new confidence-aware fusion module, which selects the more reliable feature and suppresses the less useful one via adaptive feature re-weighting. Besides, we provide a novel KAIST-Paired111available at https://github.com/luzhang16/AR-CNN annotation by locating the bounding boxes in both modalities and building their relationships. We also collect a drone-based RGB-T dataset, which includes more object categories (e.g. car, bus, truck, cyclist), to validate the generalization to RGB-T object detection. Moreover, we extend the proposed method to the RGB-D based object detection task. Experiments on 3D object detection are conducted on the standard NYUv2 dataset. To further validate the proposed framework, we build a dataset containing different kinds of indoor objects, called SL-RGBD, in which image pairs are labelled with multi-modal bounding boxes. Extensive experimental results demonstrate that the proposed method significantly improves the robustness to position shift problem and takes full advantage of multi-modal inputs by effective feature fusion, thus achieving state-of-the-art result on the challenging KAIST and CVC-14 datasets. For the general 2D and 3D object detection tasks, our method also achieves the best robustness performance on the NYUv2 and SL-RGBD datasets.
This paper is an extension of our previous work [23] mainly in the following aspects: 1) We improve our method with the adjacent similarity constraint for the region shift prediction and extend the approach to a general multi-modal object detection task, including RGB-Thermal and RGB-Depth detection, 2D and 3D object detection; 2) The experimental upper bound of position shift for the weakly aligned image pair are introduced to specify the definition of the weakly aligned; 3) Additional experiments and analyses are conducted to better show the effectiveness and generalization ability of the proposed method.
The remainder of the paper is organized as follows: we review the related work in Section II. Section III discusses the position shift problem in weakly aligned image pairs and presents our motivation. Section IV describes the proposed framework in detail. Extensive experiment results of RGB-T pedestrian detection are given in Section V. In Section VI, we further report the results of the proposed method on RGB-D based 2D and 3D object detection. We conclude the paper in Section VII.
II Related Work
Recent intelligence systems have access to various forms of images, such as RGB, depth, infrared, etc. Compared to the RGB-based method, the adoption and fusion of novel modality greatly improve the performance and robustness, thus enabling many practical applications, e.g. around-the-clock surveillance, autonomous driving and robot grasping.
II-A Multispectral (RGB-T) Pedestrian Detection
Pedestrian detection is an essential step for many applications and recently gets increasing attention. In previous years, many algorithms and features have been proposed, including the traditional detectors [24, 25, 26, 27] and the lately dominated CNN-based detectors [28, 29, 30, 31, 32]. With the recent release of large-scale multispectral pedestrian benchmarks, efficiently exploiting the multispectral data has shown great advantages on pedestrian detection, especially for the around-the-clock operation [33, 34, 35, 36, 37, 38]. In [4], Hwang et al. propose the KAIST multispectral dataset and extend the ACF method to make full use of the aligned color-thermal image pairs. With the success of deep learning, several CNN-based methods [39, 40, 41, 42] are proposed in recent years. Liu et al.[43] build a two-stream detector and experimentally analyse different fusion timings. König et al.[44] fuse features of the Region Proposal Network (RPN) and introduce the Boosted Forest (BF) framework as the classifier. In [45], Xu et al. propose a cross-modality learning framework that can cope with missing thermal data at testing time. Zhang et al. [40] utilize the cross-modality attention mechanism to recalibrate the channel responses of halfway feature maps. However, most previous approaches conduct multi-modal fusion under the full alignment assumption. This not only hinders the use of weakly aligned datasets (such as CVC-14 [5]), but also limits the further development of multispectral pedestrian detection, which is worthy of attention but still lacks research.
II-B RGB-D Object Detection
We briefly introduce the 2.5D approaches in RGB-D images, in which the depth images are generally treated in a similar fashion as RGB images. In [46], the detector combines the Histogram of Oriented Gradients (HOG) features of RGB data and Histogram of Oriented Depths (HOD) of dense depth data in a probabilistic way. With the recent dominance of CNNs, Gupta et al. [9] build a CNN-based detector on the top of pre-computed object segmentation candidates. They extend the R-CNN [47] to utilize depth information with HHA encoding (Horizontal Disparity, Height above ground, and Angle of local surface normal w.r.t gravity direction). But the outputs of detectors are still limited to 2D ones. In order to infer the 3D bounding box, Deng et al. [11] propose the Amodal3Det, which further explores the strong CNN to infer 3D dimensions in RGB-D data efficiently. Besides, the single-shot 3D-SSD [48] is designed to achieve high-speed inference. [49] downsamples the RoIs to get better 3D initialization. Different from them, we consider the position shift problem in RGB-D pairs for 3D object detection.
II-C Weakly Aligned Image Pair
Though the multi-modal object detection is extensively studied, few detection methods touch the position shift problem in a weakly aligned image pair. Since this problem is unavoidable in the realistic scenarios due to both hardware and environmental factors, before the detection methods, it can be independently mitigated in two ways: pre-process and post-process.
The pre-process aims to solve the camera calibration problem and elaborate a delicate modality-aligned system. However, this hardware promise is easily impacted by unavoidable external disturbance. Also, the recalibration [50, 16] process can be difficult due to the characteristics of additional modality. For example, the calibration of RGB and thermal images generally need particular hardware and the special heated calibration board [16, 17, 18].
A common paradigm of the post-process is to conduct image registration (i.e. spatial alignment) [51, 52, 53]. As a image-level solution for the position shift problem, it geometrically aligns the reference and sensed images. This task mainly consists of four processes: feature detection, mapping function design, feature matching, image transformation and re-sampling. Although the image registration is well established, the low-level transformation on the whole image is often time-consuming and restricts end-to-end training of the CNN-based detector. Moreover, since different modalities present different appearances, the registration process faces great challenges because the correspondence of key points is harder to determine.
III Motivation
In this section, we present our analysis of the position shift problem in the weakly aligned image pair. To provide insights into this problem, we firstly analyse the popular KAIST [4] and CVC-14 [5] RGB-T pedestrian datasets, and the structured-light-based RGB-D system. Then we experimentally study how the position shift deteriorates the detection performance.
III-A The Position Shift Problem
The position shift is defined as the spatial displacement between two images of different cameras. The image pair is taken in the same scene and time, generally including the same objects. However, caused by the position shift problem, the pixel-to-pixel relationship does not hold, two corresponding image patches can be located in different positions.
RGB-T Pair From the image pairs in KAIST and CVC-14 RGB-T pedestrian datasets and the drone-based object dataset, we can observe several issues.
-
•
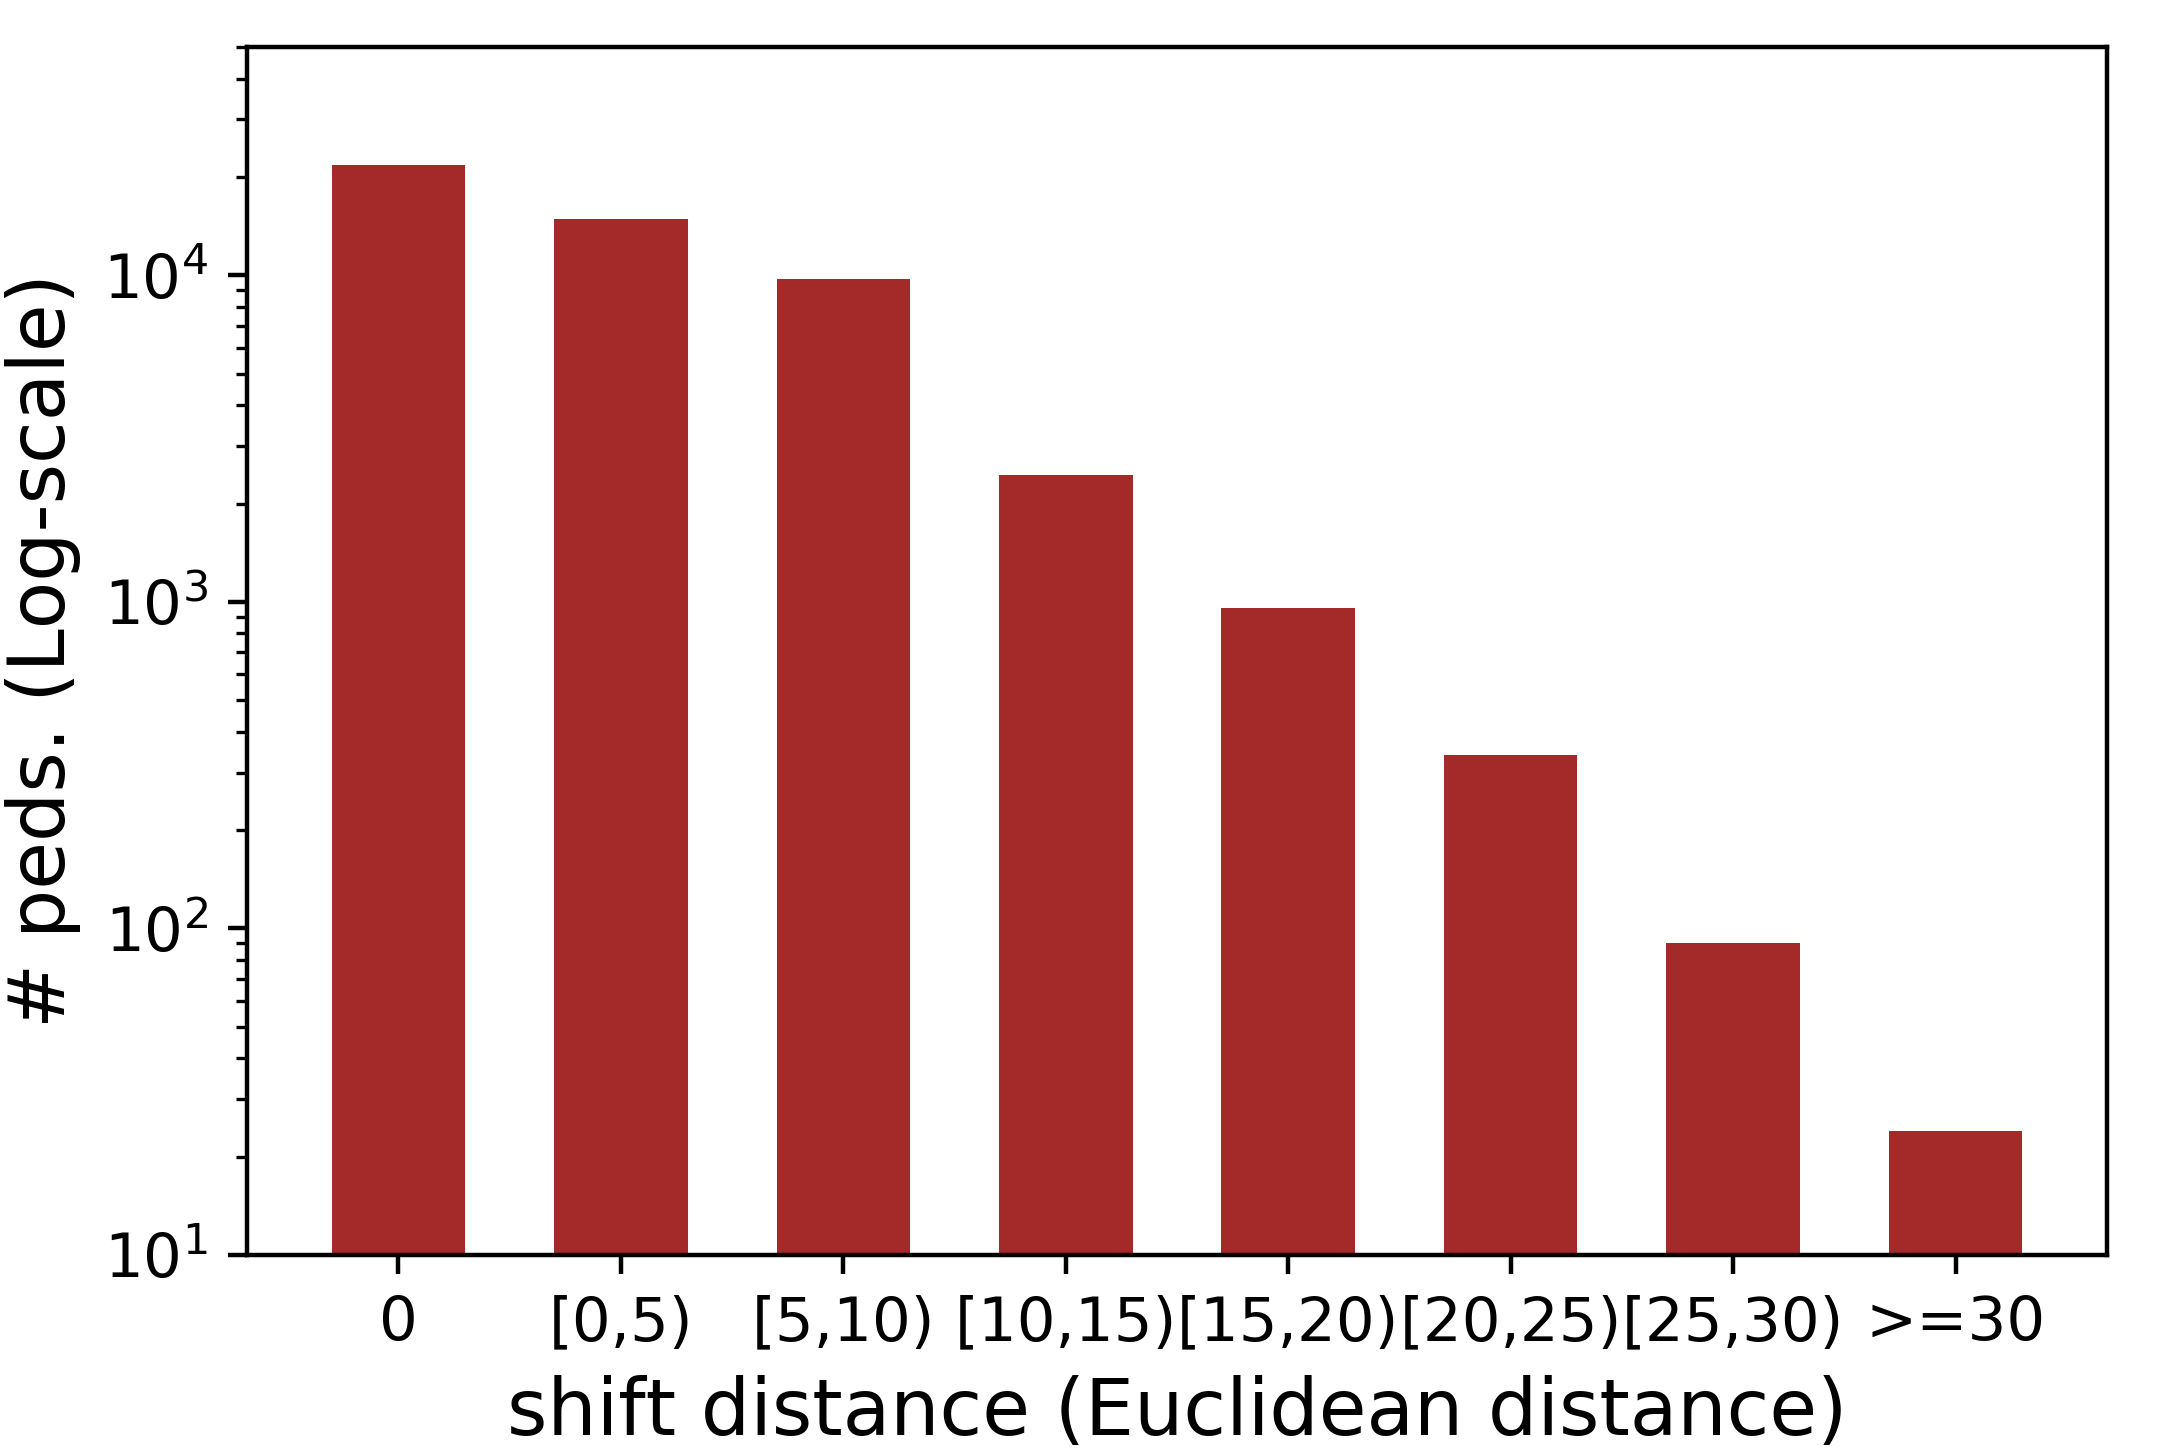
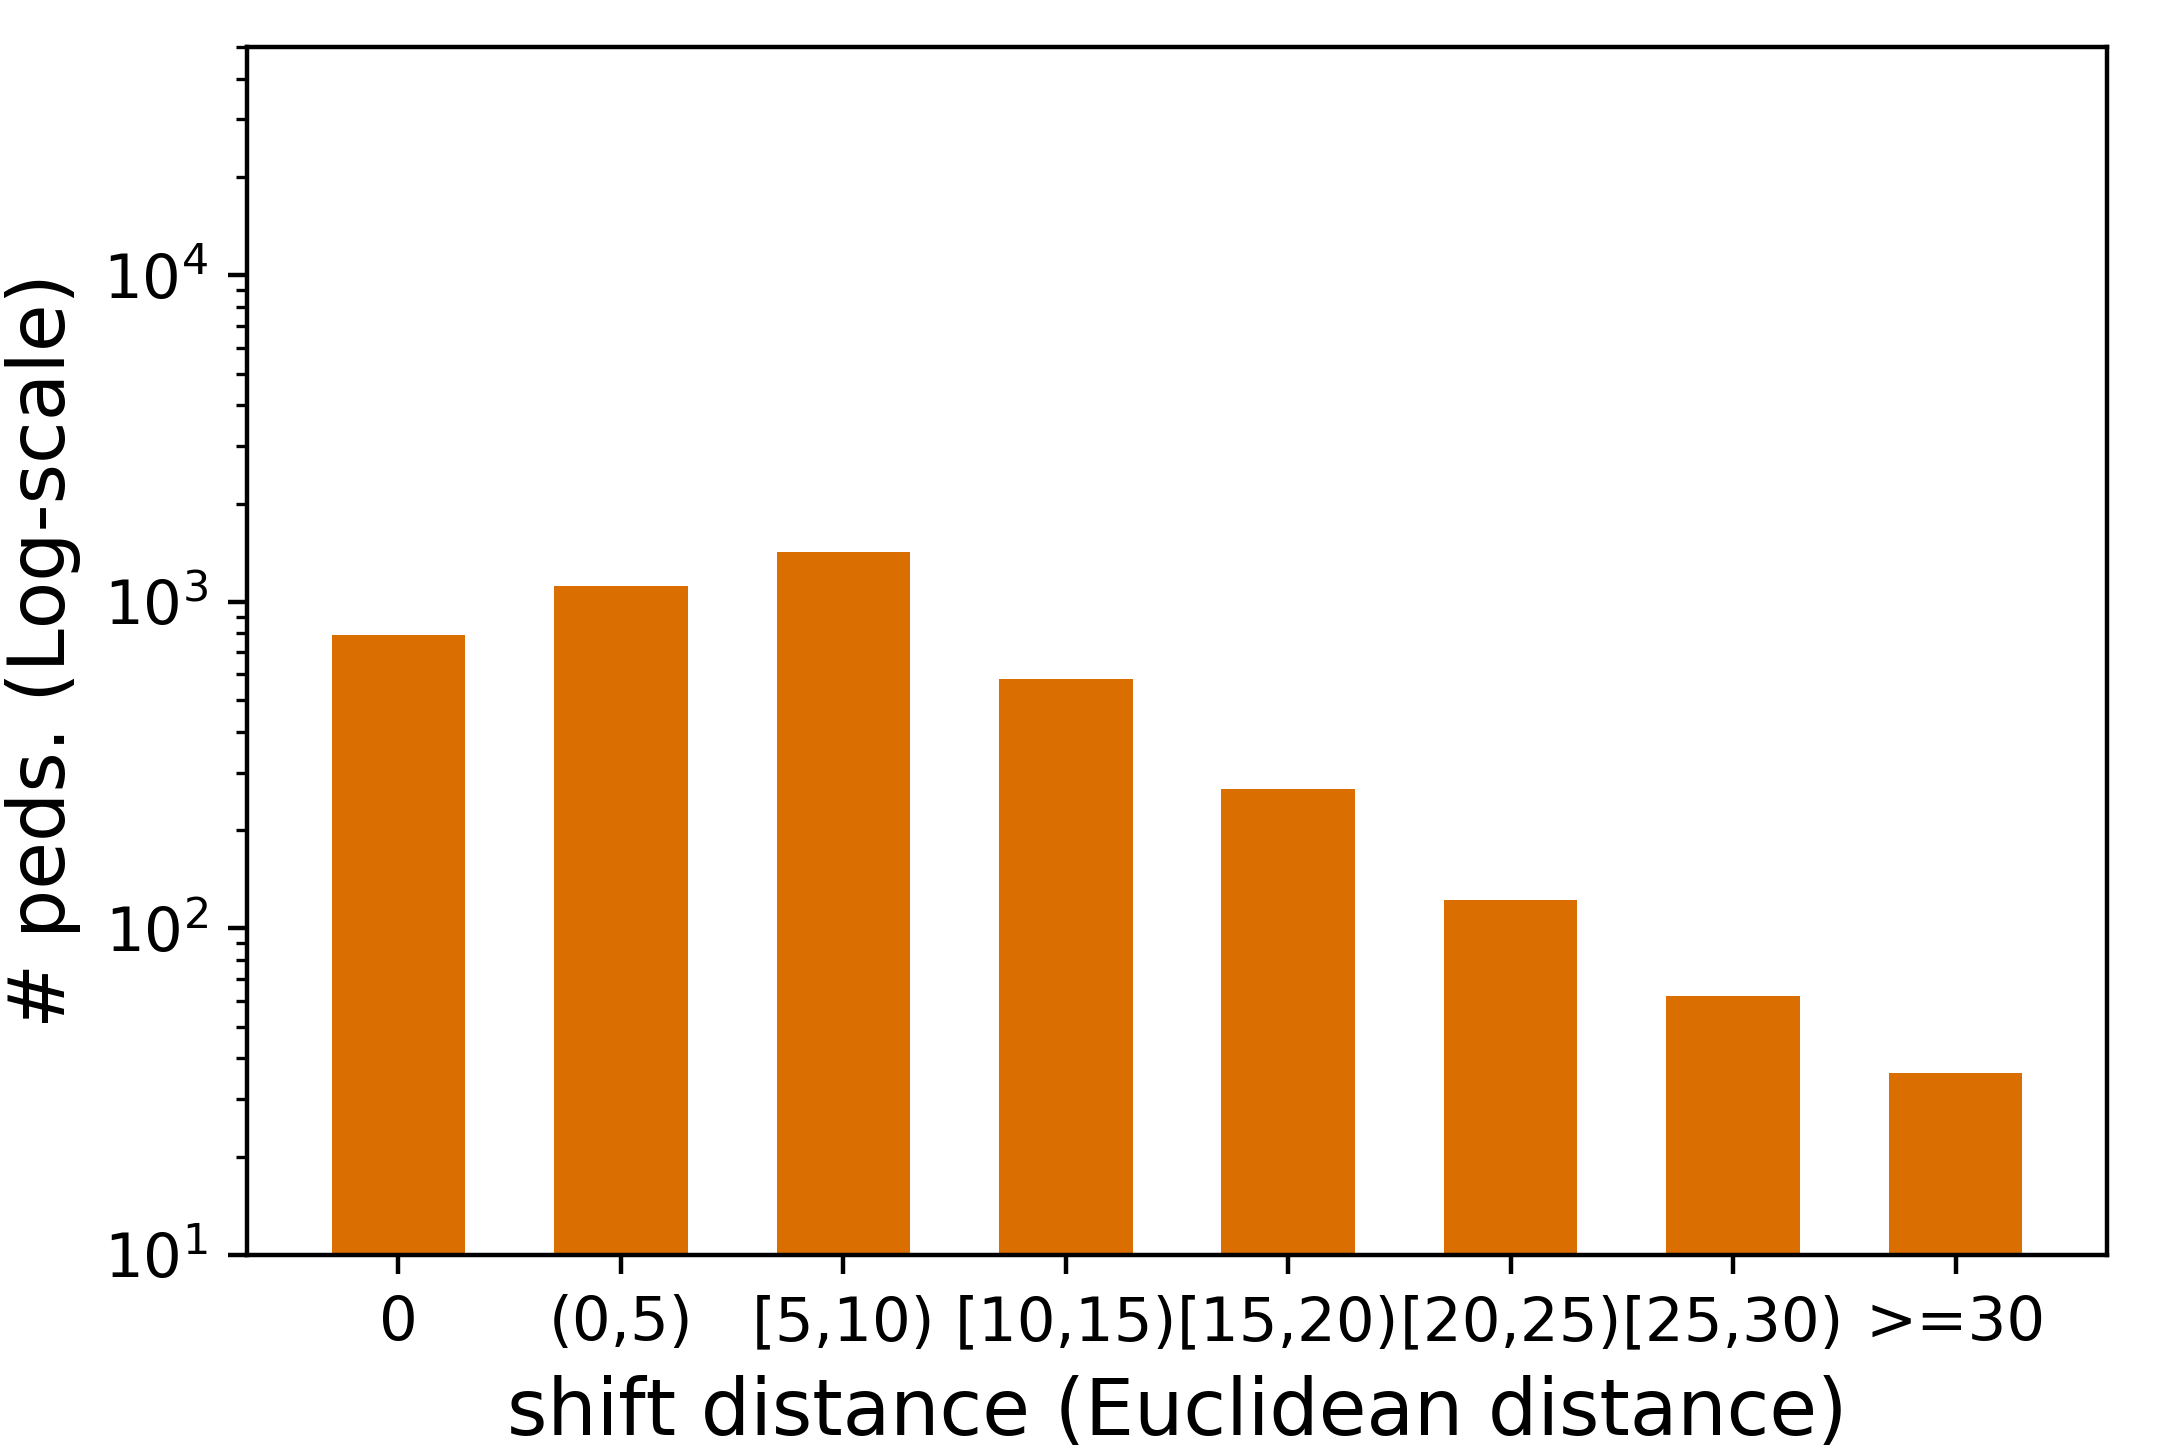
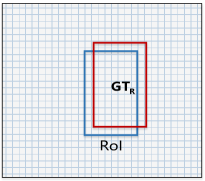
Misaligned Features. Figure 2 illustrates the position shift between modalities, this problem makes it difficult to directly fuse such misaligned features. Besides, the shift varies in different positions even in a single image. In Figure 3, we present the statistics of position shift in two datasets, which show that collection devices and operation environments also influence the shift pattern.
-
•
Localization Bias. As shown in Figure 2, the annotations need to be adjusted to match the weakly aligned image pair. One way to remedy is using larger bounding boxes to encompass objects from both modalities, but also including unnecessary background information. Another workaround is only focusing on one particular modality, but this could introduce bias for another modality.
-
•
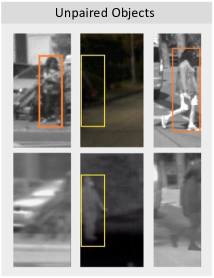
Unpaired Objects. In practice, color and thermal cameras often have different field-of-views, the situation is even worse when the synchronization and calibration are not good. Therefore, as shown in Figure 2, the objects appear in one modality but are truncated or lost in another. Specifically, ( of ) of pedestrians are unpaired in CVC-14 [5].
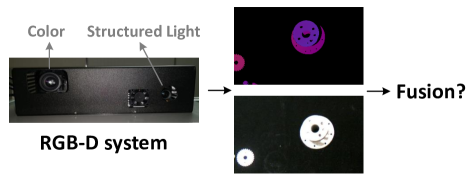
RGB-D Pair Around different types of 3D sensing systems, the projector-camera-based structured light methods have been more and more important for 3D vision related applications. A typical structured light system is composed of one projector and one industry camera. Since patterns used by the structured light systems are usually monochrome or binary, the monochrome cameras are preferred. In real applications, to obtain high-quality color texture for the reconstructed 3D models, an extra high-resolution RGB camera like a DSLR (Digital Single-Lens Reflex) camera is usually added to the system [54]. As a result, alignment of the high-resolution color image and the low-resolution point cloud or depth image is essential for any structured light systems which used extra color texture camera.
To reveal the realistic position shift problem of RGB-D data, we build such an RGB-D data collection system with a pair of color and structural light cameras, as shown in Figure 4. We can see that even the system is well calibrated, time and external disturbance will degrade the quality of the calibration. As demonstrated in Figure 4, the main problem is position shift, along with milder deformation and rotation.
III-B How the Position Shift Impacts?
To quantitatively analyse how the position shift problem impacts the detector, we perform experiments on the relatively well aligned KAIST dataset by manually simulating the position shift.
Baseline Detector Following the setting in Adapted Faster R-CNN [55], we build the baseline detector and utilize RoIAlign [56] to extract region features. We use the halfway fusion settings [43] for multispectral inputs. On the KAIST dataset, this solid baseline detector achieves log-average miss rates (MR), about better than the MR reported in [43, 42].
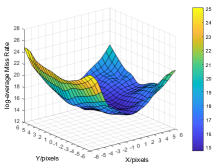
Robustness to Position Shift Without loss of generality, we set thermal images as the reference, hence the color images are spatially shifted along the and axis. We select different shift patterns in . As illustrated in Figure 5(a), the detection performance significantly drops as the absolute shift value increases. Especially, the worst-case suffers about 65% relative performance degradation (from to MR). The interesting thing is, the origin without any shift does not get the best performance. When we shift the color images to a specific direction , the detector achieves a better MR. This indicates that the detection performance can be further improved by appropriately tackling the position shift problem.
IV Our Method
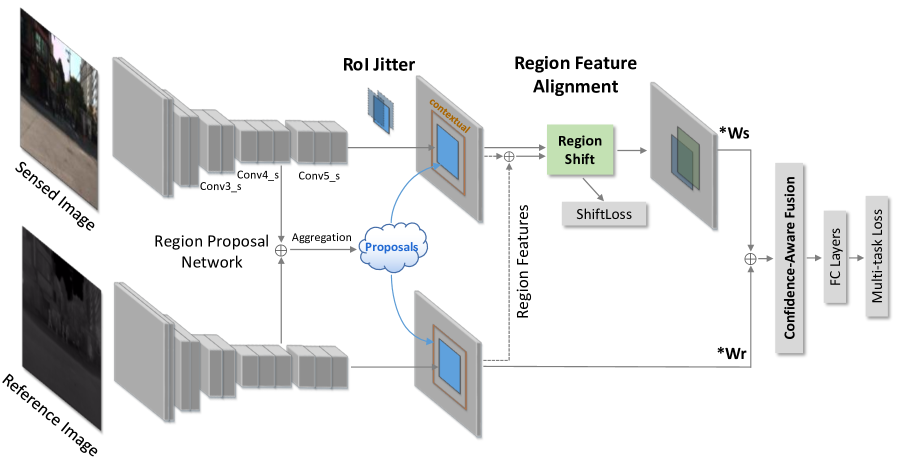
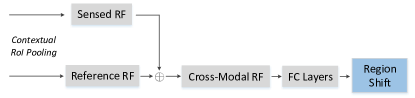
In this section, we introduce the Aligned Region CNN (AR-CNN) framework and KAIST-Paired annotation (Section IV-C1). The architecture is illustrated in Figure 6, containing the region feature alignment module (Section IV-A), the RoI jitter training strategy (Section IV-B). We also present the confidence-aware fusion step (Section IV-C1) for all-day RGB-T pedestrian detection and the adaption to RGB-D based 3D object detection task (Section IV-D). Algorithm 1 describes the whole pipeline.
IV-A Region Feature Alignment
To predict and align the shift between two modalities, we present the Region Feature Alignment (RFA) module in this subsection. In practice, the position shift is not a simple affine transformation due to the different properties of camera systems. As a result, the shift varies in different regions. It is usually large in regions near the image edge and relatively small near the image center. Therefore, the RFA module performs the shift prediction and feature alignment at the regional level.
Reference and Sensed Modality In image registration [51, 52], the reference and sensed images refer to the stationary and transformed images, respectively. We introduce this concept into our multi-modal setting. In the training phase, the reference modality is fixed and the feature alignment and RoI jitter strategy are performed on the sensed modality.
Proposals Generation To keep more potential objectness regions, we aggregate both the reference and sensed feature maps (Conv4_r and Conv4_s) to generate the proposals. We utilize the Region Proposal Network (RPN) [19] for the proposal generation process.
Feature Alignment Figure 7 illustrates the concrete connection scheme of the RFA module. Specifically, the RFA module first enlarges the proposals (RoIs) to encompass the contextual information. Then we pool the contextual region features of each modality to small (such as ) feature maps. Then the pooled region features are concatenated to obtain the cross-modal representation. Based on this representation, we use two consecutive fully connected layers to predict the shift (i.e. and ) of each region. In this way, we obtain new coordinates of the sensed region and re-pool on this new region to get the aligned sensed features.
Since the proposed KAIST-Paired annotation (more details in Section IV-C1) provides multi-modal bounding boxes, we can calculate the targets of ground truth shift as follow:
| (1) |
where and are the center coordinates of the box, and refer to the width and height, and denote the reference and sensed ground truth box, and indicate the shift target for and coordinates, respectively.
Adjacent Similarity Constraint For natural images, the position shift is spatially smooth, i.e. the shift targets for adjacent regions tend to be similar. Base on this, we add the adjacent similarity constraint to stabilize the training process of the RFA module. Specifically, we first randomly sample one of four nearest pixels (with feature stride) to the pooled features maps of the region of interest. Then, the same alignment targets are assigned to the region of interest and its neighbour, thus it encourages the RFA module to predict similar for adjacent regions.
Position Shift Loss To measure the accuracy of predicted shift targets, we calculate the position shift loss as follow:
| (2) | |||
The subscript denotes the index of RoIs in minibatch, is the class label ( for the pedestrian and for the background) of the RoI, indicates the predicted shift, and is the ground truth shift target. denotes the number of to-be-aligned RoIs.
Multi-task Loss Then the multi-task loss function is defined as follow:
| (3) | |||
and are similar to the loss in Fast R-CNN [57]. is the loss of the adjacent similarity constraint, is the predicted shift of the 4-neighbourhood. Variable refers to the predicted class confidence for the i-th RoI, is the predicted refinement, and are associated ground truths. We balance the and by setting the as the weighting parameter. To weight the two terms, we use . Apart from this multi-task loss, the definition of RPN loss follows the literature [19].
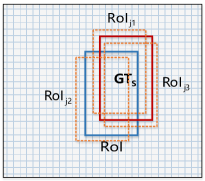
IV-B RoI Jitter Strategy
During training, the position shift can be limited to a certain kind of pattern, which is often related to the collection devices and settings of datasets. However, the practical shift pattern is unexpected. To fill the gap between the offline training and online testing, we present the RoI jitter strategy, as illustrated in Figure 8. For the sensed modality, we introduce a random disturbance to generated new jittered positions of the proposal. Meanwhile, the shift targets of the RFA module are enriched correspondingly. The random jitter target is derived from the Gaussian distribution as follow:
| (4) |
Variable indicates jitter targets along the and axis, denotes the radiation extent of jitter. Afterward, we use the inverse process of Equation 1 to jitter the to .
Minibatch Sampling To select the set of samples for minibatch training, we need to define the positive and negative samples by calculating the IoU overlap. In our setting, we consistently use the reference RoI for this calculation, since we perform the random jitter on the sensed RoI.
IV-C All-day RGB-T Pedestrian Detection
IV-C1 KAIST-Paired Annotation
Existing RGB-T datasets ignore the cross-modal correlation between pedestrians. To fill this gap, we provide the multi-modal labelling following these rules:
-
•
Multi-modal locating. We locate the pedestrian in both color and thermal modality, thus providing clear position shift patterns.
-
•
Adding relationships. To indicate the cross-modal correlations of objects, we assign unique indexes to the pedestrians.
-
•
Annotating unpaired pedestrians. If a pedestrian only appears in a single modality, we annotate it as the “unpaired” one.
Statistics of KAIST-Paired Since we have access to the proposed KAIST-Paired annotation, the statistics of position shift in the original KAIST dataset can be derived. As shown in Figure 3(a), over half of pedestrians suffer from the position shift, which mostly ranges from to pixels.
IV-C2 Confidence-Aware Fusion
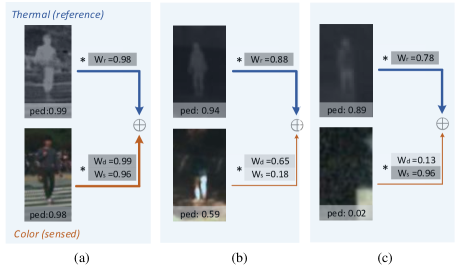
In all-day operations, the quality of information from color and thermal modality is diverse: features from the color modality are distinguishable in the daytime yet fade in the nighttime; and thermal images provide the pedestrian silhouette around the clock but lacks visual details like the clothing. To make full use of the characteristics between two different modalities, we propose the confidence-aware fusion method to select the more reliable feature while suppressing the less useful one via feature re-weighting.
As illustrated in Figure 9, the confidence-aware fusion module uses two confidence weights and . To calculate the two weights, we add a branch for each modality to obtain classification score . Then the confidence weights for each modality are calculated as: , , where and are the probability of foreground and background, denotes the reference modality and is the sensed one. Then this module performs the multiplication to pay more attention to the reliable modality.
Unpaired Objects To mitigate the ambiguous classification for unpaired objects, we use the disagreement weight, . If the sensed modality provides a contradictory prediction with the reference, its feature will be suppressed.
| Method | MR | |||
| Day | Night | All | ||
| Visible | SVM [5] | 37.6 | 76.9 | - |
| DPM [5] | 25.2 | 76.4 | - | |
| Random Forest [5] | 26.6 | 81.2 | - | |
| ACF [58] | 65.0 | 83.2 | 71.3 | |
| Faster R-CNN [58] | 43.2 | 71.4 | 51.9 | |
| Visible+Thermal | MACF [58] | 61.3 | 48.2 | 60.1 |
| Choi et al. [59] | 49.3 | 43.8 | 47.3 | |
| Halfway Fusion [58] | 38.1 | 34.4 | 37.0 | |
| Park et al.[58] | 31.8 | 30.8 | 31.4 | |
| AR-CNN (Ours) | 24.3 | 18.1 | 22.0 | |
| Method | mAP | car | bus | truck | cyclist |
| SSD[20] | 23.6 | 40.6 | 31.7 | 21.3 | 6.8 |
| Faster R-CNN[19] | 26.7 | 44.7 | 30.7 | 21.9 | 9.5 |
| Halfway Fusion[43] | 31.9 | 52.6 | 37.7 | 25.0 | 12.4 |
| CIAN[40] | 34.8 | 57.0 | 40.2 | 28.7 | 13.3 |
| AR-CNN (Ours) | 36.4 | 59.8 | 40.6 | 29.9 | 15.1 |
IV-D 3D RGB-D Object Detection
To better understand the physical 3D world, object detection also aims to predict the 3D location and its full extent in 3D space. In this paper, we have RGB-D image pairs as inputs and leverage the 2.5D representation to predict 3D bounding boxes.
2D RoI proposals Since RGB and depth images contain complementary information, we use both modalities to generate the proposals in 2D space. As in Section IV-A, the Region Proposal Network (RPN) is adapted to generate 2D proposals in an end-to-end fashion.
3D bounding box initialization and regression Given several 2D proposals, we use some basic transformations to initialize the related 3D bounding boxes. Following the settings in [11], each 3D bounding box is parametrized into one seven-entry vector . is the centroid under camera coordinate system, and is the 3D dimension. The parameter is the angle between the principal axis and its orientation vector under the tilt coordinate system, in which the point clouds are aligned with gravity direction. Hence this rotation is only around the gravity direction.
For initialization, the median of depth value in each individual region is used as the initialization of axis, noted as , then the and can be calculated as follow:
| (5) |
where is the focal length of RGB camera, is the principal point, is the center coordinate of 2D box proposal. The 3D size is set as the class-wise average dimension, which is inspired by the familiar size in human 3D perception [60, 61, 11]. The angle is set to by default.
With the seven-entry targets prediction between initialized vector and targeted vector, i.e. , the 3D regeression loss can be calculated as follow:
| (6) |
where is the ground-truth class index, are the ground truth regression offsets, and are the predicted regression targets.
V Experiments on Case 1: RGB-T Object Detection
In this section, we first conduct several experiments on the challenging KAIST [4] and CVC-14 [5] RGB-T pedestrian datasets. We evaluate all methods on the “reasonable” setup in which pedestrians are not or partially occluded and the heights are larger than 55 pixels. Then, to verify the generalization of our method on object detection, we collect a drone-based RGB-T dataset which includes 4 categories of objects: car, truck, bus, cyclist.
V-A Dataset
KAIST KAIST multispectral pedestrian dataset [4] includes color-thermal frame pairs with annotations. To cover diverse illumination conditions, the dataset is captured in different scenes, through day and night. For the testing, we use the test set containing image pairs sampled from the video with -frame skips.
CVC-14 CVC-14 dataset [5] uses both visible and FIR cameras to record color-thermal video sequences during day and night time. It contains frames, among which frames are for training and for testing. The two cameras are not in a well-calibrated condition. In consequence, this dataset suffers more from the position shift problem, as shown in Figure 3(b). This problem makes it difficult for state-of-the-art multi-modal detectors to apply to the CVC-14 dataset [45, 42, 62, 40, 63].
| Method | ||||||||||||
| Halfway Fusion [43] | 25.51 | 35.72 | 8.14 | 35.19 | 8.68 | 34.07 | 7.95 | 34.59 | 8.87 | |||
| Fusion RPN [44] | 21.43 | 31.57 | 8.34 | 30.42 | 9.97 | 29.96 | 7.02 | 33.14 | 9.85 | |||
| Adapted Halfway Fusion | 15.59 | 25.02 | 8.29 | 25.85 | 10.26 | 22.85 | 7.53 | 26.37 | 10.14 | |||
| CIAN [40] | 14.68 | 24.50 | 8.51 | 22.97 | 10.70 | 20.01 | 6.86 | 23.03 | 10.29 | |||
| MSDS-RCNN [64] | 12.51 | 22.19 | 8.57 | 22.32 | 10.93 | 20.10 | 6.93 | 23.36 | 10.01 | |||
| AR-CNN | RFA | RoIJ | CAF | |||||||||
| 12.94 | 22.27 | 8.21 | 14.76 | 8.92 | 19.34 | 6.85 | 15.62 | 6.24 | ||||
| 10.90 | 12.20 | 2.92 | 11.85 | 2.08 | 16.87 | 2.01 | 11.07 | 1.96 | ||||
| 9.87 | 11.74 | 1.29 | 11.01 | 1.50 | 15.92 | 1.51 | 10.65 | 1.12 | ||||
| 8.26 | 9.41 | 0.98 | 9.52 | 1.09 | 9.53 | 1.02 | 9.46 | 0.90 | ||||
| ASC | 8.01 | 9.17 | 0.93 | 8.92 | 0.95 | 9.66 | 1.05 | 8.99 | 0.90 | |||
Drone-based Dataset The drone-based dataset is collected from day to night using a DJI MATRICE 300 RTK drone with pre-calibrated RGB-T cameras, covering different scenes such as city, suburbs, and countryside. It contains pairs of all-day images with pairs of dense annotations for 4 object categories: car, truck, bus, cyclist. Though the RGB-T cameras are pre-calibrated, there is still the position shift problem due to different physical properties of cameras and external disturbance in operation.
V-B Implementation Details
We use ImageNet [65] pre-trained VGG-16 [66] as the backbone network. By default, the and in RoI jitter is set to , which can be adjusted to tackle a wider or narrower position shift. We horizontally flip all the images for data augmentation. We set the initial learning rate to for 2 epochs and for 1 more epoch. For the drone-based dataset, we use an initial learning rate for 9 epochs and decay it by 0.1 for another 3 epochs.
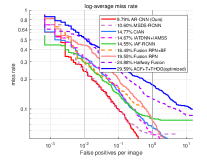
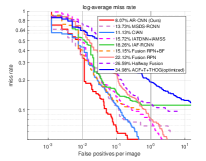
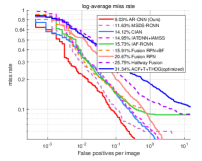
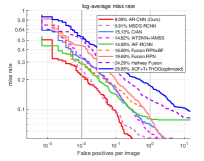
We utilize the log-average miss rate (MR) to measure the detection performance, lower score indicates better performance. We plot the miss rate averaged against the false positives per image (FPPI) over the log-space range of . For the test set, we use the widely adopted improved annotation, which is proposed by Liu et al.[43]. Besides, based on our KAIST-Paired annotation, we use the MRC and MRT to denote the MR for color and thermal modality, respectively. For the drone-based dataset, we use mean Average Precision (mAP) to evaluate the performance of detectors.
V-C Comparison Experiments
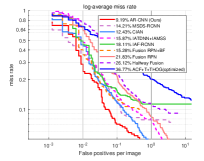
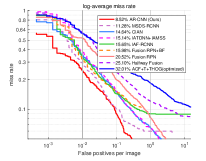
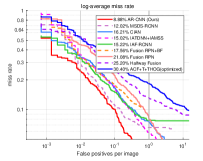
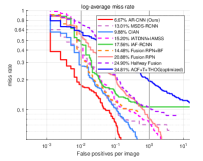
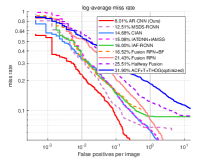
KAIST The proposed AR-CNN is evaluated and compared to other available competitors [4, 43, 44, 42, 62, 40]. As shown in Figure 10, our method achieves , , and MR on the reasonable day, night, and all-day subset respectively, achieving the state-of-the-art performance. Besides, in consideration of the position shift problem, the methods are also evaluated with the KAIST-Paired annotation, i.e. MRC and MRT. As shown in Figure 10, the proposed method has significant advantages, i.e. v.s. MRC and v.s. MRT, demonstrating the superiority of our method.
CVC-14 Our experiments on the CVC-14 dataset are following the protocol in [58]. As shown in Table I, compared to other competitors, the proposed method achieves the best performance. The greater advantage on the night subset ( v.s. MR) validates the contribution of thermal modality, and shows that the detection accuracy can be significantly improved by appropriately handling the position shift problem.
Drone-based dataset As shown in Table II, compared to the available competitors, our approach achieves the best mAP, which demonstrates the generalization ability from pedestrian detection to the wider object detection.
| Method | ||||||||||||
| Halfway Fusion [43] | 25.10 | 34.20 | 7.98 | 34.80 | 7.87 | 32.79 | 7.36 | 33.85 | 8.16 | |||
| Fusion RPN [44] | 20.52 | 30.22 | 9.07 | 29.15 | 9.23 | 25.12 | 6.95 | 29.97 | 9.80 | |||
| Adapted Halfway Fusion | 15.06 | 24.39 | 8.19 | 25.91 | 11.32 | 21.34 | 7.25 | 26.58 | 11.52 | |||
| CIAN [40] | 14.64 | 23.86 | 8.74 | 24.87 | 11.08 | 19.16 | 6.22 | 25.20 | 10.46 | |||
| MSDS-RCNN [64] | 11.28 | 20.06 | 7.95 | 20.81 | 9.54 | 16.61 | 6.36 | 21.73 | 10.14 | |||
| Ours [23] | 8.86 | 12.51 | 1.60 | 11.52 | 2.07 | 11.27 | 1.41 | 11.83 | 2.22 | |||
| ASC | 8.52 | 11.79 | 1.28 | 10.58 | 1.90 | 11.31 | 1.47 | 11.03 | 2.16 | |||
V-D Robustness to Position Shift
Most multi-modal systems suffer from the position shift problem, but degrees of the shift are varying with different devices and settings. To clearly set the experiments, we introduce the empirical upper bound of position shift for the weak aligned image pair.
Since the pedestrian detection and object detection tasks use different evaluation metric, i.e. log average miss rate (MR, lower is better) and mean average precision (mAP, higher is better), we respectively define the performance degradation rate as follow:
| (7) |
| (8) |
In this paper, we set the shift of performance degradation ( ) as the weak aligned bound. For instance, if shifting and pixels along the x-axis leads to performance degradation, then the two upper bounds and on this direction are and . In experiments, we calculate this bound based on the Halfway Fusion [43] model.
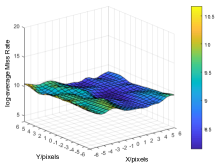
First, the thermal modality is set as the reference since it usually provides consistent images throughout the day. We use MRT to evaluate the detector. Following the settings in Section III-B, the visual results in a surface plot are depicted in Figure 5(b). As illustrated in Figure 5, compared to the baseline method, the proposed detector significantly enhances the robustness to position shift, and the performance at the origin is also improved. Besides, we design four metrics to quantitatively evaluate the robustness, i.e. , , , , where the - indicate the shift directions on the image plane. We have shift modes for each shift direction, which are selected between the origin and weakly aligned bound via equally spacing and rounding. Table III shows the mean () and standard deviation () of those results, our method achieves the best and smallest on four metrics, demonstrating the robustness to diverse position shift conditions.
Experiments on the color reference. Then, we fix the color image as the reference modality. Table IV shows that the proposed method still achieves the best performance and smallest standard deviation, further validating the effectiveness of the AR-CNN. Additionally, compared to the thermal reference, the color reference configuration performs at a lower level in experiments. This validates our intuition: the modality with stable imagery is more suitable to serve as the reference one.
| and | Day | Night | All-day |
|---|---|---|---|
| 0.01 | 9.97 | 8.13 | 9.29 |
| 0.02 | 9.90 | 8.01 | 9.10 |
| 0.05 | 9.79 | 8.07 | 9.03 |
| 0.1 | 9.96 | 8.17 | 9.21 |
| 0.2 | 10.07 | 8.22 | 9.36 |
V-E Ablation Study
To analyse our model in more detail, we conduct ablation studies on the KAIST dataset.
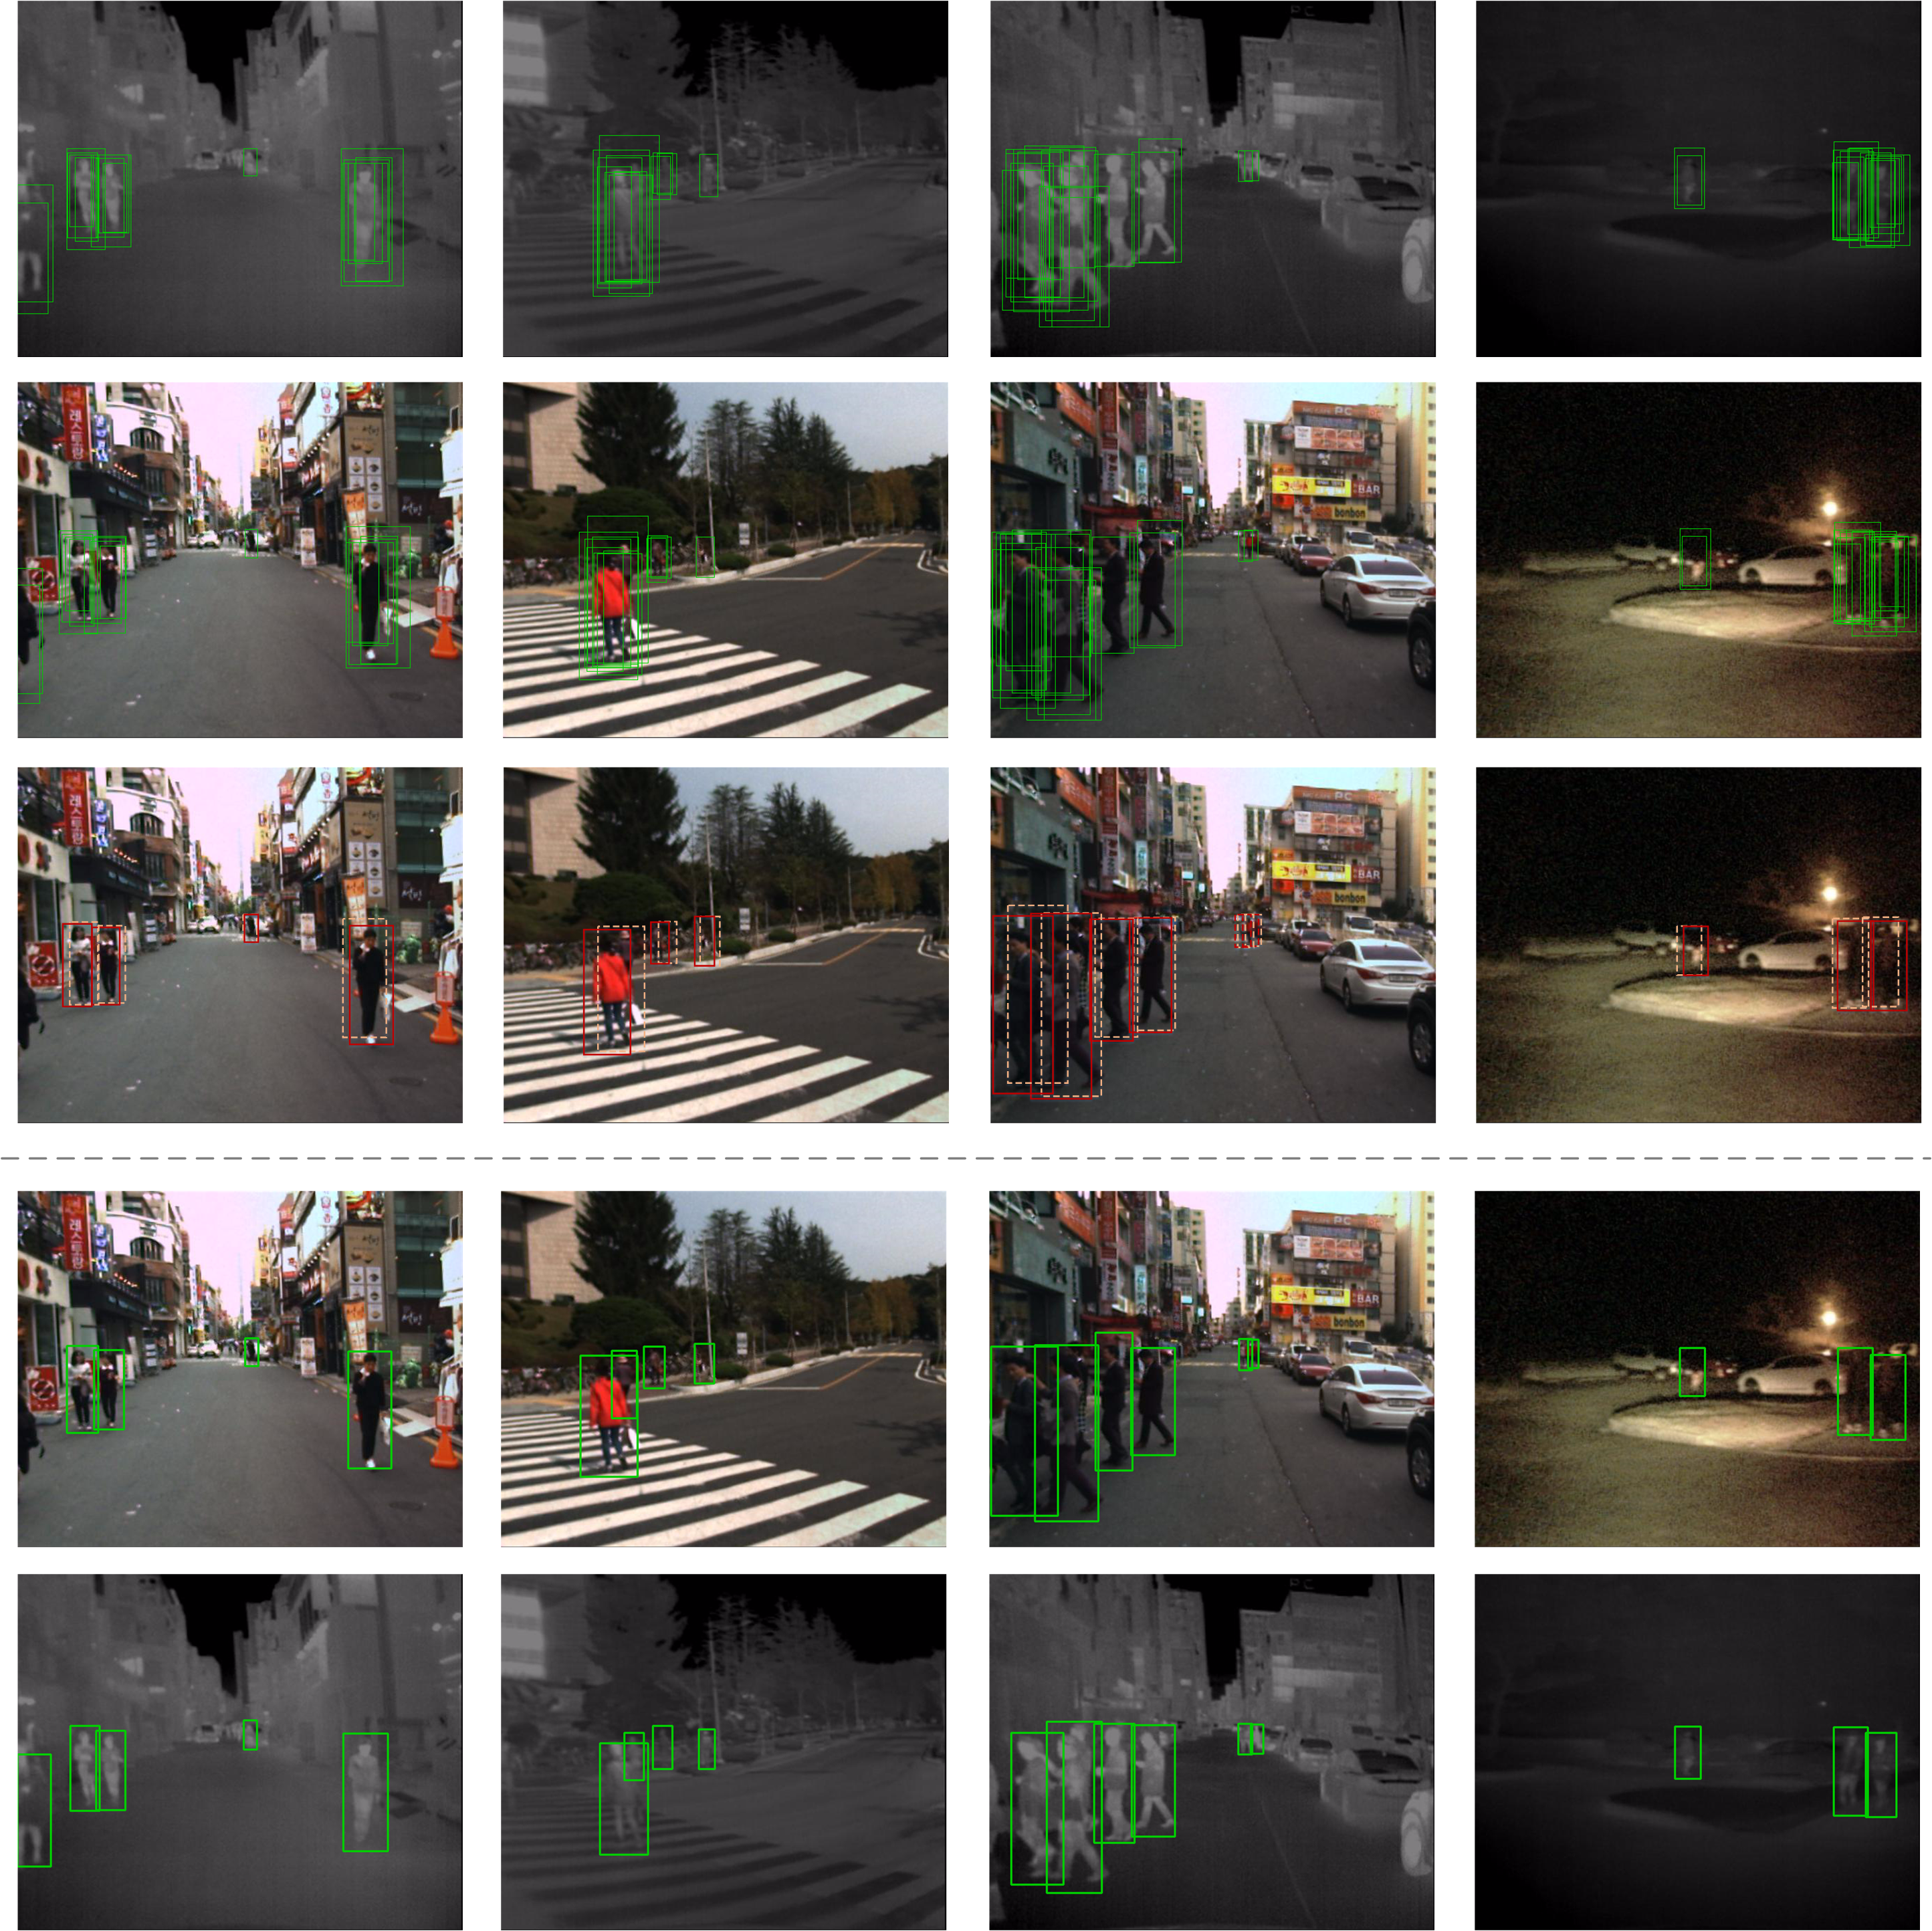
Region Feature Alignment Table III shows detection results with and without the RFA module. It can be observed that the miss rate and the under various position shift conditions are remarkably reduced by the RFA module. Specifically, for , the RFA reduces the by a significant (i.e. from to ). For other three metrics, consistent reductions are also observed. Moreover, some visualizations of proposals and detection results are shown in Figure 11. For pedestrians with the position shift problem, proposals of the sensed (color) modality are adjusted to an aligned position. This phenomenon demonstrates that the RFA module can predict the region-wise position shift of two modalities and adaptively adjust the sensed proposals, thus enabling the modality-aligned feature fusion process for better classification and localization.
RoI Jitter Strategy Then we demonstrate the contribution of the RoI jitter. Table III shows that the strategy further improves the detector’s robustness. Specifically, for , the is reduced from to , and is decreased from to . Meanwhile, it can be observed that this strategy is more helpful for the than the miss rate at the origin, which demonstrates that the main contribution of this strategy is boosting the robustness to the position shift. Table V further shows the detection results with varying hyper-parameter and . When and are set to 0.05, we can obtain the best overall score. When varying the hyper-parameter, the proposed method exhibits stable performances which are better than the baseline.
Confidence-Aware Fusion We also compare performances with and without the CAF module to validate the effectiveness of our multi-modal fusion scheme. Table III shows that this module significantly reduces MRT at the origin by , yet slightly suppresses the . This illustrates that the main contribution of the CAF module is improving the detection performance, since it conducts adaptive fusion by paying more attention to reliable features.
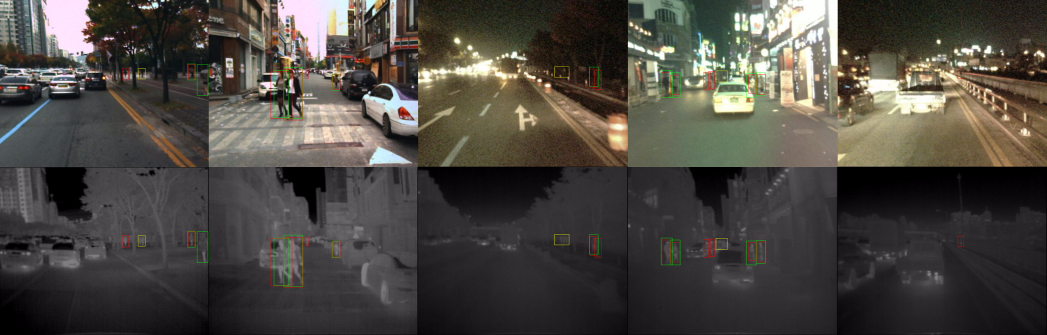
Besides, we also visualize some failed cases in Figure 12 to bring insights for the error analysis and further improvement of the detector. Generally, the far-scale tiny people are easier to be missed since it is difficult to obtain sufficient features after the CNN pooling. We also notice that the detection performance will degrade if the environment is complex, e.g. with a cluttered background and a cluster of objects, due to disturbed or incomplete features. In the future, we would like to work on the occluded person by enhancing the classification and localization heads to further improve the detection performance.
| Method | ||||||||||||
|---|---|---|---|---|---|---|---|---|---|---|---|---|
| Amodal3Det (RGB only) [11] | 30.0 | - | - | - | - | - | - | - | - | |||
| DSS [67] | 36.3 | - | - | - | - | - | - | - | - | |||
| 3D-SSD [48] | 39.7 | - | - | - | - | - | - | - | - | |||
| Rahman et al.[49] | 43.1 | 30.2 | 7.3 | 31.3 | 7.1 | 31.5 | 6.9 | 31.0 | 7.1 | |||
| Amodal3Det [11] | 40.9 | 29.2 | 7.0 | 30.7 | 7.0 | 30.1 | 6.9 | 28.7 | 7.5 | |||
| Halfway Fusion [43] | 41.0 | 29.0 | 6.7 | 30.1 | 7.1 | 29.8 | 7.0 | 29.8 | 7.2 | |||
| AR-CNN (ours) | 41.2 | 33.5 | 3.8 | 34.3 | 4.0 | 34.2 | 3.9 | 34.6 | 4.0 | |||
VI Experiments on Case 2: RGB-D Object Detection
In this section, we conduct experiments of 2D object detection on the SL-RGBD dataset and 3D object detection on the NYUv2 [68] dataset.
VI-A Dataset
NYUv2 The NYU Depth V2 dataset [68] is a popular yet challenging dataset for indoor scene understanding, which contains 1,449 RGB-D pairs with 19 indoor object classes. To achieve 3D object detection, [69] extended the NYUv2 dataset with extra 3D bounding boxes, and refine the depth map by integrating multiple frames of raw video data. In [11], the 3D annotations are further refined by addressing issues about inconsistency and inaccuracy.
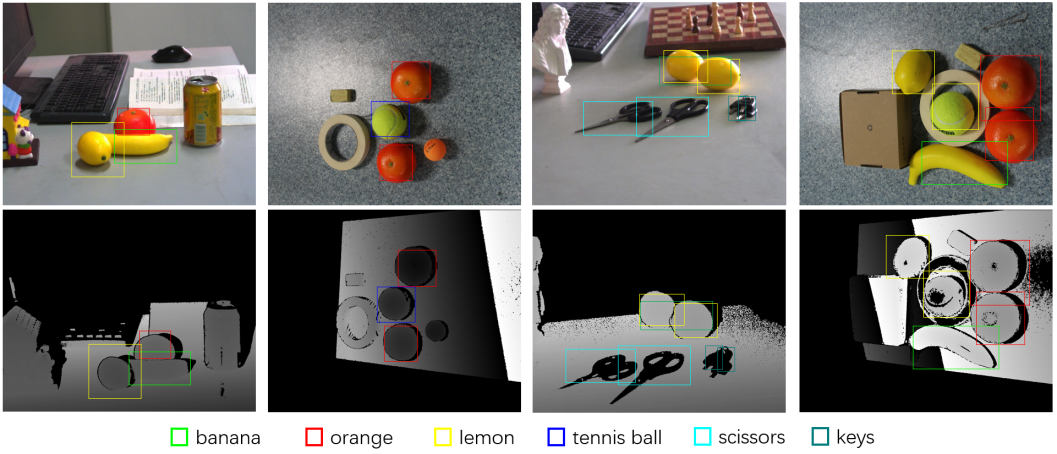
SL-RGBD The SL-RGBD dataset is built for indoor recognition, which contains RGB-D image pairs with object annotations, examples are shown in Figure 13. The object classes are selected from a subset of the YCB benchmark, consisting of lemon, banana, strawberries, orange, scissors, plastic bolt and nut, keys. Various patterns of position shift are included to show the characteristics of weakly aligned RGB-D pairs. The details of the collection system are in Section III-A.
VI-B Implementation Details
The hyperparameter is set the same as in RGB-T pedestrian detection. We use the ImageNet pre-trained model and fine-tune it on the NYUv2 and SL-RGBD datasets, respectively. We use the same training schedule like that in the all-day RGB-T pedestrian detection.
We use mAP (mean Average Precision) to evaluate the performance of detectors. For 2D and 3D object detection, the detected box is treated as true positive if the IoU is greater than 0.5 and 0.25, respectively. Following previous works [11, 48, 49], we use the improved 3D annotation provided by [11] for training and testing.
VI-C Performance and Robutstness
2D Object Detection We conduct the 2D object detection experiments on our SL-RGBD dataset. As shown in Table VII, incorporating the depth modality significantly improves the detection performance (58.7 v.s. 52.9 mAP), and our AR-CNN model achieves the best 66.3 mAP results since the position shift problem is taken into consideration.
| Input | Method | mAP () |
|---|---|---|
| RGB | SSD [20] | 51.6 |
| Faster R-CNN [19] | 52.9 | |
| RGB+D | Halfway Fusion [43] | 58.7 |
| CIAN [40] | 59.3 | |
| AR-CNN (Ours) | 66.3 |
3D Object Detection To further validate the effectiveness of our model, we test the performance and robustness of AR-CNN on the RGB-D based 3D object detection task. Similar to that for 2D pedestrians, we alternatively fix the color and depth image, then manually shift the other. Table VI shows the results on the standard NYUv2 dataset, which uses color images as the reference modality. Our AR-CNN achieves comparative performance and best robustness (33.5 v.s. 30.2 mean performance and 3.8 v.s. 6.7 standard variance in ), which demonstrates the validness and generalization ability of the proposed method.
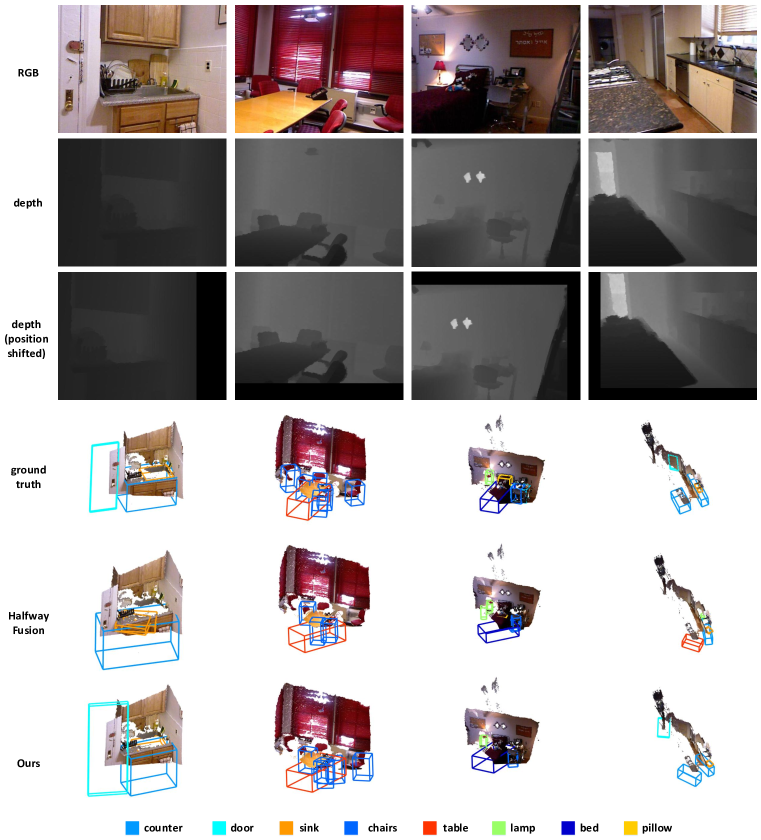
In Figure 14, we use some examples to further show the model’s robustness to position shift problem. When the system suffers from the position shift problem, as shown in the third row, our model achieves better performances than its Halfway Fusion counterpart. For example, the performances of our model and Halfway fusion are 32.1 v.s. 23.3 mAP when the shift pattern is on the image plane.
VII Conclusion
To handle the practical position shift problem in multi-modal object detection, we propose a novel framework to improve the robustness of the detector when using weakly aligned image pairs. First, we design a novel region feature alignment module to predict the shift and aligns the multi-modal features. Second, to further enrich the shift patterns, we propose an RoI-level augmentation strategy named RoI jitter. For the all-day RGB-T pedestrian detection, we present new multi-modal labelling named KAIST-Paired and propose the confidence-aware fusion method to pay attention to the more reliable modality. The proposed method achieves the best performance and robustness on CVC-14 and KAIST datasets. For the RGB-D based 2D and 3D detection, we extend our method by aligning the features of 2D proposals and then conducting a more reliable 3D bounding boxes regression. When compared to the state-of-the-art, the proposed method achieves comparative performance and better robustness on NYUv2 and SL-RGBD datasets. In the real-world scenario, the weakly aligned characteristic usually exists when using the multi-modal system. The proposed method provides a generic solution for multi-modal object detection, especially when it faces the challenges of the position shift problem.
References
- [1] T.-Y. Lin, M. Maire, S. Belongie, J. Hays, P. Perona, D. Ramanan, P. Dollár, and C. L. Zitnick, “Microsoft COCO: Common objects in context,” in Proceedings of the European conference on Computer Vision (ECCV), 2014, pp. 740–755.
- [2] G.-S. Xia, X. Bai, J. Ding, Z. Zhu, S. Belongie, J. Luo, M. Datcu, M. Pelillo, and L. Zhang, “Dota: A large-scale dataset for object detection in aerial images,” in Proceedings of the IEEE Conference on Computer Vision and Pattern Recognition, 2018, pp. 3974–3983.
- [3] Y. Pang, J. Cao, Y. Li, J. Xie, H. Sun, and J. Gong, “Tju-dhd: A diverse high-resolution dataset for object detection,” IEEE Transactions on Image Processing, vol. 30, pp. 207–219, 2020.
- [4] S. Hwang, J. Park, N. Kim, Y. Choi, and I. S. Kweon, “Multispectral pedestrian detection: Benchmark dataset and baseline,” in Proceedings of the IEEE Conference on Computer Vision and Pattern Recognition (CVPR), 2015, pp. 1037–1045.
- [5] A. González, Z. Fang, Y. Socarras, J. Serrat, D. Vázquez, J. Xu, and A. M. López, “Pedestrian detection at day/night time with visible and fir cameras: A comparison,” Sensors, vol. 16, no. 6, p. 820, 2016.
- [6] Y. Yuan, X. Lu, and X. Chen, “Multi-spectral pedestrian detection,” Signal Processing, vol. 110, pp. 94–100, 2015.
- [7] B. F. Klare and A. K. Jain, “Heterogeneous face recognition using kernel prototype similarities,” IEEE transactions on pattern analysis and machine intelligence, vol. 35, no. 6, pp. 1410–1422, 2012.
- [8] M. Shao and Y. Fu, “Cross-modality feature learning through generic hierarchical hyperlingual-words,” IEEE transactions on neural networks and learning systems, vol. 28, no. 2, pp. 451–463, 2016.
- [9] S. Gupta, R. Girshick, P. Arbeláez, and J. Malik, “Learning rich features from rgb-d images for object detection and segmentation,” in Proceedings of the European conference on Computer Vision (ECCV), 2014, pp. 345–360.
- [10] A. Eitel, J. T. Springenberg, L. Spinello, M. Riedmiller, and W. Burgard, “Multimodal deep learning for robust rgb-d object recognition,” in 2015 IEEE/RSJ International Conference on Intelligent Robots and Systems (IROS). IEEE, 2015, pp. 681–687.
- [11] Z. Deng and L. J. Latecki, “Amodal detection of 3d objects: Inferring 3d bounding boxes from 2d ones in rgb-depth images,” in Proceedings of the IEEE Conference on Computer Vision and Pattern Recognition (CVPR), 2017, pp. 5762–5770.
- [12] M. Schwarz, H. Schulz, and S. Behnke, “Rgb-d object recognition and pose estimation based on pre-trained convolutional neural network features,” in 2015 IEEE international conference on robotics and automation (ICRA). IEEE, 2015, pp. 1329–1335.
- [13] C. Choi and H. I. Christensen, “3d pose estimation of daily objects using an rgb-d camera,” in 2012 IEEE/RSJ International Conference on Intelligent Robots and Systems. IEEE, 2012, pp. 3342–3349.
- [14] D. Feng, C. Haase-Schuetz, L. Rosenbaum, H. Hertlein, F. Duffhauss, C. Glaeser, W. Wiesbeck, and K. Dietmayer, “Deep multi-modal object detection and semantic segmentation for autonomous driving: Datasets, methods, and challenges,” arXiv preprint arXiv:1902.07830, 2019.
- [15] S. T. Barnard and W. B. Thompson, “Disparity analysis of images,” IEEE Transactions on Pattern Analysis and Machine Intelligence, no. 4, pp. 333–340, 1980.
- [16] N. Kim, Y. Choi, S. Hwang, K. Park, J. S. Yoon, and I. S. Kweon, “Geometrical calibration of multispectral calibration,” in 2015 12th International Conference on Ubiquitous Robots and Ambient Intelligence (URAI). IEEE, 2015, pp. 384–385.
- [17] W. Treible, P. Saponaro, S. Sorensen, A. Kolagunda, M. O’Neal, B. Phelan, K. Sherbondy, and C. Kambhamettu, “Cats: A color and thermal stereo benchmark,” in Proceedings of the IEEE Conference on Computer Vision and Pattern Recognition (CVPR), 2017, pp. 2961–2969.
- [18] Y. Choi, N. Kim, S. Hwang, K. Park, J. S. Yoon, K. An, and I. S. Kweon, “Kaist multi-spectral day/night data set for autonomous and assisted driving,” IEEE Transactions on Intelligent Transportation Systems, vol. 19, no. 3, pp. 934–948, 2018.
- [19] S. Ren, K. He, R. Girshick, and J. Sun, “Faster R-CNN: Towards real-time object detection with region proposal networks,” in Advances in Neural Information Processing Systems (NeurIPS), 2015, pp. 91–99.
- [20] W. Liu, D. Anguelov, D. Erhan, C. Szegedy, S. Reed, C.-Y. Fu, and A. C. Berg, “SSD:single shot multibox detector,” in Proceedings of the European conference on Computer Vision (ECCV), 2016, pp. 21–37.
- [21] Z.-Q. Zhao, P. Zheng, S.-t. Xu, and X. Wu, “Object detection with deep learning: A review,” IEEE transactions on neural networks and learning systems, vol. 30, no. 11, pp. 3212–3232, 2019.
- [22] Y. Li, Y. Pang, J. Cao, J. Shen, and L. Shao, “Improving single shot object detection with feature scale unmixing,” IEEE Transactions on Image Processing, vol. 30, pp. 2708–2721, 2021.
- [23] L. Zhang, X. Zhu, X. Chen, X. Yang, Z. Lei, and Z. Liu, “Weakly aligned cross-modal learning for multispectral pedestrian detection,” in The IEEE International Conference on Computer Vision (ICCV), 2019, pp. 5127–5137.
- [24] P. Dollár, Z. Tu, P. Perona, and S. Belongie, “Integral channel features,” in British Machine Vision Conference (BMVC), 2009, pp. 91.1–91.11.
- [25] P. Dollár, R. Appel, S. Belongie, and P. Perona, “Fast feature pyramids for object detection,” IEEE Transactions on Pattern Analysis and Machine Intelligence (PAMI), vol. 36, no. 8, pp. 1532–1545, 2014.
- [26] W. Nam, P. Dollár, and J. H. Han, “Local decorrelation for improved pedestrian detection,” in Advances in Neural Information Processing Systems (NeurIPS), 2014, pp. 424–432.
- [27] S. Zhang, R. Benenson, and B. Schiele, “Filtered channel features for pedestrian detection,” in Proceedings of the IEEE Conference on Computer Vision and Pattern Recognition (CVPR), 2015, pp. 1751–1760.
- [28] J. Mao, T. Xiao, Y. Jiang, and Z. Cao, “What can help pedestrian detection?” in Proceedings of the IEEE Conference on Computer Vision and Pattern Recognition (CVPR), 2017, pp. 3127–3136.
- [29] J. Hosang, M. Omran, R. Benenson, and B. Schiele, “Taking a deeper look at pedestrians,” in Proceedings of the IEEE Conference on Computer Vision and Pattern Recognition (CVPR), 2015, pp. 4073–4082.
- [30] X. Wang, T. Xiao, Y. Jiang, S. Shao, J. Sun, and C. Shen, “Repulsion loss: Detecting pedestrians in a crowd,” in Proceedings of the IEEE Conference on Computer Vision and Pattern Recognition (CVPR), 2018, pp. 7774–7783.
- [31] S. Zhang, L. Wen, X. Bian, Z. Lei, and S. Z. Li, “Occlusion-aware r-cnn: detecting pedestrians in a crowd,” in Proceedings of the European Conference on Computer Vision (ECCV), 2018, pp. 637–653.
- [32] J. Xie, Y. Pang, H. Cholakkal, R. Anwer, F. Khan, and L. Shao, “Psc-net: learning part spatial co-occurrence for occluded pedestrian detection,” Science China Information Sciences, vol. 64, no. 2, pp. 1–13, 2021.
- [33] N. Kim, Y. Choi, S. Hwang, and I. S. Kweon, “Multispectral transfer network: Unsupervised depth estimation for all-day vision,” in Proceedings of the AAAI Conference on Artificial Intelligence, vol. 32, no. 1, 2018, pp. 6983–6991.
- [34] Y. Choi, N. Kim, S. Hwang, and I. S. Kweon, “Thermal image enhancement using convolutional neural network,” in 2016 IEEE/RSJ International Conference on Intelligent Robots and Systems (IROS), 2016, pp. 223–230.
- [35] Y. K. Choi, N. I. Kim, K. B. Park, S. M. Hwang, J. S. Yoon, and I. S. Kweon, “All-day visual place recognition: Benchmark dataset and baselines,” in CVPR2015 IEEE Conference on Computer Vision and Pattern Recognition. IEEE Computer Society and the Computer Vision Foundation (CVF), 2015.
- [36] K. Zhou, L. Chen, and X. Cao, “Improving multispectral pedestrian detection by addressing modality imbalance problems,” in Proceedings of the European conference on Computer Vision (ECCV), 2020, pp. 1–19.
- [37] A. Wolpert, M. Teutsch, M. S. Sarfraz, and R. Stiefelhagen, “Anchor-free small-scale multispectral pedestrian detection,” in British Machine Vision Conference (BMVC), 2020, pp. 1–14.
- [38] H. Zhang, E. Fromont, S. Lefèvre, and B. Avignon, “Multispectral fusion for object detection with cyclic fuse-and-refine blocks,” in 2020 IEEE International Conference on Image Processing (ICIP). IEEE, 2020, pp. 276–280.
- [39] J. Wagner, V. Fischer, M. Herman, and S. Behnke, “Multispectral pedestrian detection using deep fusion convolutional neural networks,” in 24th European Symposium on Artificial Neural Networks, Computational Intelligence and Machine Learning (ESANN), 2016, pp. 509–514.
- [40] L. Zhang, Z. Liu, S. Zhang, X. Yang, H. Qiao, K. Huang, and A. Hussain, “Cross-modality interactive attention network for multispectral pedestrian detection,” Information Fusion, vol. 50, pp. 20–29, 2019.
- [41] D. Guan, Y. Cao, J. Yang, Y. Cao, and C.-L. Tisse, “Exploiting fusion architectures for multispectral pedestrian detection and segmentation,” Applied Optics, vol. 57, no. 18, pp. D108–D116, 2018.
- [42] C. Li, D. Song, R. Tong, and M. Tang, “Illumination-aware faster r-cnn for robust multispectral pedestrian detection,” Pattern Recognition, vol. 85, pp. 161–171, 2019.
- [43] J. Liu, S. Zhang, S. Wang, and D. N. Metaxas, “Multispectral deep neural networks for pedestrian detection,” in British Machine Vision Conference (BMVC), 2016, pp. 73.1–73.13.
- [44] D. König, M. Adam, C. Jarvers, G. Layher, H. Neumann, and M. Teutsch, “Fully convolutional region proposal networks for multispectral person detection,” in IEEE Conference on Computer Vision and Pattern Recognition Workshops (CVPRW), 2017, pp. 243–250.
- [45] D. Xu, W. Ouyang, E. Ricci, X. Wang, and N. Sebe, “Learning cross-modal deep representations for robust pedestrian detection,” in Proceedings of the IEEE Conference on Computer Vision and Pattern Recognition (CVPR), 2017, pp. 5363–5371.
- [46] L. Spinello and K. O. Arras, “People detection in rgb-d data,” in 2011 IEEE/RSJ International Conference on Intelligent Robots and Systems. IEEE, 2011, pp. 3838–3843.
- [47] R. Girshick, J. Donahue, T. Darrell, and J. Malik, “Rich feature hierarchies for accurate object detection and semantic segmentation,” in Proceedings of the IEEE Conference on Computer Vision and Pattern Recognition (CVPR), 2014, pp. 580–587.
- [48] Q. Luo, H. Ma, L. Tang, Y. Wang, and R. Xiong, “3d-ssd: Learning hierarchical features from rgb-d images for amodal 3d object detection,” Neurocomputing, vol. 378, pp. 364–374, 2020.
- [49] M. M. Rahman, Y. Tan, J. Xue, L. Shao, and K. Lu, “3d object detection: Learning 3d bounding boxes from scaled down 2d bounding boxes in rgb-d images,” Information Sciences, vol. 476, pp. 147–158, 2019.
- [50] S. Vidas, R. Lakemond, S. Denman, C. Fookes, S. Sridharan, and T. Wark, “A mask-based approach for the geometric calibration of thermal-infrared cameras,” IEEE Transactions on Instrumentation and Measurement, vol. 61, no. 6, pp. 1625–1635, 2012.
- [51] B. Zitova and J. Flusser, “Image registration methods: a survey,” Image and Vision Computing, vol. 21, no. 11, pp. 977–1000, 2003.
- [52] L. G. Brown, “A survey of image registration techniques,” ACM computing surveys (CSUR), vol. 24, no. 4, pp. 325–376, 1992.
- [53] S. Dawn, V. Saxena, and B. Sharma, “Remote sensing image registration techniques: A survey,” in International Conference on Image and Signal Processing, 2010, pp. 103–112.
- [54] Z. Song, R. Chung, and X.-T. Zhang, “An accurate and robust strip-edge-based structured light means for shiny surface micromeasurement in 3-d,” IEEE Transactions on Industrial Electronics, vol. 60, no. 3, pp. 1023–1032, 2012.
- [55] S. Zhang, R. Benenson, and B. Schiele, “Citypersons: A diverse dataset for pedestrian detection,” in Proceedings of the IEEE Conference on Computer Vision and Pattern Recognition (CVPR), 2017, pp. 3213–3221.
- [56] K. He, G. Gkioxari, P. Dollár, and R. Girshick, “Mask r-cnn,” in Proceedings of the IEEE International Conference on Computer Vision (ICCV), 2017, pp. 2980–2988.
- [57] R. Girshick, “Fast R-CNN,” in Proceedings of the IEEE International Conference on Computer Vision (ICCV), 2015, pp. 1440–1448.
- [58] K. Park, S. Kim, and K. Sohn, “Unified multi-spectral pedestrian detection based on probabilistic fusion networks,” Pattern Recognition, vol. 80, pp. 143–155, 2018.
- [59] H. Choi, S. Kim, K. Park, and K. Sohn, “Multi-spectral pedestrian detection based on accumulated object proposal with fully convolutional networks,” in 2016 23rd IEEE International Conference on Pattern Recognition (ICPR), 2016, pp. 621–626.
- [60] J. Fredebon, “The role of instructions and familiar size in absolute judgments of size and distance,” Perception & Psychophysics, vol. 51, no. 4, pp. 344–354, 1992.
- [61] A. Kar, S. Tulsiani, J. Carreira, and J. Malik, “Amodal completion and size constancy in natural scenes,” in Proceedings of the IEEE International Conference on Computer Vision, 2015, pp. 127–135.
- [62] D. Guan, Y. Cao, J. Liang, Y. Cao, and M. Y. Yang, “Fusion of multispectral data through illumination-aware deep neural networks for pedestrian detection,” Information Fusion, vol. 50, pp. 148–157, 2019.
- [63] Y. Cao, D. Guan, Y. Wu, J. Yang, Y. Cao, and M. Y. Yang, “Box-level segmentation supervised deep neural networks for accurate and real-time multispectral pedestrian detection,” ISPRS Journal of Photogrammetry and Remote Sensing, vol. 150, pp. 70–79, 2019.
- [64] C. Li, D. Song, R. Tong, and M. Tang, “Multispectral pedestrian detection via simultaneous detection and segmentation,” in British Machine Vision Conference (BMVC), September 2018, pp. 1–12.
- [65] O. Russakovsky, J. Deng, H. Su, J. Krause, S. Satheesh, S. Ma, Z. Huang, A. Karpathy, A. Khosla, M. Bernstein et al., “Imagenet large scale visual recognition challenge,” International Journal of Computer Vision, vol. 115, no. 3, pp. 211–252, 2015.
- [66] K. Simonyan and A. Zisserman, “Very deep convolutional networks for large-scale image recognition,” arXiv preprint arXiv:1409.1556, 2014.
- [67] S. Song and J. Xiao, “Deep sliding shapes for amodal 3d object detection in rgb-d images,” in Proceedings of the IEEE Conference on Computer Vision and Pattern Recognition (CVPR), 2016, pp. 808–816.
- [68] N. Silberman, D. Hoiem, P. Kohli, and R. Fergus, “Indoor segmentation and support inference from rgbd images,” in European Conference on Computer Vision. Springer, 2012, pp. 746–760.
- [69] S. Song, S. P. Lichtenberg, and J. Xiao, “Sun rgb-d: A rgb-d scene understanding benchmark suite,” in Proceedings of the IEEE conference on computer vision and pattern recognition, 2015, pp. 567–576.
Lu Zhang received the B.E. degree in automation from Shandong University, in 2016, and the Ph.D. degree from the Institute of Automation, Chinese Academy of Sciences, in 2021, where she is currently an Assistant Professor. Her research interests include computer vision, pattern recognition, and robotics.
Zhiyong Liu received the B.E. degree in electronic engineering from Tianjin University, Tianjin, China, in 1997, the M.E. degree in control engineering from the Institute of Automation, Chinese Academy of Sciences (CASIA), Beijing, China, in 2000, and the Ph.D. degree in computer science from the Chinese University of Hong Kong, Hong Kong, in 2003. He is a Professor with the Institute of Automation, CASIA, Beijing. His current research interests include machine learning, pattern recognition, computer vision, and bio-informatics.
Xiangyu Zhu received the B.E. degree in Sichuan University (SCU), in 2012, and the Ph.D. degree from the National Laboratory of Pattern Recognition in the Institute of Automation, Chinese Academic of Sciences, in 2017, where he is currently an Associate Professor. His research interests include pattern recognition and computer vision, in particular, 3D morphable model and face analysis.
Zhan Song received the Ph.D. degree in mechanical and automation engineering from the Chinese University of Hong Kong in 2008. He is currently with the Shenzhen Institutes of Advanced Technology (SIAT), Chinese Academy of Sciences (CAS), as a Professor. His current research interests include structured light-based sensing, image processing, 3D face recognition, and human-computer interaction.
Xu Yang received the B.E. degree in electronic engineering from the Ocean University of China, Qingdao, China, in 2009, and the Ph.D. degree from the Institute of Automation, Chinese Academy of Sciences (CASIA), in 2014, where he is currently an Associate Professor. His current research interests include computer vision, graph algorithms, and robotics.
Zhen Lei received the B.S. degree in automation from the University of Science and Technology of China, in 2005, and the Ph.D. degree from the Institute of Automation, Chinese Academy of Sciences, in 2010, where he is currently a Professor. He has published over 100 papers in international journals and conferences. His research interests are in computer vision, pattern recognition, image processing, and face recognition in particular.
Hong Qiao received the B.S. and M.S. degrees in engineering from Xi’an Jiaotong University, Xi’an, China, in 1986 and 1989, respectively, the M.Phil. degree from the University of Strathclyde, Glasgow, U.K. in 1997, and the Ph.D. degree in robotics control from De Montfort University, Leicester, U.K., in 1995. She held teaching and research positions with Universities in the U.K. and Hong Kong, from 1990 to 2004. She is currently a “100-Talents Project” Professor with Institute of Automation, Chinese Academy of Sciences, Beijing, China. Her current research interests include robotic manipulation, robotic vision, bio-inspired intelligent robot, and brain-like intelligence.