Narrowband spikes observed during the 13 June 2012 flare in the 800-2000 MHz range
keywords:
Flares, Dynamics; Radio Bursts, Dynamic Spectrum1 Introduction
S-Introduction
Solar radio spikes are observed from tens of MHz up to GHz ranges (Droege, 1977; Karlický, 1984; Staehli and Magun, 1986; Bouratzis et al., 2016; Melnik et al., 2014; Clarkson et al., 2021). They are characterized by short duration (10 - 1000 ms) which decreases with increasing frequency, narrow bandwidth ( f/f = 0.002 - 0.01) and the brightness temperature up to 1015 K (Benz, 1986; Messmer and Benz, 2000). While Messmer and Benz (2000) studied the spike parameters at two frequency ranges (320-383 MHz and 873-1000 MHz), Nita et al. (2014) presented results for the 1000-1500 MHz range that is the sub-range of the present study (800-2000 MHz). Using the statistical methods they found the minimal and maximal spike bandwidth as (according to their Figure 11): 1 MHz and 100 MHz for 1000 MHz and ( 1 MHz and ( 10 MHz for 1500 MHz. The spikes are of high interest because their understanding can provide detailed information about plasma processes in solar flares on kinetic scales.
Among them, the decimetric-spikes belong to the most interesting because in some cases they are recorded close to the starting frequency of type III bursts and in relation to hard X-ray emissions (Dabrowski and Benz, 2009). As concerns to their spatial localization, such observations are relatively rare. For example, at 327 MHz and 410.5 MHz frequencies of the Nancay Radio Heliograph (Kerdraon and Delouis, 1997), clusters of spikes were observed above the soft and hard X-ray flare sources (Khan and Aurass, 2006). Furthermore, based on spikes observed in the 1 - 1.6 GHz range by Karl G. Jansky Very Large Array (VLA), Luo et al. (2021) proposed that spikes are generated at the termination shock formed above the flare arcade, where a diffuse supra-arcade fan and multitudes of plasma downflows are present. This interpretation is close to the idea that the narrowband dm-spikes are generated by superthermal electrons in the magnetohydrodynamic turbulence in the magnetic reconnection outflows (Karlický, Sobotka, and Jiřička, 1996; Bárta and Karlický, 2001).
On lower frequencies, the LOw Frequency ARray (LOFAR) recorded spikes in the 30 - 70 MHz range that were similar to individual Type IIIb striae observed in the same event (Clarkson et al., 2021). Authors estimated the spike emission region of the order of 108 cm and brightness temperature as high as 1013 K. For these spikes they suggested fundamental plasma emission generated likely by weak/slow electron beams.
Several models of the spikes were suggested. In some of them, the runaway electrons, accelerated in a direct-current electric field, were proposed (Kuijpers, van der Post, and Slottje, 1981; Tajima et al., 1990; Wentzel, 1991). The electron-cyclotron maser (ECM) mechanism, that directly generates electromagnetic waves (spikes), was suggested by Melrose and Dulk (1982), Fleishman and Mel’nikov (1998), Ni et al. (2020) and Melrose (2017). Moreover, Stepanov et al. (1999) and Bárta and Karlický (2001) presented the model, where spike frequencies correspond to those of the upper-hybrid waves, and Willes and Robinson (1996) the model with spike frequencies corresponding to the Bernstein modes.
There is an important additional aspect of the narrowband dm-spikes that is not frequently considered in theoretical models. Namely, seeing them in radio spectra, dm-spikes are in many cases clustered in bands (clouds) of spikes as was for the first time shown by Krucker and Benz (1994). The authors also found that the frequencies of neighboring bands are in the non-integer ratio (1.06 - 1.54). In the paper by Karlický, Benáček, and Rybák (2021) this result was not only confirmed, but very narrow bands of spikes in the 7 November 2013 event enable to successfully fit the band frequencies by the Bernstein modes.
In the model of the Bernstein modes the loss-cone distribution of superthermal electrons together with much denser Maxwellian background plasma is assumed. In this case, dispersion relations for the Bernstein modes can be written as (Zhelezniakov and Zlotnik, 1975; Karlický, Benáček, and Rybák, 2021)
| (1) |
| (2) |
where is the parallel component of the permittivity tensor, is the permittivity of free space, is the electron plasma frequency, is the plasma density of the Maxwellian background plasma, is the the electron cyclotron frequency, is the wave vector parallel and perpendicular to the direction of the magnetic field, respectively, is the wave frequency of the electrostatic wave, is the modified Bessel function of th order, is the dimensionless parameter, is the electron mass, and is the electron charge.
While the Maxwellian background plasma determines the dispersion relation of the Bernstein modes, a generation of these electrostatic waves is owing to the instability caused by electrons with the loss-cone distribution. The Bernstein modes can be unstable if the double plasma resonance condition is fulfilled
| (3) |
where is the relativistic Lorentz factor and is the resonance gyro-harmonic number. Their growth rate for some specific can be calculated as (Zhelezniakov and Zlotnik, 1975)
| (4) |
We note that entirely the same equations are used for generation of the upper-hybrid waves in the double-plasma resonance (DPR) model of solar radio zebras (Zlotnik, 2013). In both these models it is assumed that the Bernstein or upper-hybrid (electrostatic waves) modes are converted to the observed electromagnetic waves by coalescence processes with the low-frequency waves or mutual coalescence of the Bernstein modes. But, there is an essential difference in these models. While in the model of the Bernstein modes the Bernstein modes and escaping electromagnetic waves are produced in one source, in the case of the zebra model with the upper-hybrid wave the zebra-stripes are generated at different locations.
In this paper, after a brief statistical analysis of spikes observed in the 800-2000 MHz range by the Ondřejov radiospectrograph (Jiřička and Karlický, 2008), we present the narrowband spikes, observed during the 13 June 2012 flare. We study these spikes because three different types of spike distributions were detected in the radio spectrum of a single flare: a) spikes distributed in broad band or bands, b) spikes distributed in zebra-like bands, and c) spikes distributed in broad and narrow bands. We also search for their counterparts in intensity variations in localized places of a flare in AIA/SDO images. We compare the spikes in zebra-like bands with a typical zebra in the same frequency range in order to distinguish their generation mechanisms. Finally, we discuss the model of the presented spikes.
2 Observations
In Table \irefTable1 we present 18 spike events (consisting sometimes several groups of spikes) observed in years 2007-2020 by the 800-2000 MHz Ondřejov radiospectrograph with the time and frequency resolution of 0.01 s and 4.7 MHz, respectively (Jiřička and Karlický, 2008). As can be seen here, these events are always associated with flares (one flare classified as B flare, eight classified as C flare, and nine classified as M flare). Most of the events were recorded before the GOES (Geostationary Operational Environmental Satellites) soft X-ray flare maximum (12 BM, see Table \irefTable1), one before and during the maximum (1 BM, M), one before and after the maximum (1 BM, AM), one before and after the maximum, but during bump on the GOES X-ray profile (1 BM, BAM), one after the maximum, but during bump on the GOES X-ray profile (1 BAM), and two events during the pre-flare phase (2 PF). As shown in Table \irefTable1, most of these spike events were associated with the hard X-ray (HXR) emission observed by RHESSI or Fermi GBM instruments (Lin et al., 2002; Meegan et al., 2009). All these facts indicate that spikes are generated during the impulsive phases of solar flares.
| Spike Event | Flares (HXR, GOES) | |||||
| Time interval | Range | HXR | Start | Max | Class | Notes |
| (UT) | (GHz) | (keV) | (UT) | (UT) | ||
| 12–Feb–10 09:40:40–09:41:20 | 0.8–1.1 | 25–50 | 09:38 | 09:42 | B9.6 | BM |
| 16–Feb–11 14:23:00–14:25:40 | 0.8–2.0 | 50–100 | 14:19 | 14:25 | M1.6 | BM,M |
| 18–Feb–11 10:13:30–10:14:30 | 0.8–2.0 | 50–100 | 09:55 | 10:11 | M6.6 | AM |
| 04–Mar–12 10:37:40–10:41:10 | 0.8–1.6 | 50–100 | 10:29 | 10:52 | M2.0 | BM |
| 13–Jun–12 13:02:40–13:30:00 | 0.8–1.8 | 50–100 | 11:29 | 13:17 | M1.2 | BM,AM |
| 14–Jun–12 10:39:30–10:42:30 | 0.8–2.0 | 12–25 | 10:45 | 10:50 | C2.5 | PF |
| 14–Jun–12 11:00:10–11:00:50 | 0.8–2.0 | no data | 11:05 | 11:12 | C5.0 | PF |
| 11–Apr–13 06:56:00–07:02:00 | 0.8–2.0 | 50–100 | 06:55 | 07:16 | M6.5 | BM |
| 07–Nov–13 12:26:00–12:28:30 | 0.8–2.0 | no data | 12:22 | 12:29 | C5.9 | BM |
| 08–May–14 10:02:10–10:04:00 | 0.8–2.0 | 100–300 | 09:59 | 10:07 | M5.2 | BM |
| 09–Jun–14 12:27:10–12:37:00 | 0.8–2.0 | 50–100 | 12:24 | 12:29 | C9.0 | BM,BAM |
| 11–Jun–14 05:41:10–05:42:00 | 0.8–1.6 | 12–25 | 05:30 | 05:34 | M1.8 | BAM |
| 11–Jun–14 07:11:40–07:12:00 | 0.8–2.0 | 25–50 | 07:09 | 07:12 | C2.8 | BM |
| 12–Jun–14 09:33:50–09:36:50 | 0.8–1.3 | 100–300 | 09:23 | 09:37 | M1.8 | BM |
| 12–Jun–14 15:59:30–15:59:50 | 0.8–1.6 | 25–50 | 15:57 | 16:03 | C7.8 | BM |
| 04–Sep–14 13:17:50–13:18:50 | 1.1–1.8 | 12–25 | 13:10 | 13:30 | C6.3 | BM |
| 12–Sep–14 09:31:20–09:32:00 | 1.0–1.4 | 14–25 | 08:24 | 09:55 | C3.2 | BM |
| 22–Aug–15 06:41:40–06:42:50 | 0.8–1.6 | no data | 06:39 | 06:49 | M1.2 | BM |
2.1 The 13 June 2012 spike event
Among these spike events the most interesting examples of spikes were observed during the 13 June 2012 flare. During this flare we registered many groups of spikes and also their different types. According to the GOES X-ray observation this M1.2 flare started at 11:29 UT, maximum at 13:17 UT and ended at 14:31 UT. In H observation it started at 11:36 UT, maximum at 14:41 and ended at 16:23 UT; lasting thus about 5 hours. It occurred at the position S16E18 in the active region NOAA AR 11504 with an importance 1N.
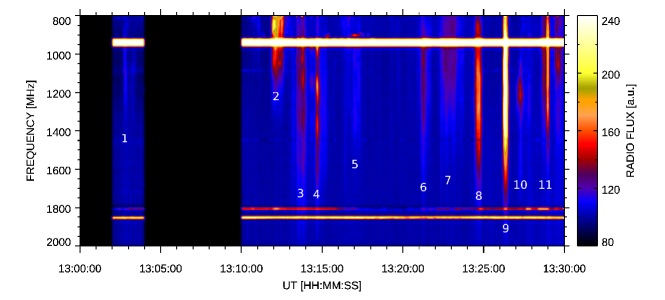
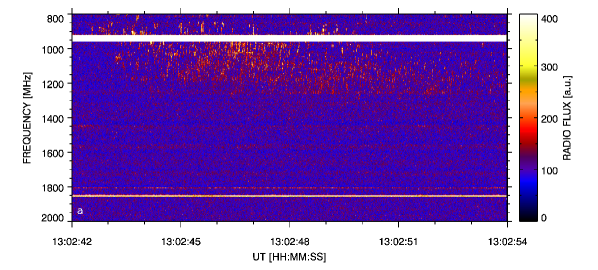
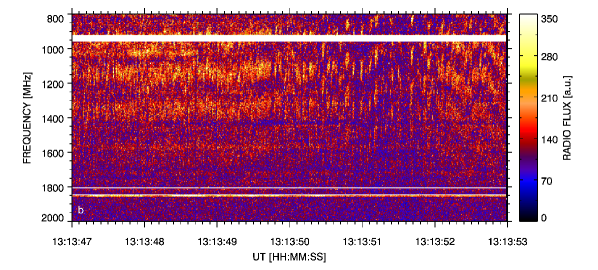
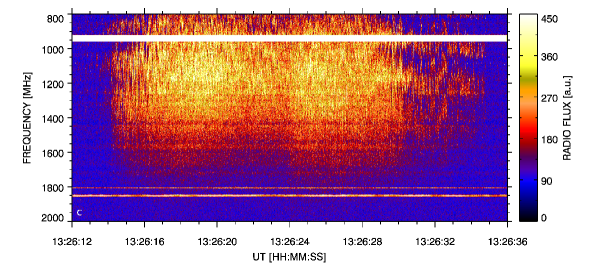
In this flare in the time interval 13:00-13:30 UT we observed eleven groups of spikes, see Figure \ireffig1. This time interval covers only a part of this long flare around its GOES X-ray maximum. Detailed radio spectra of three groups of spikes (group 1, 3 and 9 in Table \irefTable2) are shown in Figure \ireffig2. As can be seen here, spikes at these groups differ. Therefore, we classified them according to their appearance in the radio spectrum as SB (spikes distributed in broad band or bands) (Figure \ireffig2a), SZ (spikes distributed in zebra-like bands) (Figure \ireffig2b), and SBN (spikes distributed in broad and narrow bands) (Figure \ireffig2c). Owing to resemblance of SZ and zebras, in the following we will make a comparison of SZ spikes with a typical zebra observed in the same frequency range (Figure \ireffig6). We will also compare SZ spikes with SBN spikes.
Using this classification we classified all groups of spikes in the 13 June 2012 flare, see Table \irefTable2. In this table also the basic parameters of these spike groups are summarized: type, maximal number of the frequency bands of spikes (MNFB) and characteristic ratios of neighboring bands of spikes (BR). These ratios were computed from the frequencies at flux maxima of spike bands. On lower frequencies in the 200-400 MHz range at 13:08-13:24 UT these spike groups were associated with Type II burst (Callisto-BLEN7M observation).
| No | Time | Range | Type | MNFB | BR |
|---|---|---|---|---|---|
| (UT) | (GHz) | ||||
| 1 | 13:02:42-13:02:58 | 0.8-1.3 | SB | 1 | - |
| 2 | 13:11:48-13:12:40 | 0.8-1.2 | SZ | 2 | 1.21 |
| 3 | 13:13:06-13:14:06 | 0.8-1.8 | SZ | 4 | 1.16, 1.19, 1.21 |
| 4 | 13:14:38-13:14:50 | 0.8-1.6 | SZ | 4 | 1.15, 1.18, 1.23 |
| 5 | 13:16:55-13:17:25 | 0.8-1.5 | SB | 1 | - |
| 6 | 13:21:08-13:21:26 | 0.8-1.6 | SB | 1 | - |
| 7 | 13:22:21-13:23:18 | 0.8-1.8 | SB | 1 | - |
| 8 | 13:24:25-13:24:57 | 0.8-1.8 | SBN | 3 | 1.25, 1.26 |
| 9 | 13:26:12-13:26:36 | 0.8-1.8 | SBN | 3 | 1.22, 1.24 |
| 10 | 13:26:59-13:27:30 | 1.0-1.6 | SZ | 2 | 1.08 |
| 11 | 13:28:55-13:29:05 | 0.8-1.6 | SB | 1 | - |
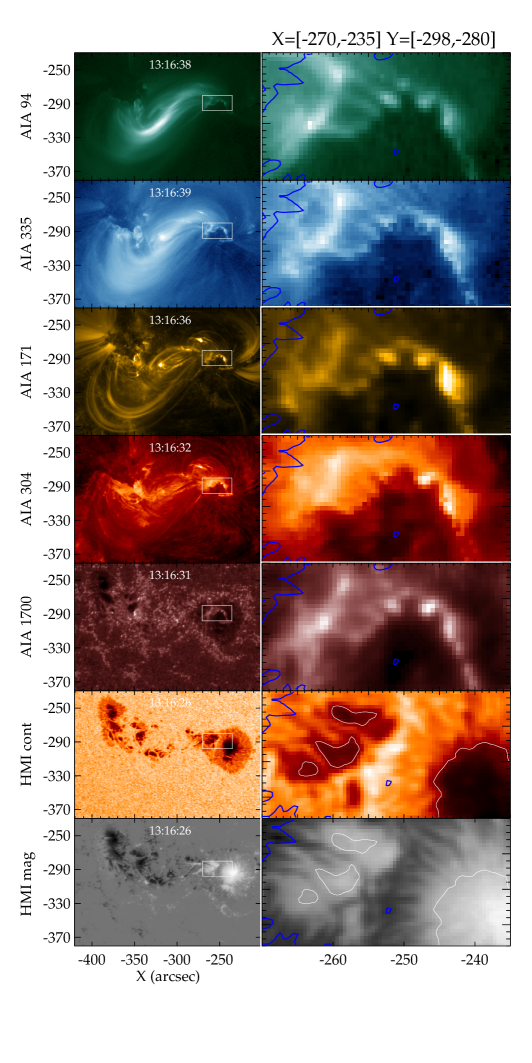
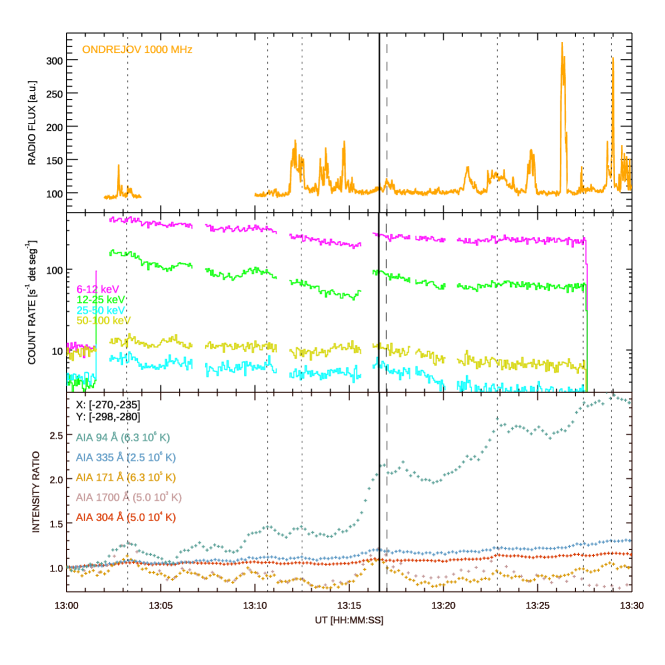
AIA/SDO UV (Lemen et al., 2012), HMI/SDO (Scherrer et al., 2012; Schou et al., 2012) and RHESSI X-ray (Lin et al., 2002) observations associated with these groups of spikes are shown in Figure \ireffig3 and \ireffig4. As seen in Figure \ireffig4 (middle panel), in the time interval of spikes groups, the RHESSI X-rays exhibit a slow decrease in time with some enhancements; see e.g. that just before the GOES flare maximum. They indicate a presence of superthermal electrons with the energies up to 100 keV at these times. Owing to RHESSI technical problems, X-ray source positions could not be constructed. Therefore, using AIA/SDO observations we tried to localize a part of the flare where temporal intensity variations correspond to variations at the 1000 MHz time profile (Figure \ireffig4). Searching the time profiles in AIA channels (1700, 304, 171, 335 and 94 Å and continuum) in small regions (starting from those with 20 20 arcsec) in the whole flare site we found the most interesting correspondence with the 1000 MHz radio profile in the white rectangle with the coordinates X=-270– -235 and Y=-298 – -280 arcsec (Figure \ireffig3 and \ireffig4). It is interesting that this position corresponds to one end of the sigmoidal flare structure where many magnetic field lines of flare loops are concentrated; rooted in the area of the northern part of the active region leading sunspot, see HMI continuum and magnetogram in Figure \ireffig3. In other positions AIA profiles were smoother and without such distinct variations, or with some variations, but only in one AIA channel. As seen in Figure \ireffig4, there are peaks in several AIA channels observed simultaneously that correspond to peaks in the 1000 MHz profile. While peaks in 94 Å indicate a presence of a hot plasma (6.3 106 K), the 1700 Å peaks show a heating of deep atmospheric layers with the temperature 5.0 103 K, probably owing to precipitating superthermal particles. The peaks in radio and AIA are of varying sizes, not all peaks on the 1000 MHz radio profile have corresponding peaks in AIA channels. It indicates a complex relation. In fact, a simple relation cannot be expected because it is commonly assumed that spikes are generated by superthermal electrons with the loss-cone distribution, but peaks in the AIA channels express plasma density enhancements at the AIA channel characteristic temperature.
3 Analysis of spikes, comparison with typical zebra in the same frequency range and modelling of SZ frequencies
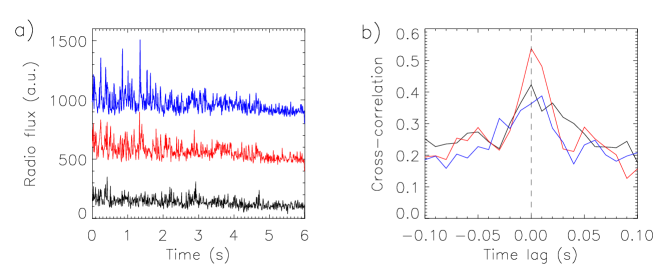
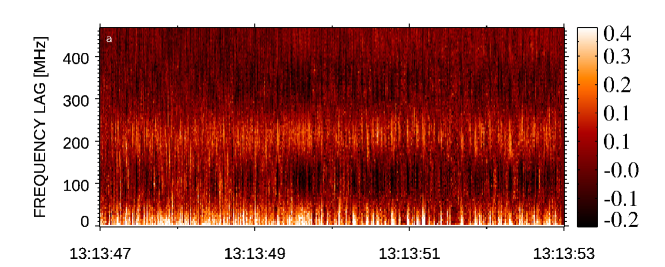
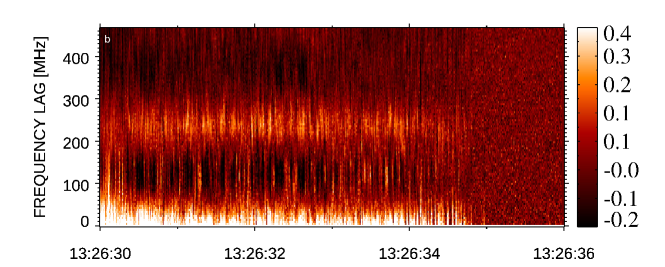
Radio observations show three types of spike distributions: a) in one cloud of spikes (SB), b) in several zebra-like bands (SZ), and c) clouds of spikes with very narrow bands of spikes (SBN). The presented SBN type of spikes is similar to the event from 7 November 2013 that was interpreted as emission in Bernstein modes (Karlický, Benáček, and Rybák, 2021). To confirm this similarity we computed cross-correlation at three spike-band frequencies from the ending part of SBN: 990, 1220, and 1490 MHz (Figure \ireffig5), where the spike bands are the narrowest. We found that the time lag is 0.01 s, in agreement with the 7 November 2013 case. The maximal cross-correlation in Figure \ireffig5 is even higher than that in Figure 3 in the paper by Karlický, Benáček, and Rybák (2021). Thus, we think that the present SBN spikes are of the same origin as the spikes observed at 7 November 2013, i.e., the emission is generated in Bernstein modes. Furthermore, we compare SB and broad part of SBN spikes. Owing to the similar parameters of individual spikes we think that the SB type is as one broad part of SBN type.

3.1 Comparison of zebra-like spikes (SZ) with a zebra in the same frequency range
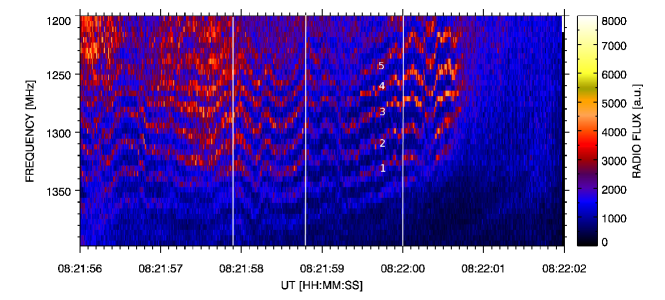
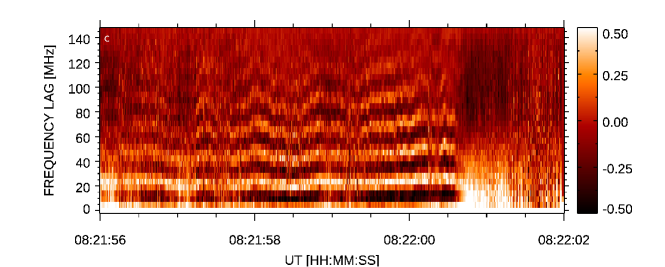
The most interesting type of spikes is the SZ type because it resembles zebras. Therefore, let us compare it with a typical zebra in the same frequency range, e.g., with the zebra observed at 1 August 2010 (Figure \ireffig6 upper panel). First, we use the auto-correlation method. We computed the time evolution of the auto-correlations at different frequencies. We made these computations for SZ shown in Figure \ireffig2b and also for the ending part of SBN in Figure \ireffig2c and the zebra shown in Figure \ireffig6 upper panel. The results are in Figure \ireffig7. The auto-correlations of type SZ and SBN are similar. Their frequency lag is about 220 and 250 MHz, respectively, and this lag is practically constant in time. When we divide the mean SZ band frequencies (960, 1120, 1330 and 1550 MHz) by the lag frequency (220 MHz) the ratios 4.4, 5.1, 6.0 and 7.0 are obtained. Similarly, dividing the mean SBN band frequencies at the ending part of SBN (990, 1220 and 1490 MHz) by the lag frequency (250 MHz) the ratios 4.0, 4.9 and 6.0 are obtained. On the other hand, the auto-correlations of the zebra differ significantly. The frequency lag at first harmonic is about 24 MHz. When the mean zebra frequency ( 1250 MHz) is divided by the lag frequency ( 24 MHz) then this ratio is about 52.
Moreover, the frequency lag in the zebra case is varying in time as seen in higher harmonics of time lags. To understand better what it means, we calculated the frequency intervals between neighboring zebra stripes at three time instants (Figure \ireffig6 bottom panel). As shown here, for the zebra stripes numbered 1 and 2 the frequency interval between them (see the short horizontal lines) changes from 23.5 MHz to 28.2 MHz, and for the zebra stripes numbered 4 and 5 the frequency interval between them changes from 14.1 MHz to 18.8 MHz and to 28.2 MHz. (Note that the frequency resolution of the radio spectrum is 4.7 MHz.) It means that the frequency interval between the neighboring zebra stripes changes and this frequency interval can be different from those between other zebra stripes. This irregular variation of the separation frequency indicates that zebra-stripe sources cannon be generated in Bernstein modes in one source region. In the double-plasma resonance models of zebras this variation is interpreted by waves propagating along the loop where the zebra-stripe sources are located (Karlický and Yasnov, 2021). We also found that the bandwidth of SZ bands is much broader than that of zebra stripes. While in the SZ case it is about 200 MHz in the zebra case it is about 10 MHz.
3.2 Modelling of SZ frequencies by Bernstein modes
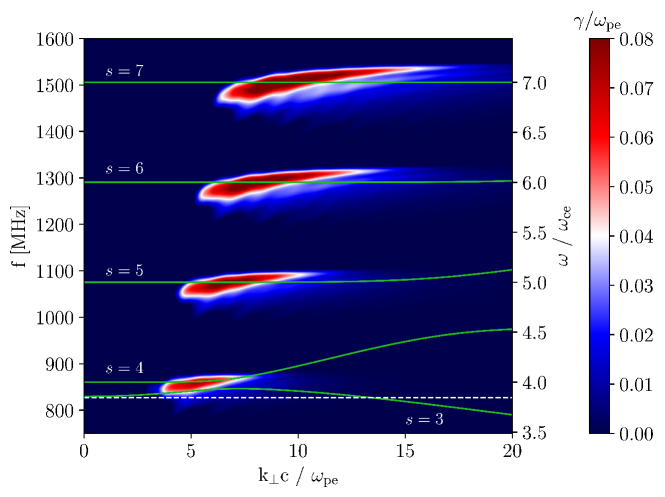
To confirm a similarity between SZ and SBN of the 13 June 2012 flare given by auto-correlations (Figure \ireffig7) and SBN observed in 7 November 2013 with the Bernstein modes, we fitted the mean SZ band frequencies by the same way as in the SBN 7 November 2013 case (Karlický, Benáček, and Rybák, 2021), see also Benáček and Karlický (2019). Firstly, we searched for the time where the bandwidth of SZ spike bands is the narrowest. We found it for 13:13:50.8 UT where we determined the mean spike band frequencies as 860, 1070, 1290 and 1510 MHz (for = 4 - 7). Then using Equations \irefeq1 and \irefeq2 we fitted these band frequencies by calculating the dispersion curves of the Bernstein modes and corresponding growth rates and assuming that Bernstein modes correspond to observed radio frequencies. The best fit is shown in Figure \ireffig8. This fit was obtained with the following parameters: , and MHz, where , is the ratio between the electron plasma densities of the background and hot component plasma, and are the characteristic velocities of hot and Maxwellian background plasmas, is the temperature of the background plasma, and c is the light speed.
Now, considering the frequency separation between spike bands as follow from the above analysis (220 MHz) and the plasma frequency as MHz, the magnetic field and plasma density in the spike source can be estimated as about 79 G and 8.4 109 cm-3, respectively.
A question also arises what is the expected bandwidth of spikes in the model of Bernstein modes. But, it is a very complex problem. Therefore, let us estimate only the Bernstein mode bandwidth for several gyro-harmonic numbers , assuming that this bandwidth is formed only by density variations. We take these variations as (statistical noise). Then, the frequency variation at the present plasma frequency (827 MHz) is about 2.7 MHz. We estimated the linearized bandwidths in region of each branch, where its growth rate is maximal. We found the bandwidth of Bernstein modes with as 0.9, 3 10-3, 5 10-5 and 5 10-5 MHz, respectively. The bandwidths narrow as the permittivity derivation nonlinearly increases with increasing of the gyro-harmonic number. For all , the Bernstein mode bandwidth is smaller than the minimal spike bandwidth found by Nita et al. (2014) ( 1 MHz). However, the problem of the spike bandwidth is much more complex. It is due to not only effects of density and magnetic field variations, but also due to the conversion of Bernstein modes into electromagnetic waves. Moreover, density and magnetic field variations are probably interconnected.
4 Discussion and conclusions
We confirmed that the narrowband dm-spikes are mostly observed during the impulsive flare phases, see Table \irefTable1. As follows from Table \irefTable2 and analysis of the 13 June 2012 spike event, dm-spikes are observed in bands with non-integer ratio in the range 1.08–1.26; in agreement with the result of Krucker and Benz (1994). We note that this result is not frequently considered in theoretical models of dm-spikes.
In the analysis of the 13 June 2012 spike event we tried to search for some relation between the 1000 MHz time profile (with groups of spikes) and variations of intensities in selected flare locations using AIA/SDO observations. The most interesting relation was found for AIA intensities taken from one end of the sigmoidal flare structure where many magnetic field lines of flare loops are concentrated (Figure \ireffig3 and \ireffig4). The peaks in radio and AIA (Figure \ireffig4) are of varying amplitudes, not all peaks on the 1000 MHz radio profile have corresponding peaks in AIA channels. It indicates that their relation is not simple. In reality, a simple relation cannot be expected because spikes are generated by superthermal electrons with a loss-cone distribution while peaks in the AIA channels indicate plasma density enhancements at the AIA channel characteristic temperature.
During one flare from 13 June 2012 we observed spikes with three different types: SB, SZ and SBN spikes. Analyzing SBN spikes in their narrowband part by the cross-correlation method we found that the SBN spikes are similar to those presented in the paper by Karlický, Benáček, and Rybák (2021). Thus, we interpret SBN similarly, i.e., as generated in Bernstein modes. We also found a similarity in autocorrelations of SZ and SBN ending part which speaks in favor of the same generation mechanism for these spikes.
We made a detailed comparison of the 13 June 2012 SZ (zebra-like) spikes with a typical zebra in the same frequency range that was observed at 1 August 2010. We found the following differences. In the SZ case: The separation frequency between neighboring spike bands is about 220 MHz. The autocorrelation in SZ indicates low variability in time. The ratios between four spike-bands and separation frequencies was found as 4.4, 5.1, 6.0 and 7.0. Similarly, in the SBN case these ratios for three spike bands are 4.0, 4.9 and 6.0. On the other hand, in the zebra case: The separation frequency between neighboring zebra stripes is about 24 MHz. The variability of the autocorrelation in time in the zebra case is higher than in SZ case. Furthermore, the ratio between the mean zebra-stripe frequency and separation frequency is about 1250 MHz/24 MHz 52.
Moreover, we found that the separation frequency between neighboring zebra stripes changes by different way for different pairs of the neighboring zebra stripes (Figure \ireffig5). This irregular variation of the separation frequency excludes that the analyzed zebra is generated in one source as is in the model of the Bernstein modes.
The bandwidth of of SZ spike bands (consisting many narrowband spikes) is much broader than that of zebra stripes. For this reason it was impossible to make a similar analysis of time evolution of band (or spike) separation frequencies as in the zebra case shown in Figure \ireffig6 bottom panel.
Nevertheless, at time of the narrowest SZ bands we successfully fitted SZ frequencies by the model of the Bernstein modes. Using the parameters in this model we estimated the mean magnetic field strength and plasma density in the SZ source as about 79 G and 8.4 109 cm-3, respectively. We propose that broad bands of SZ spikes correspond to a region with some interval of the magnetic field and density. In accordance with our previous ideas (Karlický, Sobotka, and Jiřička, 1996; Bárta and Karlický, 2001) we think that this region is in the magnetic reconnection outflow, where the plasma is in turbulent state.
Considering all these facts, we conclude that SZ and SBN spikes observed on 13 June 2012 were generated according to the model of the Bernstein modes. We believe that the parameters, e.g. the ratio between the band (stripe) and separation frequencies, found in the analysis of SZ spikes and the 1 August 2010 zebra, can help in interpretations of other observed SZ spikes and zebras.
In Section 3.2 we tried to estimate the spike bandwidth in the model of Bernstein modes. We considered only the Bernstein mode bandwidth assuming only an effect of the density variations. But this problem is much more complex. It is due to not only effects of density and magnetic field variations, but also due to the conversion of Bernstein modes into electromagnetic waves. Moreover, density and magnetic field variations are probably interconnected. Therefore, the question about the spike bandwidth remains open and further theoretical analysis is necessary.
Similarly as in other solar radio bursts, the radio-wave scattering can play a role also in spikes. The scattering is proportional to (fpe/f)2 (Benz, 1993), where fpe is the plasma frequency and f is the frequency of the radio emission. The scattering depends on the size of the scattering region, sizes and density irregularities. The scattering enhances sizes of the radio sources and causes temporal smoothing of time variations of the burst intensity. Moreover, there is wave ducting of the radio emission (Duncan, 1979) that requires ”fibrous” structures of the plasma density (Kuznetsov et al., 2020). To provide the scattering rate comparable with that of the observations, magnetic tubes would need to have a density contrast of n/n 1 (e.g. Robinson (1983) request a 25-fold increase of the plasma density over dense fibres in the ducting model). Existence of such structures in the solar corona is not supported by EUV observations (e.g. Motorina, Fleishman, and Kontar, 2020). So the ”ducting” model is quantitatively inconsistent with the observations and anisotropic scattering is required.
In the present study without spike source imaging, the scattering can only smooth and prolong duration of spikes. But, the parameters of the scattering region are not known. We found that the plasma frequency for the narrowest spike bands at 13:13:50.8 UT is 827 MHz and Bernstein mode frequencies are 860, 1070, 1290, and 1510 MHz. Because the lowest Bernstein frequency 860 MHz is 33 MHz above the plasma frequency that is why the scattering of spike emission in the model of Bernstein modes is less important than the scattering in the case of the radio emission at the fundamental frequency (f fpe) as e.g., in the type III bursts. For Bernstein modes with increasing the effect of scattering decreases.
Acknowledgments
M. K. acknowledges support from the project RVO-67985815 and GA ČR grants 20-09922J, 20-07908S, 21-16508J and 22-34841S. J.R. support by the Science Grant Agency project VEGA 2/0048/20 (Slovakia), J.B. support by the German Science Foundation (DFG) project BU 777-17-1, and J. K. support by GA ČR grant 19-09489S. Help of the Bilateral Mobility Project SAV-18-01 of the SAS and CAS is acknowledged as well. We also acknowledge the use of the Fermi Solar Flare Observations facility funded by the Fermi GI program. Data supplied courtesy of the SDO/HMI and SDO/AIA consortia.
References
- Bárta and Karlický (2001) Bárta, M., Karlický, M.: 2001, Turbulent plasma model of the narrowband dm-spikes. A&A 379, 1045. DOI. ADS.
- Benáček and Karlický (2019) Benáček, J., Karlický, M.: 2019, Growth Rates of the Electrostatic Waves in Radio Zebra Models. ApJ 881, 21. DOI. ADS.
- Benz (1986) Benz, A.O.: 1986, Millisecond Radio Spikes. Sol. Phys. 104, 99. DOI. ADS.
- Benz (1993) Benz, A.O.: 1993, Plasma astrophysics: Kinetic processes in solar and stellar coronae 184. DOI. ADS.
- Bouratzis et al. (2016) Bouratzis, C., Hillaris, A., Alissandrakis, C.E., Preka-Papadema, P., Moussas, X., Caroubalos, C., Tsitsipis, P., Kontogeorgos, A.: 2016, High resolution observations with Artemis-IV and the NRH. I. Type IV associated narrow-band bursts. A&A 586, A29. DOI. ADS.
- Clarkson et al. (2021) Clarkson, D.L., Kontar, E.P., Gordovskyy, M., Chrysaphi, N., Vilmer, N.: 2021, First Frequency-time-resolved Imaging Spectroscopy Observations of Solar Radio Spikes. ApJ 917, L32. DOI. ADS.
- Dabrowski and Benz (2009) Dabrowski, B.P., Benz, A.O.: 2009, Correlation between decimetric radio emission and hard X-rays in solar flares. A&A 504, 565. DOI. ADS.
- Droege (1977) Droege, F.: 1977, Millisecond fine-structures of solar burst radiation in the range 0.2 - 1.4 GHz. A&A 57, 285. ADS.
- Duncan (1979) Duncan, R.A.: 1979, Wave ducting of solar metre-wave radio emission as an explanation of fundamental/harmonic source coincidence and other anomalies. Sol. Phys. 63, 389. DOI. ADS.
- Fleishman and Mel’nikov (1998) Fleishman, G.D., Mel’nikov, V.F.: 1998, REVIEWS OF TOPICAL PROBLEMS: Millisecond solar radio spikes. Physics Uspekhi 41, 1157. DOI. ADS.
- Jiřička and Karlický (2008) Jiřička, K., Karlický, M.: 2008, Narrowband Pulsating Decimeter Structure Observed by the New Ondřejov Solar Radio Spectrograph. Sol. Phys. 253, 95. DOI. ADS.
- Karlický (1984) Karlický, M.: 1984, Narrowband DM Spikes as Indication of Flare Mass Ejection. Sol. Phys. 92, 329. DOI. ADS.
- Karlický and Yasnov (2021) Karlický, M., Yasnov, L.V.: 2021, Spatial quasi-periodic variations of the plasma density and magnetic field in zebra radio sources. A&A 646, A179. DOI. ADS.
- Karlický, Benáček, and Rybák (2021) Karlický, M., Benáček, J., Rybák, J.: 2021, Narrowband Spikes Observed during the 2013 November 7 Flare. ApJ 910, 108. DOI. ADS.
- Karlický, Sobotka, and Jiřička (1996) Karlický, M., Sobotka, M., Jiřička, K.: 1996, Narrowband dm-Spikes in the 2 GHz Frequency Range and MHD Cascading Waves in Reconnection Outflows. Sol. Phys. 168, 375. DOI. ADS.
- Kerdraon and Delouis (1997) Kerdraon, A., Delouis, J.-M.: 1997, In: Trottet, G. (ed.) The Nançay Radioheliograph 483, 192. DOI. ADS.
- Khan and Aurass (2006) Khan, J.I., Aurass, H.: 2006, Observations of the coronal dynamics associated with solar radio spike burst emission. A&A 457, 319. DOI. ADS.
- Krucker and Benz (1994) Krucker, S., Benz, A.O.: 1994, The frequency ratio of bands of microwave spikes during solar flares. A&A 285, 1038. ADS.
- Kuijpers, van der Post, and Slottje (1981) Kuijpers, J., van der Post, P., Slottje, C.: 1981, Runaway acceleration in a radio flare. A&A 103, 331. ADS.
- Kuznetsov et al. (2020) Kuznetsov, A.A., Chrysaphi, N., Kontar, E.P., Motorina, G.: 2020, Radio Echo in the Turbulent Corona and Simulations of Solar Drift-pair Radio Bursts. ApJ 898, 94. DOI. ADS.
- Lemen et al. (2012) Lemen, J.R., Title, A.M., Akin, D.J., Boerner, P.F., Chou, C., Drake, J.F., Duncan, D.W., Edwards, C.G., Friedlaender, F.M., Heyman, G.F., Hurlburt, N.E., Katz, N.L., Kushner, G.D., Levay, M., Lindgren, R.W., Mathur, D.P., McFeaters, E.L., Mitchell, S., Rehse, R.A., Schrijver, C.J., Springer, L.A., Stern, R.A., Tarbell, T.D., Wuelser, J.-P., Wolfson, C.J., Yanari, C., Bookbinder, J.A., Cheimets, P.N., Caldwell, D., Deluca, E.E., Gates, R., Golub, L., Park, S., Podgorski, W.A., Bush, R.I., Scherrer, P.H., Gummin, M.A., Smith, P., Auker, G., Jerram, P., Pool, P., Soufli, R., Windt, D.L., Beardsley, S., Clapp, M., Lang, J., Waltham, N.: 2012, The Atmospheric Imaging Assembly (AIA) on the Solar Dynamics Observatory (SDO). Sol. Phys. 275, 17. DOI. ADS.
- Lin et al. (2002) Lin, R.P., Dennis, B.R., Hurford, G.J., Smith, D.M., Zehnder, A., Harvey, P.R., Curtis, D.W., Pankow, D., Turin, P., Bester, M., Csillaghy, A., Lewis, M., Madden, N., van Beek, H.F., Appleby, M., Raudorf, T., McTiernan, J., Ramaty, R., Schmahl, E., Schwartz, R., Krucker, S., Abiad, R., Quinn, T., Berg, P., Hashii, M., Sterling, R., Jackson, R., Pratt, R., Campbell, R.D., Malone, D., Landis, D., Barrington-Leigh, C.P., Slassi-Sennou, S., Cork, C., Clark, D., Amato, D., Orwig, L., Boyle, R., Banks, I.S., Shirey, K., Tolbert, A.K., Zarro, D., Snow, F., Thomsen, K., Henneck, R., McHedlishvili, A., Ming, P., Fivian, M., Jordan, J., Wanner, R., Crubb, J., Preble, J., Matranga, M., Benz, A., Hudson, H., Canfield, R.C., Holman, G.D., Crannell, C., Kosugi, T., Emslie, A.G., Vilmer, N., Brown, J.C., Johns-Krull, C., Aschwanden, M., Metcalf, T., Conway, A.: 2002, The Reuven Ramaty High-Energy Solar Spectroscopic Imager (RHESSI). Sol. Phys. 210, 3. DOI. ADS.
- Luo et al. (2021) Luo, Y., Chen, B., Yu, S., Bastian, T.S., Krucker, S.: 2021, Radio Spectral Imaging of an M8.4 Eruptive Solar Flare: Possible Evidence of a Termination Shock. ApJ 911, 4. DOI. ADS.
- Meegan et al. (2009) Meegan, C., Lichti, G., Bhat, P.N., Bissaldi, E., Briggs, M.S., Connaughton, V., Diehl, R., Fishman, G., Greiner, J., Hoover, A.S., van der Horst, A.J., von Kienlin, A., Kippen, R.M., Kouveliotou, C., McBreen, S., Paciesas, W.S., Preece, R., Steinle, H., Wallace, M.S., Wilson, R.B., Wilson-Hodge, C.: 2009, The Fermi Gamma-ray Burst Monitor. ApJ 702, 791. DOI. ADS.
- Melnik et al. (2014) Melnik, V.N., Shevchuk, N.V., Konovalenko, A.A., Rucker, H.O., Dorovskyy, V.V., Poedts, S., Lecacheux, A.: 2014, Solar Decameter Spikes. Sol. Phys. 289, 1701. DOI. ADS.
- Melrose (2017) Melrose, D.B.: 2017, Coherent emission mechanisms in astrophysical plasmas. Reviews of Modern Plasma Physics 1, 5. DOI. ADS.
- Melrose and Dulk (1982) Melrose, D.B., Dulk, G.A.: 1982, Electron-cyclotron masers as the source of certain solar and stellar radio bursts. ApJ 259, 844. DOI. ADS.
- Messmer and Benz (2000) Messmer, P., Benz, A.O.: 2000, The Minimum bandwidth of narrowband spikes in solar flare decimetric radio waves. A&A 354, 287. ADS.
- Motorina, Fleishman, and Kontar (2020) Motorina, G.G., Fleishman, G.D., Kontar, E.P.: 2020, Spatiotemporal Energy Partitioning in a Nonthermally Dominated Two-loop Solar Flare. ApJ 890, 75. DOI. ADS.
- Ni et al. (2020) Ni, S., Chen, Y., Li, C., Zhang, Z., Ning, H., Kong, X., Wang, B., Hosseinpour, M.: 2020, Plasma Emission Induced by Electron Cyclotron Maser Instability in Solar Plasmas with a Large Ratio of Plasma Frequency to Gyrofrequency. ApJ 891, L25. DOI. ADS.
- Nita et al. (2014) Nita, G.M., Fleishman, G.D., Gary, D.E., Marin, W., Boone, K.: 2014, Fitting FFT-derived Spectra: Theory, Tool, and Application to Solar Radio Spike Decomposition. ApJ 789, 152. DOI. ADS.
- Robinson (1983) Robinson, R.D.: 1983, Scattering of radio waves in the solar corona. Astronomical Society of Australia, Proceedings (ISSN 0066-9997) 5, 208. DOI. ADS.
- Scherrer et al. (2012) Scherrer, P.H., Schou, J., Bush, R.I., Kosovichev, A.G., Bogart, R.S., Hoeksema, J.T., Liu, Y., Duvall, T.L., Zhao, J., Title, A.M., Schrijver, C.J., Tarbell, T.D., Tomczyk, S.: 2012, The Helioseismic and Magnetic Imager (HMI) Investigation for the Solar Dynamics Observatory (SDO). Sol. Phys. 275, 207. DOI. ADS.
- Schou et al. (2012) Schou, J., Scherrer, P.H., Bush, R.I., Wachter, R., Couvidat, S., Rabello-Soares, M.C., Bogart, R.S., Hoeksema, J.T., Liu, Y., Duvall, T.L., Akin, D.J., Allard, B.A., Miles, J.W., Rairden, R., Shine, R.A., Tarbell, T.D., Title, A.M., Wolfson, C.J., Elmore, D.F., Norton, A.A., Tomczyk, S.: 2012, Design and Ground Calibration of the Helioseismic and Magnetic Imager (HMI) Instrument on the Solar Dynamics Observatory (SDO). Sol. Phys. 275, 229. DOI. ADS.
- Staehli and Magun (1986) Staehli, M., Magun, A.: 1986, The Microwave Spectrum of Solar Millisecond Spikes. Sol. Phys. 104, 117. DOI. ADS.
- Stepanov et al. (1999) Stepanov, A.V., Kliem, B., Krüger, A., Hildebrand t, J., Garaimov, V.I.: 1999, Second-Harmonic Plasma Radiation of Magnetically Trapped Electrons in Stellar Coronae. ApJ 524, 961. DOI. ADS.
- Tajima et al. (1990) Tajima, T., Benz, A.O., Thaker, M., Leboeuf, J.N.: 1990, Enhanced Radiation Driven by a DC Electric Field. ApJ 353, 666. DOI. ADS.
- Wentzel (1991) Wentzel, D.G.: 1991, Direct Radiation from a Strong DC Electric Field. ApJ 373, 285. DOI. ADS.
- Willes and Robinson (1996) Willes, A.J., Robinson, P.A.: 1996, Electron-Cyclotron Maser Theory for Noninteger Ratio Emission Frequencies in Solar Microwave Spike Bursts. ApJ 467, 465. DOI. ADS.
- Zhelezniakov and Zlotnik (1975) Zhelezniakov, V.V., Zlotnik, E.I.: 1975, Cyclotron Wave Instability in the Corona and Origin of Solar Radio Emission with Fine Structure. I: Bernstein Modes and Plasma Waves in a Hybrid Band. Sol. Phys. 43, 431. DOI. ADS.
- Zlotnik (2013) Zlotnik, E.Y.: 2013, Instability of Electrons Trapped by the Coronal Magnetic Field and Its Evidence in the Fine Structure (Zebra Pattern) of Solar Radio Spectra. Sol. Phys. 284, 579. DOI. ADS.