Discovery of a 500 au Protobinary in the Massive Prestellar Core G11.920.61 MM2
Abstract
We present high-resolution (160 au) Atacama Large Millimeter/submillimeter Array (ALMA) 1.3 mm observations of the high-mass prestellar core candidate G11.920.61 MM2, which reveal that this source is in fact a protobinary system with a projected separation of 505 au. The binary components, MM2E and MM2W, are compact (radii140 au) sources within the partially optically thick dust emission with 2.47–2.94. The 1.3 mm brightness temperatures, T68.4/64.6 K for MM2E/MM2W, imply internal heating and minimum luminosities L24.7 for MM2E and L12.6 for MM2W. The compact sources are connected by a “bridge” of lower-surface-brightness dust emission and lie within more extended emission that may correspond to a circumbinary disk. The circumprotostellar gas mass, estimated from 02-resolution VLA 0.9 cm observations assuming optically thin emission, is 6.80.9 . No line emission is detected towards MM2E and MM2W in our high-resolution 1.3 mm ALMA observations. The only line detected is 13CO J=2-1, in absorption against the 1.3 mm continuum, which likely traces a layer of cooler molecular material surrounding the protostars. We also report the discovery of a highly asymmetric bipolar molecular outflow that appears to be driven by MM2E and/or MM2W in new deep, 05-resolution (1680 au) ALMA 0.82 mm observations. This outflow, traced by low-excitation CH3OH emission, indicates ongoing accretion onto the protobinary system. Overall, the super-Alfvénic models of Mignon-Risse et al. (2021) agree well with the observed properties of the MM2E/MM2W protobinary, suggesting that this system may be forming in an environment with a weak magnetic field.
1 Introduction
Binarity and multiplicity are conspicuous characteristics of main-sequence O and early-B type stars (e.g. Chini et al., 2012; Sana et al., 2014; Gravity Collaboration et al., 2018) that must be explained by models of high-mass star formation. While recent observational advances have revealed binaries in massive young stellar objects (MYSOs; e.g. Beltrán et al., 2016; Beuther et al., 2017; Kraus et al., 2017; Pomohaci et al., 2019; Zapata et al., 2019; Zhang et al., 2019; Tanaka et al., 2020; Koumpia et al., 2021), all of these sources are already infrared-bright and/or evolved enough for the binary components to excite hypercompact (HC) or ultracompact (UC) HII regions. There thus remains a lack of observational evidence for the earliest stages of high-mass binary formation.
These early stages, however, are important for constraining models of high-mass star formation, which differ in their predictions for the formation pathways and mass ratios of young binary or multiple systems. Modelling the collapse of isolated massive prestellar cores including turbulence and radiative and outflow feedback, Rosen & Krumholz (2020) find that companion stars form via turbulent fragmentation at early times and via disk fragmentation at late times (while with a strong magnetic field, no companion stars are formed). Other recent magnetohydronamic (e.g. Mignon-Risse et al., 2021) and hydrodynamic (e.g. Oliva & Kuiper, 2020) models of the collapse of massive cores indicate that binaries form via disk rather than core fragmentation, with disk spiral arms playing an important role. While the binary formed in the early radiation-hydrodynamic simulations of Krumholz et al. (2009) consists of two high-mass stars, many subsequent works (e.g. Rosen et al., 2016, 2019; Rosen & Krumholz, 2020; Meyer et al., 2018) instead predict the formation of hierarchical systems with a single high-mass member. Notable recent exceptions are the super-Alfvénic cases of Mignon-Risse et al. (2021), which form stable binary systems with mass ratios of 1.1-1.6 and separations of a few hundred au.
Observationally, massive prestellar cores such as those adopted as initial conditions in the aforementioned simulations have proven elusive (e.g. Redaelli et al., 2021, and references therein). Among the longest-standing candidates is G11.920.61 MM2 (hereafter MM2): the second-brightest millimeter continuum core in the G11.920.61 protocluster (Cyganowski et al., 2011, 2017). MM2 was identified as a candidate massive prestellar core based on its lack of molecular line emission and other star formation indicators in Submillimeter Array (SMA) and Karl G. Jansky Very Large Array (VLA) observations (Cyganowski et al., 2014). MM2 is only 72 (0.12 pc) from G11.920.61-MM1, a proto-O star with a fragmented Keplerian disk (Ilee et al., 2016, 2018); as in Cyganowski et al. (2014, 2017), here we adopt =3.37 kpc, the maser parallax distance for MM1 (Sato et al., 2014). From the SMA dust continuum, Cyganowski et al. (2014) estimated that MM2’s mass is M30 M⊙ within a radius 1000 au.
In this Letter, we present the serendipitous discovery that MM2 is a candidate (proto)binary in new high-resolution (005, 160 au) 1.3 mm Atacama Large Millimeter/Submillimeter Array (ALMA) observations targeting the MM1 disk. To better understand the properties and evolutionary states of the binary components, we complement these data with VLA 3 and 0.9 cm continuum observations (resolution 02700 au) and lower-resolution (051700 au) ALMA 0.82 and 1.05 mm observations.
| ALMA | VLA | |||||
|---|---|---|---|---|---|---|
| Parameter | Cycle 6 | Cycle 4 | Cycle 2 | Cycles 3-5 | ||
| Wavelength | 1.3 mm | 1.3 mm | 1.05 mm | 0.82 mm | 3 cm | 0.9 cm |
| Observing date(s) (UT) | 2019 Jul 15-16 | 2017 Aug 7-9 | 2015 May 14 | 2018 Jul 10, Aug 16 | 2015 Jun 25 | 2015 Feb 9-10 |
| 2017 Apr 22, 26 | ||||||
| 2016 Apr 9 | ||||||
| Project Code(s) | 2018.1.01010.S | 2016.1.01147.S | 2013.1.00812.S | 2015.1.00827.S, | 15A-232 | 15A-232 |
| 2017.1.01373.S | ||||||
| Configuration(s) | C43-8 | C40-7 | C34-3(4) | C43-1, C43-2, | A | B |
| C40-3, C36-2/3 | ||||||
| Number(s) of antennas | 42 | 45 | 37 | 41-46 | 27 | 26-27 |
| Phase Center (J2000): | ||||||
| R.A. | 18h13m58s.1099 | 18h13m58s.1099 | 18h13m58s.110aaCentral pointing | 18h13m57s.8599 | 18h13m58s.10 | 18h13m58s.10 |
| Dec. | 18∘54′20141 | 18∘54′20141 | 18∘54′22141aaCentral pointing | 18∘54′13958 | 18∘54′167 | 18∘54′167 |
| Primary beam (FWHP) | 26″ | 26″ | mosaic | 17″ | 4′ | 1.3′ |
| Frequency coveragebbALMA 1.05 and 0.82 mm: details only for spw(s) containing lines discussed in this Letter. The narrow 1.05 mm spw targeted H2CO 430,3 at 290.62341 GHz. Band centers: ALMA: rest frequency, VLA: sky frequency. : | ||||||
| Lower band (LSB) | 220.530 GHz | 220.530 GHz | 278.23 GHz | 358.02 GHz | 9 GHz | 31 GHz |
| center(s) | 221.500 GHz | 221.500 GHz | ||||
| Upper band (USB) | 235.780 GHz | 235.780 GHz | 290.62 GHz | 11 GHz | 35 GHz | |
| center(s) | 238.850 GHz | 238.850 GHz | 292.03 GHz | |||
| Bandwidth(s)bbALMA 1.05 and 0.82 mm: details only for spw(s) containing lines discussed in this Letter. The narrow 1.05 mm spw targeted H2CO 430,3 at 290.62341 GHz. Band centers: ALMA: rest frequency, VLA: sky frequency. | 4937.5 MHz | 1468.75 MHz | 21.875 GHz | 1.875 GHz | 22.048 GHz | 42.048 GHz |
| 3937.5 MHz | 117.2 MHz | |||||
| Channel spacing(s)bbALMA 1.05 and 0.82 mm: details only for spw(s) containing lines discussed in this Letter. The narrow 1.05 mm spw targeted H2CO 430,3 at 290.62341 GHz. Band centers: ALMA: rest frequency, VLA: sky frequency. | 0.244 MHz | 0.122 MHz | 0.977 MHz | 0.977 MHz | 1 kHz | 1 kHz |
| 0.244 MHz | 0.122 MHz | |||||
| 0.488 MHz | ||||||
| Gain calibrator(s) | J1832-2039 | J1832-2039 | J1733-1304 | J1911-2006, J1733-1304 | J1832-2039 | J1832-2039 |
| Bandpass calibrator | J1924-2914 | J1924-2914 | J1733-1304 | J1924-2914 | J1924-2914 | J1924-2914 |
| Flux calibrator(s) | J1924-2914 | J1733-1304 | Titan | J1924-2914, Titan | J13313030 | J13313030 |
| Projected baselines (k) | 84–6298 | 14–2787 | 20–528 | 14–583 | 17–1221 | 9–1225 |
| Largest angular scale (LAS)ccEstimated using the analysisUtils task au.estimateMRS from the fifth percentile shortest baseline. | 08 | 14 | 42 | 45 | 34 | 42 |
| Reference(s)ddData previously published in: I18: Ilee et al. (2018), C17: Cyganowski et al. (2017), I16: Ilee et al. (2016) | I18 | C17 | I16,C17 | I16,C17 | ||
| Robust parameter (R) | various (as indicated below) | 0.5 | 0.5 | 0.5 | 0.0 | |
| Synthesized beameeFor the continuum image, except for ALMA 1.05 and 0.82 mm, where it is for the line shown in Figure 3. u,v-ranges were used for the 1.3 mm (25 k) and 3 cm (1300 m43 k) continuum images due to sparse sampling of shorter spacings and to minimize artifacts from the G11.940.62 HII region, respectively. | R=+1: 10481 [82∘] | 534387 [83∘] | 574433 [80∘] | 298168 [0∘] | 270144 [6∘] | |
| (masmas[PA]) | R=0: 5741[+64∘] | |||||
| R=: 4032 [+68∘] | ||||||
| Rms noiseffMeasured near MM2. Median values are quoted for line data (v is the channel width); the rms varies channel-to-channel due to variations in atmospheric opacity and bright and/or poorly imaged extended structures within the field of view (see also Cyganowski et al., 2017). (mJy beam-1): | ||||||
| Continuum | R=+1: 0.034 | 0.0056 | 0.0084 | |||
| R=0: 0.038 | ||||||
| R=: 0.074 | ||||||
| Spectral line | R=0.5: 0.68 | 4.9 (v=1.0 km s-1) | 1.2 | |||
| R=0 (13CO): 0.91 | 2.8-3.5 (v=1.2 km s-1) | |||||
2 Observations
Here we describe the new ALMA data presented in this Letter; for completeness, Table 1 summarizes observational parameters for all datasets used in our analysis. Estimated absolute flux calibration uncertainties are 5% for the ALMA and VLA 3 cm data and 10% for the VLA 0.9 cm data. All measurements were made from images corrected for the primary beam response.
Our Cycle 6 1.3 mm ALMA observations (PI: Ilee) were calibrated using the ALMA science pipeline (CASA 5.6.1-6). The approach described in Brogan et al. (2016); Cyganowski et al. (2017) was used to identify line-free channels and construct a pseudo-continuum dataset; the resulting aggregate continuum bandwidth is 0.72 GHz. The continuum data were iteratively self-calibrated and the solutions applied to the line data. We combined these new C43-8 data with the C40-7 data from Ilee et al. (2018) taken with a nearly identical tuning. Combined continuum images were made using multi-frequency synthesis, two Taylor terms (to account for the spectral index of the emission across the observed bandwidth), multi-scale clean and Briggs weighting with a range of values of the robust (R) parameter (see Table 1). The combined line data were imaged with R=0.5 and a common velocity resolution of 0.7 km s-1. We estimate the absolute positional uncertainty of the combined images as 7.4 mas. As the 1.3 mm ALMA pointings were centered on MM1, MM2 lies at the 83% level of the primary beam in these data.
Our 0.82 mm ALMA data (PI: Cyganowski) were calibrated using the ALMA science pipeline (CASA 5.4.0). We similarly constructed a pseudo-continuum dataset (aggregate continuum bandwidth 0.44 GHz), iteratively self-calibrated the continuum, and applied the solutions to the line data. Here we consider only the CH3OH 4-1,3–30,3 line within the wide spectral window (spw) included in the tuning to provide continuum sensitivity; results for the targeted N2H+(4-3) line will be presented in a forthcoming publication (Zhang et al. in prep.). The CH3OH 4-1,3–30,3 line was imaged with a velocity resolution of 1.0 km s-1.
| Source | Position (J2000)aaProperties from 2D Gaussian fitting (§3.1): “size” is the FWHM deconvolved source size, statistical uncertainties are given in parentheses or indicated by the number of significant figures. | Peak IntensityaaProperties from 2D Gaussian fitting (§3.1): “size” is the FWHM deconvolved source size, statistical uncertainties are given in parentheses or indicated by the number of significant figures. | Integ. fluxaaProperties from 2D Gaussian fitting (§3.1): “size” is the FWHM deconvolved source size, statistical uncertainties are given in parentheses or indicated by the number of significant figures. | TbbbPlanck calculated from and FWHM fitted size. | SizeaaProperties from 2D Gaussian fitting (§3.1): “size” is the FWHM deconvolved source size, statistical uncertainties are given in parentheses or indicated by the number of significant figures. | SizeaaProperties from 2D Gaussian fitting (§3.1): “size” is the FWHM deconvolved source size, statistical uncertainties are given in parentheses or indicated by the number of significant figures. | |
|---|---|---|---|---|---|---|---|
| (h m s) | (∘ ′ ″) | (mJy beam-1) | density (mJy) | (K) | (″″[P.A.(∘)]) | (auau) | |
| ALMA 1.3 mm R=-1.0 | |||||||
| MM2E | 18:13:57.86993 | 18:54:14.0305 | 2.91 (0.07) | 17.9 (0.5) | 68.4 | 0.0850.078 (0.003) [55 (21)] | 286262 (9) |
| MM2W | 18:13:57.85941 | 18:54:14.0445 | 2.42 (0.07) | 10.8 (0.4) | 64.6 | 0.0880.048 (0.004) [111 (3)] | 295163 (12) |
| Diffuse | 18:13:57.8570 | 18:54:14.006 | 0.94 (0.03) | 39 (1) | 22.7 | 0.3050.169 (0.01) [135 (2)] | 1029570 (35) |
| VLA 0.9 cm R=0.0ccPositions fixed to those of MM2E/MM2W from the 1.3 mm fit. For MM2E, the beamsize is used in calculating Tb and reported as an upper limit for the size, as the source could not be deconvolved from the beam. | |||||||
| MM2E | fixed | fixed | 0.139 (0.008) | 0.14 (0.02) | 4.9 | 0.270 | 910485 |
| MM2Wdiffuse | fixed | fixed | 0.094 (0.009) | 0.21 (0.03) | 6.3 | 0.2130.197 (0.09) [83 (61)] | 718664 (300) |
3 Results
3.1 ALMA 1.3 mm Continuum Emission
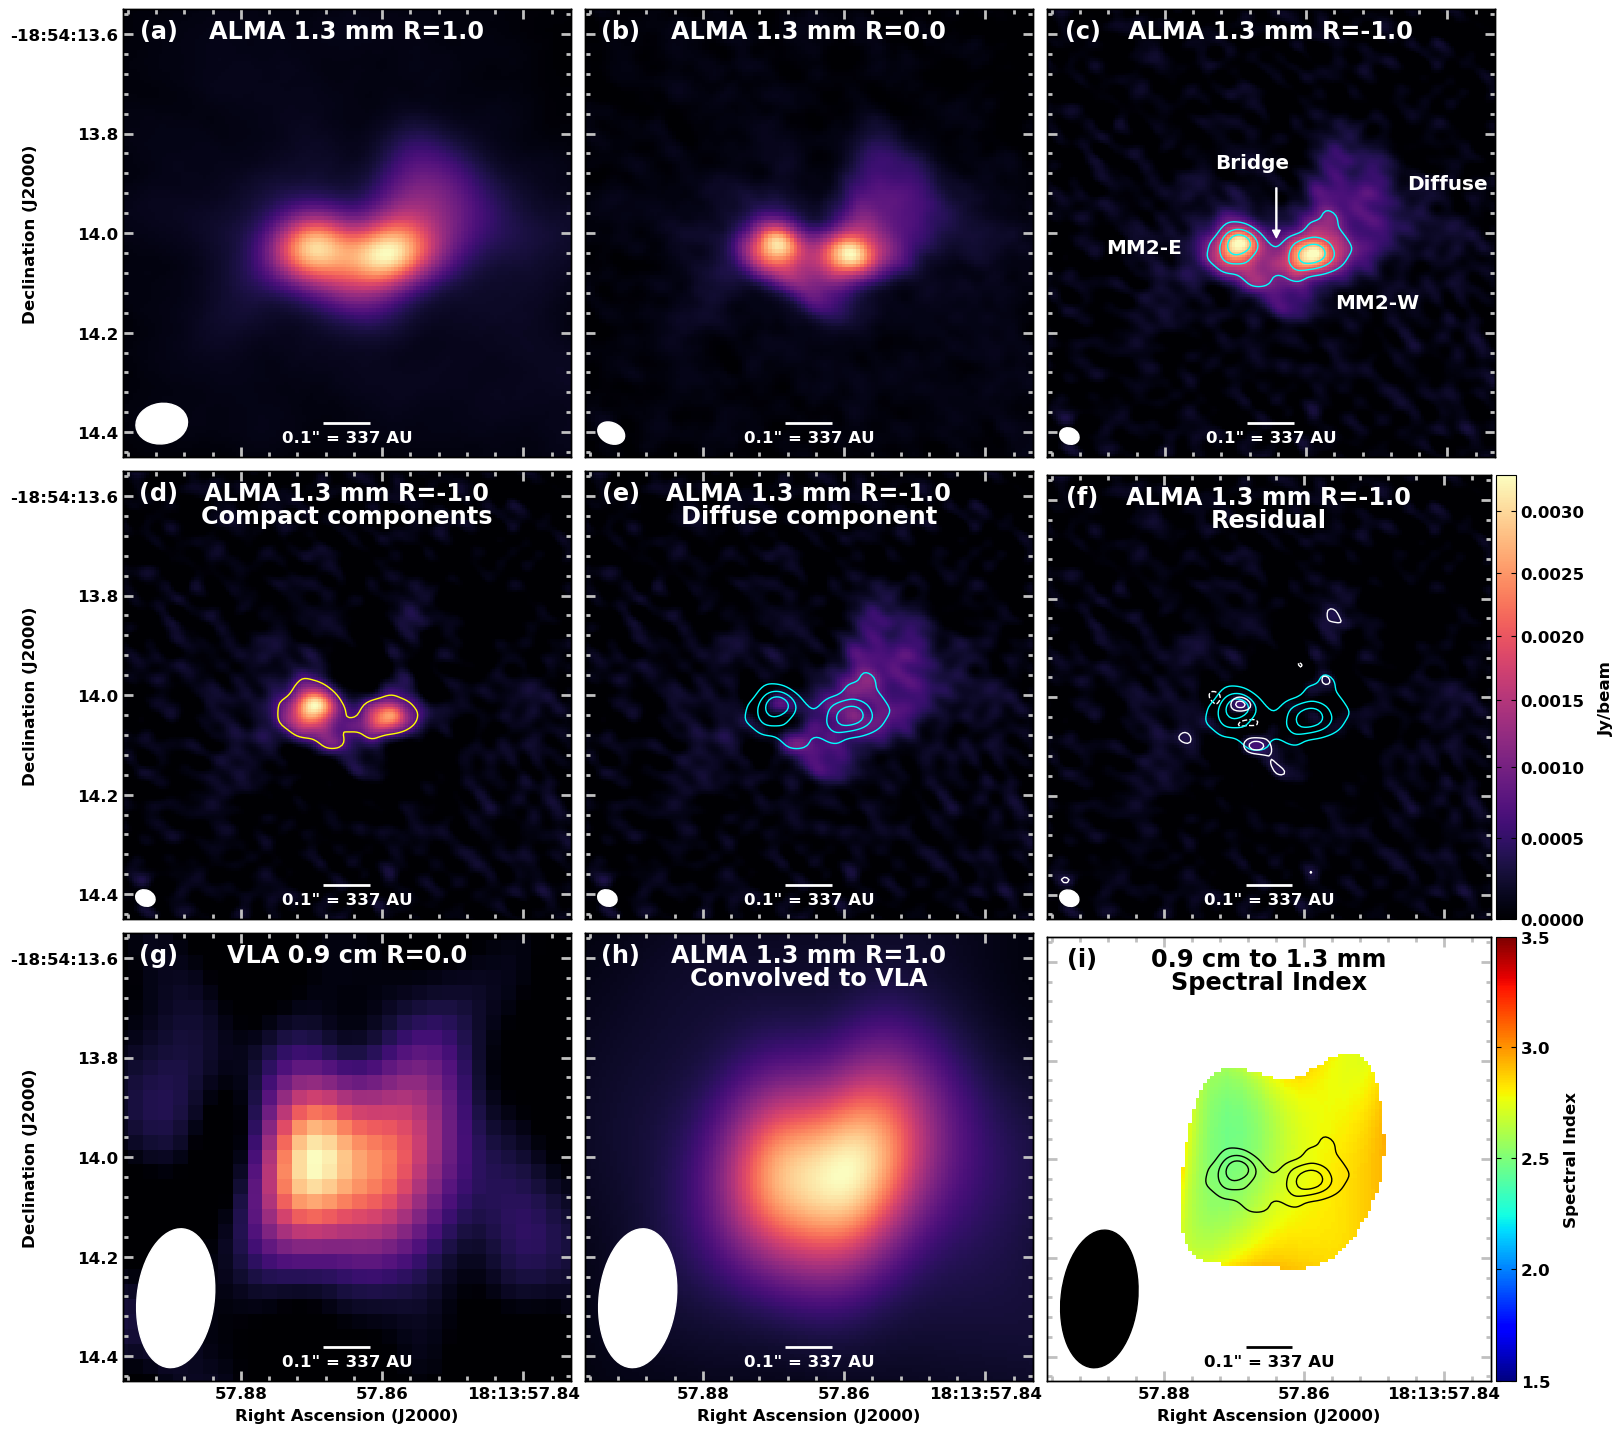
Figure 1 shows our ALMA 1.3 mm continuum images of G11.920.61 MM2. The most striking feature of these high resolution images (beam 160 au; Figure 1b,c) is that the 1.3 mm continuum is clearly resolved into two compact sources, which we designate MM2E and MM2W. These two compact sources are connected by a “bridge” of lower surface brightness emission; diffuse, low-surface-brightness emission also extends N/NW of MM2W (labelled “Diffuse” in Figure 1c) and to the south of the connecting bridge.
To characterize the properties of the compact sources, we fit the R=1.0 1.3 mm continuum image with two-dimensional Gaussians. Three components are required to represent the emission: one each for MM2E and MM2W and a third, more extended component for the diffuse emission. The fitted properties of these components are given in Table 2 and the fitting results are illustrated by Figure 1d-f. Notably, the residual image contains an 8.1 peak coincident with MM2E (001757 au N/NW of its fitted position), indicating that this source is not entirely Gaussian. There is also an 8.5 peak 0083 (280 au) S/SW of MM2E. Both residuals suggest the existence of further substructure, including possible further multiplicity unresolved by our observations.
The projected separation between MM2E and MM2W is 01499505 au. Their connecting “bridge”, detected with 1011 in the compact-component-only image (Figure 1d), has a width of 003100 au, estimated from the 10 contour. The compact sources lie within larger structure(s), as shown by the differences in the R=1,0,1 images (Figure 1a-c) and the need for a diffuse component in fitting the R=1 image. Using CASA’s imstat task, we estimate the integrated flux density () of 4 emission as 107(), 77(3), and 58(5) mJy for the R=1,0,1 images, respectively (uncertainties estimated following Cyganowski et al., 2012). As expected, more extended emission is also detected in the lower-resolution images: the R=1 image recovers filamentary emission extending 15 (5000 au) N/NW of MM2W (beyond the field of Figure 1, see also §3.4) and the E-W extent of 4 emission around MM2E/MM2W is 12, 08, and 04 in the R=1,0,1 images. Even in the R=1 image, the diffuse component accounts for 584% of the fitted integrated fitted flux density (Table 2).
3.2 Spectral Index and VLA cm Continuum Emission
To constrain the spectral indices () of MM2E and MM2W, we combine our new ALMA 1.3 mm images with previously published 0.9 cm and 3 cm VLA data (Table 1). To achieve the best compromise between angular resolution and sensitivity, we reimaged the 0.9 cm data with R=0 (using two Taylor terms and multifrequency synthesis, as described in Ilee et al., 2016). The emission is elongated E-W (Figure 1g, see also Hunter et al., 2015) with a morphology consistent with two sources only marginally resolved. Notably, at 0.9 cm the eastern source is brighter, while at 1.3 mm the western source is brighter (Figure 1a-c,h), although the latter includes contributions from MM2W and the diffuse component discussed in §3.1. To visualize the variation in spectral index across MM2, Figure 1i shows the image calculated from the images in Figure 1g,h: ranges from 2.47–2.94, being lower to the east. MM2 is undetected (4) in the 3 cm VLA image. To estimate 3 cm upper limits for MM2E and MM2W, we measure the peak intensity of the 3 cm emission within the 10% contour of the 0.9 cm emission, yielding 19.1 Jy beam-1 (3.4).
The values and 3 cm nondetections of MM2E and MM2W indicate partially optically thick thermal dust emission. Extrapolating the of MM2E and MM2W from the 1.3 mm R=1.0 image (Table 2) to 3 cm using the shallowest observed =2.47 predicts S=81 and 4.70.9 Jy respectively, consistent with our 3 cm nondetections. As an additional check, we fit the 0.9 cm image with two 2D Gaussian components, fixing their positions to those of MM2E and MM2W from §3.1 and noting that in the lower-resolution 0.9 cm image, the western component represents a combination of the compact source MM2W and diffuse emission. Extrapolating these fitted 0.9 cm flux densities (Table 2) predicts =84 and 118 Jy, again consistent with our 3 cm nondetections.
3.3 Line Absorption from the Compact Core
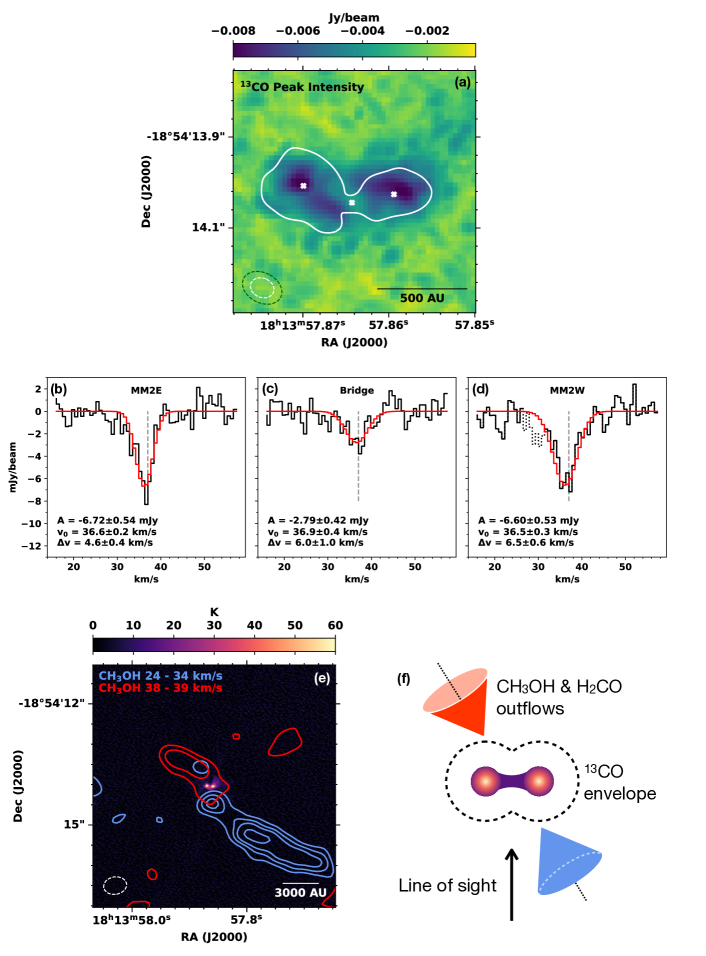
To identify molecular gas potentially associated with the compact millimeter continuum sources, we searched for 4 emission or absorption that spanned 2 adjacent channels in the combined 1.3 mm line cubes at the positions of MM2E and MM2W (Table 2). The only line detected in these high-resolution data (beam008270 au) is 13CO J=2-1 (220.398684 GHz, Eupper=16 K), in absorption against the 1.3 mm continuum.
To study the 13CO absorption, we imaged this line with R=0, a compromise between spatial resolution and signal-to-noise ratio (SNR) that yields a synthesized beamsize of 00690050 (230170 au). Figure 2a, a map of the minimum value of the 13CO spectrum at each pixel, illustrates the spatial morphology of the absorption. Notably, absorption extends across MM2E, MM2W and the continuum “bridge” but the depth of the absorption does not exactly follow the strength of the 1.3 mm continuum. The deepest absorption towards MM2E is 0006 (20 AU) east of the strongest continuum emission, while towards MM2W the deepest absorption is 0008 (27 AU) northwest of the continuum peak. Gaussian fitting of the absorption profiles (Figure 2b-d) yields similar centroid velocities for MM2E and MM2W, while MM2W has a broader linewidth (v and km s-1, respectively). Taken together, these results suggest the 13CO absorption traces gas physically associated with MM2E and MM2W, rather than e.g. a line-of-sight foreground cloud. This is reminiscent of the scenario outlined in Sahu et al. (2019) where an absorbing layer of cooler molecular material surrounds the optically thick protostar and binary member NGC1333-IRAS4A1, which exhibits a millimeter dust (60 K) similar to MM2E and MM2W.
3.4 Outflow Line Emission
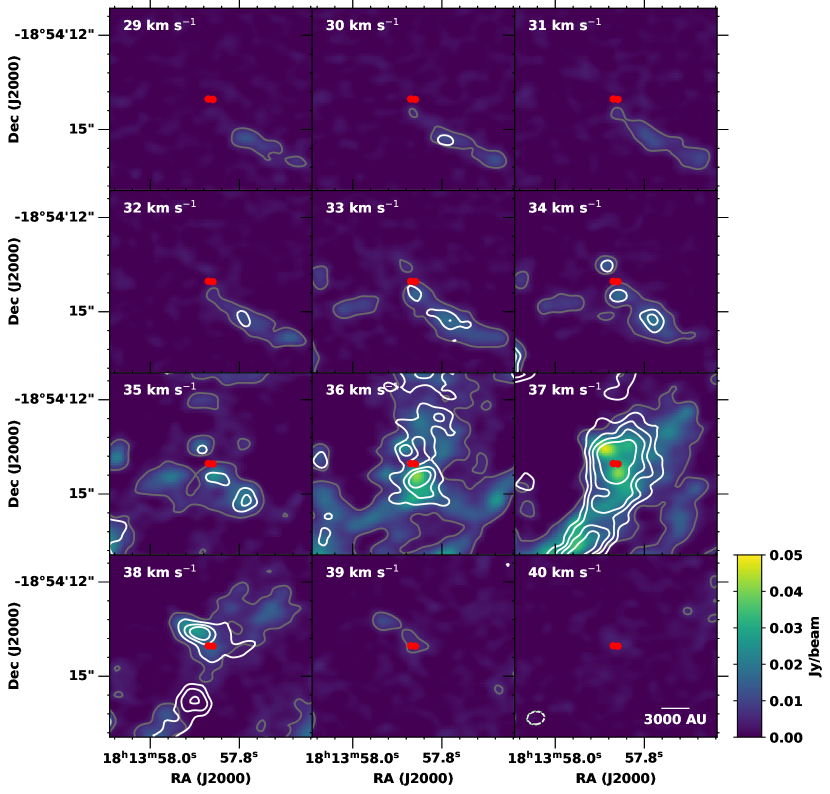
Molecular outflows are clear signposts of protostars that have revealed star formation activity in other candidate high-mass starless cores (e.g. Duarte-Cabral et al., 2013; Tan et al., 2016; Pillai et al., 2019). While 13CO is not detected in emission near MM2 in our high-resolution data, low-excitation lines of CH3OH and H2CO provide alternative tracers of outflows from low- and high-mass protostars (Brogan et al., 2009; Tychoniec et al., 2021; Morii et al., 2021). Fortuitously, the tuning and larger LAS of our deep 0.82 mm ALMA observations (Table 1) provide an opportunity to search for outflow activity from MM2E/MM2W using CH3OH 4-1,3–30,3 (=358.605799 GHz, Eupper=44 K). Figure 3 shows channel maps of this CH3OH line, illustrating that on the larger scales probed by these data (beam 0501685 au) MM2 lies on a filament aligned roughly N-S (see also Cyganowski et al., 2017). At the positions of MM2E and MM2W, the CH3OH emission from the filament peaks at 37 km s-1. Taking this estimate of MM2’s systemic velocity, blueshifted CH3OH emission extends southwest of MM2E/MM2W, while redshifted CH3OH emission lies to the northeast (Figure 2e,3). This kinematic morphology suggests an asymmetric bipolar molecular outflow driven by MM2E and/or MM2W. The projected length and velocity extent are 12,600 au and 13 km s-1 for the blueshifted lobe and 5,100 au and 2 km s-1 for the redshifted lobe (lengths are the average of estimates assuming the driving source is MM2E/MM2W). These values imply dynamical timescales of tdyn4,600 years and 12,100 years for the blue and red lobes. We emphasize, however, that the CH3OH emission is unlikely to trace the highest-velocity gas (see 12CO/H2CO comparison for a low-mass outflow in Cyganowski et al., 2017) so these tdyn estimates should be interpreted with caution.
To check for evidence of this outflow in other lines, we reimaged the five H2CO and CH3OH transitions with Eupper100 K in the 1.05 mm tuning of Cyganowski et al. (2017). Figure 3 shows H2CO 430,3 (=290.62341 GHz, Eupper=35 K), the closest to CH3OH 4-1,3–30,3 in Eupper and line strength and the only 1.05 mm line observed with sufficient spectral resolution to image with v=1 km s-1 (Table 1; the others were imaged with v=1.2 km s-1). The behavior of this H2CO line is representative of the 1.05 mm H2CO and CH3OH transitions, with similar morphology to CH3OH 4-1,3–30,3 in channels near the systemic velocity (Figure 3), but outflow emission detected over a narrower velocity range and at lower SNR due to the lower sensitivity of the data (Table 1). Figure 2f summarizes the proposed morphology of the core/outflow system.
4 Discussion
To explore the nature of MM2E and MM2W, we first consider their observed 1.3 mm continuum brightness temperatures (), which provide strict lower limits for their physical temperatures of 68.4 K and 64.6 K respectively (Table 2). These high temperatures signify internal heating, as external heating (by MM1 and the intermediate or high-mass protostar MM3; Cyganowski et al., 2009, 2011, 2017) could account for dust temperatures of at most 23 K, based on simple estimates (see also Cyganowski et al., 2014). With evidence for both internal heating and a bipolar outflow (§3.4), we interpret MM2E and MM2W as deeply embedded protostars, which leads to the conclusion that MM2 is not starless and emphasizes the importance of high-resolution (sub)millimeter observations for detecting protostars and their outflows in candidate high-mass starless clumps and cores (see also e.g. Duarte-Cabral et al., 2013; Tan et al., 2016; Pillai et al., 2019; Svoboda et al., 2019).
Observed (sub)millimeter can be used to estimate the total luminosities () of deeply embedded protostars in the context of a simple model of blackbody emission from an optically thick dust shell surrounding them (e.g. Brogan et al., 2016; Hunter et al., 2017; Ginsburg et al., 2017), via where r is the radius of the sphere and is the Stefan-Boltzmann constant. Because the observed dust emission is not entirely optically thick toward MM2E and MM2W (§3.2, Figure 1i), the observed will underestimate the dust temperature and will be a lower limit. Using their fitted sizes and Planck (calculated from the integrated flux densities and fitted sizes; Table 2), we estimate L24.7 for MM2E and L12.6 for MM2W. Notably, these limiting values are 1-4 orders of magnitude higher than those estimated for the low-mass members of the NGC6334I protocluster using the same approach (MM5-9, Table 5 of Brogan et al., 2016). Although our limiting luminosities for MM2E/MM2W are 3 orders of magnitude lower than those estimated with this method for W51e2e and for NGC6334I-MM1 in outburst (2.3104 and 4.2104 , respectively; Ginsburg et al., 2017; Hunter et al., 2017), massive protostars are expected to pass through a low-luminosity stage early in their evolution (e.g. Kuiper & Yorke, 2013).
The closest analogue to MM2E and MM2W in the literature is NGC6334I-MM4A, an optically thick dust source, in a massive protocluster, that lacks compact thermal molecular line emission in ALMA observations despite a high dust (975 K; Brogan et al., 2016). NGC6334I-MM4A drives a collimated bipolar outflow detected in dense gas tracers and exhibits faint, variable water maser emission (Brogan et al., 2018). Although previous surveys found no water masers toward MM2 (Hofner & Churchwell, 1996; Breen & Ellingsen, 2011), masers with luminosity similar to those in NGC6334I-MM4A would be only 0.05 Jy at G11.920.61’s distance, and would have been undetected by these surveys, particularly at velocities where the bright MM1 maser limits the image dynamic range. An analogue in a low-mass multiple system is component B of IRAS 16293-2422, a partially optically thick dust source with T180 K, interpreted as a very young protostar (Chandler et al., 2005; Hernández-Gómez et al., 2019). To our knowledge, MM2E/MM2W is the first example of a system of two nearly optically thick millimeter dust sources.
Comparing our results with model predictions (§1), the observed properties of MM2E and MM2W in many respects match the super-Alfvénic cases of Mignon-Risse et al. (2021) remarkably well, suggesting that this protobinary may be forming in an environment with a weak magnetic field. MM2E and MM2W have similar 1.3 mm and (ratio E:W=1.06 and 1.66, respectively), suggesting that the mass ratio of the two protostars is likely comparable to the 1.1-1.6 range of the Mignon-Risse et al. (2021) simulations. The observed separation of MM2E and MM2W (505 au) is similarly consistent with the Mignon-Risse et al. (2021) results (binary separations 350-700 au) and the “bridge” we observe is qualitatively similar to linking structures visible in the simulated column density maps in their Figure 8. Interestingly, linking “bridges” form in simulations of binary formation via both core (e.g. Riaz et al., 2014, for equal-mass low-mass binaries) and disk fragmentation (e.g. Mignon-Risse et al., 2021, in which disk fragmentation is precipitated by the collision of extended spiral arms).
In the Mignon-Risse et al. (2021) simulations, the individual protostars have Keplerian disks with diameters of 200-400 au, which are embedded within a transient disk-like circumbinary structure. With no detected line emission in our high-resolution observations, it is unclear whether MM2E and MM2W exhibit Keplerian rotation. Their fitted sizes (Table 2) are, however, comparable to the simulation’s individual disk diameters, with the more extended millimeter emission potentially tracing a circumbinary disk. The total circumprotostellar gas mass from the sum of the fitted VLA 0.9 cm flux densities is 6.80.9 (considering the fitting uncertainties from Table 2, added in quadrature, and 10% calibration uncertainty) using T66.5 K (the average 1.3 mm Tb for MM2E/MM2W) and, following the approach of Karnath et al. (2020), assuming the 0.9 cm emission is optically thin, a gas:dust mass ratio of 100:1, and 0.128 cm2 g-1.
Notably, this estimate is comparable to the sum of the virial masses calculated from the 13CO linewidths (§3.3): assuming spherical clouds with 1/r density profiles (Carpenter et al., 1990), angular diameters equal to the geometric means of the 1.3 mm fitted sizes (Table 2), and correcting for a mean inclination of the rotation axis to the line of sight (30∘) yields 3.50.8 M⊙ for MM2E and 5.71.0 M⊙ for MM2W for a total of 9.21.2 M⊙. To test the dependence on the assumed angular diameter, we used a similar fitting procedure to obtain source sizes from the R=0 1.3 mm continuum image, which yields a combined virial mass of 9.01.2 M⊙. The combined virial mass of 91 M⊙ minus the gas mass estimate allows for central protostars of current mass 1 M⊙. Depending on their evolutionary track, the (including accretion) of such protostars can reach values of 25 L⊙ (Young & Evans, 2005) to 103 L⊙ (Kuiper & Yorke, 2013), consistent with the lower limits that we derive from the dust of MM2E and MM2W. Considering the luminosity limits, protostellar mass estimates and dust properties derived above together with theoretical expectations, we interpret MM2E and MM2W as a young proto-high-mass-binary system.
The outflow from MM2E/MM2W (§3.4, Figure 2e&3) provides evidence for ongoing accretion onto the growing protobinary system. With ample fuel available within the gas-rich protocluster environment, the protostellar masses (and luminosities) are expected to increase with time. Accretion will also affect the binary separation, which can increase or decrease depending on turbulence, magnetic field strength, and the presence of outflows, with magnetic fields promoting the formation of close high-mass binary systems (e.g. Lund & Bonnell, 2018; Harada et al., 2021; Ramírez-Tannus et al., 2021). Future high-resolution observations of MM2E/MM2W – at shorter wavelengths to better measure the protostellar luminosities, at longer wavelengths to search for line emission in a regime where the dust is optically thin, and in full polarization to measure the magnetic field – will provide a powerful test case for models of high-mass binary formation.
ADS/JAO.ALMA#2016.1.01147.S,
ADS/JAO.ALMA#2017.1.01373.S, and
ADS/JAO.ALMA#2018.1.01010.S. ALMA is a partnership of ESO (representing its member states), NSF (USA) and NINS (Japan), together with NRC (Canada), MOST and ASIAA (Taiwan), and KASI (Republic of Korea), in cooperation with the Republic of Chile. The Joint ALMA Observatory is operated by ESO, AUI/NRAO and NAOJ. C.J.C. acknowledges support from the University of St Andrews Restarting Research Funding Scheme (SARRF), which is funded through the SFC grant reference SFC/AN/08/020. J.D.I. acknowledges support from the UK’s STFC under ST/T000287/1. S.Z. is funded by the China Scholarship Council–University of St Andrews Scholarship (PhD programmes, No. 201806190010). T.J.H. is funded by a Royal Society Dorothy Hodgkin Fellowship. This research made use of NASA’s Astrophysics Data System Bibliographic Services and APLpy, an open-source plotting package for Python (Robitaille & Bressert, 2012).
References
- Beltrán et al. (2016) Beltrán, M. T., Cesaroni, R., Moscadelli, L., et al. 2016, A&A, 593, A49
- Beuther et al. (2017) Beuther, H., Linz, H., Henning, T., Feng, S., & Teague, R. 2017, A&A, 605, A61
- Breen & Ellingsen (2011) Breen, S. L., & Ellingsen, S. P. 2011, MNRAS, 416, 178
- Brogan et al. (2016) Brogan, C. L., Hunter, T. R., Cyganowski, C. J., et al. 2016, ApJ, 832, 187
- Brogan et al. (2009) —. 2009, ApJ, 707, 1
- Brogan et al. (2018) —. 2018, ApJ, 866, 87
- Carpenter et al. (1990) Carpenter, J. M., Snell, R. L., & Schloerb, F. P. 1990, ApJ, 362, 147
- Chandler et al. (2005) Chandler, C. J., Brogan, C. L., Shirley, Y. L., & Loinard, L. 2005, ApJ, 632, 371
- Chini et al. (2012) Chini, R., Hoffmeister, V. H., Nasseri, A., Stahl, O., & Zinnecker, H. 2012, MNRAS, 424, 1925
- Cyganowski et al. (2009) Cyganowski, C. J., Brogan, C. L., Hunter, T. R., & Churchwell, E. 2009, ApJ, 702, 1615
- Cyganowski et al. (2011) Cyganowski, C. J., Brogan, C. L., Hunter, T. R., Churchwell, E., & Zhang, Q. 2011, ApJ, 729, 124
- Cyganowski et al. (2017) Cyganowski, C. J., Brogan, C. L., Hunter, T. R., et al. 2017, MNRAS, 468, 3694
- Cyganowski et al. (2012) —. 2012, ApJ, 760, L20
- Cyganowski et al. (2014) —. 2014, ApJL, 796, L2
- Duarte-Cabral et al. (2013) Duarte-Cabral, A., Bontemps, S., Motte, F., et al. 2013, A&A, 558, A125
- Ginsburg et al. (2017) Ginsburg, A., Goddi, C., Kruijssen, J. M. D., et al. 2017, ApJ, 842, 92
- Gravity Collaboration et al. (2018) Gravity Collaboration, Karl, M., Pfuhl, O., et al. 2018, A&A, 620, A116
- Harada et al. (2021) Harada, N., Hirano, S., Machida, M. N., & Hosokawa, T. 2021, MNRAS, 508, 3730
- Hernández-Gómez et al. (2019) Hernández-Gómez, A., Loinard, L., Chandler, C. J., et al. 2019, ApJ, 875, 94
- Hofner & Churchwell (1996) Hofner, P., & Churchwell, E. 1996, A&AS, 120, 283
- Hunter et al. (2015) Hunter, T. R., Brogan, C. L., Cyganowski, C. J., & Schnee, S. 2015, in EAS Publications Series, Vol. 75-76, EAS Publications Series, 285–286
- Hunter et al. (2017) Hunter, T. R., Brogan, C. L., MacLeod, G., et al. 2017, ApJ, 837, L29
- Ilee et al. (2018) Ilee, J. D., Cyganowski, C. J., Brogan, C. L., et al. 2018, ApJ, 869, L24
- Ilee et al. (2016) Ilee, J. D., Cyganowski, C. J., Nazari, P., et al. 2016, MNRAS, 462, 4386
- Karnath et al. (2020) Karnath, N., Megeath, S. T., Tobin, J. J., et al. 2020, ApJ, 890, 129
- Koumpia et al. (2021) Koumpia, E., de Wit, W. J., Oudmaijer, R. D., et al. 2021, A&A, 654, A109
- Kraus et al. (2017) Kraus, S., Kluska, J., Kreplin, A., et al. 2017, ApJ, 835, L5
- Krumholz et al. (2009) Krumholz, M. R., Klein, R. I., McKee, C. F., Offner, S. S. R., & Cunningham, A. J. 2009, Science, 323, 754
- Kuiper & Yorke (2013) Kuiper, R., & Yorke, H. W. 2013, ApJ, 772, 61
- Lund & Bonnell (2018) Lund, K., & Bonnell, I. A. 2018, MNRAS, 479, 2235
- Meyer et al. (2018) Meyer, D. M. A., Kuiper, R., Kley, W., Johnston, K. G., & Vorobyov, E. 2018, MNRAS, 473, 3615
- Mignon-Risse et al. (2021) Mignon-Risse, R., González, M., Commerçon, B., & Rosdahl, J. 2021, A&A, 652, A69
- Morii et al. (2021) Morii, K., Sanhueza, P., Nakamura, F., et al. 2021, ApJ, 923, 147
- Oliva & Kuiper (2020) Oliva, G. A., & Kuiper, R. 2020, A&A, 644, A41
- Pillai et al. (2019) Pillai, T., Kauffmann, J., Zhang, Q., et al. 2019, A&A, 622, A54
- Pomohaci et al. (2019) Pomohaci, R., Oudmaijer, R. D., & Goodwin, S. P. 2019, MNRAS, 484, 226
- Ramírez-Tannus et al. (2021) Ramírez-Tannus, M. C., Backs, F., de Koter, A., et al. 2021, A&A, 645, L10
- Redaelli et al. (2021) Redaelli, E., Bovino, S., Giannetti, A., et al. 2021, A&A, 650, A202
- Riaz et al. (2014) Riaz, R., Farooqui, S. Z., & Vanaverbeke, S. 2014, MNRAS, 444, 1189
- Robitaille & Bressert (2012) Robitaille, T., & Bressert, E. 2012, APLpy: Astronomical Plotting Library in Python, , , ascl:1208.017
- Rosen & Krumholz (2020) Rosen, A. L., & Krumholz, M. R. 2020, AJ, 160, 78
- Rosen et al. (2016) Rosen, A. L., Krumholz, M. R., McKee, C. F., & Klein, R. I. 2016, MNRAS, 463, 2553
- Rosen et al. (2019) Rosen, A. L., Li, P. S., Zhang, Q., & Burkhart, B. 2019, ApJ, 887, 108
- Sahu et al. (2019) Sahu, D., Liu, S.-Y., Su, Y.-N., et al. 2019, ApJ, 872, 196
- Sana et al. (2014) Sana, H., Le Bouquin, J. B., Lacour, S., et al. 2014, ApJS, 215, 15
- Sato et al. (2014) Sato, M., Wu, Y. W., Immer, K., et al. 2014, ApJ, 793, 72
- Svoboda et al. (2019) Svoboda, B. E., Shirley, Y. L., Traficante, A., et al. 2019, ApJ, 886, 36
- Tan et al. (2016) Tan, J. C., Kong, S., Zhang, Y., et al. 2016, ApJ, 821, L3
- Tanaka et al. (2020) Tanaka, K. E. I., Zhang, Y., Hirota, T., et al. 2020, ApJ, 900, L2
- Tychoniec et al. (2021) Tychoniec, Ł., van Dishoeck, E. F., van’t Hoff, M. L. R., et al. 2021, A&A, 655, A65
- Young & Evans (2005) Young, C. H., & Evans, Neal J., I. 2005, ApJ, 627, 293
- Zapata et al. (2019) Zapata, L. A., Garay, G., Palau, A., et al. 2019, ApJ, 872, 176
- Zhang et al. (2019) Zhang, Y., Tan, J. C., Tanaka, K. E. I., et al. 2019, Nature Astronomy, 3, 517