FERMILAB-PUB-22-247-T, CERN-TH-2022-060
Very Light Sterile Neutrinos at NOvA and T2K
Abstract
Over the last several years, our understanding of neutrino oscillations has developed significantly due to the long-baseline measurements of muon-neutrino disappearance and muon-to-electron-neutrino appearance at the T2K and NOvA experiments. However, when interpreted under the standard-three-massive-neutrinos paradigm, a tension has emerged between the two experiments’ data. Here, we examine whether this tension can be alleviated when a fourth, very light neutrino is added to the picture. Specifically, we focus on the scenario in which this new neutrino has a mass similar to, or even lighter than, the three mostly-active neutrinos that have been identified to date. We find that, for some regions of parameter space, the four-neutrino framework is favored over the three-neutrino one with moderate () significance. Interpreting these results, we provide future outlook for near-term and long-term experiments if this four-neutrino framework is indeed true.
I Introduction
Long-baseline neutrino oscillation experiments aim at studying the phenomenon of neutrino oscillations by taking advantage of the known neutrino oscillation lengths, proportional to (the inverse of) the mass-squared differences or , where are the masses of the neutrino mass eigenstates , respectively. The neutrino masses are labelled such that and . With this definition, the sign of is an observable and captures the neutrino-mass ordering: normal ordering (NO) when is positive, inverted ordering (IO) when is negative.
Among the objectives of long-baseline experiments is testing the standard-three-massive-neutrinos paradigm, which states that there are three neutrino mass eigenstates and that these interact via neutral-current and charged-current weak interactions. As far as the charged-current weak interactions are concerned, three orthogonal linear combinations of couple to the -boson and the charged leptons (). In more detail, () couples to and the -boson, and are the elements of the unitary leptonic mixing matrix. On the other hand, assuming the standard-three-massive-neutrinos paradigm is correct, long-baseline experiments are capable of measuring, sometimes with great precision, the neutrino oscillation parameters – the parameters which define and the mass-squared differences. One way to test the standard-three-massive-neutrinos paradigm is to assume it is correct; measure the oscillation parameters using different oscillation processes or different experimental setups; and compare the results. If different measurements of the same quantity disagree at a high confidence level, we would claim the underlying formalism – in this case the standard three-massive-neutrinos paradigm – is deficient.
Among the current generation of long-baseline experiments are the Tokai to Kamioka experiment (T2K) T2K:2011ypd ; T2K:2021xwb , in Japan, and the NuMI Off-axis Appearance (NOvA) experiment NOvA:2016kwd ; NOvA:2021nfi , in the United States. They are sensitive to several of the neutrino oscillation parameters, including some that are, at present, virtually unknown: the neutrino mass-ordering and the CP-odd parameter that governs whether and how much CP-invariance is violated in the lepton sector. Data from T2K and NOvA have been analyzed assuming the standard-three-massive-neutrinos paradigm and have led to interesting measurements of the oscillation parameters. Just as interesting, perhaps, is the fact that there is some tension between T2K and NOvA data.
The tension, which was first demonstrated by Refs. T2KNu2020 ; NOvANu2020 , has been quantified and examined critically in the three-neutrino framework by various authors Kelly:2020fkv ; Esteban:2020cvm ; deSalas:2020pgw ; Capozzi:2021fjo . In a little more detail, both T2K and NOvA measure electron-like and muon-like events associated to a pion decay-in-flight neutrino source (). Measurements are performed at both near and far detectors and the detectors are exposed to both “neutrino” and “antineutrino” beams. With all this information, they can infer the and survival probabilities and , respectively, and the and appearance probabilities and , respectively. At T2K, typical neutrino energies are around 600 MeV and the baseline is 295 km. Typical NOvA energies are around 2 GeV and the baseline is 810 km.
Assuming the standard-three-massive-neutrinos paradigm, the T2K and NOvA disappearance data are consistent but the appearance data, for both neutrinos and antineutrinos, are in disagreement. Within the NO, T2K prefers values close to .***We will use the convention that CP-violating phases are defined over . In contrast, when analyzed under the NO, NOvA data have no strong preference for any particular value of , however, they disfavor the combination of and the mixing angle preferred by T2K at roughly confidence. This tension may be addressed by instead considering the IO, where both experiments prefer Kelly:2020fkv ; T2K:2021xwb ; NOvA:2021nfi . However, global fits to all neutrino oscillation data, including those from reactor antineutrino experiments DayaBay:2018yms ; RENO:2018dro ; DoubleChooz:2019qbj , prefer NO at Esteban:2020cvm ; deSalas:2020pgw ; Capozzi:2021fjo ; Jimenez:2022dkn , leaving the T2K-NOvA tension unaddressed.
Whether the tension can be alleviated by the presence of physics beyond the standard-three-massive-neutrinos paradigm has also been the subject of intense exploration (see, for example, Refs. Denton:2020uda ; Miranda:2019ynh ; Chatterjee:2020yak ; Chatterjee:2020kkm ; Forero:2021azc ; Rahaman:2021leu ; Rahaman:2022rfp ). Here, we would like to explore, in some detail, whether the tension between T2K and NOvA can be interpreted as evidence for new light neutrino states. This issue has been discussed before Chatterjee:2020yak , assuming the new neutrino state with mass is relatively heavy: . Instead, here we concentrate on values that are or smaller, down to , and explore the full parameter space associated with the fourth neutrino. In Sec. II, we describe the four-neutrino oscillation formalism of interest. We also discuss how the existence of a light fourth neutrino may help alleviate the T2K–NOvA tension. In Sec. III we present our simulations of NOvA and T2K data and discuss how these are used, in Sec. IV, to compare the standard-three-massive-neutrinos paradigm and the fourth-neutrino hypothesis. We present some concluding remarks in Sec. V. Some results are included in appendices: Appendix A includes detailed numerical results from our analyses, Appendix B presents an alternate, extremely-light sterile neutrino analysis, and Appendix C discusses some Monte Carlo studies of T2K, NOvA, and their combination in light of the sterile neutrino analyses.
II Four-Flavor Neutrino Oscillations
We assume there are four neutrino mass eigenstates , and that these are related to the four interaction eigenstates and (where we assume the state does not participate in the weak interactions) via a unitary mixing matrix:
| (II.1) |
where are rotation matrices in the -plane associated with a rotation angle . The nontrivial entries of the different in Eq. (II.1) are given by
where and . This extension to the standard-three-massive-neutrinos paradigm includes one more independent mass-squared difference and five new mixing parameters: three mixing angles and two complex phases .
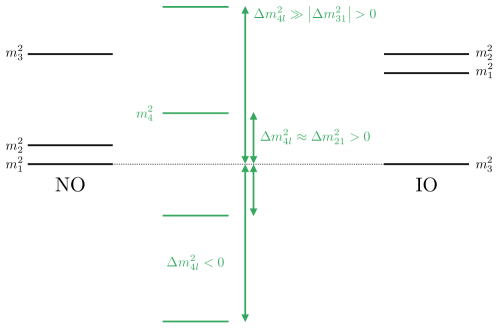
The mixing matrix is defined in such a way that, in the limit , and are linear superpositions of only the active states . In this limit, we recover the standard-three-massive-neutrinos paradigm. We will be interested in the case where are relatively small and will refer to as the mostly active states. The mostly active states will be defined in the usual way, including the ordering of their masses, which is either “normal” (NO) or “inverted” (IO), as discussed in Sec. I. With this in mind, we define
| (II.2) |
In order to allow for all different relevant orderings of the four masses, we allow for both the NO and IO of the mostly active states and for both positive and negative values of . The four qualitatively different mass orderings are depicted in Fig. 1.
As far as the magnitude of , we will restrict our analyses to . Inside this range, we expect nontrivial oscillation effects to manifest themselves in the far detectors of T2K and NOvA but not in the corresponding near detectors. When is smaller than eV2, the new oscillation length associated to is too long and outside the reach of T2K and NOvA. Instead, when is larger than eV2, we expect very fast oscillations in the far detectors of T2K and NOvA and nontrivial effects in the corresponding near detectors. This region of parameter space was explored in Ref. Chatterjee:2020yak .
The active neutrinos interact with the medium as they propagate from the source to the far detector. These interactions modify the equations that govern the flavor evolution of the neutrino states via effective potentials for forward charged-current (CC) and neutral-current (NC) scattering. The neutrino flavor evolution equation can be written as a Schrödinger-like equation with an effective Hamiltonian given by, in the flavor basis, , where
| (II.3) |
For neutrinos, are the CC and NC matter potentials, respectively. For antineutrinos, the matter potentials have the opposite sign. is the density – assumed to be constant – of the medium, assumed to be neutral. In this case, is half as large as and negative. For the NOvA and T2K experiments, we fix the baselines to be and , respectively, while the near-far detector average matter densities are taken to be, respectively, NOvA:2021nfi and T2K:2021xwb . The sterile nature of the new neutrino interaction eigenstate translates into a nontrivial , obtained after the subtraction of from the Hamiltonian.
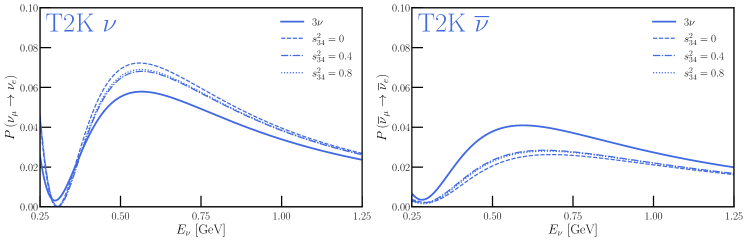
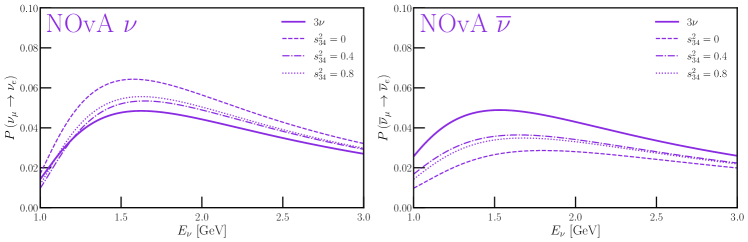
Since the tension between T2K and NOvA is mostly driven by the appearance channel, Fig. 2 depicts the appearance probability for both experiments given the three-neutrino and four-neutrino hypotheses. The mixing parameters for the different hypotheses are listed in Table 1, except for . We see that the new oscillation frequency eV2 can lead to pronounced oscillations at both NOvA and T2K. We also note that the new effects can be different at T2K relative to NOvA for, roughly, two different reasons. One is that the dominant values of , keeping in mind that both beams have a narrow energy profile, are not identical for the two experiments. This means that for relatively “fast” the value of the new oscillation phase will not be the same for the two experiments. The other is that the matter effects are more pronounced at NOvA relative to T2K. These allow the effective oscillation frequencies and mixing parameters to be distinct at the two experimental setups.
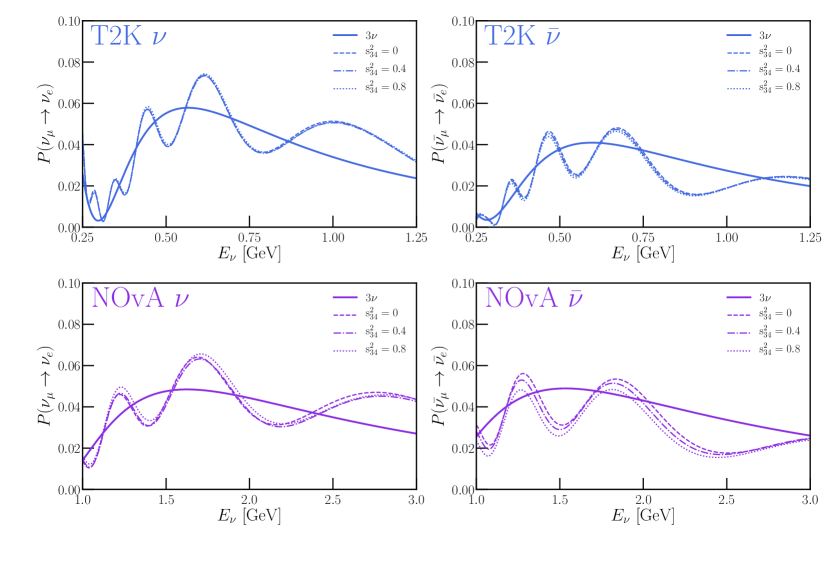
In vacuum, does not depend on ; this is not the case in matter. An easy way to see this is to express the propagation Hamiltonian in the mass basis. In the absence of matter effects, the dependency on the mixing parameters is encoded in the initial and final interaction eigenstates and since neither nor , when expressed as linear superpositions of the mass eigenstates, depend on , then neither can . Instead, when the matter effects are present, the matter potential in the mass basis depends on . Hence we expect to also depend on as long as matter effects are relevant. The dependency on can be seen in Fig. 2. As expected, it is rather small at T2K and larger at NOvA, where matter effects are relatively more pronounced.
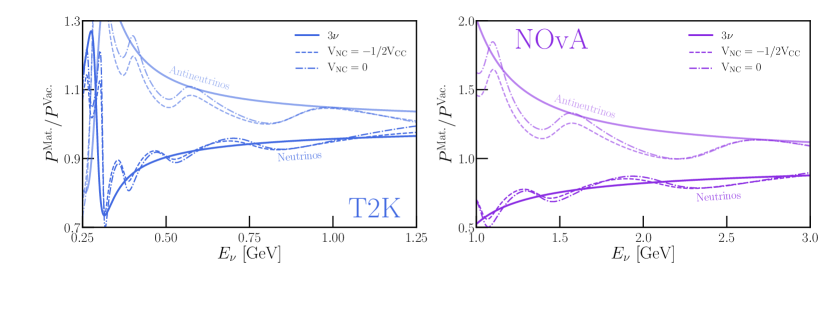
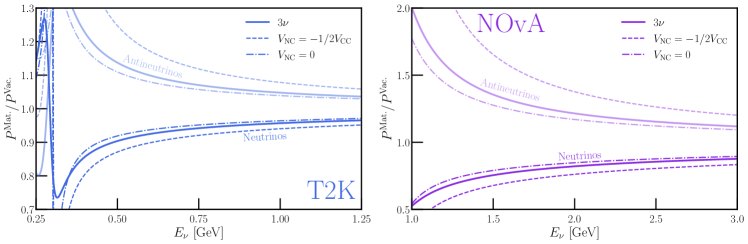
In order to further illustrate the impact of matter effects, Fig. 3 depicts the ratio of the appearance probabilities in matter relative to what those would be in vacuum. We also illustrate the difference between a new interaction state that is active and one that is sterile by depicting the same ratio assuming the neutral current matter potential is zero. The new oscillation frequency is apparent at both experiments and it is easy to see that matter effects are more pronounced at NOvA relative to T2K. The “sterileness” of the fourth neutrino is also more pronounced at NOvA, as expected.
III Simulating Data from NOvA and T2K
As discussed earlier, both NOvA and T2K operate with beams with a flux of predominantly () when operating in (anti)neutrino mode. Both experiments’ far detectors are designed to study the disappearance of and , as well as the appearance of and . Using the most recent publications from NOvA NOvA:2021nfi and T2K T2K:2021xwb , and building off the simulations of Refs. Ellis:2020ehi ; Ellis:2020hus ; Kelly:2020fkv , we perform simulations to determine the expected event rates in the disappearance and appearance channels of both experiments given a set of three- or four-neutrino oscillation parameters. We then compare these expected event rates against the experiments’ published event rates and construct a test statistic using Poissonian bin expectations.
In the remainder of this section, we briefly explain the process by which we simulate the expected event rates, as well as the number of data points for each experiment that enter our test statistic.
| Parameter | NO | IO | NO | IO |
| 0.307 | 0.307 | 0.321 | 0.314 | |
| 0.022 | 0.022 | |||
| 0.57 | 0.57 | |||
| eV2 | 7.53 | 7.53 | 7.53 | 7.53 |
| eV2 | 2.51 | -2.41 | 2.49 | -2.39 |
| 3.66 | 4.71 | 4.09 | 4.46 | |
| — | — | 0.043 | 0.021 | |
| — | — | 0.060 | 0.053 | |
| — | — | 0.37 | 0.56 | |
| /eV2 | — | — | ||
| — | — | 0.01 | 4.88 | |
| — | — | 1.82 | 5.89 |
To center our discussion, we will rely on several benchmark sets of oscillation parameters with which we calculate the expected observables at NOvA and T2K. We adopt two benchmark sets each for the and assumptions, listed in Table 1, allowing for the mostly-active neutrinos to follow either the normal (NO) or inverted (IO) orderings. As we will discuss in Section IV, these parameters are the best-fit points obtained by our fit to the combination of T2K and NOvA under the different hypotheses.
NOvA — Our simulation of NOvA, designed to match the results of Ref. NOvA:2021nfi , includes the disappearance channels of neutrino and antineutrino mode (19 bins each, with neutrino energies ranging from to GeV) as well as event rate measurements of the appearance channels†††For simplicity, we sum the expected event rate for the entire neutrino energy range and compare it against the observed 82 (33) appearance events of operation in (anti)neutrino mode., totaling 40 data points. This simulation corresponds to a total exposure of () protons on target (POT) in (anti)neutrino mode.
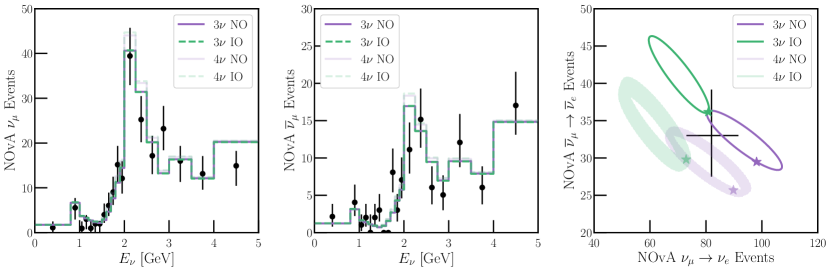
Fig. 4 shows the expected event rates in NOvA for neutrino mode disappearance (left), antineutrino mode disappearance‡‡‡In contrast to Ref. NOvA:2021nfi , our disappearance channel panels depict the event rate per bin as opposed to event rate per unit energy, causing our higher-energy bins (with larger bin width) to appear exaggerated. (center), and a joint comparison of neutrino (-axis) and antineutrino (-axis) mode (or ) appearance (right panel). We compare the NOvA benchmark oscillation predictions, using the parameters in Table 1 (purple histograms/curves§§§Where the faint curves are not visible in the left/center panels, the four-neutrino hypothesis predicts the same rate as the three-neutrino one(s). for NO, green for IO, and dark curves for , faint ones for ), to the observed event rates from the experiment (black). Error bars here are only statistical. In the left and center panels, all oscillation parameters are fixed according to Table 1. In contrast, the right panel allows to vary for the curves, and all three CP-violating phases to vary in the case. This allows for a set of ellipses in this bi-event parameter space instead of a single one. In the right panel, stars indicate the predicted event rates when the CP-violating phases are fixed to their values in Table 1.
T2K — We simulate T2K in much the same spirit as NOvA, with the goal of matching the results presented in Ref. T2K:2021xwb . In the case of T2K, the disappearance channels each consist of 30 bins – MeV in width from to GeV, and one bin corresponding to neutrino energies above GeV. For the appearance channel, we take advantage of the expected neutrino-energy spectrum with bins of MeV width from to GeV in each channel.¶¶¶Refs. Ellis:2020ehi ; Ellis:2020hus , however, have demonstrated that total-rate measurements of T2K’s appearance channel result in similar parameter estimation to the collaboration’s results. This yields 80 data points in our T2K analysis. Our T2K simulation corresponds to an exposure of () POT in (anti)neutrino mode operation.
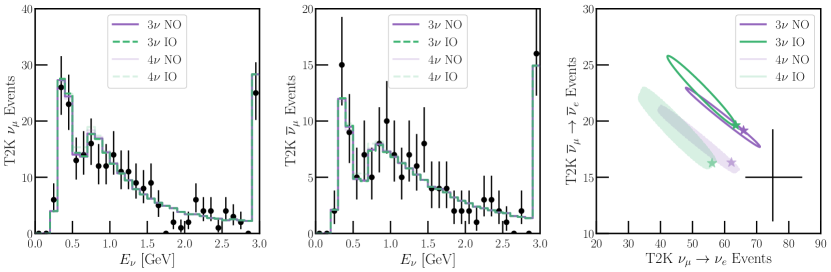
Similar to Fig. 4, we show in Fig. 5 our expected event rates in the different T2K channels – the left panel is for disappearance, center for disappearance, and the right panel is the combined and appearance. For clarity of display, we sum the total expected event rates in the and channels in the right panel. Here, the oscillation parameters correspond to those given in Table 1 and, in the right panel, the CP-violating phases are allowed to vary.
Test Statistic — We take the expected and observed event rates in NOvA (40 data points), T2K (80), or a combination of them (120) and construct a test statistic using Poisson statistics for the log-likelihood (matching a function in the limit of large event rates):
| (III.1) |
where () represents the expected (observed) event rate in bin for a given experiment/channel.
We will be interested in several pieces of information from the test statistic in Eq. (III.1). When performing parameter estimations, we will use contours of about its minimum to represent preferred regions/intervals of parameter space. When comparing best-fit points under different hypotheses, i.e., comparing preference for the scenario over the one, we will compare the minimum when varying over oscillation parameters, taking into account the number of degrees of freedom in such a fit.
Analysis & Priors — The main focus of this work is on the long-baseline experiments NOvA and T2K, which are sensitive to oscillation effects associated with mass-squared differences of order of eV2. On the other hand, the solar mass-squared difference has been well-measured by solar neutrino Super-Kamiokande:2016yck ; SKNu2020 and reactor antineutrino KamLAND:2013rgu experiments to be eV2 while the associated mixing angle is measured to be , both at the few percent level. Due to the lack of sensitivity to these quantities at NOvA/T2K, we fix them∥∥∥Specifically, we fix the matrix-element-squared , which is equal to in the four-neutrino framework, to its best-fit value of . This causes to vary for large . in our analyses. While NOvA and T2K are sensitive to through their appearance channels, their measurement capability is significantly weaker than that of Daya Bay DayaBay:2018yms , RENO RENO:2018dro , and Double Chooz DoubleChooz:2019qbj reactor antineutrino experiments. In our fits, we include Daya Bay’s measurement as a Gaussian prior on the quantity , which is when considering the three-neutrino hypothesis DayaBay:2018yms .
IV Results
This section details the results of our analyses. First, in Section IV.1, we summarize the results of fits of our NOvA and T2K simulations and their combination under the three-neutrino hypothesis. Then, Section IV.2 discusses the results of these fits under the four-neutrino hypothesis, including a comparison of the three-neutrino and four-neutrino hypotheses.
IV.1 Three-Neutrino Results
Our first three-neutrino analysis is focused on finding the best-fit points of each experimental analysis (T2K, NOvA, and a combined fit). For this, we perform two fits for each experiment/combination, one assuming that neutrinos follow the normal mass ordering (NO, ) and one assuming that they follow the inverted one (IO, ). Recent results have demonstrated that, under the three-neutrino hypothesis, T2K and NOvA each exhibit mild preference for the NO over the IO, but their combination has a mild preference for the IO Kelly:2020fkv ; Esteban:2020cvm ; deSalas:2020pgw ; Capozzi:2021fjo . When combined with all reactor antineutrino data and other experimental results, the global preference is for the NO at relatively low significance.
We find a result consistent with these previous results, summarized in Table 2. As in all of our analyses, and are fixed, and a prior is included from the results of Daya Bay on . We present both the overall test statistic at this best-fit point for each analysis as well as the preference for the NO over the IO in the right-most column (positive values indicate preference for NO, negative for IO). We note here that all of the best-fit obtained are comparable to (and in the case of T2K and the joint fit, less than) the number of degrees of freedom, implying that these are all good fits to their respective data sets. Finally, we see that the joint-fit under the NO hypothesis is around five units of larger than the sum of the two individual fits whereas, under the IO hypothesis, it is roughly the same – this highlights the so-called NOvA/T2K tension, where the results disagree under the NO hypothesis but not under the IO one. The values from the “Joint” fit in Table 2 correspond to the benchmark values we adopted in the three-neutrino case in Table 1.
| 3 | eV2 | ||||||
|---|---|---|---|---|---|---|---|
| T2K | NO | ||||||
| IO | |||||||
| NOvA | NO | ||||||
| IO | |||||||
| Joint | NO | ||||||
| IO | |||||||
We also perform a parameter estimation under the three-neutrino hypothesis, both to prepare our expectations for the four-neutrino analyses and to validate our results compared against the official results of the experimental collaborations. The free/fixed parameters and test statistic are identical to those when determining the best-fit points. For simplicity, we perform an analysis of the parameters , , , and and marginalize over and (including both the NO and IO hypotheses), and present the joint measurement of and .
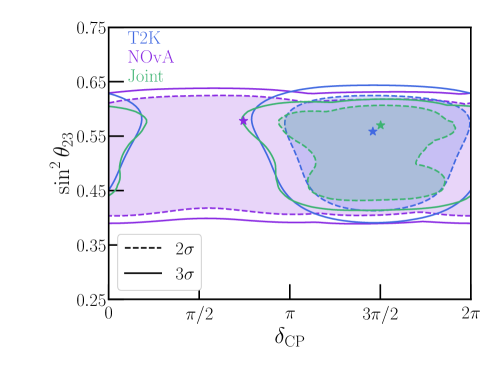
Fig. 6 presents the results of this analysis at (dashed, filled contours) and (solid lines) CL for T2K (blue), NOvA (purple), and the joint fit (green). Stars of each color represent the best-fit points obtained in Table 2. Once the mass ordering is marginalized, NOvA has no sensitivity to , and constrains to be between roughly and at CL. In the NO, NOvA can take on nearly any value of , however it disfavors the combination , at relatively high significance. Under the IO, NOvA prefers this combination. Regardless of the mass ordering, T2K prefers and constrains to be in a similar range as NOvA. When the two are combined, the preferred regions are very similar to those obtained in the fit to T2K data alone.
IV.2 Four-Neutrino Results
We begin our four-neutrino analyses by repeating the process that led to Table 2 – we determine the best-fit points under the four-neutrino hypothesis for T2K, NOvA, and their combination. Now that we are considering four-neutrino oscillations, we allow for all four mass orderings discussed in Sec. II (see Fig. 1). This amounts to dividing the analysis based on the signs of and , where represents in the NO and in the IO, the lightest of the mostly-active neutrinos.
Table 3 summarizes these twelve analyses (four each for NOvA, T2K, and their Joint fit), giving the best-fit parameters as well as the overall of each fit in the four-neutrino hypothesis. Near the bottom we give the preferred ordering of masses from each experiment/combination – T2K and the Joint fit both prefer , where NOvA prefers . The preference for the sign of is small in all cases – individual fit results for all four mass orderings and all three experimental combinations are provided for completeness in Appendix A. When allowing for a fourth neutrino, neither T2K nor NOvA have a strong preference for the sign of . T2K prefers at , where NOvA prefers at . However, the combined fit prefers at an even stronger preference for negative than when data are analyzed under the three-neutrino hypothesis.
| 4 | T2K | NOvA | Joint |
|---|---|---|---|
| eV2 | |||
| eV2 | |||
| Ordering | |||
The bottom row of Table 3 presents the improvement in each experimental analysis (as well as the combined one) compared to the results of the three-neutrino analysis. We find that the fits to both the T2K***This result is consistent with what the T2K collaboration reported in Ref. T2K:2019efw , which found an improvement of . and NOvA data improve by roughly five units in , and the combined fit improves by nearly nine units. However, we note two very important caveats here:
-
1.
The results of the three-neutrino fit in Table 2 demonstrate that, relative to the number of degrees of freedom, good fits have been achieved. So, when comparing the three-neutrino fit – four parameters – to the four-neutrino one – ten parameters – one must take into account the fact that this minimization is being performed over an additional six parameters.
-
2.
When determining the statistical significance, the comparison of must be scrutinized to see whether these test statistics follow a distribution. We have performed some basic Monte Carlo studies of our T2K and NOvA simulations (see Appendix C) and found that, when statistical fluctuations are considered, one will often find best-fit points with eV2 that improve each experiment’s fit by a couple of units of . This is likely driven by the sizes of the energy bins (around 100 MeV) used in the T2K and NOvA analyses – at T2K/NOvA baselines/energies, a new oscillation driven by a mass-squared splitting of eV2 will evolve significantly†††For this , the argument of the term that enters the oscillation probabilities changes by an appreciable fraction of . over the span of a single bin. This new fast oscillation can “absorb” individual bins’ statistical fluctuations and lead to an artificial improvement in the test statistic. This is validated by the results of Ref. T2K:2019efw , which found that an improvement of at T2K (between the three-neutrino and four-neutrino hypotheses) corresponds to only preference for a fourth neutrino, in contrast with the preference derived assuming Wilks’ theorem Wilks:1938dza holds, .
When considering the results of Table 3 (and that the best-fit points are close to eV2) in light of these two caveats, we find that, while a very light sterile neutrino improves the “tension” between T2K and NOvA, there is not strong evidence in favor of a four-neutrino hypothesis over the three-neutrino one.
In order to determine whether the sterile neutrino solution to the NOvA/T2K tension persists in light of caveat 2 above, we also perform an alternate analysis in Appendix B where we restrict eV2. This allows us to avoid fast oscillations in the T2K/NOvA far detectors and any statistical pathologies that may arise. We find that there remains a preference for four neutrinos over three neutrinos at a level of . While this is smaller than what we observed for eV2, it is nevertheless comparable to the preference for non-standard interactions as a solution to this tension found in Refs. Denton:2020uda ; Chatterjee:2020kkm at the level of .
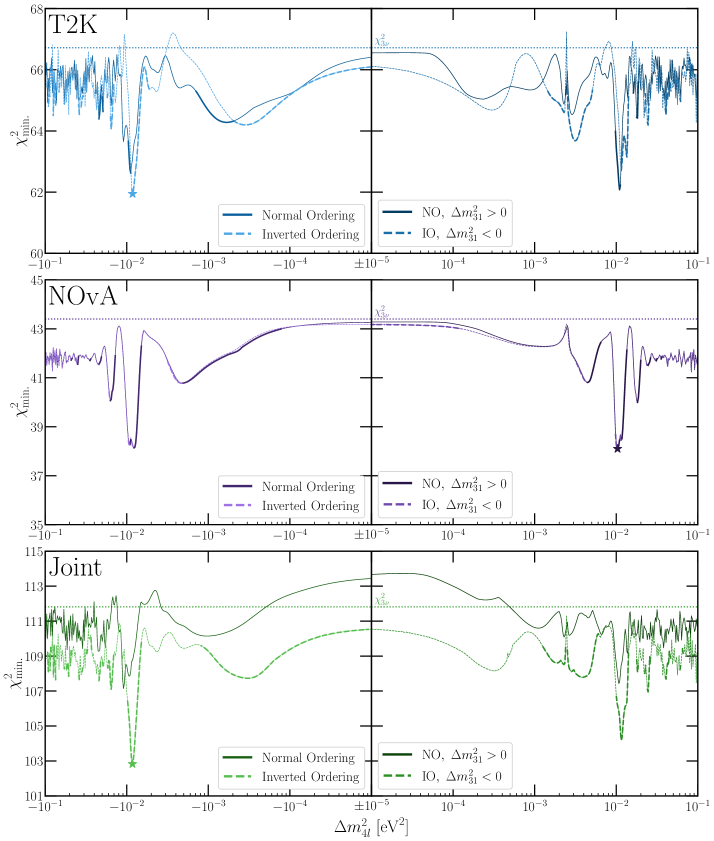
We generalize this best-fit procedure by, instead of minimizing over all parameters (including ), scanning over values. We again allow for both positive and negative values of this new mass-squared difference and for both the normal and inverted mass orderings for the three mostly active states. Fig. 7 presents the results of this approach. The top panels (blue lines) show the results for T2K, middle panels (purple) for NOvA, and bottom panels (green) for the combined analysis. In each row, the left (right) panel corresponds to negative (positive) values of . Dark (light) lines in each case correspond to the NO (IO) among the mostly-active neutrinos. Dashed lines in each panel indicate the best-fit under the three-neutrino hypothesis presented in Table 2. Stars indicate the overall best-fit point of each analysis (when considering all different mass orderings), and lines are made bold if they constitute the minimum for a given experimental analysis for all of these choices of mass orderings.
The findings of Table 3 (and the corresponding tables in Appendix A) are borne out in Fig. 7, showing that the fits prefer eV2 in all cases, with moderate improvements relative to the three-neutrino fits. Above, we discussed the possibility that this preference has to do with the energy resolution and binning of the experiments and the statistical significance when interpreting confidence levels from may be overstated. If we restrict ourselves to eV2 to avoid this concern, we still find moderate preference for a fourth neutrino – see Appendix B for further discussion.
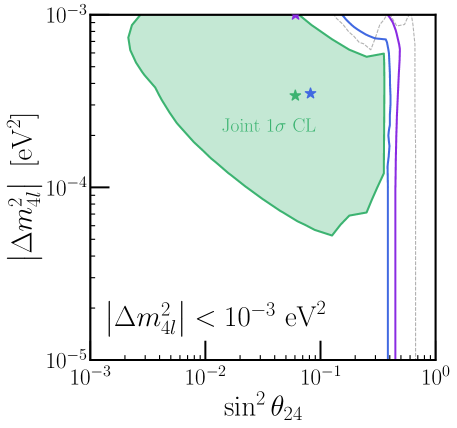
Moving on from best-fit determinations, we now construct constraints on the new parameters, specifically and (the ones to which these experiments have the greatest sensitivity). In order to present constraints at a particular confidence level and compare against other literature results, we assume for this exercise that Wilks’ theorem holds Wilks:1938dza . After marginalizing over the remaining oscillation parameters (still fixing and ), we present CL constraints from T2K (blue) and NOvA (purple) in Fig. 8. In generating these constraints, we have marginalized over the signs of both and . Colored stars indicate the best-fit point in of the given fits.
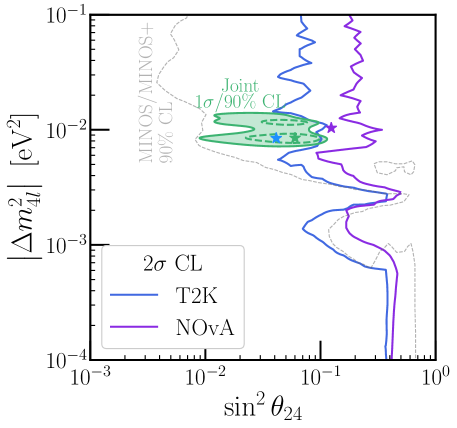
In Fig. 8 we also compare against the 90% CL constraint from the MINOS/MINOS+ experiment MINOS:2017cae as a faint grey line.‡‡‡This result assumed and to both be positive, however, due to the lack of mass-ordering sensitivity at MINOS, the result likely does not depend strongly on this choice. Finally, we also present in green the preferred region at /90% CL§§§We choose 90% CL for clarity (the CL region spans the entire range of of the figure and a comparable region of ) and for a direct comparison against the MINOS/MINOS+ result. ( assuming Wilks’ theorem for two parameters) by our combined T2K and NOvA analysis. This result is in tension with that of the MINOS/MINOS+ result, however, our preferred region has not been Feldman-Cousins corrected, and the results would likely agree if a higher confidence level were assumed. T2K has reported constraints in the vs. parameter space in Ref. T2K:2019efw – we find comparable results here despite the simplified assumptions we have made in our analysis and the slightly larger data set considered in this work.
While Fig. 8 compares constraints and preferred regions in the parameter space vs. , it is also important to consider the parameters that have been marginalized in this construction. For concreteness, we focus on the preferred region (green) from the combined T2K/NOvA analysis that we have performed. The best-fit point, at eV2, corresponds to mixing angles
| (IV.1) |
or mixing-matrix elements
| (IV.2) |
For these low values of , the strongest constraints on come from reactor antineutrino oscillation experiments such as Daya Bay DayaBay:2016qvc and Bugey-3 Declais:1994su . A combined analysis MINOS:2020iqj constrains at 90% CL, in significant tension with the value found in Eq. (IV.1).
Constraints on are more difficult to extract, as they often arise in tandem with and depend strongly on Dentler:2018sju . While specific constraints in this region of have not been explicitly derived, is possibly in tension with existing results from neutrino experiments. T2K, which analyzed its neutral-current data in addition to the data sets considered here, has constrained for both eV2 and eV2 at 90% CL T2K:2019efw . Atmospheric neutrino experiments, including Super-Kamiokande Super-Kamiokande:2014ndf and IceCube IceCube:2017ivd have constrained at high confidence, however, these analyses are restricted to eV2 where the fourth-neutrino-driven oscillations are averaged out. A more thorough investigation of this eV2 regime would prove useful if this hint persists in future NOvA/T2K data.
When discussing Fig. 7, we considered the possibility of analyzing only the region eV2, in part to avoid concerns regarding energy resolution and bin widths. We noted that in that region, a solution to the NOvA/T2K tension persists with a preference of . This regime has the added benefit that constraints from MINOS/MINOS+ (as seen in Fig. 8), Daya Bay/Bugey-3/others, and Super-Kamiokande/IceCube are considerably weaker. Such an extremely-light sterile neutrino, as we discuss in Appendix B, with eV2 should be paid particular attention as more data from T2K and NOvA are unveiled, especially if any tension between the two persists.
T2K and NOvA will continue collecting data – if a very light sterile neutrino does in fact exist with eV2, more data will continue to shed light and potentially lead to a discovery. In the next generation, the Deep Underground Neutrino Experiment (DUNE) DUNE:2020ypp and Hyper-Kamiokande (HK) Hyper-Kamiokande:2018ofw experiments will have sensitivity to light sterile neutrinos in the same region of given that they operate in a similar as NOvA and T2K. The two experiments, and any combined analysis, will have excellent sensitivity to test this solution to the T2K/NOvA tension Berryman:2015nua ; Kelly:2017kch .
V Concluding Remarks
As more data from neutrino oscillation experiments are collected, we are able to test the standard-three-massive-neutrinos paradigm with better precision. Concurrently, there is always the possibility that disagreements arise, especially when data from multiple experiments are analyzed. In these instances, exploring different explanations of such tensions is invaluable, whether they are related to statistical fluctuations, deeper systematic issues, or new physics beyond the standard-three-massive-neutrinos paradigm.
Such a tension has been noted when comparing the latest data from the Tokai to Kamioka (T2K) and NuMI Off-axis Appearance (NOvA) experiments. These measure the (dis)appearance of () in a beam at relatively long baselines. When analyzed under the three-neutrino hypothesis, their results disagree at around the 90% confidence level. Previous studies of combination T2K and NOvA data have highlighted that this tension is reduced when, for instance, the inverted neutrino mass ordering is considered instead of the normal ordering Kelly:2020fkv ; Esteban:2020cvm ; deSalas:2020pgw ; Capozzi:2021fjo , or when additional, beyond-the-Standard-Model neutrino/matter interactions are included in the analyses Denton:2020uda ; Chatterjee:2020kkm .
We have demonstrated here that an alternative approach can remedy this tension – the addition of a fourth, very light, sterile neutrino. This very light new neutrino would be associated to a mass-squared difference, relative to the lightest mostly-active neutrino, of order eV2. We have studied the four-neutrino hypothesis when applied to the T2K and NOvA data independently, as well as their combination. For the combined data, we find that the four-neutrino hypothesis is preferred over the three-neutrino one at the level of . When interpreting this in terms of statistical significance, two difficulties arise: first, the number of additional parameters in the four-neutrino hypothesis relative to the three-neutrino one (six additional parameters). Second, the oscillations associated with a new mass-squared difference on the order of eV2 are significant within individual bins in these long-baseline experiments, which leads to an artificial preference for sterile neutrinos due to statistical fluctuations.
Due to the second challenge, in order to avoid relatively fast oscillations, we also explored an alternative extremely-light sterile neutrino analysis where the fourth neutrino is fixed to be associated to a mass-squared difference smaller (in magnitude) than eV2. In this context, we find moderate improvement relative to the three-neutrino hypothesis, at the level of . While this is less significant, it is comparable to the improvement offered by non-standard neutrino interactions and merits further investigation.
NOvA and T2K are still collecting and analyzing data. As they progress, the experiments and combined analyses thereof will allow for deeper testing of these different, interesting regimes of four-neutrino oscillations with a very light or extremely light fourth neutrino. If they confirm the existence of such a new, light fermion state, then future experiments (including the spiritual successors DUNE and Hyper-Kamiokande) will be able to probe the new particle’s properties with even greater precision.
Acknowledgements
This work was supported in part by the US Department of Energy (DOE) grant #de-sc0010143 and in part by the National Science Foundation under Grant Nos. PHY-1630782 and PHY-1748958. The document was prepared using the resources of the Fermi National Accelerator Laboratory (Fermilab), a DOE, Office of Science, HEP User Facility. Fermilab is managed by Fermi Research Alliance, LLC (FRA), acting under Contract No. DE-AC02-07CH11359.
Appendix A Detailed Fit Results
In Section IV, we provided best-fit points of our analyses of T2K, NOvA, and their combination under the three- and four-neutrino hypotheses. When discussing the best-fit points under the four-neutrino hypothesis (Table 3), we showed the results of the analysis (i.e. which signs of and ) that provided the best overall fit to each experimental data set. In this appendix, we provide the results to all four fits for each experiment/combination. Table 4 does so for our analyses of T2K and NOvA data separately, and Table 5 does so for their combination.
| T2K | ||||
| NO | IO | |||
| eV2 | ||||
| eV2 | ||||
| Best-fit | ||||
| NOvA | |||
| NO | IO | ||
| Combined T2K and NOvA | ||||
| NO | IO | |||
| eV2 | ||||
| eV2 | ||||
| Best-fit | ||||
Appendix B Alternative Analyses with Very Small Mass-Squared Difference
We find, in Section IV, a solution to the NOvA/T2K tension with a new, light sterile neutrino with a mass-squared difference eV2. However, there are technical challenges associated with this relatively large mass-squared difference for the NOvA/T2K analyses, also as discussed in Section IV. For those reasons, we choose to pursue a different version of the analyses from the main text, this time restricting ourselves to eV2. As with the analyses in the main text, we fix to its best-fit value ( eV2).
First, we illustrate how the oscillation probabilities and at T2K/NOvA energies and baselines behave for a very light sterile neutrino, similar to the discussion in Section II (see Fig. 2). Instead of a relatively large eV2, Fig. 9 depicts the impact of a new mass-squared difference eV2 (and an inverted mass ordering for the three mostly-active neutrinos). The remaining oscillation parameters we use are from the “Joint” column in Table 6, corresponding to the best-fit parameters of the combined T2K and NOvA analysis when the new mass-squared difference is restricted to be eV2.
The top panels of Fig. 9 show oscillation probabilities at T2K, and the bottom panels at NOvA; the left (right) panels correspond to neutrino (antineutrino) oscillations. As with Fig. 2, we allow to vary to demonstrate its nontrivial impact on these oscillation probabilities – the dashed/dot-dashed/dotted lines correspond to , respectively. Compared with Fig. 2, here the “new” oscillation length driven by is relatively long as a function of the neutrino energy, leading at zeroth order to an overall shift in normalization relative to the three-neutrino oscillation probabilities. Across the energies of interest for T2K and NOvA, this leads to larger values of and smaller values of . As in Fig. 2, the impact of nonzero is more prevalent for NOvA, with its longer baseline, than for T2K. Fig. 10 depicts the impact of matter effects for this relatively smaller value of and is to be compared to Fig. 3.
The best-fit points obtained from this low- fit to T2K data, NOvA data, and the combined data sets are listed in Table 6. As in the result discussed in the main text, NOvA favors NO for the mostly active states while T2K and the Joint fits favor the IO for the mostly active states. All fits point to as the lightest neutrino mass. The improvement relative to the three-neutrinos scenario is largest for the Joint fit – a little over four units of – but rather modest. In summary, the data do not significantly favor the four-neutrino hypothesis over the three-neutrino one.
Fig. 11 depicts the region of the parameter space that is allowed by the combination of T2K and NOvA data at the one-sigma level, including all possible four-neutrino mass orderings (see Fig. 1) and assuming is less than eV2, along with the 2 constraints from NOvA (purple) and T2K (blue). The stars indicate the best-fit points and the dashed line existing bounds from MINOS/MINOS+. Unlike the result discussed in the main text, here the best fit point is not in tension with existing neutrino oscillation bounds thanks to the more limited sensitivity of MINOS/MINOS+ and reactor antineutrino experiments to new mass-squared differences less than eV2.
Like the results discussed in the main text, here, the best-fit points in Table 6 all prefer large values of , i.e., they suggest that has an component. As discussed in Section IV, while large are excluded by existing data, relevant constraints were obtained only for relatively large eV2.
| 4 | T2K | NOvA | Joint |
|---|---|---|---|
| eV2 | |||
| /eV2 | |||
| Ordering | |||
Appendix C Test Statistic Studies and Pseudoexperiments
Section IV demonstrated that all three fits, those to the T2K and NOvA data individually as well as their combination, prefer the four-neutrino hypothesis over the three-neutrino one to some degree of confidence. This is expected, as the three-neutrino hypothesis is a subset of the four-neutrino one – what is more difficult to predict is the level at which this preference is found. Specifically, we found that the best-fit-point to the data under the four-neutrino hypothesis compared to that of the three-neutrino hypothesis for T2K, NOvA, and the joint fit exhibited a preference at the level of , and , respectively. Also in Section IV, we discussed the fact that these three fits tend to favor eV2 and opined on whether this is a coincidence due to the binning used by T2K and NOvA or a real, physical effect.
In this appendix, we attempt to quantify some of these observed challenges – how significant these preferences are, and whether the preferred new mass-squared splitting is spurious. To do so, we perform a number of pseudoexperiments corresponding to each analysis. We simulate data for each experiment assuming the three-neutrino hypothesis is true, assuming , , , eV2, eV2, and (given as reference values in Ref. T2K:2021xwb ). For each pseudoexperiment, we include Poissonian fluctuations on the expected data according to this hypothesis. Then, using the same analysis strategies as in the main text, we obtain the best-fit-points and values for the three-neutrino and four-neutrino hypotheses.
The normalized distribution of is shown in Fig. 12. We show the histograms obtained by performing pseudoexperiments of the three different analyses in solid, colored lines, compared against the obtained when analyzing the data as vertical, dashed lines. We also display the distribution assuming six degrees of freedom (corresponding to the difference between the number of parameters in the two analysis hypotheses) as a grey line, which seems to track the distribution of the joint-fit pseudoexperiments well.
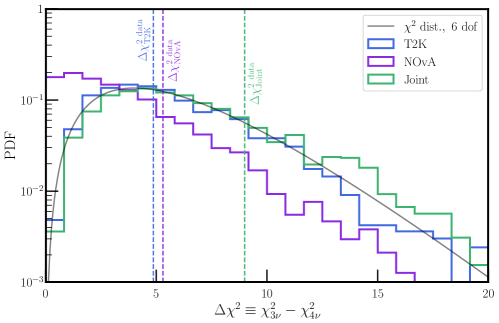
As a result of this procedure, we can determine the statistical significances of the three preferences – the p-values of the observed data at T2K, NOvA, and their combination are , , and , respectively. These values correspond to preference for the four-neutrino hypothesis at the level of , , and – none of which corresponds to a significant preference.
Finally, we determine whether the best-fit points obtained when analyzing data, all with eV2 are expected when including Poissonian fluctuations of simulated three-neutrino data. We determine, for each pseudoexperiment, the best-fit values of and obtained when analyzing the pseudodata under the four-neutrino hypothesis, displaying the distributions of these best-fit values in Fig. 13. Here, the dark regions indicate where the fits prefer the combination of parameters most frequently, and the white stars show the best-fit parameters obtained in each analysis from Section IV.
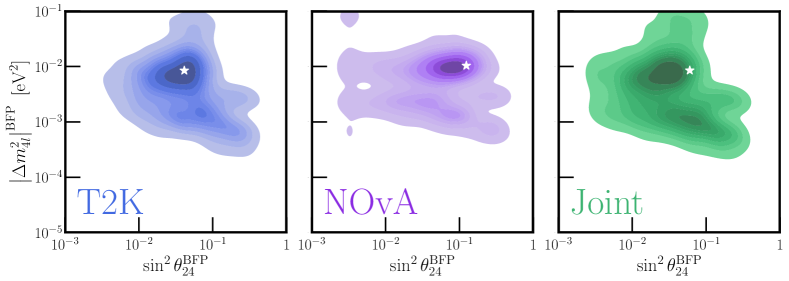
For all three analyses, the best-fit obtained when analyzing the data is nearly exactly consistent with the most likely points obtained by these procedures. This indicates that such fit values of are to be expected due to the construction of the test statistic and the experimental particulars, furthering the evidence that the results obtained in the main text are due to statistical fluctuations instead of the actual presence of a fourth, very light neutrino.
References
- (1) T2K , K. Abe et al., “Indication of Electron Neutrino Appearance from an Accelerator-produced Off-axis Muon Neutrino Beam,” Phys. Rev. Lett. 107 (2011) 041801, arXiv:1106.2822 [hep-ex].
- (2) T2K , K. Abe et al., “Improved constraints on neutrino mixing from the T2K experiment with protons on target,” Phys. Rev. D 103 (2021) no. 11, 112008, arXiv:2101.03779 [hep-ex].
- (3) NOvA , P. Adamson et al., “First measurement of electron neutrino appearance in NOvA,” Phys. Rev. Lett. 116 (2016) no. 15, 151806, arXiv:1601.05022 [hep-ex].
- (4) NOvA , M. A. Acero et al., “An Improved Measurement of Neutrino Oscillation Parameters by the NOvA Experiment,” arXiv:2108.08219 [hep-ex].
- (5) P. Dunne, “Latest Neutrino Oscillation Results from T2K, doi:10.5281/zenodo.3959558,” July, 2020. https://doi.org/10.5281/zenodo.3959558.
- (6) A. Himmel, “New Oscillation Results from the NOvA Experiment, doi:10.5281/zenodo.3959581,” July, 2020. https://doi.org/10.5281/zenodo.3959581.
- (7) K. J. Kelly, P. A. N. Machado, S. J. Parke, Y. F. Perez-Gonzalez, and R. Z. Funchal, “Neutrino mass ordering in light of recent data,” Phys. Rev. D 103 (2021) no. 1, 013004, arXiv:2007.08526 [hep-ph].
- (8) I. Esteban, M. C. Gonzalez-Garcia, M. Maltoni, T. Schwetz, and A. Zhou, “The fate of hints: updated global analysis of three-flavor neutrino oscillations,” JHEP 09 (2020) 178, arXiv:2007.14792 [hep-ph].
- (9) P. F. de Salas, D. V. Forero, S. Gariazzo, P. Martínez-Miravé, O. Mena, C. A. Ternes, M. Tórtola, and J. W. F. Valle, “2020 global reassessment of the neutrino oscillation picture,” JHEP 02 (2021) 071, arXiv:2006.11237 [hep-ph].
- (10) F. Capozzi, E. Di Valentino, E. Lisi, A. Marrone, A. Melchiorri, and A. Palazzo, “Unfinished fabric of the three neutrino paradigm,” Phys. Rev. D 104 (2021) no. 8, 083031, arXiv:2107.00532 [hep-ph].
- (11) Daya Bay , D. Adey et al., “Measurement of the Electron Antineutrino Oscillation with 1958 Days of Operation at Daya Bay,” Phys. Rev. Lett. 121 (2018) no. 24, 241805, arXiv:1809.02261 [hep-ex].
- (12) RENO , G. Bak et al., “Measurement of Reactor Antineutrino Oscillation Amplitude and Frequency at RENO,” Phys. Rev. Lett. 121 (2018) no. 20, 201801, arXiv:1806.00248 [hep-ex].
- (13) Double Chooz , H. de Kerret et al., “Double Chooz measurement via total neutron capture detection,” Nature Phys. 16 (2020) no. 5, 558–564, arXiv:1901.09445 [hep-ex].
- (14) R. Jimenez, C. Pena-Garay, K. Short, F. Simpson, and L. Verde, “Neutrino Masses and Mass Hierarchy: Evidence for the Normal Hierarchy,” arXiv:2203.14247 [hep-ph].
- (15) P. B. Denton, J. Gehrlein, and R. Pestes, “ -Violating Neutrino Nonstandard Interactions in Long-Baseline-Accelerator Data,” Phys. Rev. Lett. 126 (2021) no. 5, 051801, arXiv:2008.01110 [hep-ph].
- (16) L. S. Miranda, P. Pasquini, U. Rahaman, and S. Razzaque, “Searching for non-unitary neutrino oscillations in the present T2K and NOA data,” Eur. Phys. J. C 81 (2021) no. 5, 444, arXiv:1911.09398 [hep-ph].
- (17) S. S. Chatterjee and A. Palazzo, “Interpretation of NOA and T2K data in the presence of a light sterile neutrino,” arXiv:2005.10338 [hep-ph].
- (18) S. S. Chatterjee and A. Palazzo, “Nonstandard Neutrino Interactions as a Solution to the and T2K Discrepancy,” Phys. Rev. Lett. 126 (2021) no. 5, 051802, arXiv:2008.04161 [hep-ph].
- (19) D. V. Forero, C. Giunti, C. A. Ternes, and M. Tortola, “Nonunitary neutrino mixing in short and long-baseline experiments,” Phys. Rev. D 104 (2021) no. 7, 075030, arXiv:2103.01998 [hep-ph].
- (20) U. Rahaman, “Looking for Lorentz invariance violation (LIV) in the latest long baseline accelerator neutrino oscillation data,” Eur. Phys. J. C 81 (2021) no. 9, 792, arXiv:2103.04576 [hep-ph].
- (21) U. Rahaman, S. Razzaque, and S. U. Sankar, “A review of the tension between the T2K and NOA appearance data and hints to new physics,” arXiv:2201.03250 [hep-ph].
- (22) S. A. R. Ellis, K. J. Kelly, and S. W. Li, “Leptonic Unitarity Triangles,” Phys. Rev. D 102 (2020) no. 11, 115027, arXiv:2004.13719 [hep-ph].
- (23) S. A. R. Ellis, K. J. Kelly, and S. W. Li, “Current and Future Neutrino Oscillation Constraints on Leptonic Unitarity,” JHEP 12 (2020) 068, arXiv:2008.01088 [hep-ph].
- (24) Super-Kamiokande , K. Abe et al., “Solar Neutrino Measurements in Super-Kamiokande-IV,” Phys. Rev. D 94 (2016) no. 5, 052010, arXiv:1606.07538 [hep-ex].
- (25) Y. Nakajima, “Recent results and future prospects from Super-Kamiokande,” June, 2020. https://doi.org/10.5281/zenodo.3959640.
- (26) KamLAND , A. Gando et al., “Reactor On-Off Antineutrino Measurement with KamLAND,” Phys. Rev. D 88 (2013) no. 3, 033001, arXiv:1303.4667 [hep-ex].
- (27) T2K , K. Abe et al., “Search for light sterile neutrinos with the T2K far detector Super-Kamiokande at a baseline of 295 km,” Phys. Rev. D 99 (2019) no. 7, 071103, arXiv:1902.06529 [hep-ex].
- (28) S. S. Wilks, “The Large-Sample Distribution of the Likelihood Ratio for Testing Composite Hypotheses,” Annals Math. Statist. 9 (1938) no. 1, 60–62.
- (29) MINOS+ , P. Adamson et al., “Search for sterile neutrinos in MINOS and MINOS+ using a two-detector fit,” Phys. Rev. Lett. 122 (2019) no. 9, 091803, arXiv:1710.06488 [hep-ex].
- (30) Daya Bay , F. P. An et al., “Improved Search for a Light Sterile Neutrino with the Full Configuration of the Daya Bay Experiment,” Phys. Rev. Lett. 117 (2016) no. 15, 151802, arXiv:1607.01174 [hep-ex].
- (31) Y. Declais et al., “Search for neutrino oscillations at 15-meters, 40-meters, and 95-meters from a nuclear power reactor at Bugey,” Nucl. Phys. B 434 (1995) 503–534.
- (32) MINOS+, Daya Bay , P. Adamson et al., “Improved Constraints on Sterile Neutrino Mixing from Disappearance Searches in the MINOS, MINOS+, Daya Bay, and Bugey-3 Experiments,” Phys. Rev. Lett. 125 (2020) no. 7, 071801, arXiv:2002.00301 [hep-ex].
- (33) M. Dentler, A. Hernández-Cabezudo, J. Kopp, P. A. N. Machado, M. Maltoni, I. Martinez-Soler, and T. Schwetz, “Updated Global Analysis of Neutrino Oscillations in the Presence of eV-Scale Sterile Neutrinos,” JHEP 08 (2018) 010, arXiv:1803.10661 [hep-ph].
- (34) Super-Kamiokande , K. Abe et al., “Limits on sterile neutrino mixing using atmospheric neutrinos in Super-Kamiokande,” Phys. Rev. D 91 (2015) 052019, arXiv:1410.2008 [hep-ex].
- (35) IceCube , M. G. Aartsen et al., “Search for sterile neutrino mixing using three years of IceCube DeepCore data,” Phys. Rev. D 95 (2017) no. 11, 112002, arXiv:1702.05160 [hep-ex].
- (36) DUNE , B. Abi et al., “Deep Underground Neutrino Experiment (DUNE), Far Detector Technical Design Report, Volume II: DUNE Physics,” arXiv:2002.03005 [hep-ex].
- (37) Hyper-Kamiokande , K. Abe et al., “Hyper-Kamiokande Design Report,” arXiv:1805.04163 [physics.ins-det].
- (38) J. M. Berryman, A. de Gouvêa, K. J. Kelly, and A. Kobach, “Sterile neutrino at the Deep Underground Neutrino Experiment,” Phys. Rev. D 92 (2015) no. 7, 073012, arXiv:1507.03986 [hep-ph].
- (39) K. J. Kelly, “Searches for new physics at the Hyper-Kamiokande experiment,” Phys. Rev. D 95 (2017) no. 11, 115009, arXiv:1703.00448 [hep-ph].