X-ray observation of the Roche-lobe filling white dwarf plus hot subdwarf system ZTF J213056.71+442046.5
Abstract
ZTF J213056.71+442046.5 is the prototype of a small class of recently discovered compact binaries composed of a white dwarf and a hot subdwarf that fills its Roche-lobe. Its orbital period of only 39 min is the shortest known for the objects in this class. Evidence for a high orbital inclination (=86∘) and for the presence of an accretion disk has been inferred from a detailed modeling of its optical photometric and spectroscopic data. We report the results of an XMM-Newton observation carried out on 2021 January 7. ZTF J213056.71+442046.5 was clearly detected by the Optical Monitor, which showed a periodic variability in the UV band (200-400 nm), with a light curve similar to that seen at longer wavelengths. Despite accretion on the white dwarf at an estimated rate of the order of 10-9 yr-1, no X-rays were detected with the EPIC instrument, with a limit of 1030 erg s-1 on the 0.2-12 keV luminosity. We discuss possible explanations for the lack of a strong X-ray emission from this system.
1 Introduction
A class of close binary systems consisting of Roche-lobe filling hot subdwarfs with white dwarf (WD) companions has been recently identified thanks to optical surveys devoted to the discovery of transient and variable sources (Kupfer et al., 2020a). Hot subdwarfs (see Heber 2016, for a review) are low mass stars (0.3–0.8 ), spectrally classified as sdO or sdB based on their effective temperature above or below 38 kK, respectively. They are believed to originate from the evolution of stars that have lost most of their envelopes during the red-giant phase. One of the possible mechanisms responsible for the loss of the massive hydrogen envelopes necessary to form hot subdwarfs, is non-conservative mass transfer in a binary. This is observationally supported by the large number of hot subdwarfs, particularly of sdB type, found in close binary systems (Morales-Rueda et al., 2003; Napiwotzki et al., 2004). Evolutionary models predict that most of the companions of sdB stars in systems with orbital periods shorter than 10 days should be either late type main sequence stars or WDs (Han et al., 2002, 2003).
Hot subdwarfs with WD companions are particularly interesting because they might be among the progenitors of type Ia supernovae (Iben & Tutukov, 1994) and some of the nearby systems with ultrashort orbital period are expected to be sources of gravitational waves detectable by LISA (Kupfer et al., 2018). Furthermore, the determination of the mass and evolutionary stage of the two components, as done, e.g., for KPD 0422+5421 (Orosz & Wade, 1999), KPD 1930+2752 (Geier et al., 2007), and HD 49798 (Mereghetti et al., 2009), can shed light on the poorly known processes that take place during the common-envelope evolutionary phase.
The hot subdwarfs with WD companions that exit the common-envelope phase at orbital periods hr will reach contact while the sdB is still burning He (Bauer & Kupfer, 2021). Due to the emission of gravitational waves, the orbit will shrink until the sdB star fills its Roche-lobe at an orbital period dependent on the evolutionary stage of the subdwarf (Iben & Tutukov, 1991; Yungelson, 2008). The known population of sdB binaries consists mostly of systems with orbital periods too large to start accretion before the sdB turns into a WD (Kupfer et al., 2015). Until recently, only five binaries of this kind with 2 hr were known (Vennes et al., 2012; Kupfer et al., 2017a, b; Pelisoli et al., 2021; Kupfer et al., 2022). The sdBs in these systems do not fill their Roche-lobe. X-ray observations of one of them (CD –30∘ 11223, =70 min) provided an upper limit on the X-ray luminosity indicating a wind mass-loss rate from the sdB star lower than yr-1 (Mereghetti et al., 2014).
The first Roche-lobe filling subdwarf with a WD companion, ZTF J213056.71+442046.5 (hereafter ZTF J2130, Kupfer et al. 2020b) was identified in a search for periodic objects in a catalog of 40,000 hot subdwarf candidates (Geier et al., 2019) and first discovered in a dedicated high-cadence survey with the Zwicky Transient Facility (Bellm et al., 2019). ZTF J2130 consists of a sdB star with mass and radius 0.130.1 and a WD of . The orbital period of this system, = 39 min (also independently discovered by G. Murawski111https://www.aavso.org/vsx/index.php?view=detail.top&oid=689728), is the shortest of any known hot subdwarf binary. The radial velocity curve of ZTF J2130 indicates a circular orbit with a velocity semi-amplitude = 429 28 km s-1. The periodic variability is primarily caused by the ellipsoidal modulation of the subdwarf, due to its tidal deformation under the gravitational influence of the companion. However, the optical light-curve cannot be described with a simple model composed of two detached stars.
Kupfer et al. (2020b) showed that the subdwarf in this system fills its Roche-lobe and the WD is surrounded by an optically thick accretion disk of size . The formation of a disk is not surprising in a Roche-lobe filling system, and its presence suggests the possible emission of accretion-powered X-rays. A short pointing (1 ks) carried out with the X-ray Telescope on the Neil Gehrels Swift Observatory in 2019 did not detect X-rays (Rivera Sandoval et al., 2019), giving a flux upper limit of the order of a few 10-13 erg cm-2 s-1. Here we report on a much deeper observation of ZTF J2130 obtained with the XMM-Newton satellite. In the following we use the source distance of 1.29 kpc, derived from the Gaia EDR3 parallax (Bailer-Jones et al., 2021).
2 Data analysis and results
The field of ZTF J2130 was observed with the XMM-Newton satellite for about 65 ks starting at 23:47 UT of 2021 January 6. We used the X-ray data obtained with the EPIC instrument, comprising one pn (Strüder et al., 2001) and two MOS cameras (Turner et al., 2001) operating in the 0.2–12 keV energy range, and with the Optical Monitor (OM, Mason et al. 2001). The three EPIC cameras were used in full frame mode with the thin optical filter. The OM provided data in the UVW1 band (=291 nm, = 83 nm) for the first 26.4 ks and in the UVW2 band (=212 nm, =50 nm ) for the remaining part of the observation. All the data were processed with Version 19.0.0 of the Science Analysis Software (sas)222https://xmm-tools.cosmos.esa.int/external/xmm_user_support/ documentation/sas_usg/USG/.
2.1 EPIC X-ray data
The EPIC data were affected by periods of high background caused by soft proton flares. Removing the corresponding time intervals resulted in net exposure times of 31 ks for the pn and 37 ks for the MOS. We extracted images from the three cameras in five different energy ranges (0.2-0.5, 0.5-1, 1-2, 2-4.5, and 4.5-12 keV), both using the cleaned data and the whole observation. Many sources were clearly visible in these images, but none at the position of ZTF J2130.
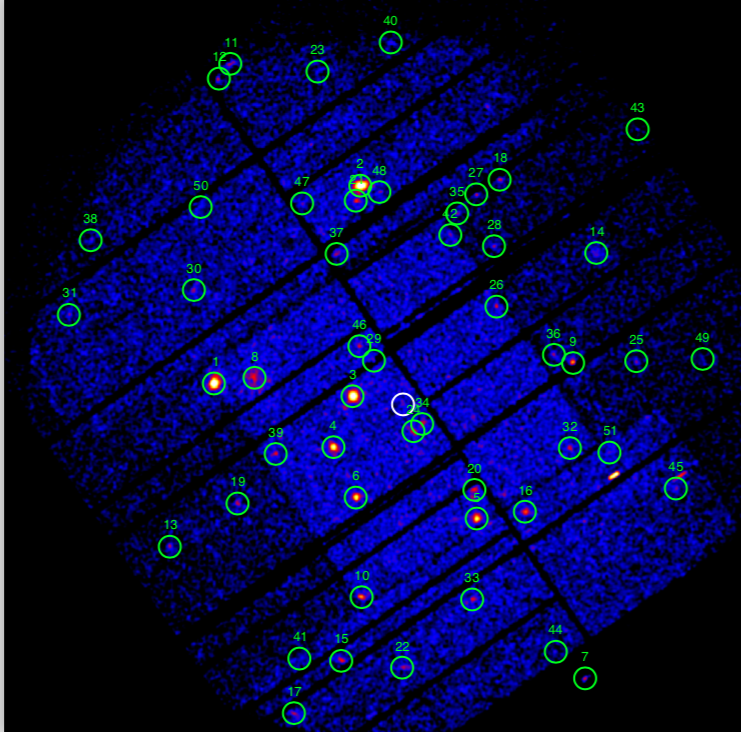
We performed a more detailed analysis by means of a source detection procedure over the whole field of view using the data of the three cameras simultaneously. This was done in the five energy bands given above using the SAS task edetect_chain333https://xmm-tools.cosmos.esa.int/external/sas/current/ doc/edetect_chain/index.html, as described in the Appendix, and resulted in the detection of 51 sources (see Table 2) above a threshold likelihood = 10, corresponding to a confidence level of 99.9955 %. ZTF J2130 was not detected and we derived an upper limit of 1.68 counts ks-1 on its count rate in the 0.2-12 keV energy range (with a threshold likelihood = 8, i.e. 99.97 % confidence level). The limits in the 0.2-0.5 and 0.5-4.5 keV ranges were 0.69 and 1.34 counts ks-1, respectively.
2.2 OM ultraviolet data
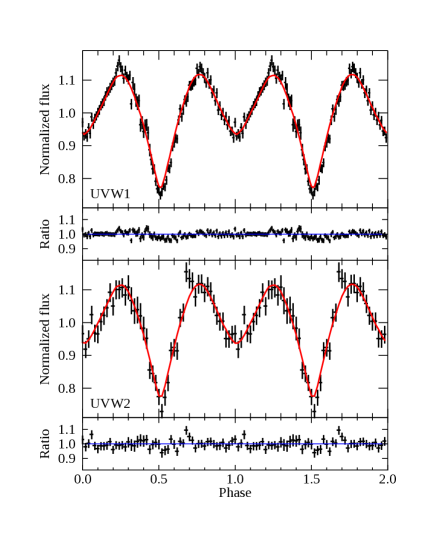
ZTF J2130 was clearly detected by the OM, with average count rates of 22 counts s-1 in the UVW1 filter (291 nm) and 2.5 counts s-1 in the UVW2 filter (212 nm) (Table 1). Figure 1 shows the OM light curves in the two filters folded at the orbital period according to the ephemeris of Kupfer et al. (2020b). In both filters, the orbital modulation is consistent with that seen in the optical band, as it is shown by the superimposed solid lines representing the profiles obtained in the g-band with HiPERCAM (Kupfer et al., 2020b). Some small residuals remain. These are most likely to be indicating factor of variability in the accretion disc flux.
A search of periodicities was performed using the OM-UVW1 data, but the periodogram did not reveal any additional periodicity beyond the known orbital period of 39 min.
| Instrument | Band | Exposure | Mean Magnitude | Flux | Luminosity | |
| (nm) | (ks) | (Vega) | erg cm-2 s-1 | erg s-1 | ||
| OM | 291 | 26.4 | ||||
| OM | 212 | 37.32 | ||||
| EPIC | 0.2-12 keV | – | 31 (pn), 37 (MOS) | – |
3 Discussion
Given the well known distance of ZTF J2130, the most important factors affecting the conversion of the count rate upper limits derived in Section 2.1 to an upper limit on the luminosity are the spectral shape assumed for the X-ray emission and the amount of interstellar absorption. Accreting WDs have complex X-ray spectra, with different components depending on many factors, including, e.g., the WD mass and magnetic field, the geometry of the accretion flow, the binary orientation wrt the line of sight (see, e.g., Mukai 2017, for a review). Optically thin thermal emission originates from the shocked plasma, which in magnetic WDs is usually channeled in an accretion column. Depending on the plasma temperature, significant line emission can be present, in addition to the continuum bremsstrahlung flux. Part of the emission from the accretion column can heat the star surface and will then be re-radiated as an optically thick soft thermal component. Other spectral components can arise from Compton reflection of the hardest X-rays, from the inner part of an accretion disk, from the boundary layer, and from a hot corona above the disk. Detailed models for many of these emission components have been developed, but for our purpose it is sufficient to adopt two simple models, blackbody and thermal bremsstrahlung, which provide an adequate phenomenological description of the hard and soft components observed in accreting WDs.
The 3-D extinction maps of Green et al. (2019) give a reddening of =0.18 at the distance of ZTF J2130. This corresponds to 0.6 mag, which, using the relation between and interstellar absorption derived by Bahramian et al. (2015), gives =1.7 cm-2. This value is consistent with the upper limit provided by the total column density in this direction, =2.41021 cm-2 (HI4PI Collaboration et al., 2016).
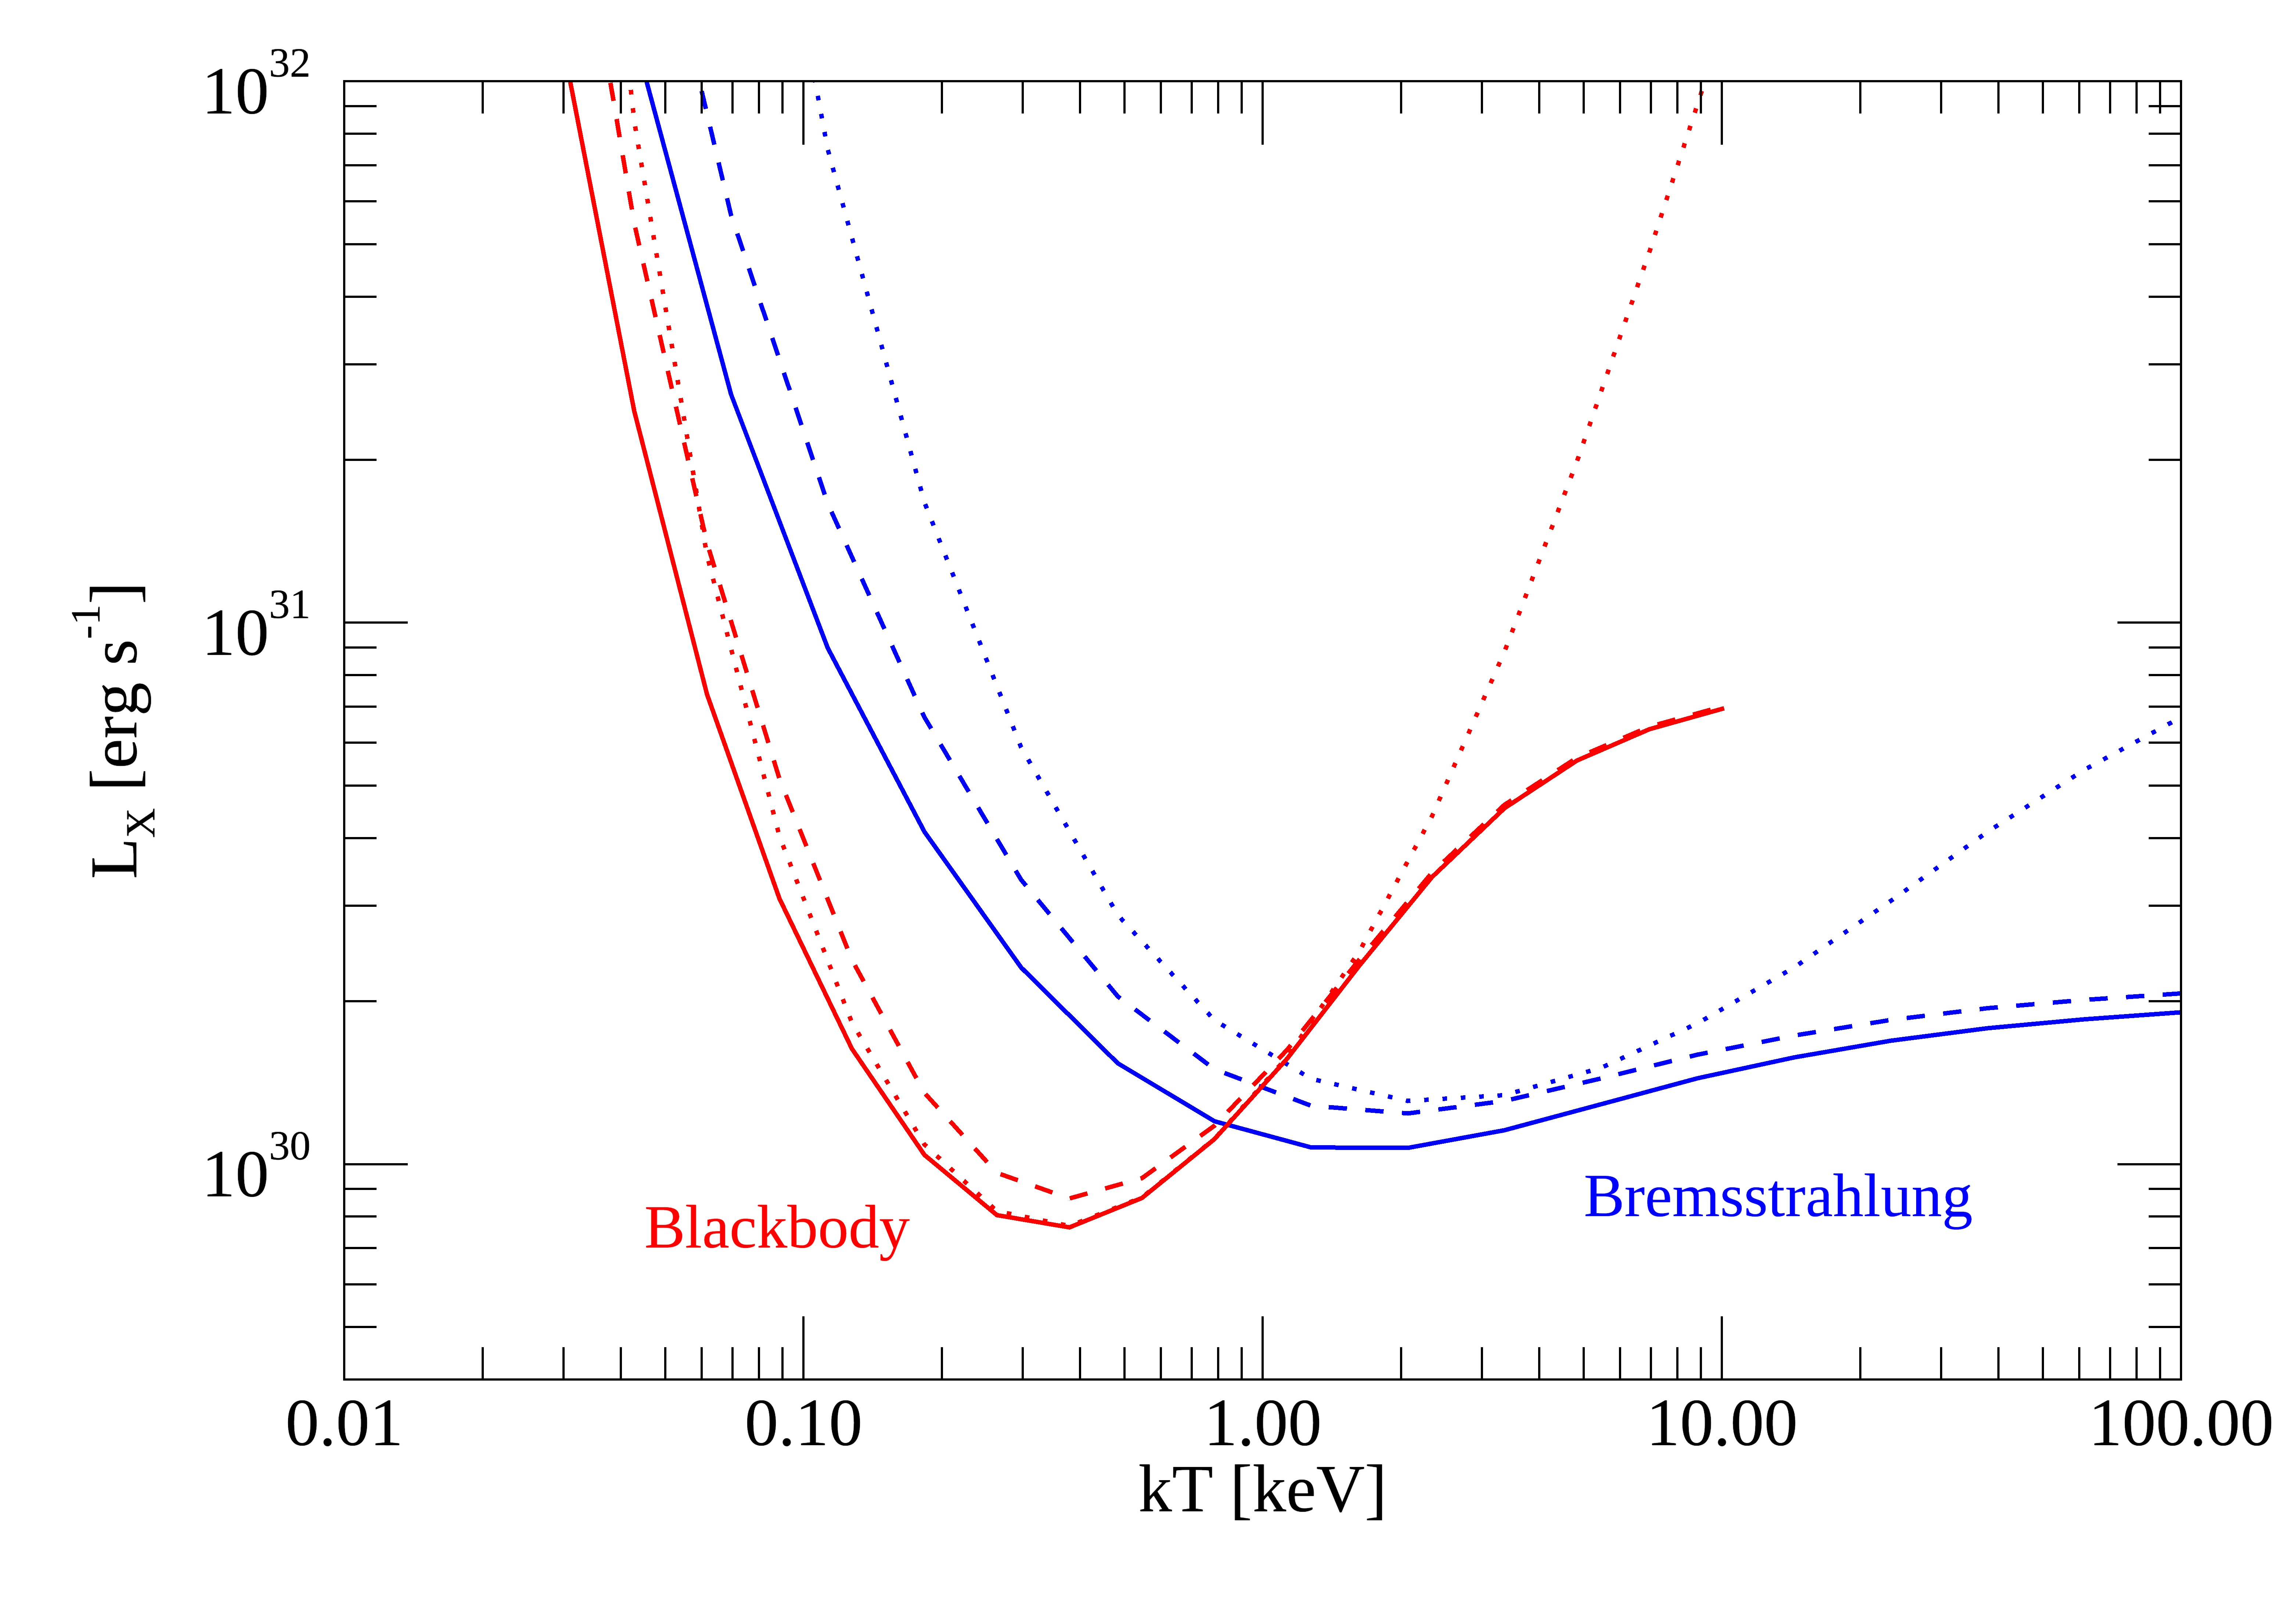
Therefore, we computed the count rate to flux conversion factors for blackbody and thermal bremsstrahlung models and two representative values of absorption (the nominal and the maximum values, 1.7 and 2.4 cm-2, respectively). This was done using the response matrix for the EPIC instrument (i.e. the sum of the pn and two MOS) computed for the position of ZTF J2130 in the instrument field of view. The resulting upper limits on the luminosity are plotted as a function of the spectral temperature in Fig. 2. Except for the case of very soft spectral shapes, for which most of the emission falls outside the energy range sampled by the EPIC instrument, the limits are quite constraining and indicate a luminosity below erg s-1 for a wide range of assumed temperature values.
By modeling the evolutionary history of ZTF J2130, Kupfer et al. (2020b) estimated that the WD in this system is accreting at a rate of yr-1. Taken at face value, this would imply an accretion-powered luminosity of
| (1) |
where G is the gravitational constant, is the mass accretion rate in units of 10-9 yr-1, and we used the values of =0.545 and =9400 km appropriate for this WD. This luminosity is orders of magnitude larger than the upper limit derived with XMM-Newton, but there are possible explanations for the lack of detectable X-ray emission in ZTF J2130.
First, it must be considered that about half of the accretion power is dissipated in the accretion disk, which is too cold to emit in the X-ray band. Most of the disk luminosity occurs at IR/optical/UV wavelengths and is outshined by the much brighter emission from the hot subdwarf present in this system. The latter has an effective temperature of 42,400 K and a bolometric luminosity of 419 . From the absence of optical emission lines, Kupfer et al. (2020b) concluded that the accretion disk contributes at most 3% of the overall luminosity, which is consistent with the above estimate of Lacc.
X-rays from accreting WDs can be emitted from the boundary layer between the disk and the star surface or, in the case of intermediate polars, where the magnetic field is sufficiently strong to channel the accretion flow, from the shocked plasma in the accretion column. In this case, the maximum plasma temperature in the post shock region is an increasing function of the WD mass. A simple estimate (e.g. Frank et al. 2002) is
| (2) |
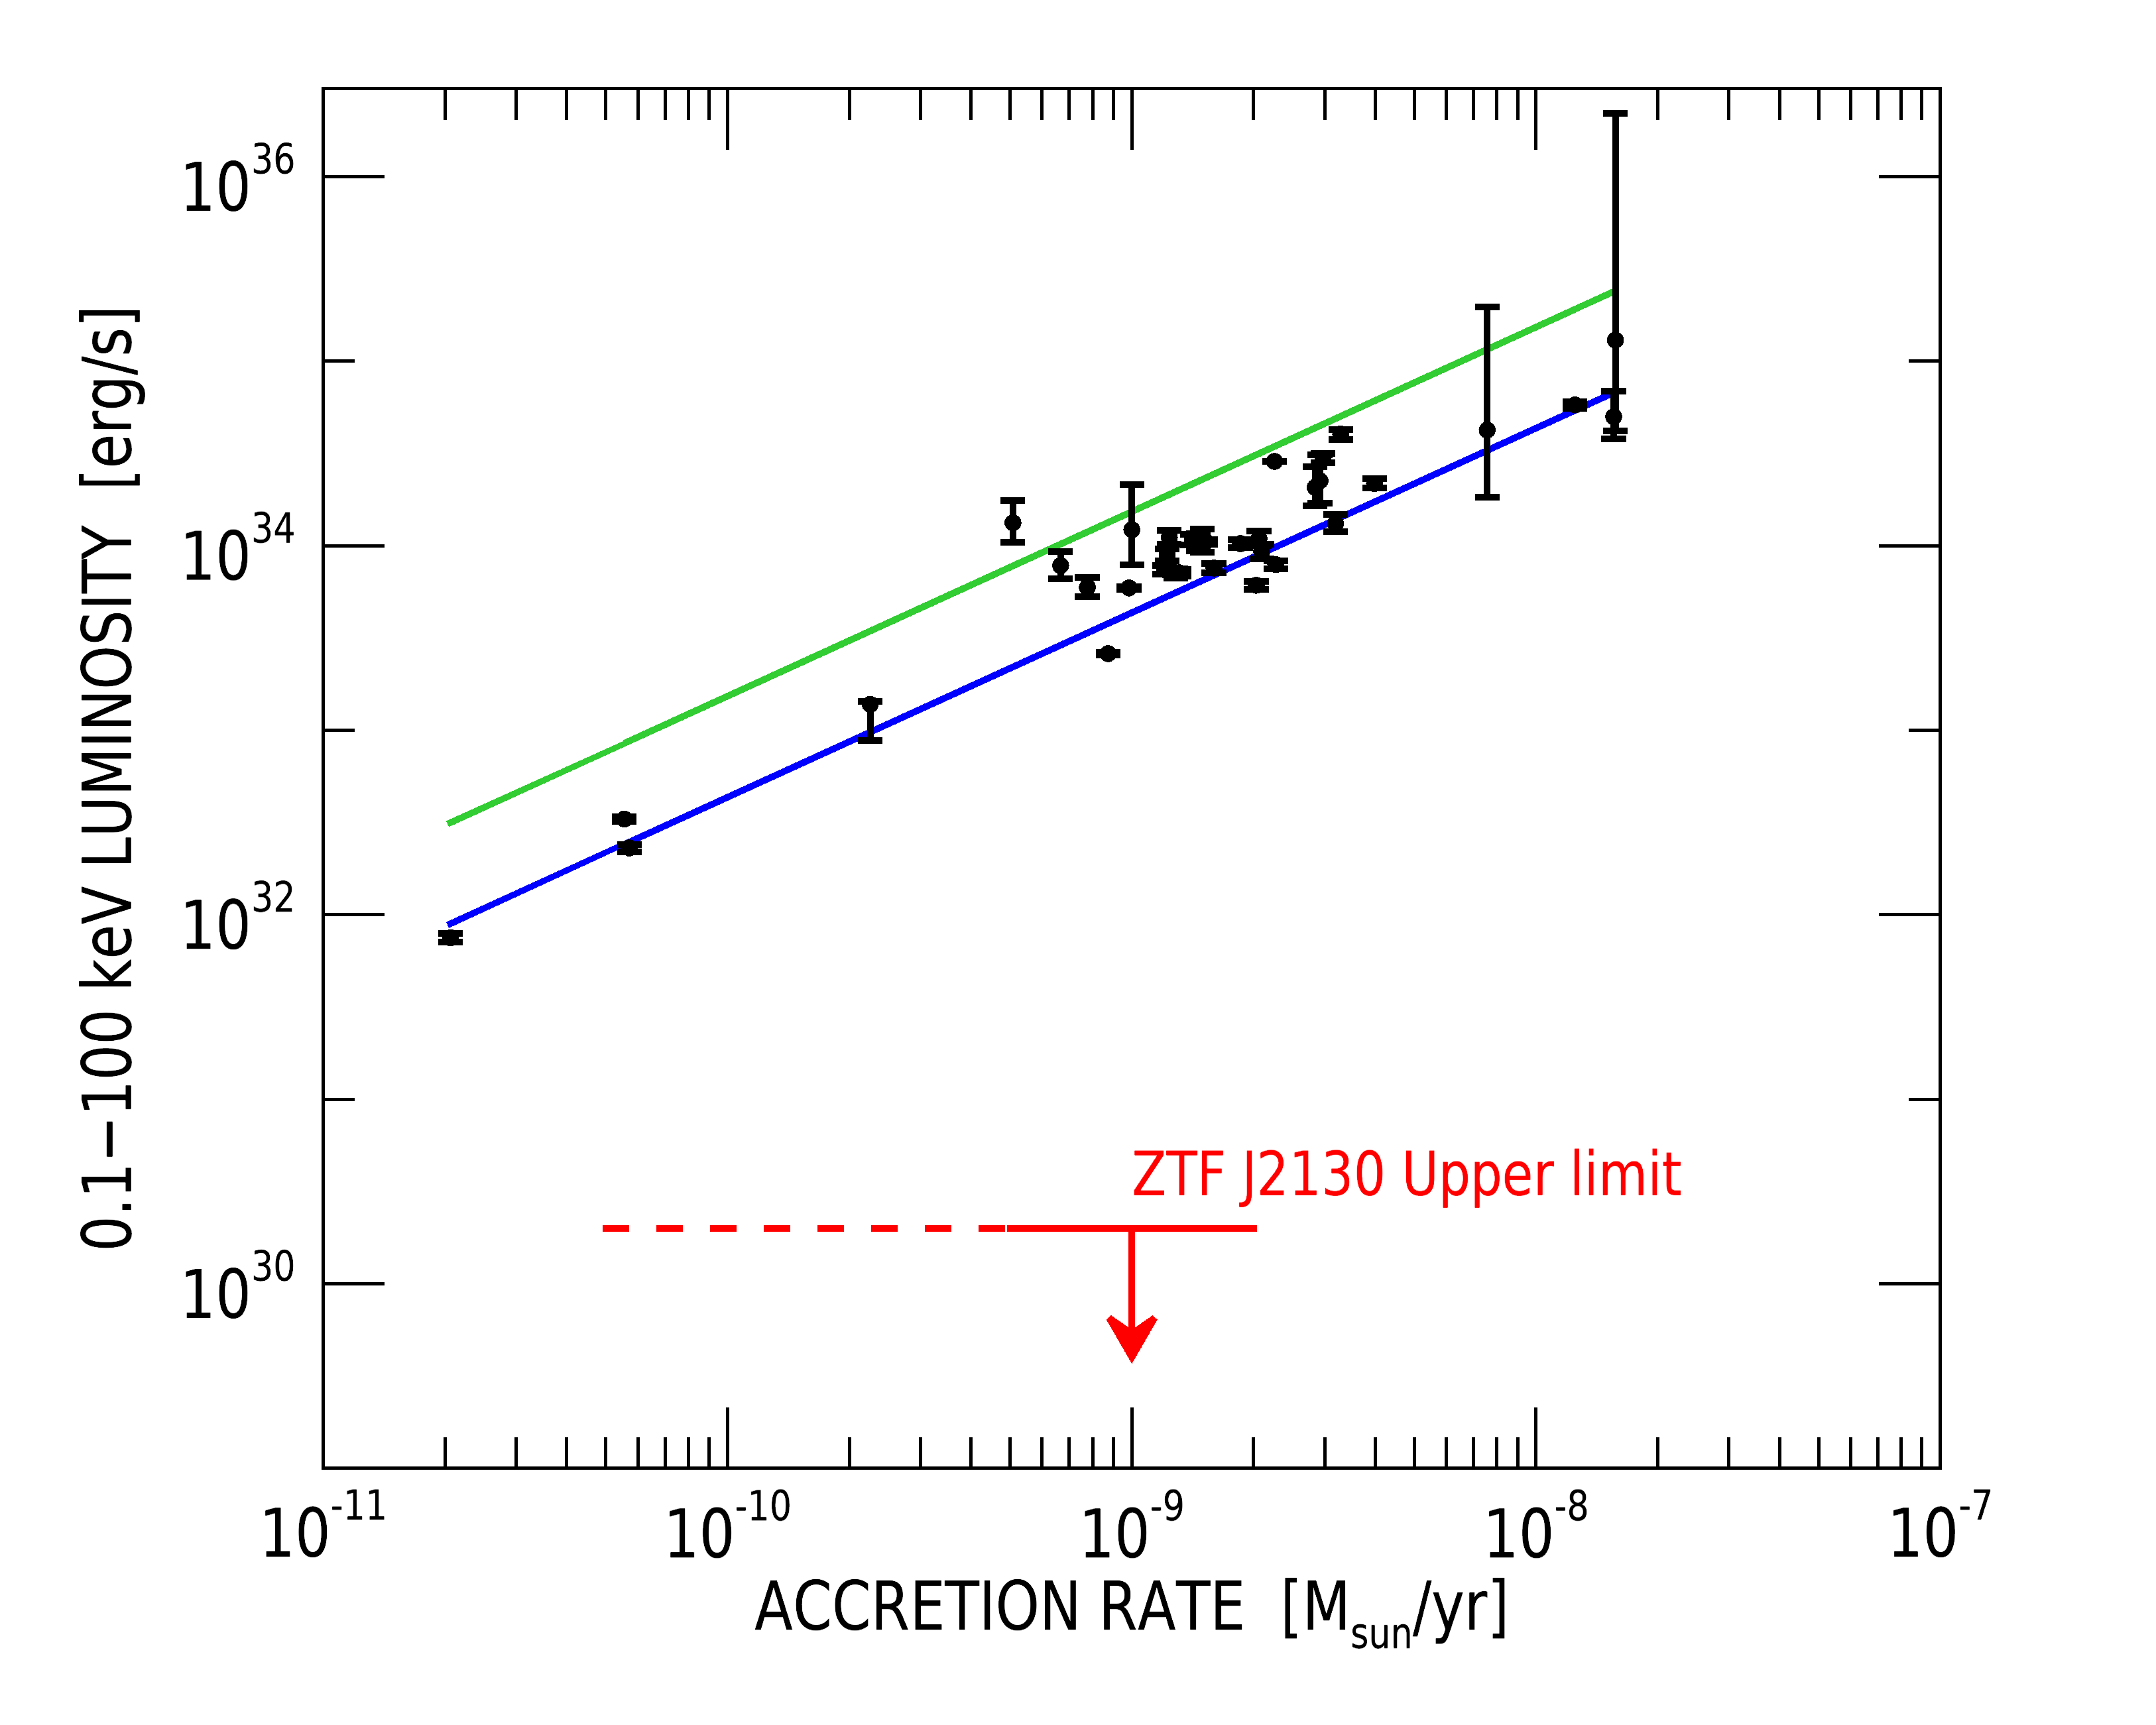
which gives kT = 19 keV for ZTF J2130 (mp is the proton mass and we used a mean molecular weight =0.615). Our luminosity upper limit for a thermal bremsstrahlung spectrum of this temperature is compared in Fig. 3 with the luminosities of a sample of intermediate polars observed in the hard X-ray range (Suleimanov et al., 2019). It is clear that, even if the mass accretion rate derived by Kupfer et al. (2020b) were overestimated by up to a factor 100, the XMM-Newton limit implies a luminosity much lower than that of intermediate polars, that disfavors the presence of a magnetic WD in this system.
If the WD in ZTF J2130 has a low magnetic field, the available accretion power is mainly released in the boundary layer between the disk and the star, which might be optically thick, and from the heated WD surface. The resulting spectrum would peak at soft X-ray/EUV energies and thus escape detection in the energy range covered by the EPIC instrument. Considering the high inclination of this system, it is also possible that the emitting region is occulted by the accretion disk. In this respect, it is interesting to note the anticorrelation between soft X-ray luminosity and inclination found in non-magnetic cataclysmic variables by van Teeseling et al. (1996).
Finally, we note the possibility that the accretion rate derived from the evolutionary model used by Kupfer et al. (2020b) has been overestimated. An evolutionary phase with accretion rate at yr-1 is required to explain the current properties of this system, but it is possible that this phase is now ending and the sdOB has already started to shrink and underfill the Roche lobe.
4 Conclusions
ZTF J2130 is the WD with a hot subdwarf binary companion with the shortest known orbital period. The evidence, derived from optical observations, for an accretion disk around the WD, caused by Roche-lobe overflow of its sdB companion, motivated a search for X-ray emission.
Our XMM-Newton observation, despite reaching a flux limit more than two orders of magnitude below the previously available one, could not reveal X-ray emission. The luminosity upper limit is in the range (0.5–2.5) erg s-1, depending on the assumed spectral temperature. For the hard Bremsstrahlung spectra typical of accreting magnetic WDs, this limit is significantly below the luminosity expected from the mass accretion rate of yr-1 deduced from the evolution model of this binary. This suggests that ZTF J2130 contains a non-magnetic WD, that can have a luminosity up to a few erg s-1, consistent with the theoretical accretion rate, but characterized by a soft spectrum peaking in the EUV range and thus undetectable by X-ray observatories. Alternative explanations for the lack of observable X-rays are either intrinsic absorption in the system, due to its high inclination (=86∘), or an overestimate of the current accretion rate implying that the Roche-lobe filling phase is nearly ending.
References
- Bahramian et al. (2015) Bahramian, A., Heinke, C. O., Degenaar, N., et al. 2015, MNRAS, 452, 3475, doi: 10.1093/mnras/stv1585
- Bailer-Jones et al. (2021) Bailer-Jones, C. A. L., Rybizki, J., Fouesneau, M., Demleitner, M., & Andrae, R. 2021, AJ, 161, 147, doi: 10.3847/1538-3881/abd806
- Bauer & Kupfer (2021) Bauer, E. B., & Kupfer, T. 2021, ApJ, 922, 245, doi: 10.3847/1538-4357/ac25f0
- Bellm et al. (2019) Bellm, E. C., Kulkarni, S. R., Graham, M. J., et al. 2019, PASP, 131, 018002, doi: 10.1088/1538-3873/aaecbe
- Frank et al. (2002) Frank, J., King, A., & Raine, D. J. 2002, Accretion Power in Astrophysics: Third Edition
- Gaia Collaboration et al. (2016) Gaia Collaboration, Prusti, T., de Bruijne, J. H. J., et al. 2016, A&A, 595, A1, doi: 10.1051/0004-6361/201629272
- Gaia Collaboration et al. (2021) Gaia Collaboration, Brown, A. G. A., Vallenari, A., et al. 2021, A&A, 649, A1, doi: 10.1051/0004-6361/202039657
- Geier et al. (2007) Geier, S., Nesslinger, S., Heber, U., et al. 2007, A&A, 464, 299, doi: 10.1051/0004-6361:20066098
- Geier et al. (2019) Geier, S., Raddi, R., Gentile Fusillo, N. P., & Marsh, T. R. 2019, A&A, 621, A38, doi: 10.1051/0004-6361/201834236
- Green et al. (2019) Green, G. M., Schlafly, E., Zucker, C., Speagle, J. S., & Finkbeiner, D. 2019, ApJ, 887, 93, doi: 10.3847/1538-4357/ab5362
- Han et al. (2003) Han, Z., Podsiadlowski, P., Maxted, P. F. L., & Marsh, T. R. 2003, MNRAS, 341, 669, doi: 10.1046/j.1365-8711.2003.06451.x
- Han et al. (2002) Han, Z., Podsiadlowski, P., Maxted, P. F. L., Marsh, T. R., & Ivanova, N. 2002, MNRAS, 336, 449, doi: 10.1046/j.1365-8711.2002.05752.x
- Heber (2016) Heber, U. 2016, PASP, 128, 082001, doi: 10.1088/1538-3873/128/966/082001
- HI4PI Collaboration et al. (2016) HI4PI Collaboration, Ben Bekhti, N., Flöer, L., et al. 2016, A&A, 594, A116, doi: 10.1051/0004-6361/201629178
- Høg et al. (2000) Høg, E., Fabricius, C., Makarov, V. V., et al. 2000, A&A, 355, L27
- Iben & Tutukov (1994) Iben, I. J., & Tutukov, A. V. 1994, ApJ, 431, 264, doi: 10.1086/174484
- Iben & Tutukov (1991) Iben, Icko, J., & Tutukov, A. V. 1991, ApJ, 370, 615, doi: 10.1086/169848
- Kupfer et al. (2015) Kupfer, T., Geier, S., Heber, U., et al. 2015, A&A, 576, A44, doi: 10.1051/0004-6361/201425213
- Kupfer et al. (2017a) Kupfer, T., van Roestel, J., Brooks, J., et al. 2017a, ApJ, 835, 131, doi: 10.3847/1538-4357/835/2/131
- Kupfer et al. (2017b) Kupfer, T., Ramsay, G., van Roestel, J., et al. 2017b, ApJ, 851, 28, doi: 10.3847/1538-4357/aa9522
- Kupfer et al. (2018) Kupfer, T., Korol, V., Shah, S., et al. 2018, MNRAS, 480, 302, doi: 10.1093/mnras/sty1545
- Kupfer et al. (2020a) Kupfer, T., Bauer, E. B., Burdge, K. B., et al. 2020a, ApJ, 898, L25, doi: 10.3847/2041-8213/aba3c2
- Kupfer et al. (2020b) Kupfer, T., Bauer, E. B., Marsh, T. R., et al. 2020b, ApJ, 891, 45, doi: 10.3847/1538-4357/ab72ff
- Kupfer et al. (2022) Kupfer, T., Bauer, E. B., van Roestel, J., et al. 2022, ApJ, 925, L12, doi: 10.3847/2041-8213/ac48f1
- Lasker et al. (2008) Lasker, B. M., Lattanzi, M. G., McLean, B. J., et al. 2008, AJ, 136, 735, doi: 10.1088/0004-6256/136/2/735
- Mason et al. (2001) Mason, K. O., Breeveld, A., Much, R., et al. 2001, A&A, 365, L36, doi: 10.1051/0004-6361:20000044
- Mereghetti et al. (2014) Mereghetti, S., La Palombara, N., Esposito, P., et al. 2014, MNRAS, 441, 2684, doi: 10.1093/mnras/stu773
- Mereghetti et al. (2009) Mereghetti, S., Tiengo, A., Esposito, P., et al. 2009, Science, 325, 1222, doi: 10.1126/science.1176252
- Morales-Rueda et al. (2003) Morales-Rueda, L., Maxted, P. F. L., Marsh, T. R., North, R. C., & Heber, U. 2003, MNRAS, 338, 752, doi: 10.1046/j.1365-8711.2003.06088.x
- Mukai (2017) Mukai, K. 2017, PASP, 129, 062001, doi: 10.1088/1538-3873/aa6736
- Napiwotzki et al. (2004) Napiwotzki, R., Karl, C. A., Lisker, T., et al. 2004, Ap&SS, 291, 321, doi: 10.1023/B:ASTR.0000044362.07416.6c
- Orosz & Wade (1999) Orosz, J. A., & Wade, R. A. 1999, MNRAS, 310, 773, doi: 10.1046/j.1365-8711.1999.02989.x
- Pelisoli et al. (2021) Pelisoli, I., Neunteufel, P., Geier, S., et al. 2021, Nature Astronomy, 5, 1052, doi: 10.1038/s41550-021-01413-0
- Rivera Sandoval et al. (2019) Rivera Sandoval, L. E., Maccarone, T., & Murawski, G. 2019, The Astronomer’s Telegram, 12847, 1
- Rosen et al. (2016) Rosen, S. R., Webb, N. A., Watson, M. G., et al. 2016, A&A, 590, A1, doi: 10.1051/0004-6361/201526416
- Strüder et al. (2001) Strüder, L., Briel, U., Dennerl, K., & et al. 2001, A&A, 365, L18, doi: 10.1051/0004-6361:20000066
- Suleimanov et al. (2019) Suleimanov, V. F., Doroshenko, V., & Werner, K. 2019, MNRAS, 482, 3622, doi: 10.1093/mnras/sty2952
- Turner et al. (2001) Turner, M. J. L., Abbey, A., Arnaud, M., & et al. 2001, A&A, 365, L27, doi: 10.1051/0004-6361:20000087
- van Teeseling et al. (1996) van Teeseling, A., Beuermann, K., & Verbunt, F. 1996, A&A, 315, 467
- Vennes et al. (2012) Vennes, S., Kawka, A., O’Toole, S. J., Németh, P., & Burton, D. 2012, ApJ, 759, L25, doi: 10.1088/2041-8205/759/1/L25
- Yungelson (2008) Yungelson, L. R. 2008, Astronomy Letters, 34, 620, doi: 10.1134/S1063773708090053
We performed the detection, characterization, and identification of the several X-ray sources present in the EPIC images of the sky region around ZTF. To this aim, we applied the SAS task edetect_chain, with the default configuration and input parameters, using the images in five energy ranges (0.2-0.5, 0.5-1, 1-2, 2-4.5, and 4.5-12 keV) of the three EPIC cameras simultaneously. This resulted in the detection of 51 distinct sources (Fig. 4). For each of them we obtained the X-ray position and its uncertainty, the detection likelihood (defined as L = -lnP, where P is the probability of a spurious detection due to a Poissonian random fluctuation of the background) and the determination of its point or extended nature. We derived the source fluxes from the measured count rates assuming the same absorbed power-law model (with photon index = 1.7 and hydrogen column density = 3 cm-2) used in the 3XMM source catalogue (Rosen et al., 2016).
We used the task eposcorr to correct the position of the detected sources, through their cross-correlation with the Gaia EDR3 source catalogue (Gaia Collaboration et al., 2016, 2021). The average RA and DEC correction offset applied to the X-ray positions was 2.26 and 1.60 arcsec, respectively.
The last step of our analysis was the identification of each detected source with a known optical counterpart, or at least the assessment of its stellar or non-stellar nature. We performed this task with the cross-correlation with two different optical catalogues. The first choice was again the Gaia EDR3 catalogue, which to date is the most complete and accurate optical catalogue. For each X-ray source, we looked for all Gaia sources closer than three times the uncertainty of the X-ray position: due to the high accuracy of the Gaia positions, this approach gives us high confidence that no potential Gaia counterpart is missed. In this way we found at least one candidate Gaia counterpart for only 29 of the sources. Therefore, we integrated our analysis by cross-correlating the X-ray sources (with the same criteria) also with the Guide Star Catalogue (GSC, Lasker et al. (2008))444http://gsss.stsci.edu/webservices/GSC2/WebForm.aspx, which also provides a tentative classification of the source nature555http://gsss.stsci.edu/Catalogs/GSC/GSC2/gsc23/gsc23_release_notes.htm#ClassificationCodes. We found a candidate GSC counterpart for 11 of the X-ray sources without Gaia counterparts. For 12 X-ray sources we found two or more candidate counterparts, while 11 X-ray sources remained uncorrelated to any optical counterpart.
In Table 2 we report the main parameters of the detected X-ray sources and of their candidate counterparts, together with the proposed identification. For each possible counterpart, we report the distance from the X-ray source, the source class given in the GSC catalogue (Star, Non-Star, or Unclassified), the magnitude type and value, and the estimated value and error (in logarithm) of the X-ray-to-optical flux ratio. Three of the brightest sources (#10, #13, and #17) can unambiguously be identified with a known bright optical source of the Tycho catalogue (Høg et al., 2000).
Two sources (#8 and #14) are clearly extended. The analysis of the EPIC images shows that they are clearly visible between 0.5 and 5 keV, while outside this energy range they are confused with the background signal. Since for both objects there is no clear identification, we investigated their spectrum in order to obtain additional information on their properties. In both cases the count rate is very low (2.7 and 7.8 cts s-1, respectively), so the count statistics is limited. The spectrum of source #8 is rather hard and extends up to 10 keV. It can be equally well described with a power-law model with a photon index 1.6, or with a collisionally-heated plasma emission model with a high temperature (kT 10 keV). With both models the estimated flux (in the energy range 0.2-10 keV) is erg cm-2 s-1. The high temperature of the thermal model suggests that the identification with a cluster of galaxies is unlikely. The hard power-law spectrum suggests a pulsar wind nebula nature, but no pulsars at this positions are known. The spectrum of source #14 is significantly softer: it can be described with either a power-law model with 2 or with a plasma model with kT 5 keV. Therefore, in this case the estimated plasma temperature is consistent with a cluster of galaxies or with a supernova remnant. However, the limited count statistics prevents to clearly discriminate between a thermal or non-thermal emission model. The estimated flux of this source is erg cm-2 s-1. In summary, based on the EPIC data, we cannot suggest any identification of these extended sources with a known class of X-ray sources.
| (1) | (2) | (3) | (4) | (5) | (6) | (7) | (8) | (9) | (10) | (11) | (12) | (13) | (14) |
|---|---|---|---|---|---|---|---|---|---|---|---|---|---|
| N | RAX | DECX | ERR | CR | Flux ( | Detection | Extended | Class | Magnitude | X/O ratio | Counterpart | ||
| n/a | ∘ | ∘ | ” | cts s-1 | erg cm-2 s-1) | likelihood | source | ” | n/a | Type | Value | Log10 | |
| 1 | 322.9037 | 44.3588 | 0.2 | 0.119 0.004 | 12.50 0.38 | 3343.42 | NO | 0.5 | Star | GaiaG | 11.2 | -3.62 0.05 | Gaia EDR3 1970952112669846528 |
| 1RXS J213137.1+442125 | |||||||||||||
| 2 | 322.7730 | 44.4847 | 0.2 | 0.141 0.004 | 22.50 0.58 | 3254.26 | NO | 0.4 | Star | GaiaG | 14.4 | -2.07 0.04 | Gaia EDR3 1970957197911088256 |
| 3 | 322.7798 | 44.3510 | 0.2 | 0.061 0.002 | 6.25 0.18 | 2269.45 | NO | 0.2 | - | GaiaG | 14.3 | -2.68 0.01 | Gaia EDR3 1970951219316446848 |
| 4 | 322.7973 | 44.3185 | 0.4 | 0.024 0.001 | 7.11 0.37 | 537.44 | NO | 0.6 | Non-Star | SDSS_r | 22.4 | 1.38 0.14 | GSC2 N0331212284370 |
| 5 | 322.6702 | 44.2730 | 0.4 | 0.022 0.001 | 7.70 0.46 | 400.99 | NO | - | - | - | - | - | ? |
| 6 | 322.7772 | 44.2866 | 0.4 | 0.019 0.001 | 4.79 0.30 | 301.96 | NO | 0.5 | Non-Star | SDSS_g | 21.7 | 0.70 0.10 | GSC2 N0331212271069 |
| 7 | 322.5740 | 44.1716 | 0.6 | 0.016 0.002 | 9.42 0.90 | 199.27 | NO | - | - | - | - | - | ? |
| 8 | 322.8676 | 44.3626 | 1.0 | 0.073 0.005 | 14.20 1.05 | 194.75 | YES | 2.9 | Non-Star | SDSS_r | 21.4 | 1.30 0.15 | GSC2 N0331212285756 |
| 9 | 322.5840 | 44.3718 | 0.5 | 0.023 0.002 | 4.96 0.49 | 183.53 | NO | - | - | - | - | - | ? |
| 10 | 322.7726 | 44.2233 | 0.6 | 0.014 0.001 | 1.33 0.11 | 171.66 | NO | 1.2 | Star | GaiaG | 10.2 | -4.98 0.11 | TYC 3195-1291-1 |
| (Gaia EDR3 1970937647223334784) | |||||||||||||
| 11 | 322.8890 | 44.5620 | 0.8 | 0.042 0.005 | 23.70 2.90 | 154.79 | NO | 1.1 | Star | GaiaG | 14.9 | -1.85 0.14 | Gaia EDR3 1971050931274339456 |
| 12 | 322.8995 | 44.5525 | 0.9 | 0.021 0.005 | 7.74 1.92 | 112.35 | NO | 2.7 | Star | GaiaG | 18.6 | -0.87 0.44 | Gaia EDR3 1971050720812613632 |
| 13 | 322.9422 | 44.2552 | 0.9 | 0.011 0.001 | 0.98 0.12 | 94.56 | NO | 0.9 | Non-Star | SDSS_i | 14.7 | -2.44 0.29 | GSC2 N0331212310632 |
| 1.4 | Star | GaiaG | 11.4 | -4.62 0.29 | TYC 3195-1009-1 | ||||||||
| (Gaia EDR3 1970938781091225472) | |||||||||||||
| 2.0 | Non-Star | SDSS_g | 13.2 | -3.39 0.29 | GSC2 N0331212271457 | ||||||||
| 14 | 322.5631 | 44.4418 | 0.7 | 0.045 0.005 | 9.83 1.03 | 91.29 | YES | - | - | - | - | - | ? |
| 15 | 322.7897 | 44.1830 | 0.8 | 0.013 0.002 | 3.93 0.51 | 75.79 | NO | 0.7 | Star | GaiaG | 19.8 | -0.68 0.20 | Gaia EDR3 1970937372330018944 |
| 1.1 | - | GaiaG | 17.1 | -1.76 0.06 | Gaia EDR3 1970937372341684864 | ||||||||
| 16 | 322.6268 | 44.2773 | 0.7 | 0.010 0.001 | 5.43 0.61 | 70.91 | NO | 1.4 | Non-Star | SDSS_i | 21.8 | 1.15 0.10 | GSC2 N0331212276990 |
| 2.0 | Unclassified | WISE_w1 | 15.7 | - | GSC2 N0331212380540 | ||||||||
| 17 | 322.8324 | 44.1495 | 0.8 | 0.017 0.002 | 6.91 0.90 | 70.69 | NO | 0.8 | Non-Star | SDSS_r | 11.4 | -3.03 0.16 | GSC2 N0331212325476 |
| 1.3 | Star | GaiaG | 11.2 | -3.89 0.15 | TYC 3195-1810-1 | ||||||||
| (Gaia EDR3 1970936375909299712) | |||||||||||||
| 2.2 | Star | GaiaG | 19.5 | -0.56 0.15 | Gaia EDR3 1970936375899213440 | ||||||||
| 18 | 322.6491 | 44.4884 | 1.1 | 0.014 0.002 | 4.83 0.65 | 66.51 | NO | 1.3 | Non-Star | SDSS_g | 21.9 | 0.78 0.20 | GSC2 N0331212254829 |
| 19 | 322.8823 | 44.2828 | 0.9 | 0.009 0.001 | 2.60 0.35 | 62.60 | NO | 1.1 | Star | GaiaG | 16.8 | -2.07 0.20 | Gaia EDR3 1970939537005448064 |
| 20 | 322.6726 | 44.2914 | 0.9 | 0.008 0.001 | 0.76 0.09 | 54.98 | NO | 2.1 | Star | GaiaG | 16.3 | -2.80 0.27 | Gaia EDR3 1970944931484039552 |
| 21 | 322.7768 | 44.4750 | 0.9 | 0.010 0.001 | 1.44 0.21 | 47.15 | NO | 0.5 | Star | GaiaG | 18.8 | -1.52 0.36 | Gaia EDR3 1970956437691046144 |
| 22 | 322.7357 | 44.1784 | 0.9 | 0.014 0.002 | 2.25 0.36 | 44.78 | NO | - | - | - | - | - | ? |
| 23 | 322.8111 | 44.5572 | 1.3 | 0.011 0.002 | 0.59 0.13 | 37.34 | NO | 2.7 | Non-Star | SDSS_r | 21.7 | 0.01 0.96 | GSC2 N0331212239468 |
| 3.3 | Non-Star | SDSS_r | 21.6 | -0.03 0.96 | GSC2 N0331212254752 | ||||||||
| 3.3 | Non-Star | SDSS_i | 21.2 | -0.05 0.96 | GSC2 N0331212265386 | ||||||||
| 24 | 322.7257 | 44.3285 | 1.0 | 0.006 0.001 | 2.10 0.28 | 37.10 | NO | - | - | - | - | - | ? |
| 25 | 322.5279 | 44.3729 | 1.1 | 0.008 0.001 | 1.98 0.32 | 34.78 | NO | 2.0 | Star | GaiaG | 17.9 | -1.72 0.26 | Gaia EDR3 1970996157547913856 |
| 26 | 322.6523 | 44.4078 | 0.8 | 0.005 0.001 | 0.75 0.12 | 34.74 | NO | - | - | - | - | - | ? |
| 27 | 322.6700 | 44.4790 | 1.1 | 0.008 0.001 | 1.13 0.19 | 34.26 | NO | 0.7 | Star | GaiaG | 14.8 | -3.22 0.36 | Gaia EDR3 1971002827645828352 |
| 28 | 322.6544 | 44.4462 | 1.0 | 0.007 0.001 | 1.12 0.22 | 30.88 | NO | 2.2 | Non-Star | SDSS_g | 21.9 | 0.14 0.61 | GSC2 N0331212233476 |
| 29 | 322.7616 | 44.3734 | 0.9 | 0.007 0.003 | 2.82 0.98 | 29.88 | NO | 0.9 | Non-Star | SDSS_i | 22.0 | 0.94 0.39 | GSC2 N0331212287517 |
| 30 | 322.9213 | 44.4183 | 1.0 | 0.009 0.002 | 2.52 0.45 | 29.64 | NO | 2.7 | Star | GaiaG | 18.2 | -1.53 0.31 | Gaia EDR3 1970952524975861504 |
| 3.0 | Star | GaiaG | 13.3 | -3.48 0.31 | Gaia EDR3 1970952524986698624 | ||||||||
| 31 | 323.0323 | 44.4024 | 1.3 | 0.013 0.002 | 1.29 0.20 | 29.19 | NO | 2.5 | Star | GaiaG | 16.2 | -2.62 0.38 | Gaia EDR3 1971034266801276288 |
| 32 | 322.5873 | 44.3178 | 1.0 | 0.006 0.001 | 2.34 0.38 | 28.27 | NO | 1.6 | Non-Star | SDSS_i | 21.1 | 0.49 0.20 | GSC2 N0331212281960 |
| 33 | 322.6738 | 44.2218 | 1.0 | 0.007 0.001 | 1.10 0.17 | 27.42 | NO | 2.3 | Star | GaiaG | 20.1 | -1.13 0.29 | Gaia EDR3 1970944446140502272 |
| 34 | 322.7184 | 44.3332 | 0.9 | 0.004 0.001 | 0.60 0.09 | 25.85 | NO | 1.4 | Star | GaiaG | 17.3 | -2.48 0.24 | Gaia EDR3 1970950978798273920 |
| 35 | 322.6870 | 44.4670 | 1.1 | 0.008 0.001 | 4.28 0.78 | 23.26 | NO | 2.9 | Non-Star | SDSS_r | 21.6 | 0.85 0.17 | GSC2 N0331212262403 |
| 36 | 322.6012 | 44.3770 | 1.2 | 0.006 0.001 | 3.43 0.61 | 22.24 | NO | 1.6 | Star | GaiaG | 20.9 | -0.29 0.16 | Gaia EDR3 1970949260801367296 |
| 37 | 322.7944 | 44.4414 | 1.1 | 0.006 0.001 | 1.95 0.37 | 22.00 | NO | 1.7 | Star | GaiaG | 15.0 | -2.89 0.30 | Gaia EDR3 1970956167118744320 |
| 38 | 323.0129 | 44.4497 | 1.0 | 0.015 0.003 | 11.40 2.40 | 21.17 | NO | 2.9 | Star | GaiaG | 20.3 | -0.03 0.09 | Gaia EDR3 1971046292698993152 |
| 3.1 | Star | GaiaG | 17.9 | -1.00 0.17 | Gaia EDR3 1971046288408505344 | ||||||||
| 39 | 322.8485 | 44.3143 | 1.0 | 0.006 0.001 | 1.93 0.31 | 20.26 | NO | 1.8 | Non-Star | SDSS_g | 22.2 | 0.48 0.20 | GSC2 N0331212276215 |
| 40 | 322.7466 | 44.5755 | 2.3 | 0.011 0.004 | 7.22 2.36 | 17.86 | NO | 2.2 | Star | GaiaG | 15.3 | -2.24 0.35 | Gaia EDR3 1971004957949785728 |
| 2.6 | Non-Star | SDSS_g | 20.7 | 0.48 0.35 | GSC2 N0331212232458 | ||||||||
| 41 | 322.8268 | 44.1844 | 1.4 | 0.003 0.001 | 1.51 0.72 | 16.89 | NO | 2.2 | Star | GaiaG | 20.1 | -0.97 0.50 | Gaia EDR3 1970936650776371968 |
| 4.2 | Star | GaiaG | 20.0 | -1.04 0.50 | Gaia EDR3 1970936650787455744 | ||||||||
| 42 | 322.6930 | 44.4533 | 1.1 | 0.005 0.001 | 1.70 0.37 | 16.48 | NO | - | - | - | - | - | ? |
| 43 | 322.5266 | 44.5201 | 1.0 | 0.011 0.006 | 8.61 4.49 | 16.15 | NO | 2.1 | Non-Star | GaiaG | 21.1 | 0.16 0.23 | Gaia EDR3 1971006572852951296 |
| 44 | 322.6004 | 44.1886 | 1.3 | 0.004 0.001 | 0.40 0.14 | 15.54 | NO | - | - | - | - | - | ? |
| 45 | 322.4930 | 44.2919 | 1.1 | 0.007 0.001 | 1.70 0.35 | 15.06 | NO | - | - | - | - | - | ? |
| 46 | 322.7744 | 44.3828 | 1.0 | 0.004 0.001 | 1.34 0.24 | 15.00 | NO | 0.6 | - | GaiaG | 17.7 | -1.99 0.08 | Gaia EDR3 1970951528542823296 |
| 1.1 | Star | GaiaG | 20.1 | -1.04 0.21 | Gaia EDR3 1970951528554080768 | ||||||||
| 2.5 | Star | GaiaG | 20.9 | -0.73 0.21 | Gaia EDR3 1970951528543900544 | ||||||||
| 2.5 | Non-Star | SDSS_z | 19.8 | -0.18 0.21 | GSC2 N0331212259744 | ||||||||
| 47 | 322.8249 | 44.4733 | 1.3 | 0.006 0.002 | 4.47 1.05 | 13.65 | NO | - | - | - | - | - | ? |
| 48 | 322.7561 | 44.4806 | 1.2 | 0.005 0.001 | 0.35 0.08 | 11.87 | NO | 2.3 | Star | GaiaG | 17.0 | -2.87 0.92 | Gaia EDR3 1970957094831654784 |
| 3.5 | Star | GaiaG | 19.4 | -1.89 0.92 | Gaia EDR3 1970957094820313856 | ||||||||
| 49 | 322.4694 | 44.3742 | 2.0 | 0.006 0.001 | 0.87 0.20 | 10.76 | NO | 1.6 | Star | GaiaG | 18.9 | -1.68 0.38 | Gaia EDR3 1970996672943997568 |
| 50 | 322.9151 | 44.4709 | 2.4 | 0.008 0.002 | 2.14 0.50 | 10.68 | NO | 3.8 | Non-Star | SDSS_z | 20.5 | 0.30 0.37 | GSC2 N0331212267844 |
| 6.2 | Star | GaiaG | 18.3 | -1.55 0.37 | Gaia EDR3 1971047284838488704 | ||||||||
| 6.9 | Non-Star | SDSS_i | 20.6 | 0.26 0.37 | GSC2 N0331212251938 | ||||||||
| 51 | 322.5518 | 44.3149 | 1.5 | 0.006 0.002 | 3.45 0.93 | 10.03 | NO | 3.0 | Star | GaiaG | 16.3 | -2.13 0.18 | Gaia EDR3 1970948504896789632 |
Note. — Column description: (1) X-ray source ID number; (2), (3) X-ray position; (4) X-ray position uncertainty; (5) count rate in the range 0.2-12 keV; (6) flux in the range 0.2-12 keV, assuming an absorbed power-law spectrum with photon index = 1.7 and hydrogen column density = 3 cm-2; (7) detection likelihood; (8) source morphology; (9) angular distance of the candidate optical counterpart from the X-ray position; (10) classification of the candidate counterpart; (11) magnitude type; (12) magnitude value; (13) logarithmic value of the X-ray-to-optical flux ratio; (14) proposed source identification.