Substructures in protoplanetary disks imprinted by compact planetary systems
Abstract
The substructures observed in protoplanetary disks may be the signposts of embedded planets carving gaps or creating vortices. The inferred masses of these planets often fall in the Jovian regime despite their low abundance compared to lower-mass planets, partly because previous works often assume that a single substructure (a gap or vortex) is caused by a single planet. In this work, we study the possible imprints of compact systems composed of Neptune-like planets () and show that long-standing vortices are a prevalent outcome when their inter-planetary separation () falls below times —the average disk’s scale height at the planets locations. In simulations where a single planet is unable to produce long-lived vortices, two-planet systems can preserve them for at least orbits in two regimes: i) fully-shared density gaps with elongated vortices around the stable Lagrange points and for the most compact planet pairs (); ii) partially-shared gaps for more widely spaced planets () forming vortices in a density ring between the planets through the Rossby wave instability. The latter case can produce vortices with a wide range of aspect ratios down to and can occur for planets captured into the 3:2 (2:1) mean-motion resonances for disk’s aspects ratios of (). We suggest that their long lifetimes are sustained by the interaction of spiral density waves launched by the neighboring planets. Overall, our results show that distinguishing imprint of compact systems with Neptune-mass planets are long-lived vortices inside the density gaps, which in turn are shallower than single-planet gaps for a fixed gap width.
1 Introduction
Substructures in protoplanetary discs (PPDs) such as rings, gaps, spirals, vortices, and other non-axisymmetric substructures are often shown by high angular resolution observation in sub-millimeter/millimeter and optical/near-infrared wavelengths (ALMA Partnership et al., 2015; Andrews, 2020; Francis & van der Marel, 2020). Although several formation mechanisms have been proposed, their origin remains still unclear. These mechanisms may involve either internal processes within the disks such as hydrodynamic instabilities (Takahashi & Inutsuka, 2016; Ueda et al., 2021; Pierens, 2021), magneto-hydrodynamic effects (Flock et al., 2015; Krapp et al., 2018), the presence of snowlines (Zhang et al., 2015; Okuzumi et al., 2016), among others, or may be driven by planets through disk-planet interactions (Goldreich & Tremaine, 1980; Lin & Papaloizou, 1986).
Interactions with planets seem to reproduce at least some observed substructures (e.g., Pinilla et al., 2012; Dipierro et al., 2015; Dong et al., 2015; Zhang et al., 2018; Hammer et al., 2021; Rodenkirch et al., 2021; Fedele et al., 2021), including the remarkable case of PDS70 where such planets have been observed (Keppler et al., 2018; Müller et al., 2018; Wagner et al., 2018; Haffert et al., 2019). As in PDS70, super Jovian-mass planets are often invoked to reproduce the dust continuum observations by ALMA (Long et al., 2018; Bae et al., 2018; Lodato et al., 2019), though such planets have small occurrence rates as shown by direct imaging campaigns (Bowler & Nielsen, 2018); a potential tension that is alleviated if the planets eventually migrate inwards (van der Marel & Mulders, 2021).
Lower-mass planets () are observed to be much more common than the Jovians, at least inside au as shown by microlensing detections (see Zhang et al., 2018, Fig. 21) and radial velocity campaigns (Cumming et al., 2008; Mayor et al., 2011). At closer-in distances to their host stars ( au), the NASA Kepler Space Telescope revealed this overabundance of sub-Neptune planets pursues, possibly outnumbering the stars themselves (Petigura et al., 2013). A common feature of these planets that they belong to multi-planet systems (average of planets in inside au; Zhu et al. 2018), sometimes in very compact configurations (Lissauer et al., 2011a, 2014; Rowe et al., 2014), ranging from two-planet systems such as Kepler-36 (Carter et al., 2012) to high-multiplicity ones like Kepler-11 (Lissauer et al., 2011b). However, Kepler systems may not be directly related to the structures observed by ALMA, as they differ in orbital radii by a factor of a few tens.
Despite the popularity of this planetary population in our Galaxy, including the pair Uranus-Neptune in our Solar System, the question of what possible imprints they may leave in the disk remains poorly studied. Instead, most works have focused on the effects that disk has on the planetary dynamics and their migration (Brož et al., 2018; Cimerman et al., 2018; Kanagawa & Szuszkiewicz, 2020; Cui et al., 2021). In this paper, we fill this gap by studying the different features and structures in PPDs imprinted by sub-Jovian mass planets in compact configurations.
Disk-planet interactions: role of multiplicity
The effect on multi-planet systems on PPDs has been explored as a mechanism to open wide cavities using several Jovian-sized planets, offering an explanation to the observed transition disks (Zhu et al., 2011). An example of a wide gap is that is of PDS70, where the carving of gas and dust is well-explained by two super-Jupiters sharing a common gap (Bae et al., 2019). Given our exhaustive knowledge of gaps opened by single planets (e.g., Kanagawa et al., 2015; Duffell, 2020), one may be tempted to model the cavities in multi-planet systems as the superposition of individual gaps centered around each planet. However, as shown by Duffell & Dong (2015) multiple planets in a common cavity produce shallower gaps than single planets as a result of angular momentum transfer, so the superposition would not be applicable.
These works have mainly focused on a regime where and the planets have Jovian masses, often super-thermal. At lower viscosities, planets with masses even below the thermal mass, defined as
| (1) |
can open gaps or even multiple gaps (Goodman & Rafikov, 2001). Moreover, such planet may still produce non-axisymmetric structures such as vortices (e.g., Hammer et al., 2021) or over-densities around the Lagrange points and (e.g., Rodenkirch et al., 2021) that may add complexity to the morphologies of PPDs when multiple planets are present. Our work aims at understanding this potential complexity.
Our paper is organized as follows. We describe the setup and details of our numerical simulations in Section 2. We present our main results in §3, which we classify in different regimes in §4. We provide with more details and a physical interpretation of two relevant regimes in §5 and §6. In §7 we discuss our main results and observational implications, and end with our conclusions in §8.
2 Set-Up
We carried out 2D hydrodynamic simulations using Fargo3D code (Benítez-Llambay & Masset, 2016; Benítez-Llambay et al., 2019; Masset, 2000) that solves Navier-Stokes equations, considering vertically integrated quantities. These equations are the conservation of mass
| (2) |
and the conservation of momentum
| (3) |
where is the surface density, the flow velocity vector, the gravitational potential of the star and the planets, the viscous stress tensor, and the pressure. We assume a locally isothermal equation of state where is the sound speed, the local Keplerian orbital frequency and the scale height of the disk.
The planets are allowed to move freely, interacting gravitationally with other planets and the gaseous disk.
2.1 Planetary systems
We define the spacing of the planets as
| (4) |
which we express in units the mutual Hill radius given by
| (5) |
where is the mass of the planet orbiting a Sun-like star () at a semi-major axis ().
We consider a range of . Theoretically, such compact systems may emerge from oligarchic growth, where proto-planets end at orbital separations in the range (Kokubo & Ida, 1998). While observationally, they may be precursors of Kepler-like with typical previous to the last mass-doubling giant impacts (e.g., Pu & Wu, 2015; Yee et al., 2021).
2.2 Fiducial model
We choose a power-law profile for the initial disk surface density , corresponding to of the MMSN (Hayashi, 1981). Similar for the sound speed using the flaring index and au, corresponding to a at au.
-
•
The disk extent from au to au, implying an initial disk mass of , making self-gravity and planet migration111According to Kanagawa et al. (2018, Eq. 5,) the migration timescale correspond to orbits for the fiducial model. negligible. The computational domain is composed of logarithmically-spaced radial cells and equally-spaced cells in the azimuthal domain.
-
•
The standard viscosity parameter (Shakura & Sunyaev, 1973) is set as a constant throughout the disk with .
-
•
An aspect ratio of with
-
•
An inner planet at au, while the outer planet is place at from the inner planet (Table 1). Both planets start with low eccentricities of and their final masses222We tested simulations gradually growing the planets and find similar results..
Finally, damping regions for the radial boundaries are applied at a distance of () times that of the inner (outer) boundary radius (de Val-Borro et al., 2006). The various planetary separations and masses as well as other disk parameters ( and ), different from the fiducial values above, are shown in Table 1.
3 Results
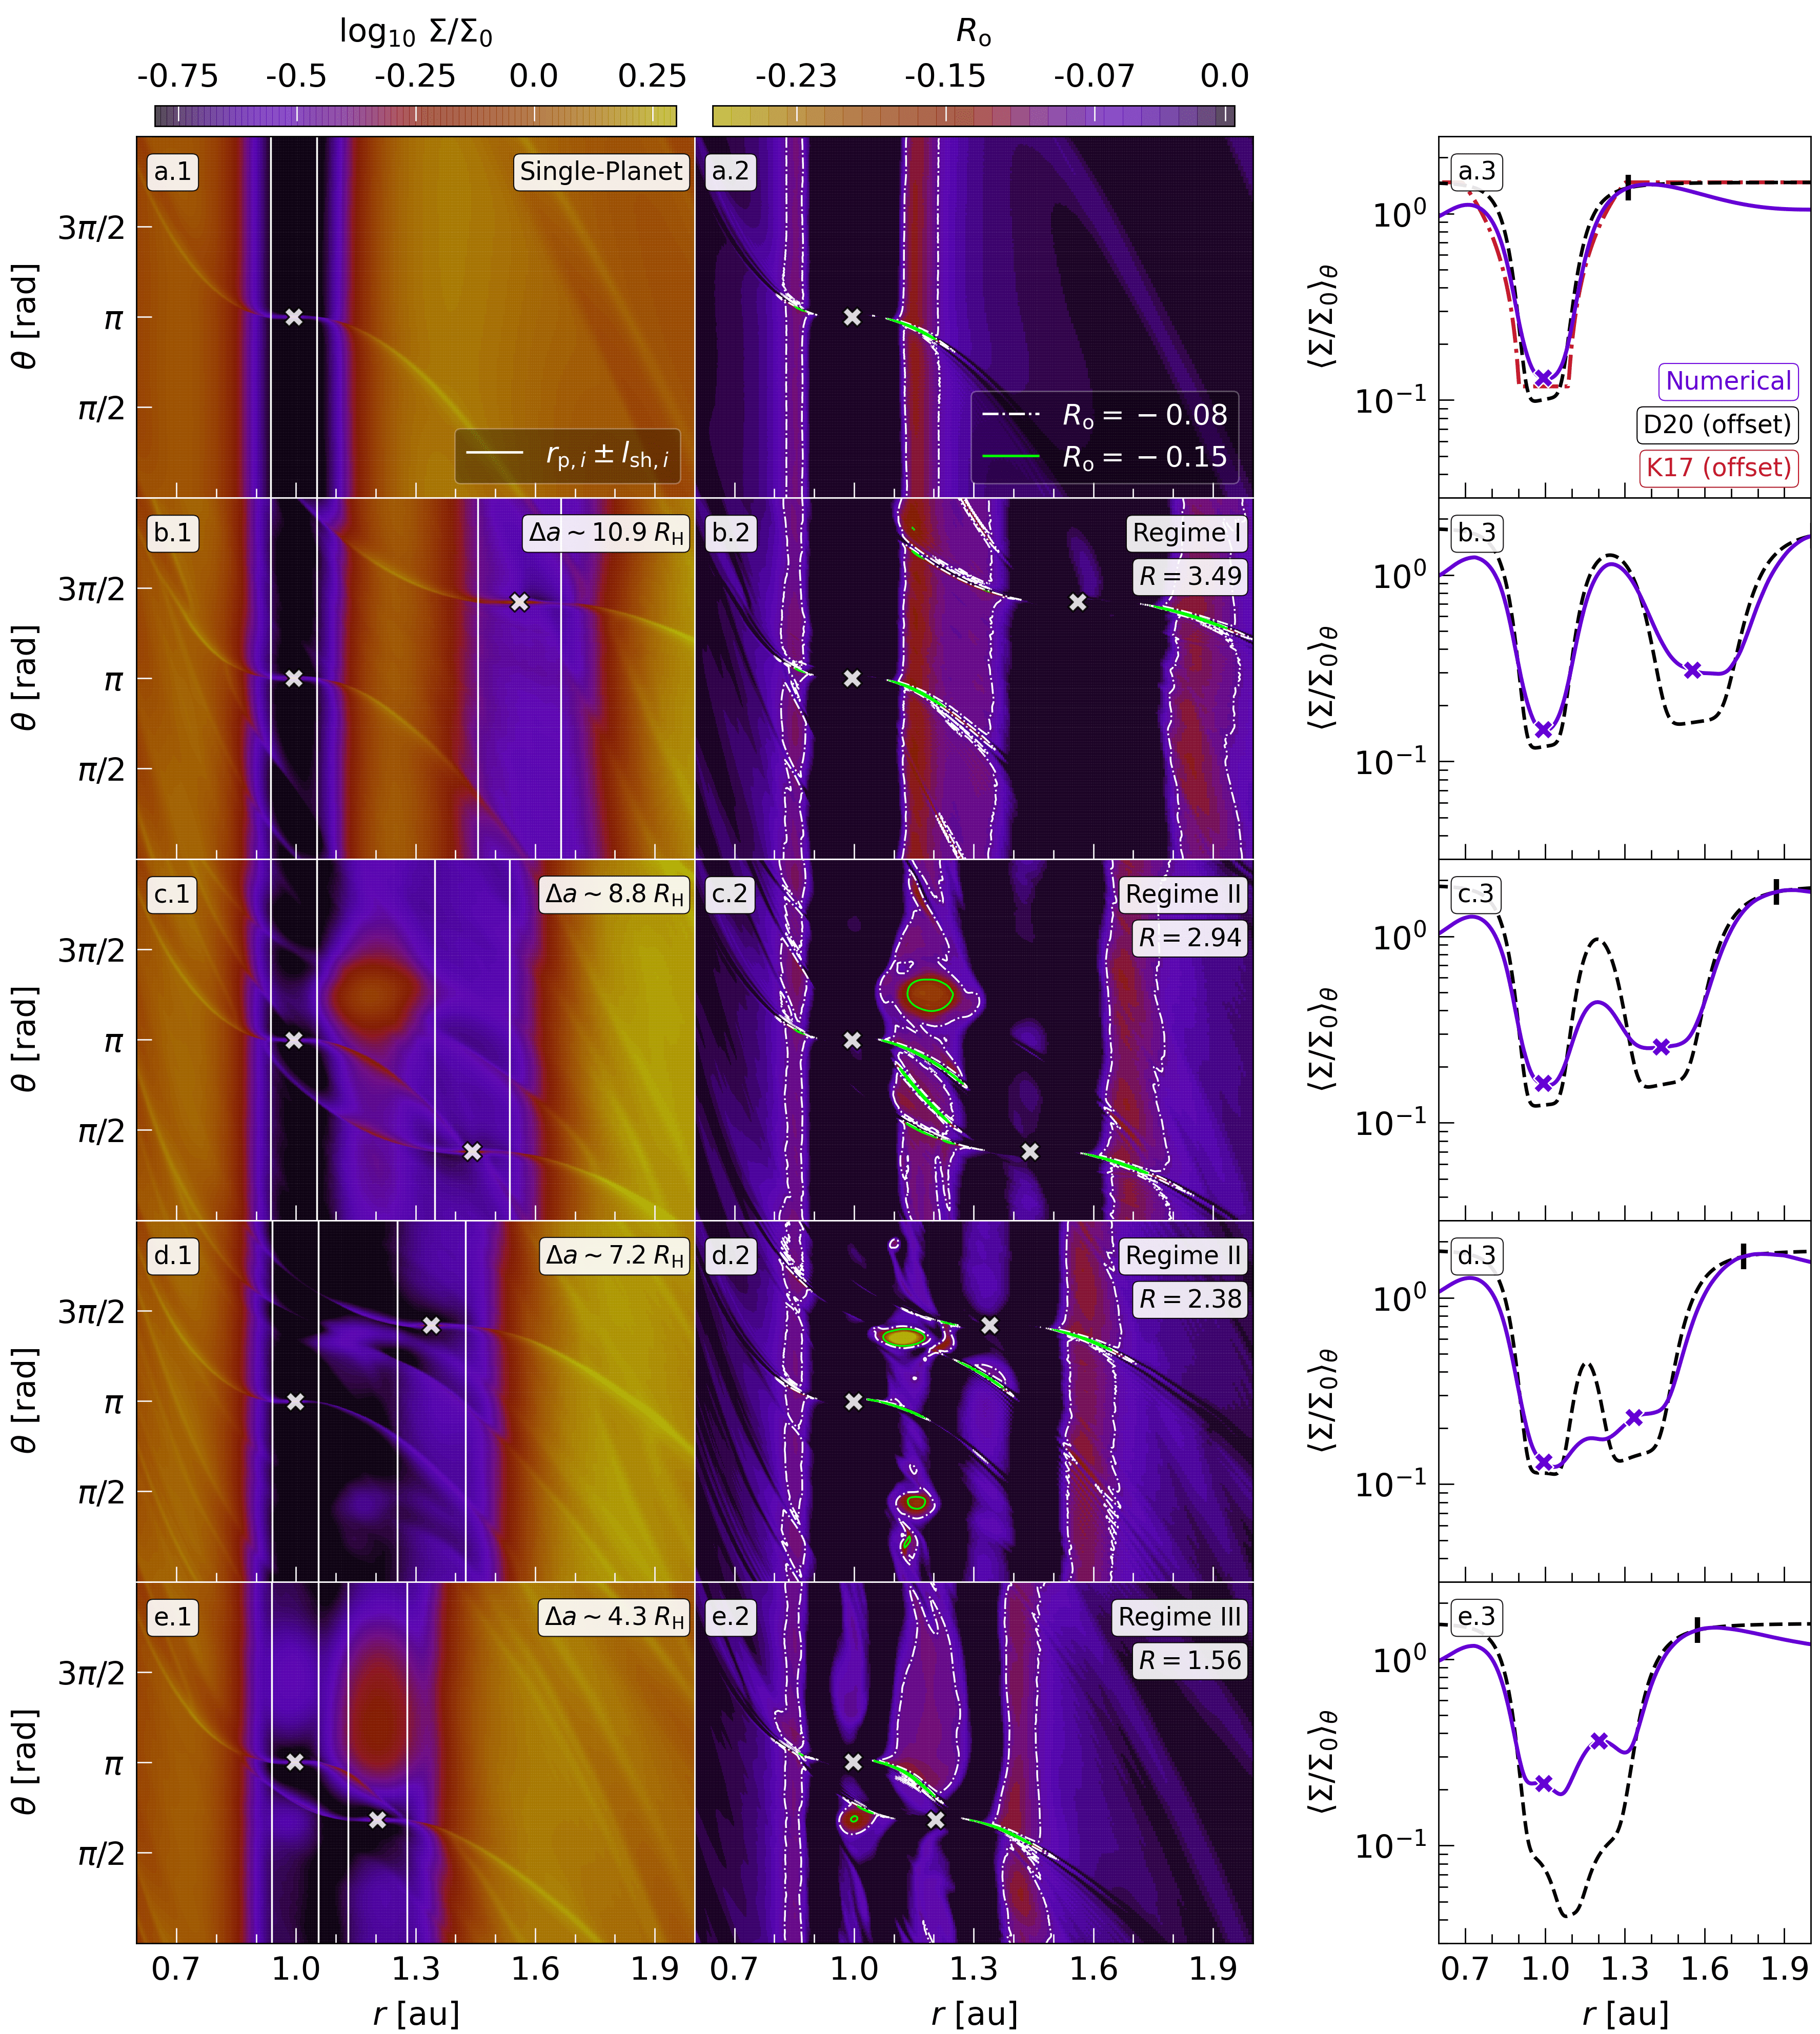
In Figure 1 we show the simulation results for a single-planet (panels a.1 - a.3) and two-planet models with separations of , , , and (panels b.1 - e.3, see Table 1) after inner planetary orbits. In what follows, we navigate the results going from the left to the right panels.
3.1 Disk morphology (left panels)
The panel (a.1) shows that a single planet opens a gap with a fully axi-symmetric density distribution and no co-rotational accumulations. The small departures are due to the spiral density waves launched by the planet. Similar to this single-planet case, panel (b.1) with two well-separated planets also displays only axi-symmetric structures, including now a ring that separates both planets. This is expected for significant inter-planetary separations since each planet carves its gap nearly unaffected by its neighbor.
As the planetary separations drop below (panels c.1, d.1, and e.1) we observe the appearance of non-axisymmetric structures. Panel (c.1) shows planets separated by a narrow ring, trapping gas and forming an elongated vortex-like sub-structure. Panel (d.1) shows planets partially sharing their gaps separated by tenuous and compact substructures. Finally, panel (e.1) shows gas trapped in the co-orbital region for each planet, displaying over-densities at the Lagrange points and , which are located in the leading and trailing position respect to the planet at .
3.2 Vortices (middle panels)
A useful quantity to measure the strength of the vortices is provided by the Rossby number, defined as
| (6) |
where is the Keplerian orbital velocity.
A practical classification of vortices is provided by Surville & Barge (2015, Sec. 5.4). The authors identify two families: Incompressibles for which with an elongated shape and compressibles for which with a compact shape. Their streamlines can break the flow around the vortex by exciting spiral waves from the vortex core.
Despite the fact that the gap edges do show regions with , no vortex survives after orbits in our simulations in these regions. In turn, Panel (c.2) shows an elongated vortex in between the planets that reaches . Similarly, Panel (d.2) shows compact vortices with the strongest one () launching spirals from their core. Finally, panel (e.2) shows the expected anticyclonic motion () at and , characterized by tadpole orbits around these equilibrium points.
3.3 Azimuthally-averaged density profiles (right panels)
We compare our numerical azimuthally-averaged density profiles with analytic expressions obtained in single-planet calculations by Kanagawa et al. (Eq. 6, 2017, hereafter K17) and Duffell (Eq. 19, 2020, hereafter D20). A multiplicative factor is applied to match the profiles at the outer edge of the gap, due to the pile-up produced in our simulations, expected in low-viscosity and low-mass disks (Dempsey et al., 2020). For a single planet (panel a.3), we show that K17 and D20 reproduce the numerical profile reasonably well, but with D20 predicting slightly deeper gaps than observed.
For the two-planet cases (panels b.3 - e.3) we only show the profile by D20. Overall, we find that it can reproduce gap widths reasonably well, but the simple addition of two independent profiles does not capture the genuine behavior of gap opening by two planets, both in depths at planet positions, as well as the amount of material between the planets (bumps in panels c.3 and d.3). In the most compact two-planets systems in panel (e.3), the gap depth is shallower by a factor of compared to the single-planet case. This behavior had been observed in the simulations by Duffell & Dong (2015) for cavity-sharing Jovian-mass planets and attributed to the cavity refilling from the density waves launched by the planetary neighbors. In our case, the gaps are also shallower due to the gas accumulation at and . We discuss this further in §6.
4 Classification of regimes
In this section we attempt to provide with a set of criteria to classify the different set of morphologies observed in Figure 1 based on the disk properties and planetary separations. Before doing this, we revise some general aspects of spiral density wave damping and vorticity excitation that will allow us to perform a more quantitative classification.
4.1 Spiral density waves: shocks and vorticity
A planet embedded in a PPD excites density waves at Lindblad resonances, which propagate across the disk carrying energy and angular momentum. Its deposition in the disk, which depends on the dissipation mechanism, may give rise to gas evolution and the formation of substructures. In particular, Goodman & Rafikov (2001) showed these waves may damp non-linearly by wave steeping and subsequent shocks, even for sub-thermal mass planets in a low viscosity environment. The typical distance from the planet at which the wave shocks is given by
| (7) |
while the angular momentum flux (AMF) transported by the spiral, decays in the post-shock region (Goodman & Rafikov, 2001; Rafikov, 2002; Dong et al., 2011b) as
| (8) |
As for the vortices, these can also be generated by planets through the Rossby Wave Instability (RWI: Lovelace et al., 1999; Li et al., 2000, 2001). The critical function for the RWI in a locally isothermal disk is given by Lin (2012) as , which depends inversely on the vortensity
| (9) |
The RWI can be triggered in regions where becomes maximum, such as the gap edges. In turn, the vortensity perturbation produced by spiral shocks is a steep function of the planet mass, where the peak scales as (Dong et al., 2011b). Recently, Cimerman & Rafikov (2021) have shown that is produced between , with an exact location that depends on . The vortensity peak is followed by a negative perturbation or a maximum in , which locates a region where the gas could become unstable to the RWI under favorable conditions, e.g., sufficiently sharp density profile (Ono et al., 2016) and low viscosity () (de Val-Borro et al., 2007).
4.2 Proposed regimes
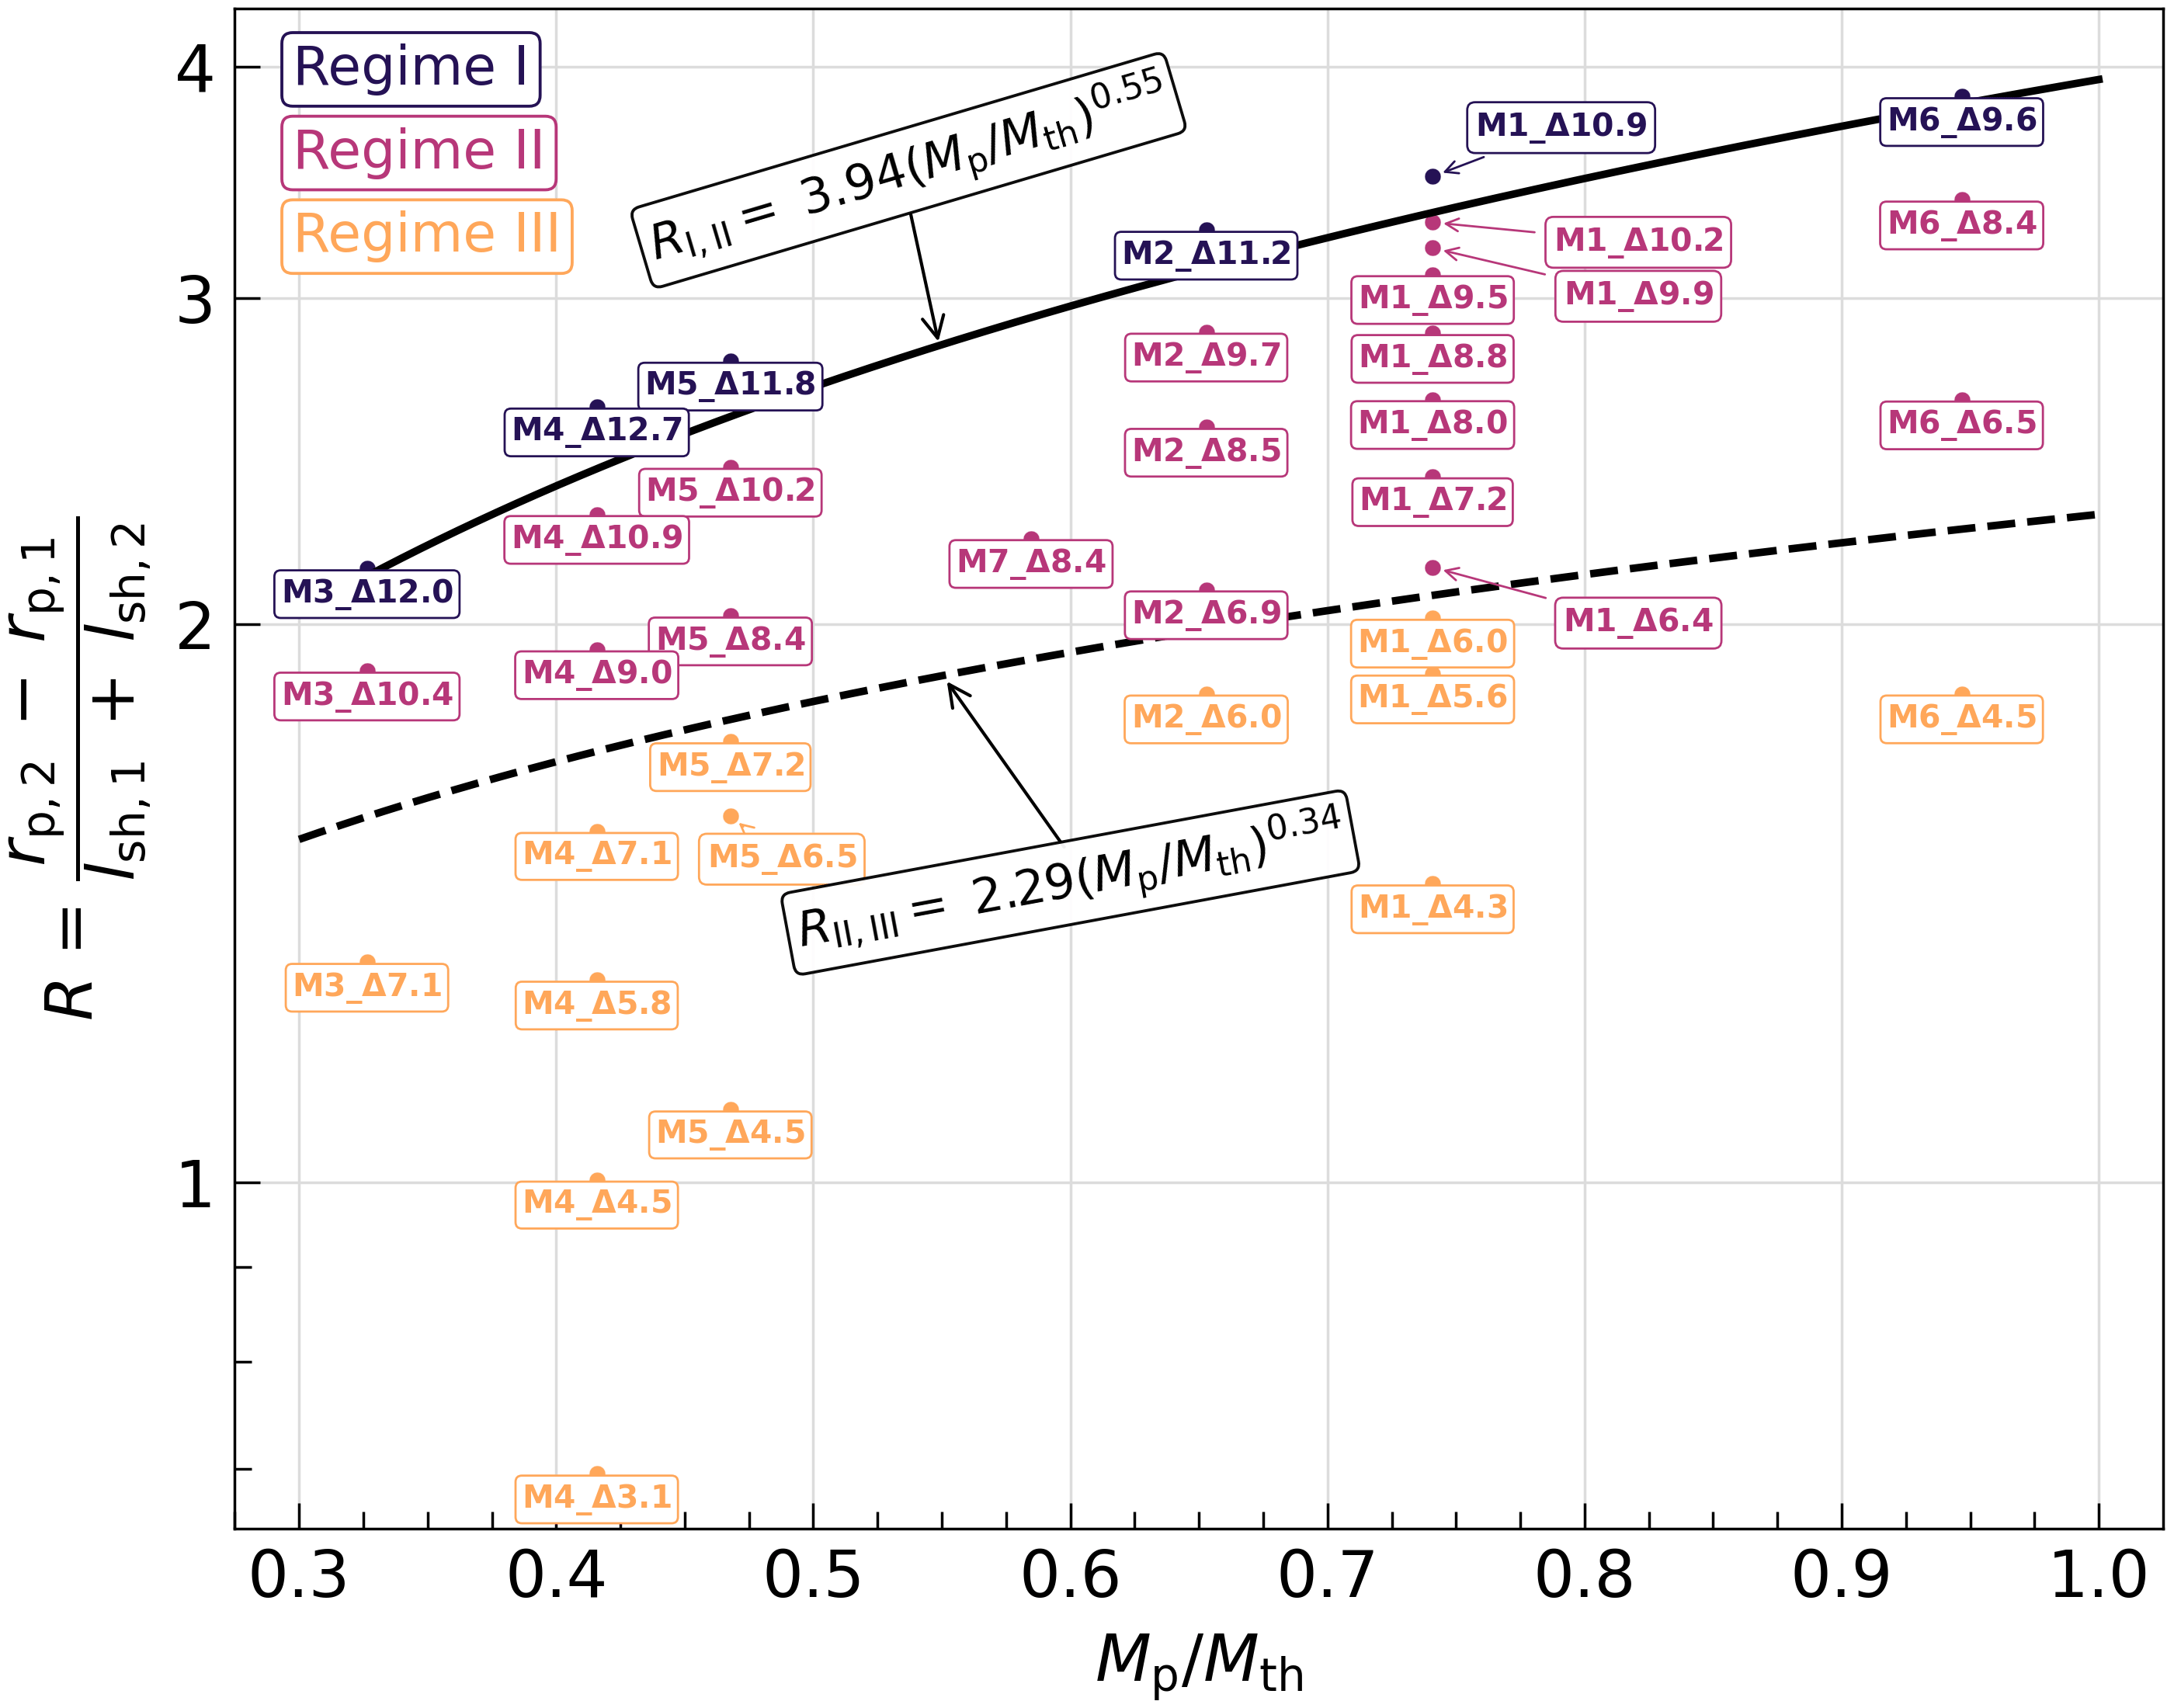
Hinted by the vertical lines of Figure 1, showing that encloses well the radial extent of the density features (ring and vortices), we define the dimensionless distance scale as
| (10) |
to classify the regimes. As discussed in the previous section, the vortensity perturbation peaks at , so that provides with a physically-motivated scale in which vortices may be driven.
In Figure 2 we show the final states of simulations run for orbits of the inner planet (see Table 1) with sub-thermal masses in the range . We visually classified these simulations based on their gas morphologies after orbits. Similar to Figure 1, we identify systems without non-axisymmetric structures and systems with such structures lying either in between the planets or at their co-rotational regions. Thus, we propose the following classification:
- Regime I
-
The disk shows an axisymmetric ring sub-structure between orbits of the planets, forming completely separate gaps, e.g., Figure 1 (b). This occurs when the planets are most widely separated with
(11) - Regime II
-
The disk shows non-axisymmetric substructures between planetary orbits, with the planets sharing their partially-opened gaps, e.g., Figures 1 (c) and (d). This regime takes place for intermediate planetary separations bounded by
(12) - Regime III
-
The disk does not show substructures between planetary orbits and they fully share their gaps. Instead, non-axisymmetric substructures do appear in their co-orbital regions around the or Lagrange points, e.g., Figure 1 (e). This regime occurs for the most closely-packed systems with
(13)
We remark that this proposed empirical separation has only been tested for sub-thermal planets (), low viscosities of , and aspect ratios in the range .
5 Partially-shared gaps (Regime II)
In this section we explore the origin of the long-standing vortices in the Regime II and describe their evolution and morphology.
5.1 The role of the secondary planet
We begin by comparing the evolution of single-planet simulations with the same disk properties (see Table 1). We run single-planet simulations with , , and and observe that they do form vortices as a result of the RWI at the gap edges. However, these merge into slightly larger vortices or a horseshoe-shaped vortex that decays away quickly spreads into a ring after , and orbits, respectively. These lifetimes are consistent with Hammer et al. (2021), once the planet reaches its final mass, suggesting that the presence of a second planet is essential at sustaining and invigorating the vortex, so they live for at least orbits (and in a few extended runs).
Next, we discuss three possible roles that the second planet may play.
5.1.1 Axisymmetric Planetary Torque
The torque produced by the secondary planet will act in conjunction with the primary to generate a complementary gas environment to RWI. First, its density distribution opens a gap that can produce a pressure bump between planets. If the bump is sufficiently sharp, acts as a favourable condition to RWI (Ono et al., 2016). Also, the azimuthal velocity takes sub-Keplerian (super-Keplerian) values for the internal (external) disk from the planet, where a pressure bump reference frame shows a velocity field azimuthally anti-cyclonic.
In extra simulations, we applied a modified axisymmetric torque density distribution of the impulse approximation described by Lin & Papaloizou (1986) to emulate both conditions, where the 1D approximation is extended azimuthally to open a fully axisymmetric gap (see Appendix A for details).
In the case of two axisymmetric gaps, there is no vortex formation anywhere in the disk. But, by embedding the low-mass planet in the internal axisymmetric gap, smaller-scale and shorter-lived vortices are formed, some of which undergo orbital migration. The end-state after 5,000 orbits shows wiggly, non-axisymmetric perturbations at the gap edges, similar to those observed in Hallam & Paardekooper (2017, Figure 9 therein) using using a 1D torque333The authors implement a slightly modified torque expression from Lin & Papaloizou (1986) based on the impulse approximation, similar to those obtained semi-analytically by Petrovich & Rafikov (2012); Rafikov & Petrovich (2012).. Therefore, even though the 1D torques (plus the small planet) may drive vortices, they may not be sufficient to sustain them for long timescales and keep them in fixed orbital distances.
Finally, the case with a planet and an axisymmetric gap, does sustain the vortex for 5,000 orbits. However, the vortex generated in the two-planet case is more compact and lower-density, with a Rossby number distribution more centrally concentrated and stronger. We suggest that such differences are created by the presence of the second planet and its launched spirals, as it directly affects the vortex region and interacts with the spiral of the primary planet as we discuss next.
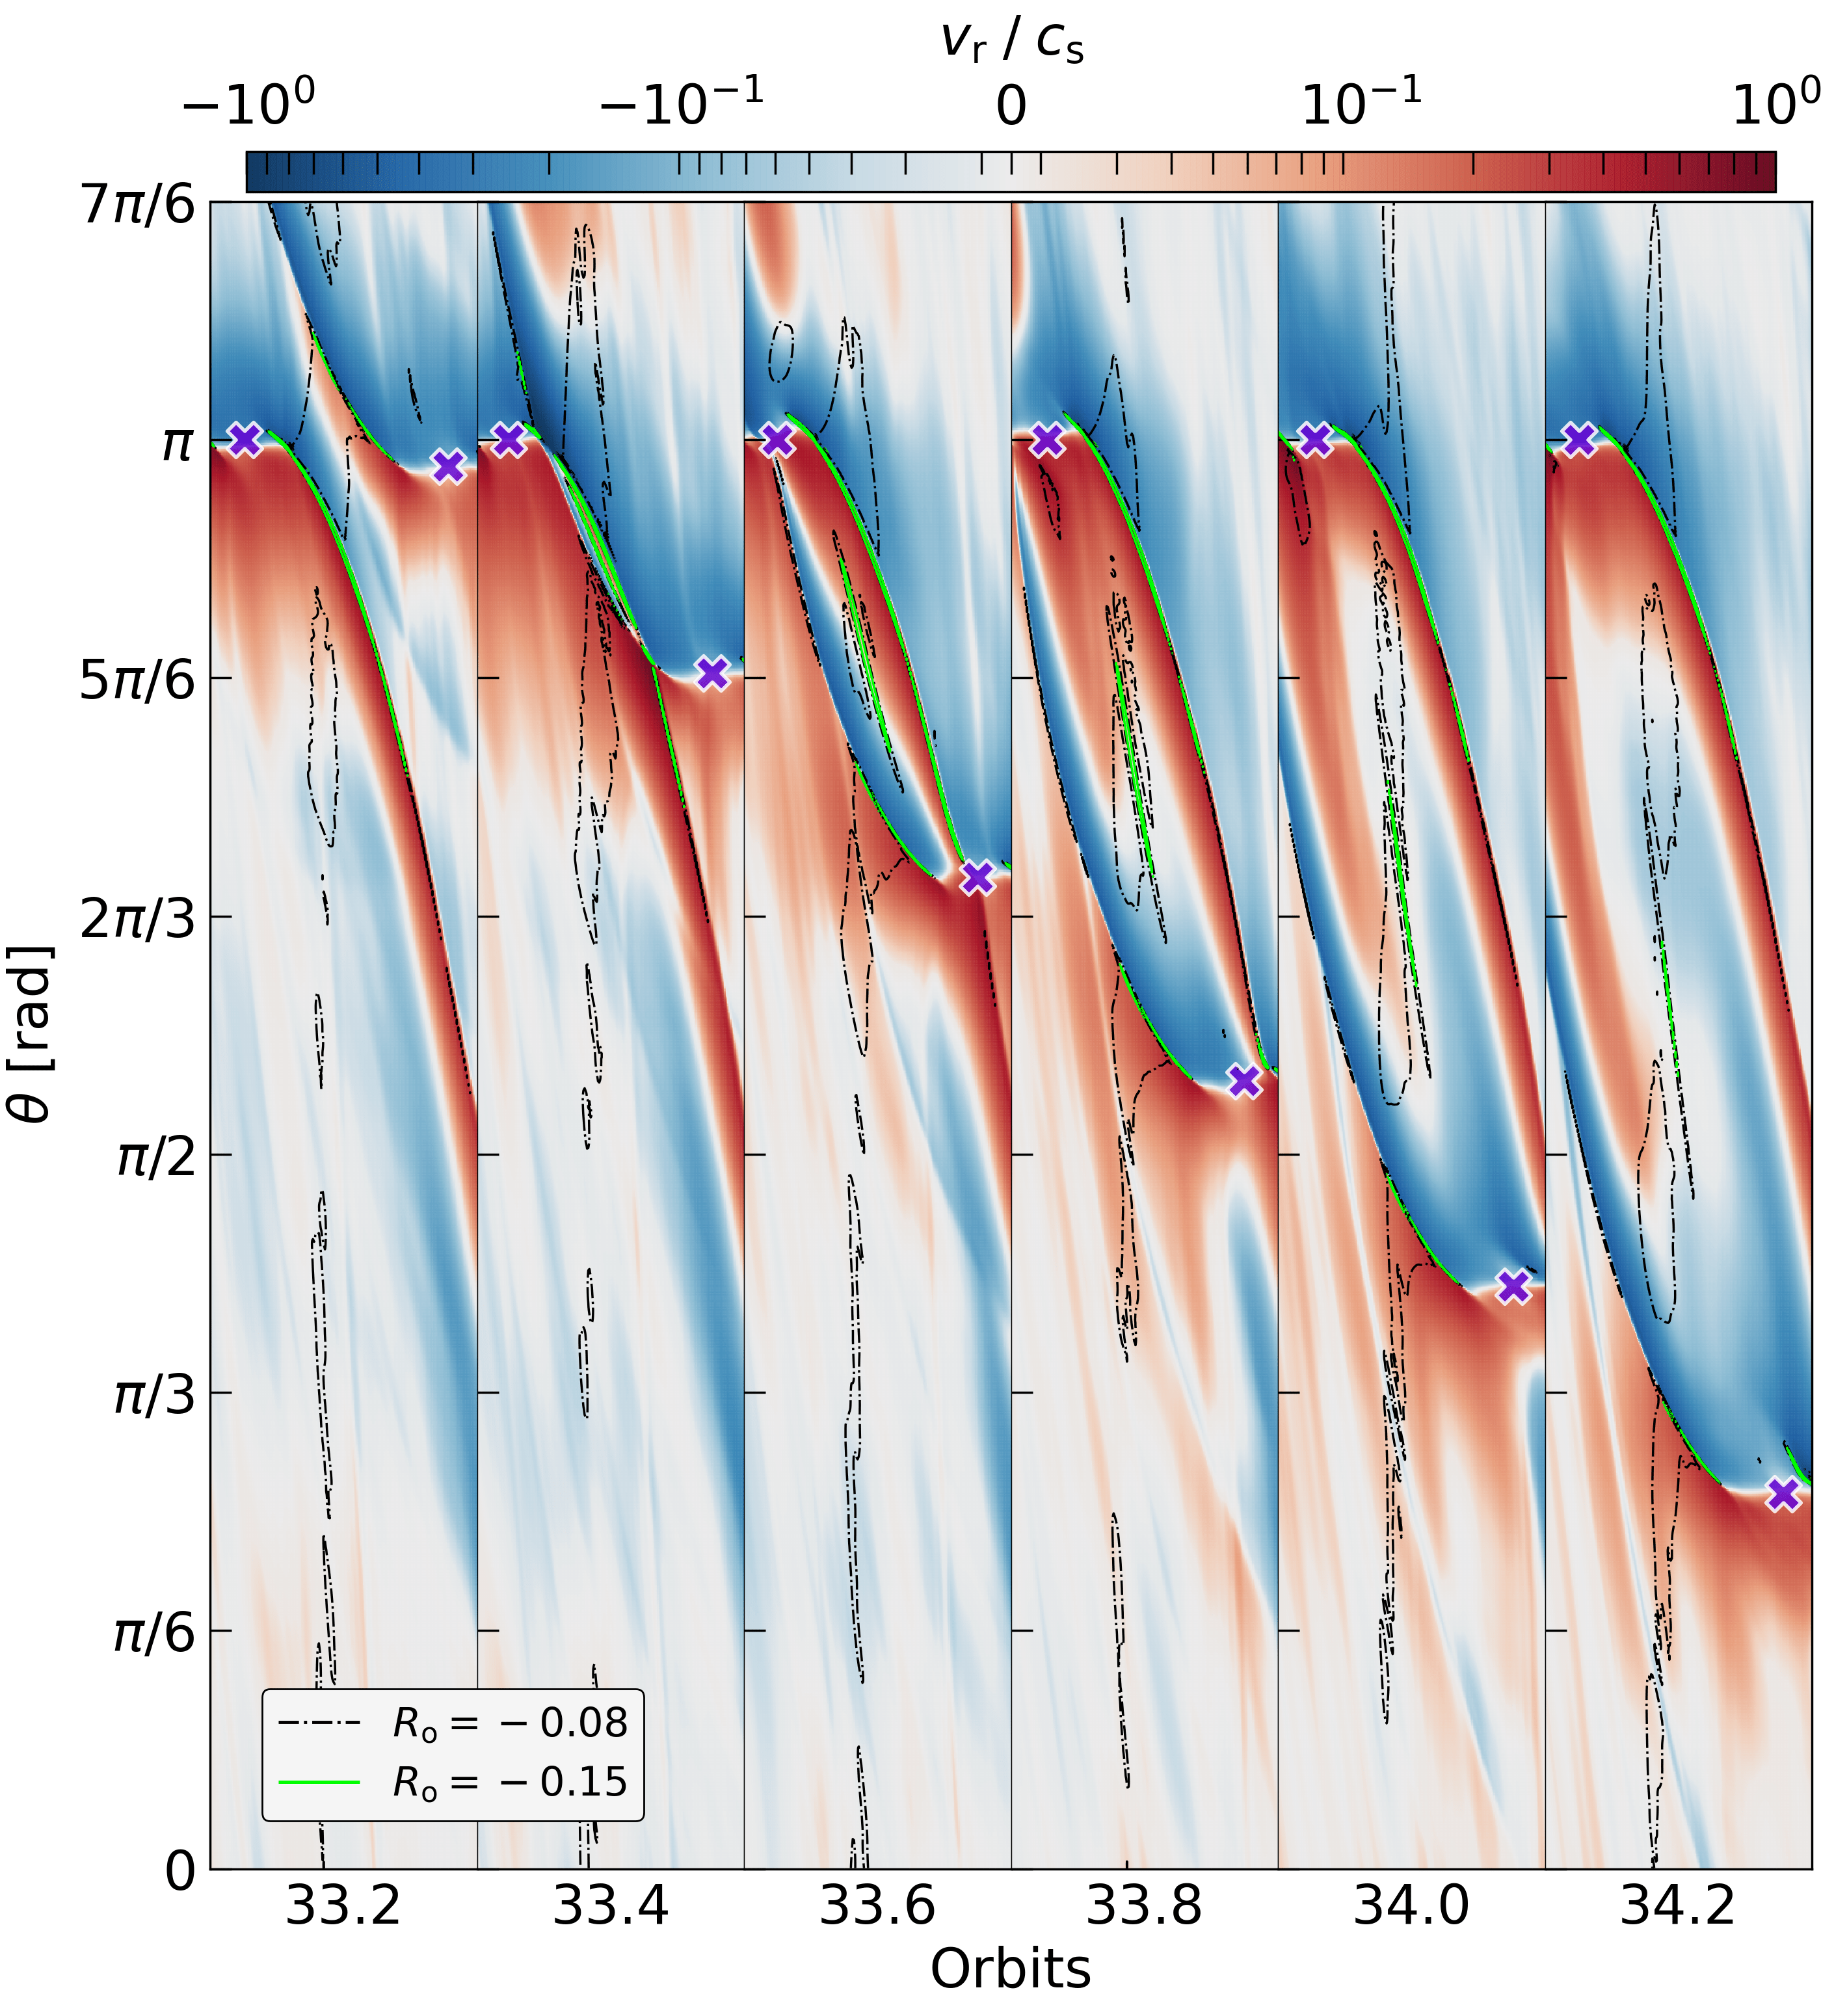
5.1.2 Spiral wave interactions
The spiral waves launched by the planets, interact with one another several times in different regions of the disk.
In order to illustrate how this interaction may lead to large-scale vortices, we show in Figure 3 the radial velocity and Rossby number for a sequence spanning soon after planetary conjunction. We observe that wave-wave interaction between the planets causes two effects:
-
1.
The spiral shock leaves an anticyclonic spiral-shaped remnant with (green lines). Then, it decays, elongating and dissipating azimuthally before the next conjunction.
-
2.
The propagation of spirals post-conjunction produces a favorable anti-cyclonic environment. Fundamentally, this is because the inner and outer spirals have opposite velocities (see region at after orbits), possibly assisted by the pressure bump between the planets that drives super-Keplerian (sub-Keplerian) motion in the internal (external) region.
These two effects, namely the vortensity created from wave interactions and the anti-cyclonic environment post-conjunction, could act in concert to assist the creation and longevity of the vortices. Note these interactions occur frequently every planetary conjunction after yrs and only can occur in a multi planet case.
Recently, (Hammer et al., 2021) has shown that the vortex migration away from the planet impacts and prolongs its evolution, predominantly caused by a weaker dissipation through shock waves. Our vortices remain long-lasting, despite of being forced to remain in between the planets.
5.1.3 Rossby Wave Instability in a density ring
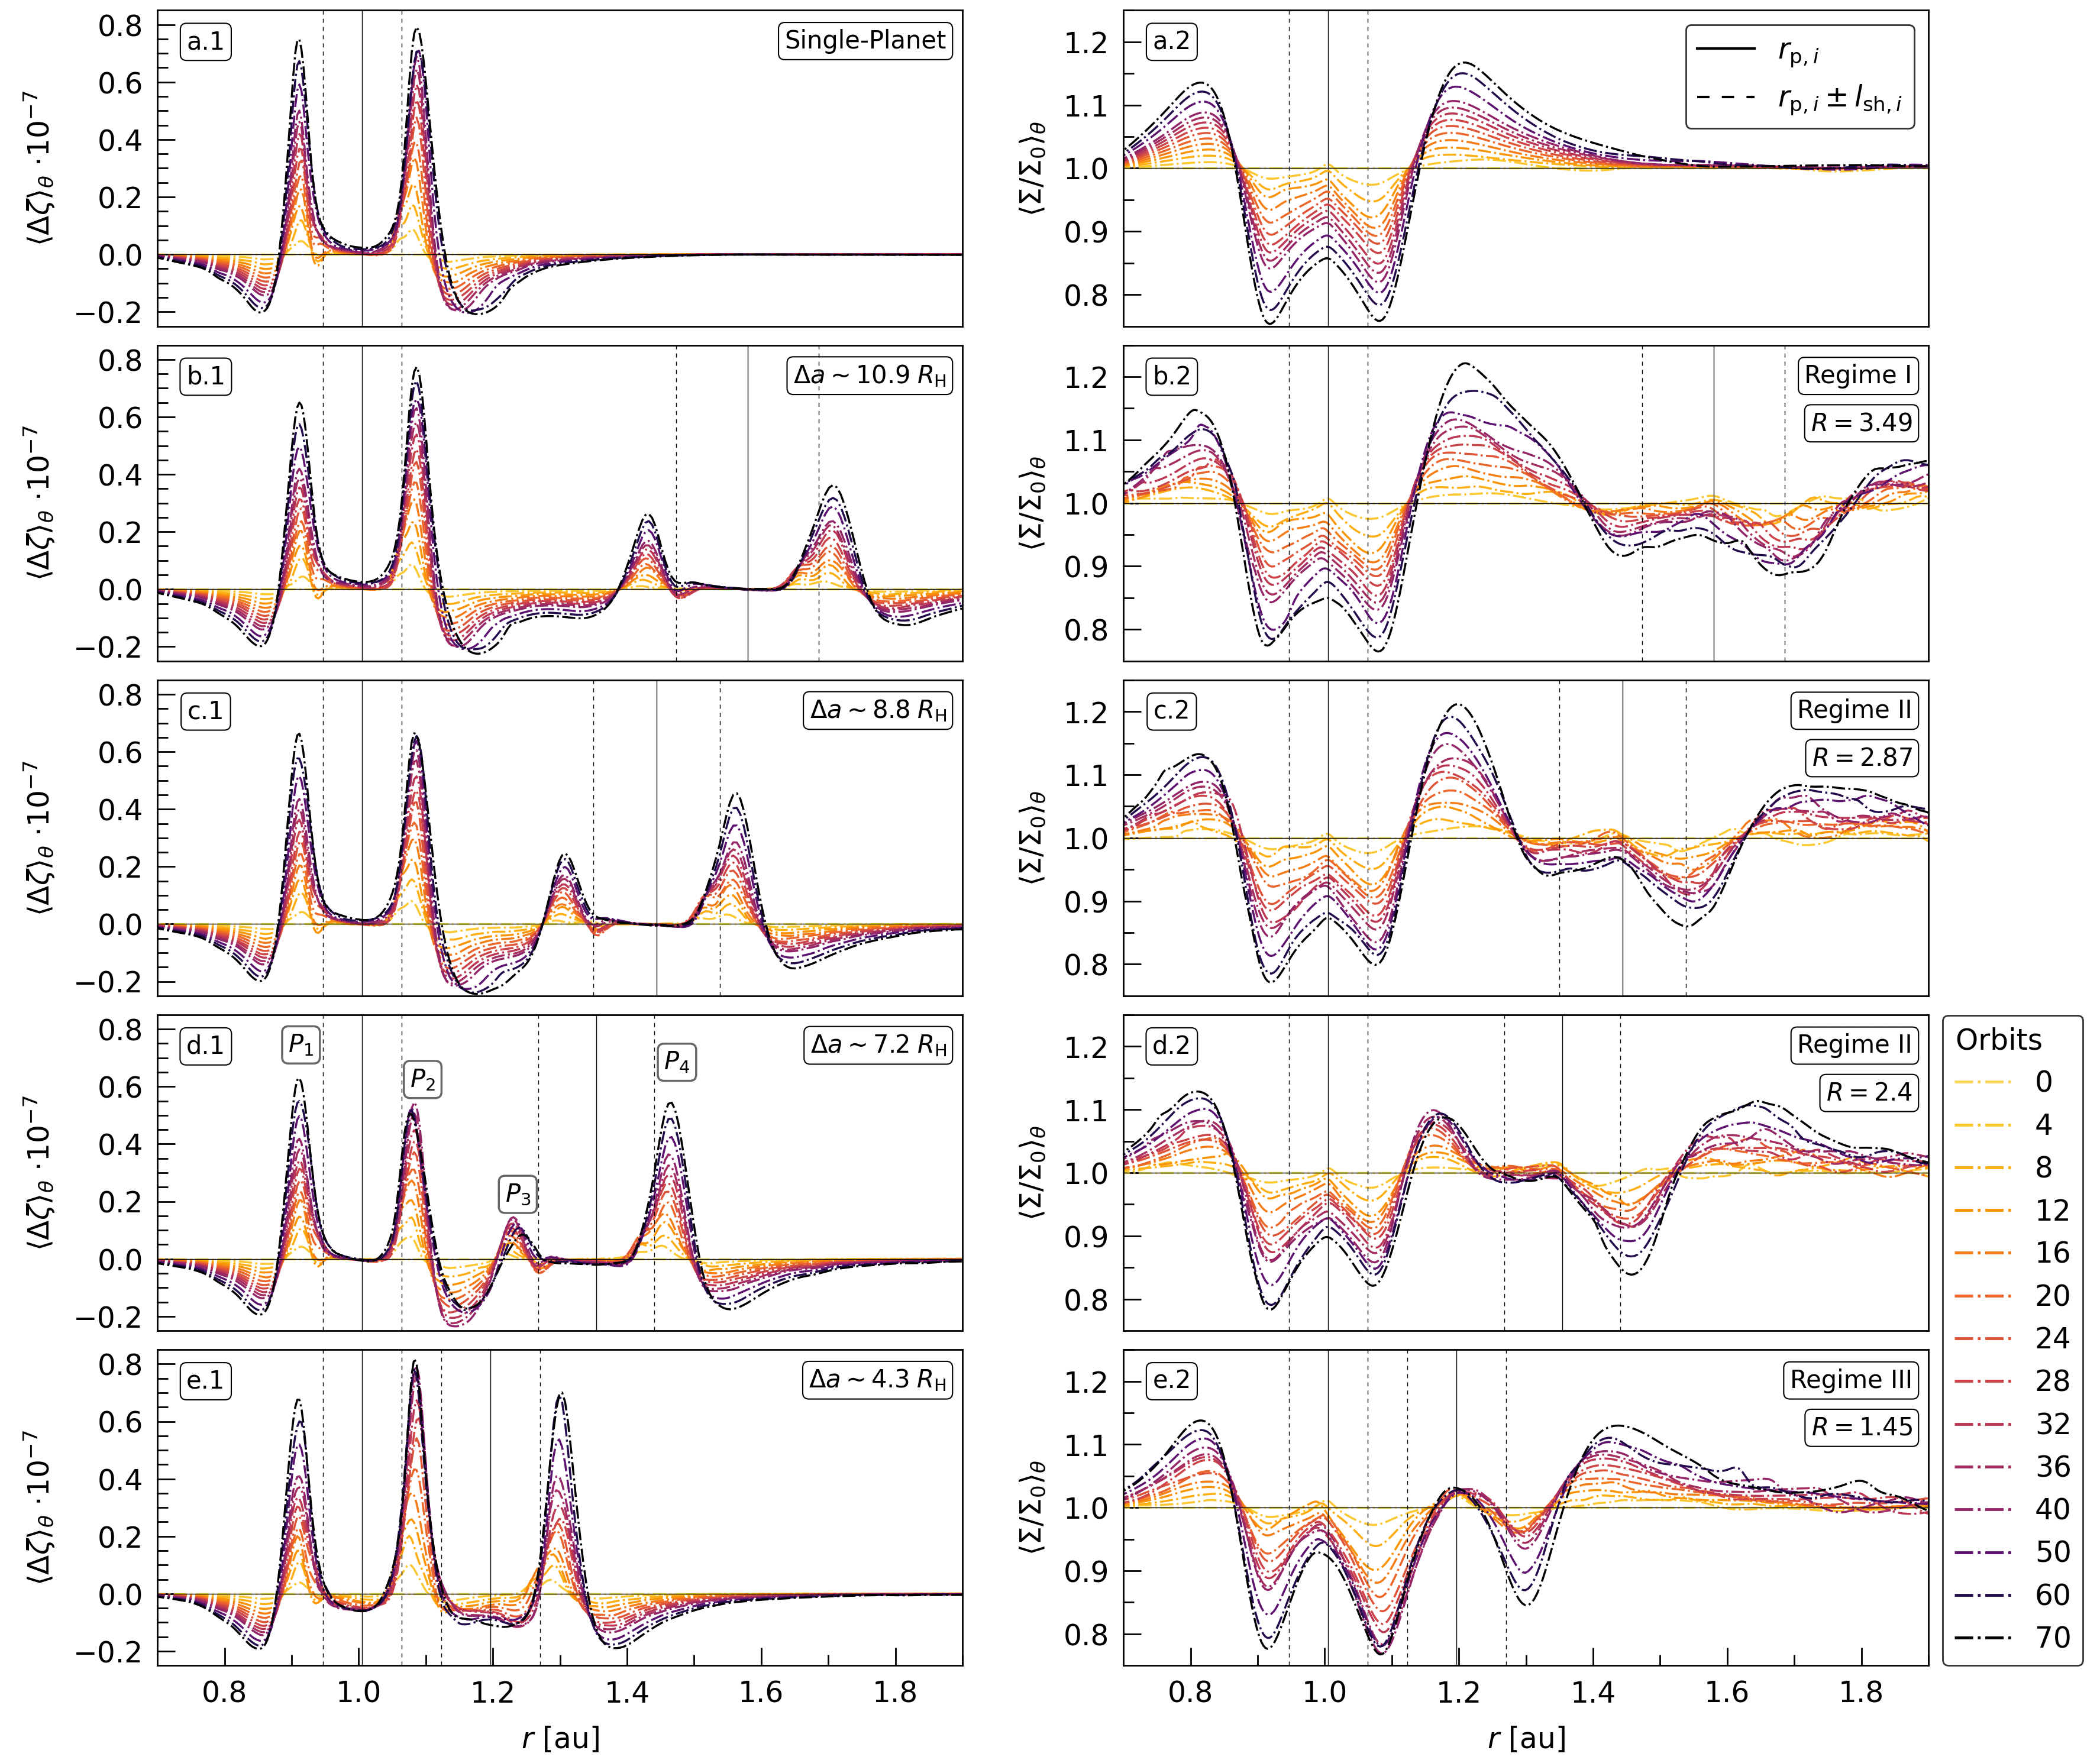
As discussed in §4.1, the RWI is triggered in regions where becomes maximum, which occurs when the vortensity perturbation reaches a (negative) minimum. In Figure 4 we display the evolution of the and profiles for the first orbits to show how this criterion behaves across different regimes.
In panel (a.1) we display the single-planet case showing the characteristic jump at , followed by a decay to negative values (Dong et al., 2011a; Cimerman & Rafikov, 2021). As such, the vortices are expected to form at , or at au and au at gap edges (panel a.2), which is indeed what we observe in our simulations (not shown). Also, we note that the slight asymmetry in the troughs and peaks around the planet is due to both the dependency and the surface density radial profile (Cimerman & Rafikov, 2021).
For multi-planet systems, the simulation with most widely separated planets in Regime I (panels b.1 and b.2) show that the profiles of both and for the inner planet are weakly affected by the outer planet. Consistently, we checked that vortices for the inner planet develop in a similar way compared to single-planet simulations. We could regard this limit as a separable-case, similar to the simulations by Baruteau et al. (2019) for much more massive planets.
For closer-planet cases in Regime II (panels c.1 - d.3), the outer planet is able to shape the profiles of both and outside the inner planets ( au). Most importantly, the region with the smallest (negative) values of extend to a region around au, which coincides with the location of the density ring between the planets. Thus, the whole ring may be subject to the RWI. Accordingly, this is what is observed in our simulations, features that are preserved for thousands of orbits (see panels c.1 and d.2 in Figure 1).
5.2 Morphology of vortices
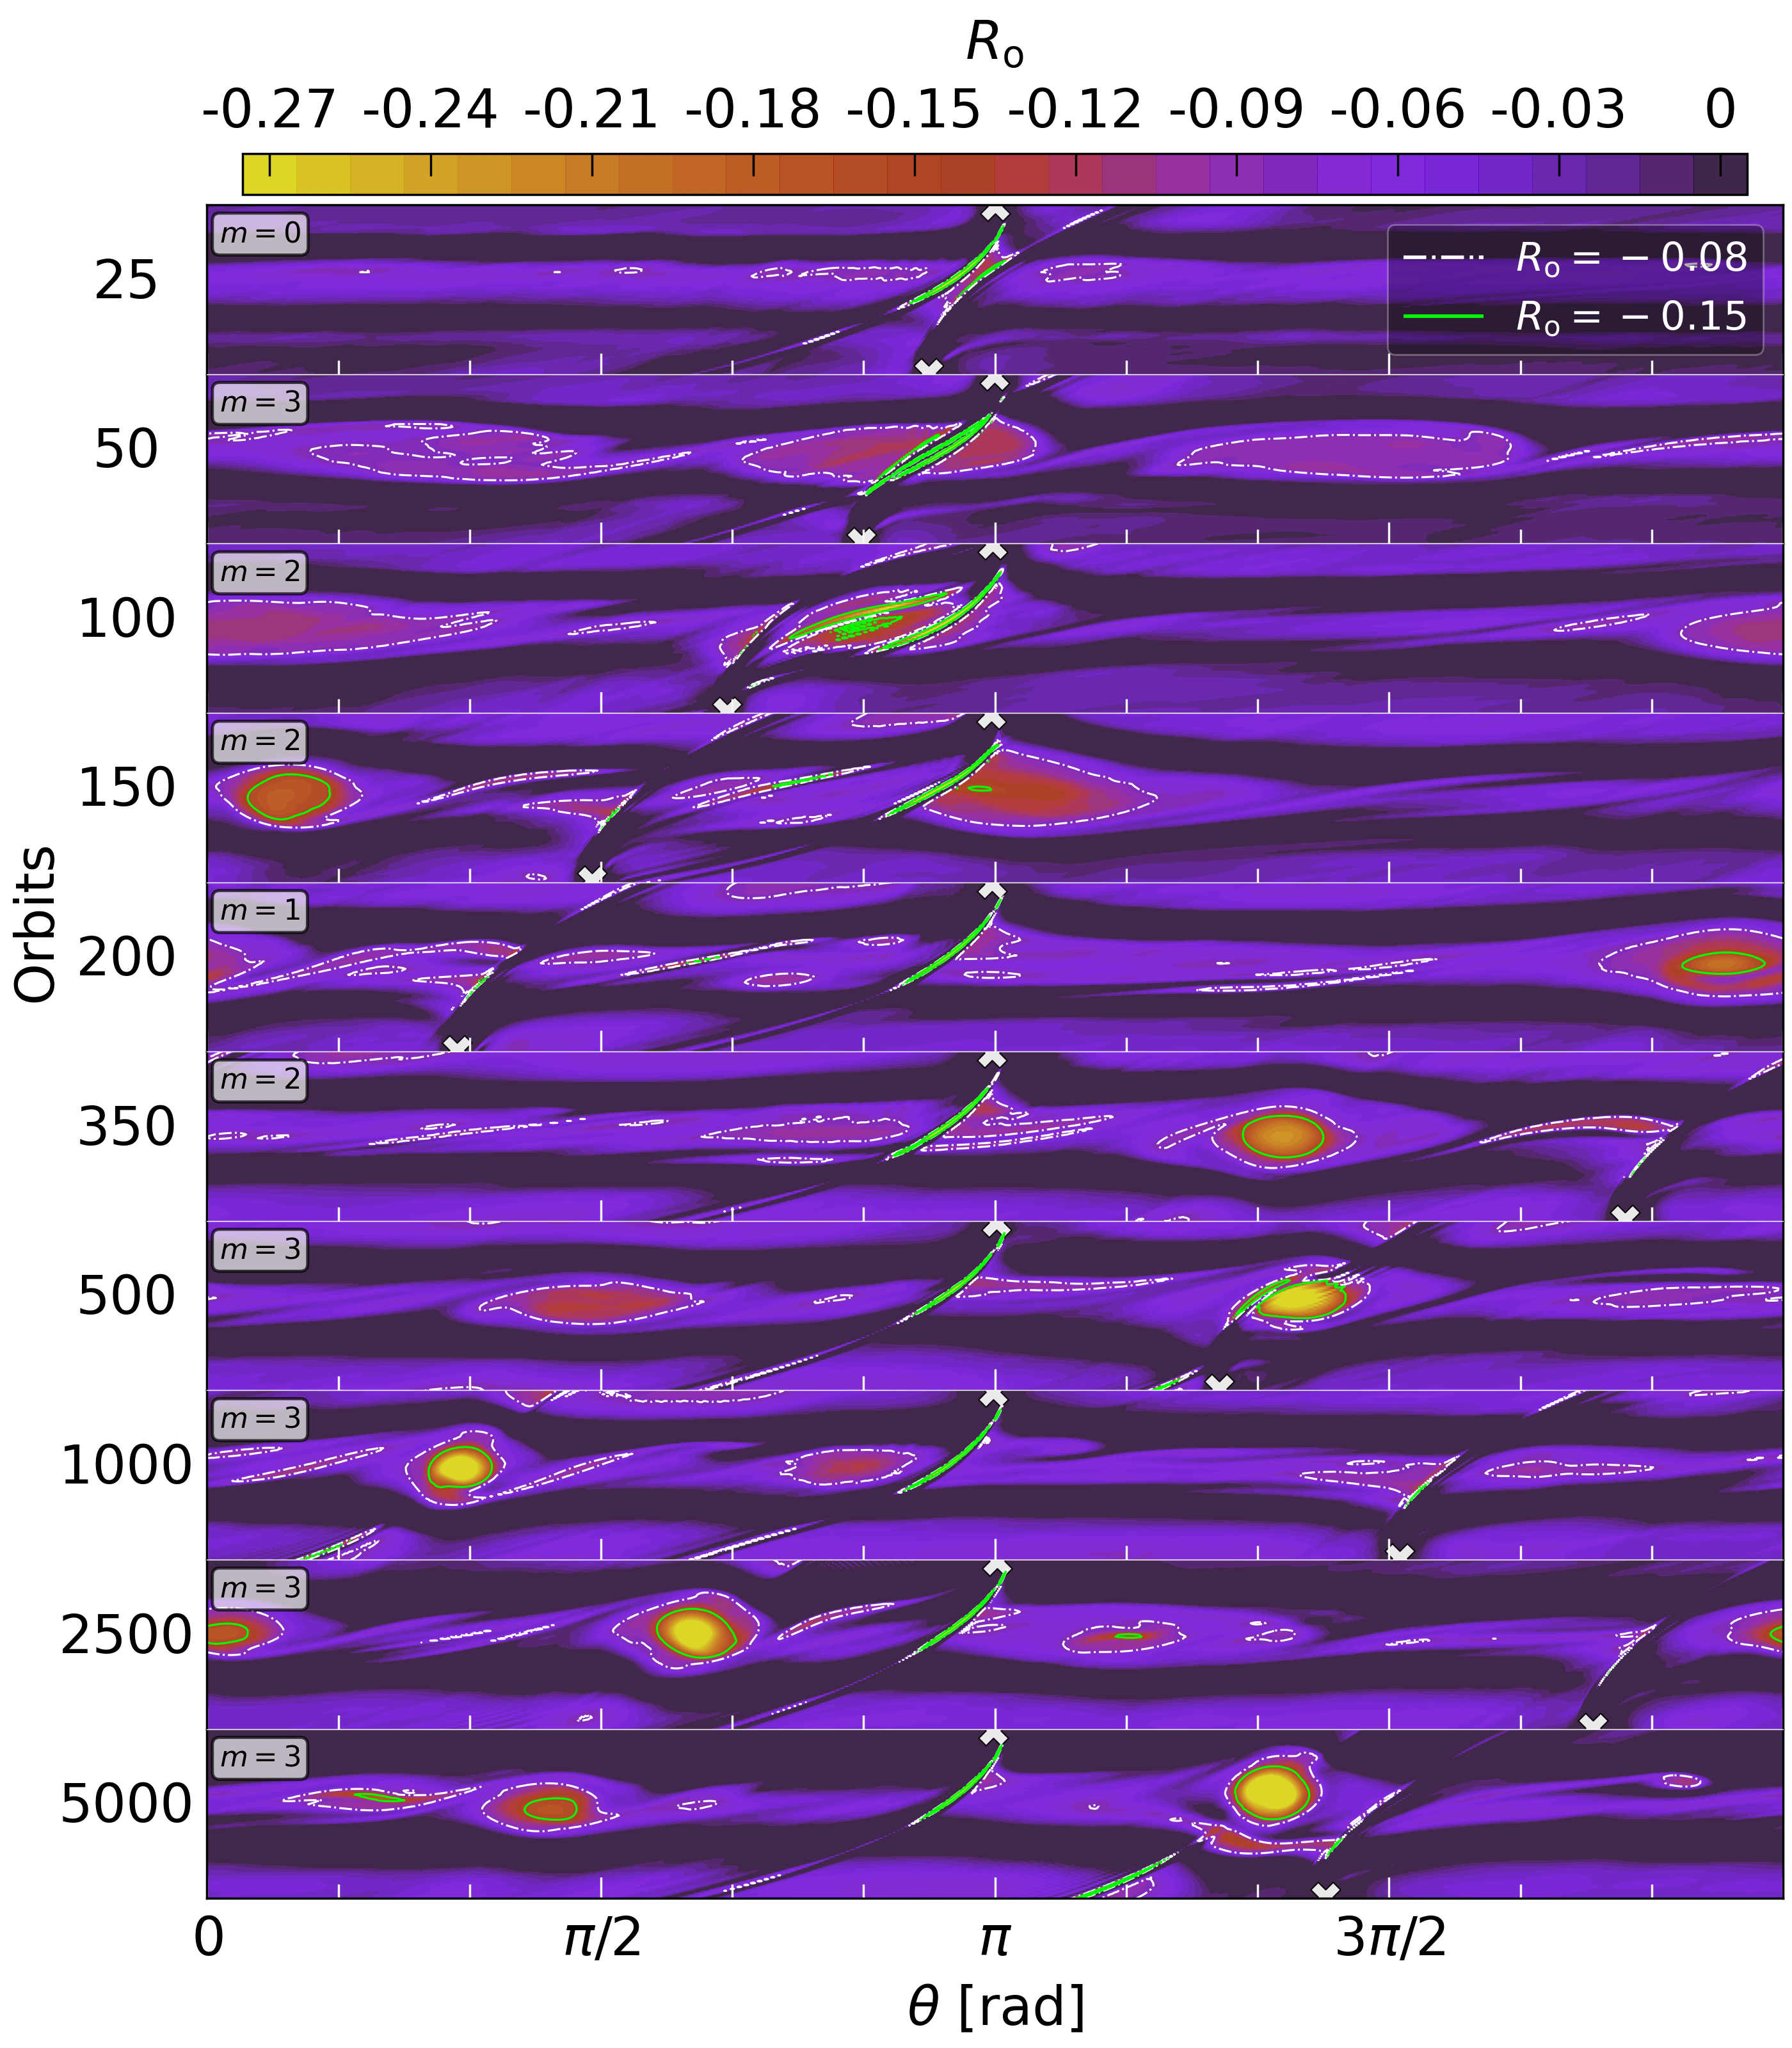
In Figure 5 we show the evolution of the Rossby number for simulation , focusing in the radial region between the planets where the vortices develop.
We observe that the vortices start appearing after orbits and with azimuthal symmetry and elongated. As time progresses, the number of vortices changes and becomes more compact. This general behavior is unlike previous results with a single planet where vortices tend to get more elongated and finally decay away (Rometsch et al., 2021; Hammer et al., 2021).
We observe that stronger vortices with higher values of the Rossby are more compact, as expected from the classification in Surville & Barge (2015), with elongated incompressible vortices for and compact compressible vortices for which (see the green contours in Figure 5). In order to be more quantitative, we define the aspect ratio of the contours, where and are the radial and azimuthal extents measured relative the center at , respectively.
We find that when at the vortex center, consistent with the value of found by Surville & Barge (2015), who define the aspect ratio using streamlines (Figure 10 therein). Also, consistent are the density waves observed in panels (d.1) and (d.2) of Figure 1, which are expected for these compact vortices with open streamlines spiraling outward from the core (Bodo et al., 2005; Surville & Barge, 2015).
6 Common gaps (Regime III)
Following a similar treatment as in §5.1.3, in panel (e.1) of Figure 4 we show that peaks and of the vortensity perturbation are superimposed due to close proximity between the planets (compare to panel d.1). This peak falls in the region between the planets, making this region stable to RWI, which consequently either does not allow accumulations or has been quickly dissipated by wakes, unlike the Regime II case. Moreover, the negative values of lie in the co-orbital regions of the planets. Thus, stable Lagrange points and may be subject to RWI to become in stronger vortices. In addition, a portion of their gas accumulations are supplied by density waves launched by the planetary companion. Both effects provide a shallower common-gap that achieves a more effective gas trapping and long-lasting agglomerations at and .
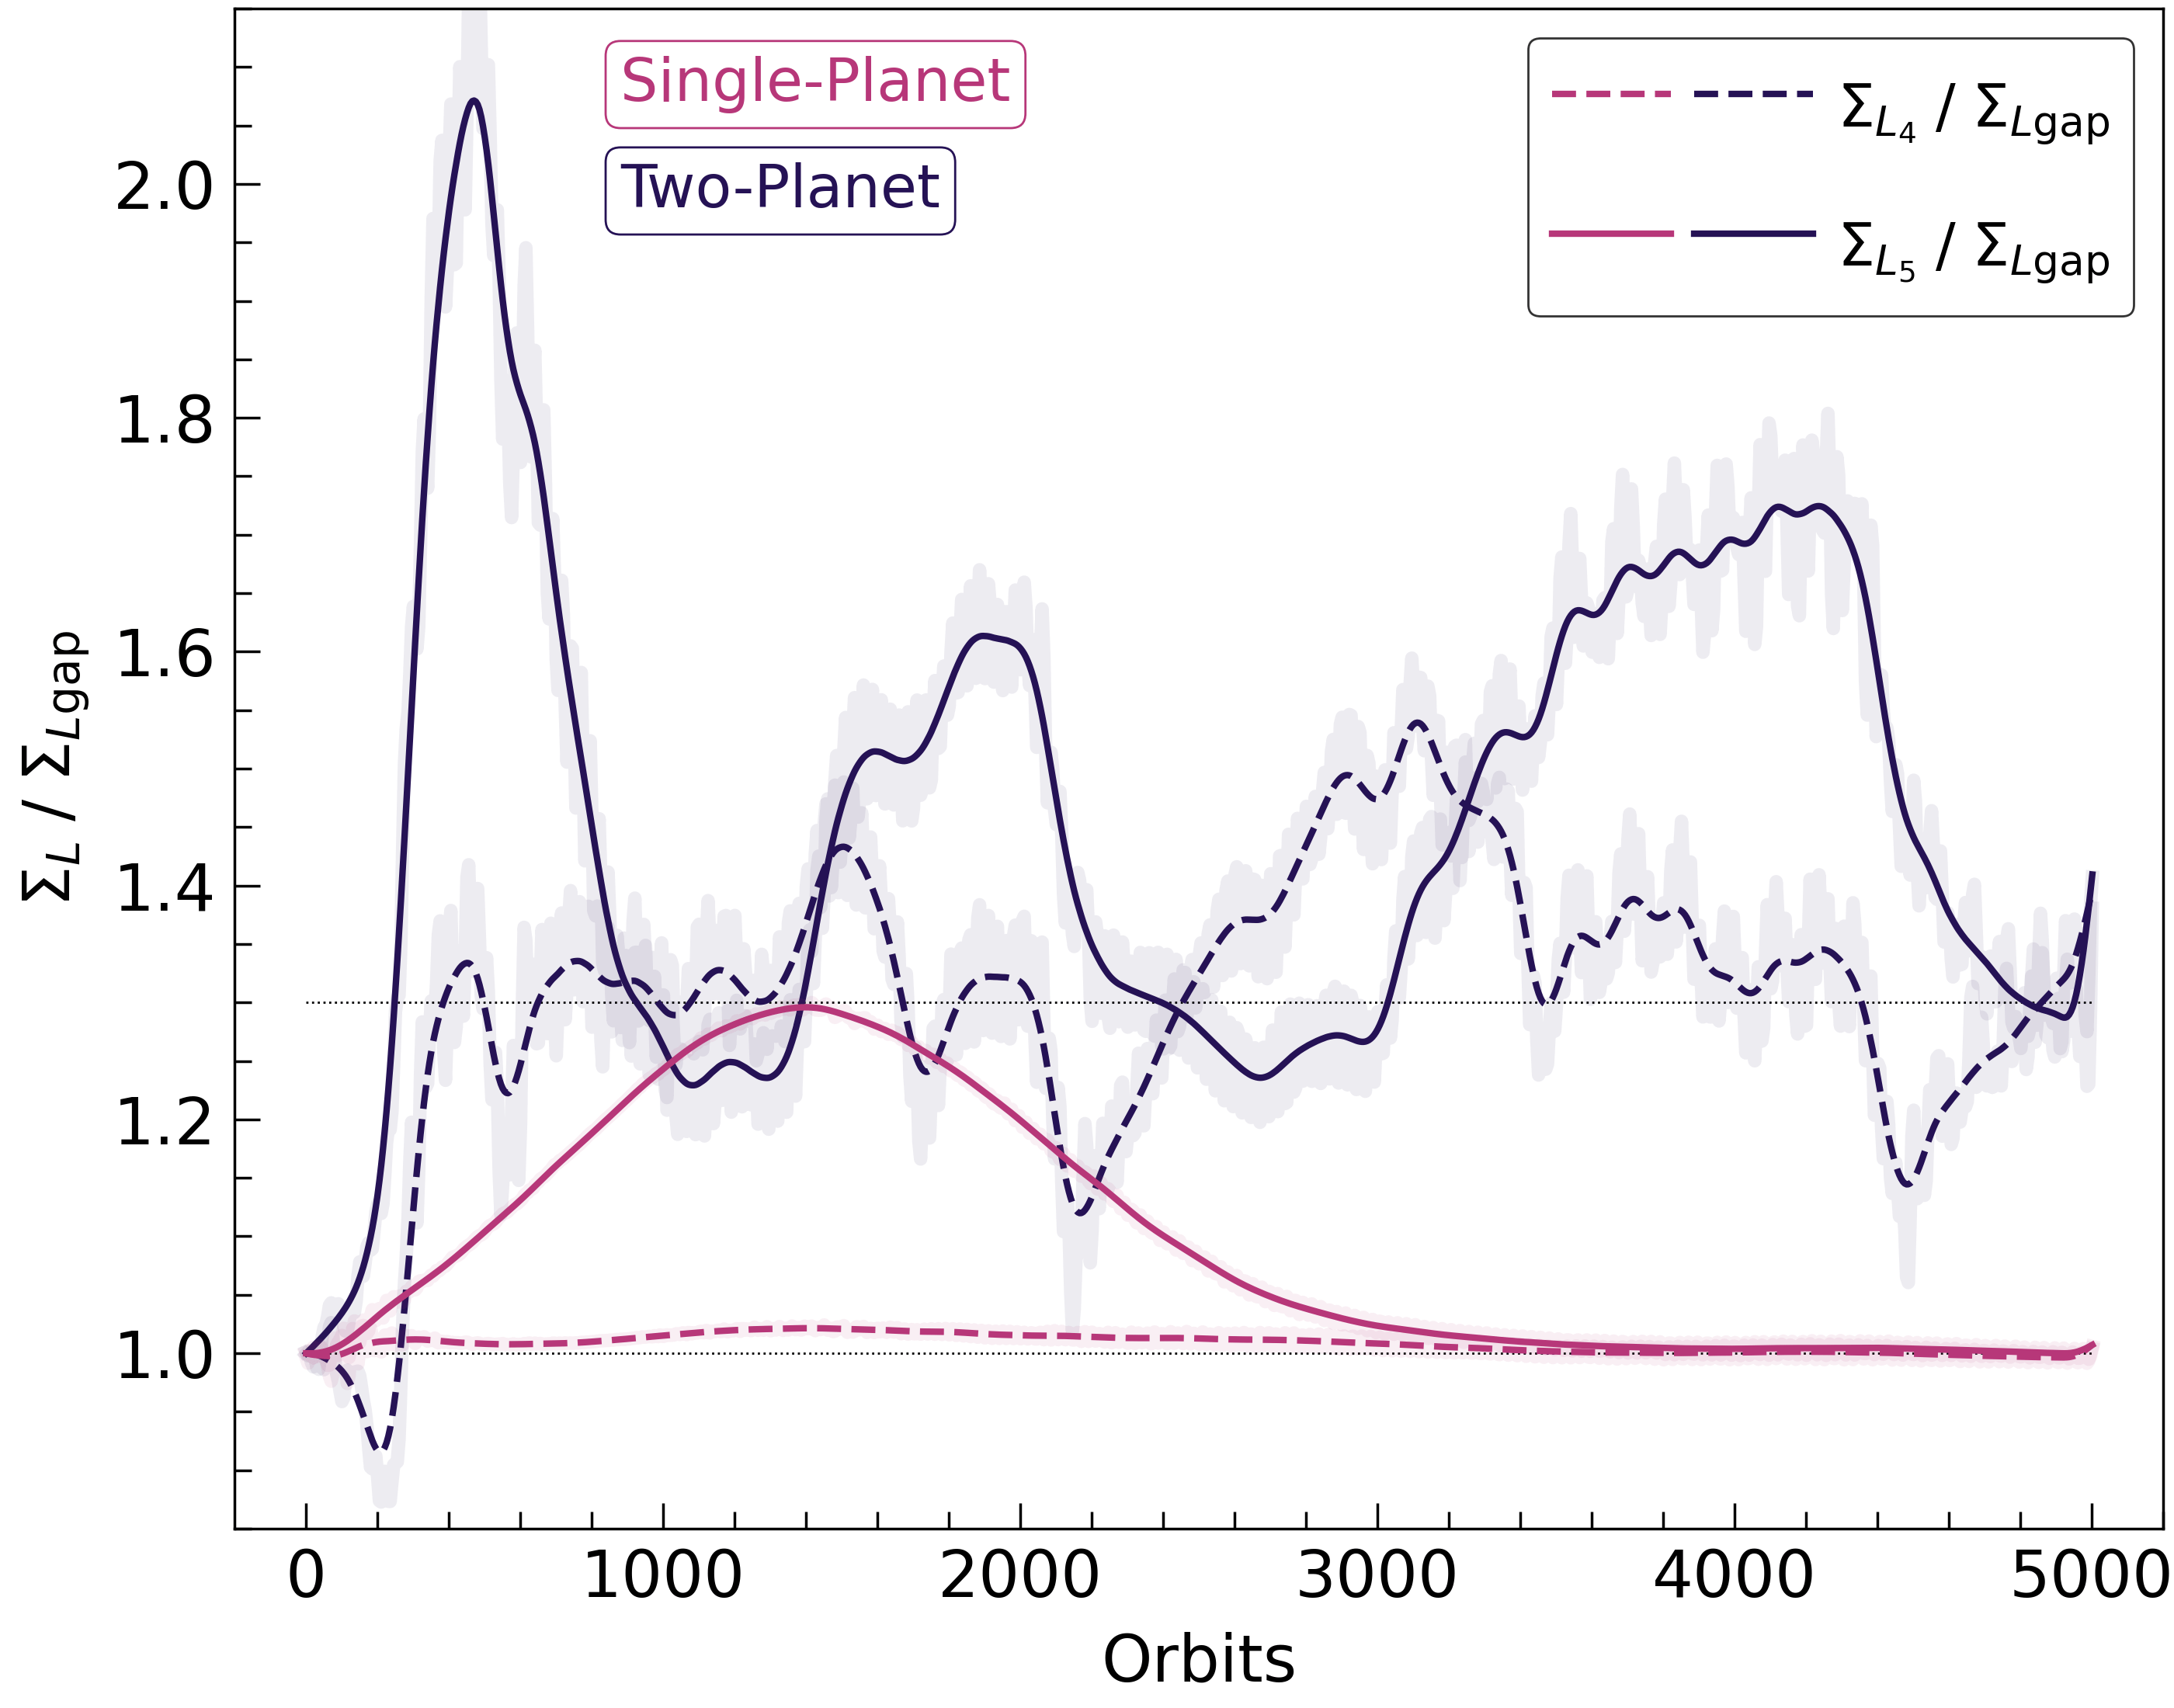
6.1 Lagrange points L4 and L5 evolution
In order to quantify how much mass remains around the Lagrange points, we define , as the mean gas surface density in the respective Lagrange points. Additionally, we denote as a local gap reference point in the co-orbital region far away from and to represent the emptier region. Radially, their widths correspond to the limits of shock surface with respect to the planet (i.e., ) and azimuthally were defined by
| (14) | |||||
| (15) | |||||
| (16) |
where is the azimuthal position of the planet.
Figure 6 shows the evolution of and that is expected to be larger than unity if the gas is evacuated slower in the stable Lagrange points relative to . The measurements were only over the planets positioned at au in models and .
The single-planet model shows an orderly evolution with reaching after orbits and then decaying to unity after orbits, where the gap is azimuthally uniform. The same behavior occurs for but with a much smaller peak amplitude, consistent with previous simulations that show more prominent asymmetries for (Rodenkirch et al., 2021). In contrast, the the two-planet case is far more dynamic, chaotically alternating the strength of the asymmetries between and , and not settling around a single value. The final value after orbits of both and is , similar to the peak of a single-planet case. In addition, panel (e.1) in Figure 1 shows that this chaotic dynamic may switch the asymmetry between and for the outer planet, that show more prominent. We also tried a case with three planets, where the behavior is also quite dynamic and the asymmetries reach even larger values.
In summary, our simulations show that the lifetime and the contrast of the over-densities around and is largely increased by the presence of a nearby planetary companion.
7 Discussion
We have shown that sufficiently compact multi-planet systems produce long-standing non-axisymmetric substructures, under conditions where a single planet does not. Our results do not directly depend on the stellocentric distances, but on the aspect ratio , thus allowing us to scale our predictions to more realistic, currently observable, distance scales. We discuss the conditions and possible interpretation of our findings.
7.1 Observational signatures
We have argued that vortices live significantly longer in compact multi-planet systems compared to single-planet cases. However, beyond the longevity and, therefore, the likelihood of detection, one would like to identify any distinguishing morphological features produced by compact multi-planet systems. We identify three.
Vortices within gaps
Unlike in a single-planet system, where the RWI-driven vortices are excited at the gap edges and may migrate outwards moving away from the density gap (Hammer et al., 2021), the vortices in our Regime II remain in between the planets, well inside the gap. This occurs even if the planets undergo orbital migration.
Beyond the RWI-driven vortices, we note that crescent-shaped gas structures could be produced, in the co-orbital region of a single planet, due to the slow evacuation of gas around the stable Lagrange points. As such, the dust trapping at and could leave observable signatures for Jovian masses (Montesinos et al., 2020; Rodenkirch et al., 2021). The elongated vortices provided by Regime II show comparable morphologies to these works but with the advantage of being a less transient feature. On the other hand, our Regime III associated with the Lagrange points would produce crescent-shaped structures like in the single-planet case, but these are not centered at the gap structure. These features are reminiscent of the off-centered structure around HD 163296 (Isella et al., 2018) and would require further investigation.
Compact vortices
The vortices driven by the RWI in single-planet systems are generally crescent-shaped, elongated (aspect ratios above ) (Surville & Barge, 2015), with few exceptions (e.g., Les & Lin, 2015; Boehler et al., 2021; Hammer et al., 2021). As we show, in our Regime II the vortices can reach aspect ratios down to .
Observationally, continuum point-like emissions inside density gaps have been found such as the signal inside HD 100546 cavity (Pérez et al., 2020). In a single-planet case inside a gap, the most reasonable explanation is the emission from a circumplanetary disk (CPD). In contrast, in a two-planet system, such emission may be produced by dust trapped in compact vortices. This hypothesis should be further investigated by adding dust dynamics into our gas-only simulations.
Shallower gaps
The panels (a.3) and (e.3) in Figure 1 show that the density gap carved by a compact planet system remains shallower than a single planet case by a factor . This is due to both the remaining gas in the Lagrange points and AMF injection due to the neighboring planet may set a floor for the gap depth. The latter effect was previously discussed by Duffell & Dong (2015) for Jovian-mass planets.
Current observations of density gaps (generally based on dust continuum) have been associated with a single planet per gap (Zhang et al., 2018).
If these observations are not able to detect such massive planets and the gaseous gaps are shallower than theoretically expected, a competitive scenario is that the gap may be carved by multiple lower-mass planets. As we describe in more detail in §7.2, both the depth and width of a density gap for a two-planet system cannot be reproduced by a single planet. For a given width, a single planet produces a much deeper gap.
We remark that these features are only based on dust-free simulations and guided by previous works (and some preliminary simulations with dust) showing correspondence between vortices and dust accumulation (Brauer et al., 2008; Birnstiel et al., 2013). In a future work, we shall consider the dust evolution in our simulations and provide more realistic and quantitative observable predictions.
7.2 A single giant planet vs two sub-Neptunes
As shown, (Eq. 11) delimits when planets form separate gaps. In case to consider a Regime II, but the substructure is not prominent enough, the limit may be dropped to , that means, the upper limit for a system with two equal sub-thermal mass planets that share a density gap, e.g., Figure 1 (c). Following Kanagawa et al. (2016) the gap width for a single planet is given by , thus, the total gap width for a two-planet system is .
We consider the upper limit and to determine the necessary single-planet mass () positioned at to resemble , where using we roughly find that
| (17) |
If the fiducial parameters are considered (), Eq. 17 shows that a more massive planet with is necessary. In this way, the gap resembles in width but will be affected in depth. Previous studies (Duffell, 2015; Kanagawa et al., 2015, hereafter K15) have revealed that the gap depth is , where . Thus, a more massive planet will open a deeper gap, and theoretically, our single-planet gap would be times deeper than our common gap.
Recently, the Molecules with ALMA on Planet-forming Scales (MAPS) ALMA Large Program (Öberg et al., 2021) has observed the gas distributions in PPDs. A comparison with dust continuum observations shows that some deep dust continuum gaps do not have corresponding CO gaps (Zhang et al., 2021), while for some gaps where there is correspondence, the gaps may be times shallower than predictions from disk-planet interactions. These predictions are based on a single planet per gap (Zhang et al., 2018), while our results show that a compact system can produce a much shallower gap by a factor of . Thus, placing two-Neptune instead of a Jovian may agree better with the CO MAPS results.
7.3 Planet migration and mean motion resonances
A well known outcome of convergent migration is the capture into mean-motion resonances (MMRs), especially into the strong first-order ones (e.g., 2:1, 3:2). Given the low surfaces densities in our simulations, the planets do not migrate, at least within orbits. However, given our results, we may still wonder whether planets near these commensurabilities could be in the non-axisymmetric Regimes II or III.
From Figure 2, the condition to be in Regimes either II or III (, Eq. 11) could be roughly expressed as444We have assumed that the aspect ratio around both planets is the same, or, equivalently the flaring index .
| (18) |
Thus, at 2:1 MMR () and for 3:2 MMR (), the condition for the aspect ratio and planet mass from Eq. 18 reads
| (19) | |||||
| (20) |
We recall that these estimates have been tested for a limited range of parameters and sub-thermal-mass planets (), or for near Neptune-mass planets. Thus, vortices between the planets may be common in systems captured into 3:2 MMRs, but less commonly expected in systems around the 2:1 MMRs. As a proof of concept, we ran the model increasing the surface density by a factor of 400 to . Its planet separation start in , wider than 3:2 MMR. We check that a Regime IIlike vortex is formed and migrate with the planets. Consistent with our estimates, the recent simulations by Cui et al. (2021) including migration and crossing of the 3:2 MMR, do not show evidence vortices at orbits as the aspect ratio is too low (, Figure 2 therein). A more in-depth study of the dynamics including migration may be required to establish whether vortices within gaps are a consistent signature of convergent planet migration.
7.4 Outer Solar System: Neptune and Uranus
An interesting question is whether the planets in our Solar System may be detectable if placed around another star. Given our proposal that Neptune-mass planets may exhibit readily observable vortices, we assess whether the Uranus and Neptune pair lie in Regimes II/III, especially interesting as the outer-most planets are most easily resolvable given our current spatial resolution constraints.
For the current orbital separations of Uranus and Neptune with , we find that a Regime II would require an aspect ratio , thus suggesting that the Regime I is more likely. However, in the disk-embedded phases, their relative separations were likely smaller given Neptune’s outward planetesimal-driven migration from au () (Malhotra, 1993) or an earlier period of dynamical upheaval555The so-called Nice model suggests that Uranus and Neptune started more compact at au and au () and crossed their orbits (Tsiganis et al., 2005).. For reference, if we find that the Regime II is reached for . We have confirmed these estimates by running a simulation with Uranus and Neptune separated by using our fiducial parameters () and find that an elongated vortex forms in between the planets.
7.5 Viscosity and Thermodynamic Effects
Miranda & Rafikov (2020) explored the role of viscosity in density wave propagation, showed that viscous damping is subdominant compared with nonlinear effects. It becomes competitive just for . Also, studies by analyzing spectral line broadening (Flaherty et al., 2015, 2018) have shown low-turbulence values () in discs. However, non-zero viscosity play a role in gap depth through (Duffell, 2015, 2020; Kanagawa et al., 2015, 2017; Dempsey et al., 2020) as . Therefore, is not essential to classify regimens but so important to contrast the substructures with respect to the gap, obtaining more prominent agglomerations for larger . In addition, Hammer et al. (2021) shows that vortices produced at the edges of the gap are long-lived when are triggered by lower , smaller , and lower values.
Radiative damping can play an important role in the wave dissipation (Miranda & Rafikov, 2020) and for cooling time in the range , the planetary spiral waves become weaker and the AMF dissipates faster compared to the the spirals in an isothermal disk (Zhang & Zhu, 2020). Accordingly, the vortices’ lifetime may be affected by considering a finite cooling time as shown by Rometsch et al. (2021), where the shortest lifetimes occur for (Fung & Ono, 2021). A similar effect may be expected in our simulations, but possibly less important as the vortices’ lifetimes in simulations with multiple planets depend on more factors than just the wave damping by shocks. We defer this study for future work.
| Model | Regime | |||||||||
|---|---|---|---|---|---|---|---|---|---|---|
| [cells cells] | [] | [au] | [] | [au] | (K15) | (Eq. 10) | (§4.2) | |||
| M1_0.0 | 0.0516 | 768 1280 | 34 | 1.005 | — | 0.059 | 284 | — | — | |
| M1_4.3 | 0.0516 | 768 1280 | 34, 34 | 1.005, 1.197 | 4.26 | 0.059, 0.074 | 283, 250 | 1.45 | III | |
| M1_5.6 | 0.0516 | 512 768 | 34, 34 | 1.005, 1.264 | 5.59 | 0.059, 0.079 | 283, 240 | 1.88 | III | |
| M1_6.0 | 0.0516 | 512 768 | 34, 34 | 1.005, 1.286 | 6.01 | 0.059, 0.081 | 283, 237 | 2.02 | III | |
| M1_6.4 | 0.0516 | 512 768 | 34, 34 | 1.005, 1.309 | 6.43 | 0.059, 0.083 | 283, 234 | 2.15 | II | |
| M1_7.2 | 0.0516 | 768 1280 | 34, 34 | 1.005, 1.354 | 7.24 | 0.059, 0.087 | 283, 229 | 2.40 | II | |
| M1_8.0 | 0.0516 | 512 768 | 34, 34 | 1.005, 1.399 | 8.03 | 0.059, 0.09 | 283, 223 | 2.65 | II | |
| M1_8.8 | 0.0516 | 768 1280 | 34, 34 | 1.005, 1.444 | 8.78 | 0.059, 0.094 | 283, 218 | 2.87 | II | |
| M1_9.5 | 0.0516 | 512 768 | 34, 34 | 1.005, 1.489 | 9.51 | 0.059, 0.098 | 283, 214 | 3.09 | II | |
| M1_9.9 | 0.0516 | 512 768 | 34, 34 | 1.005, 1.512 | 9.86 | 0.059, 0.100 | 283, 211 | 3.19 | II | |
| M1_10.2 | 0.0516 | 512 768 | 34, 34 | 1.005, 1.535 | 10.22 | 0.059, 0.102 | 283, 209 | 3.30 | II | |
| M1_10.9 | 0.0516 | 768 1280 | 34, 34 | 1.005, 1.580 | 10.89 | 0.059, 0.106 | 283, 205 | 3.49 | I | |
| M2_6.0 | 0.0516 | 512 768 | 30, 30 | 1.005, 1.272 | 5.99 | 0.062, 0.084 | 220, 186 | 1.83 | III | |
| M2_6.9 | 0.0516 | 512 768 | 30, 30 | 1.005, 1.317 | 6.87 | 0.062, 0.088 | 220, 181 | 2.09 | II | |
| M2_8.5 | 0.0516 | 512 768 | 30, 30 | 1.005, 1.408 | 8.52 | 0.062, 0.096 | 220, 173 | 2.56 | II | |
| M2_9.7 | 0.0516 | 512 768 | 30, 30 | 1.005, 1.476 | 9.69 | 0.062, 0.102 | 220, 167 | 2.88 | II | |
| M2_11.2 | 0.0516 | 512 768 | 30, 30 | 1.005, 1.566 | 11.16 | 0.062, 0.110 | 220, 160 | 3.26 | I | |
| M3_7.1 | 0.0516 | 512 768 | 15, 15 | 1.005, 1.255 | 7.12 | 0.081, 0.109 | 55, 46 | 1.31 | III | |
| M3_10.4 | 0.0516 | 512 768 | 15, 15 | 1.005, 1.394 | 10.44 | 0.081, 0.125 | 55, 43 | 1.89 | II | |
| M3_12.0 | 0.0516 | 512 768 | 15, 15 | 1.005, 1.465 | 11.99 | 0.081, 0.133 | 55, 42 | 2.14 | I | |
| M4_3.1 | 0.06 | 640 1024 | 30, 30 | 1.005, 1.135 | 3.10 | 0.086, 0.101 | 103, 95 | 0.70 | III | |
| M4_4.5 | 0.06 | 640 1024 | 30, 30 | 1.005, 1.199 | 4.51 | 0.086, 0.108 | 103, 91 | 1.00 | III | |
| M4_5.8 | 0.06 | 640 1024 | 30, 30 | 1.005, 1.264 | 5.84 | 0.086, 0.116 | 103, 88 | 1.29 | III | |
| M4_7.1 | 0.06 | 640 1024 | 30, 30 | 1.005, 1.329 | 7.09 | 0.086, 0.124 | 103, 85 | 1.55 | III | |
| M4_9.0 | 0.06 | 640 1024 | 30, 30 | 1.005, 1.437 | 9.04 | 0.086, 0.137 | 103, 80 | 1.94 | II | |
| M4_10.9 | 0.06 | 512 768 | 30, 30 | 1.005, 1.549 | 10.88 | 0.086, 0.151 | 103, 76 | 2.29 | II | |
| M4_12.7 | 0.06 | 512 768 | 30, 30 | 1.005, 1.667 | 12.65 | 0.086, 0.167 | 103, 72 | 2.62 | I | |
| M5_4.5 | 0.04 | 640 1024 | 10, 10 | 1.005, 1.135 | 4.46 | 0.055, 0.064 | 87, 80 | 1.09 | III | |
| M5_6.5 | 0.04 | 640 1024 | 10, 10 | 1.005, 1.199 | 6.50 | 0.055, 0.069 | 87, 77 | 1.58 | III | |
| M5_7.2 | 0.04 | 640 1024 | 10, 10 | 1.005, 1.221 | 7.15 | 0.055, 0.070 | 87, 76 | 1.73 | III | |
| M5_8.4 | 0.04 | 640 1024 | 10, 10 | 1.005, 1.264 | 8.42 | 0.055, 0.074 | 87, 74 | 2.02 | II | |
| M5_10.2 | 0.04 | 640 1024 | 10, 10 | 1.005, 1.329 | 10.23 | 0.055, 0.079 | 87, 71 | 2.43 | II | |
| M5_11.8 | 0.04 | 512 768 | 10, 10 | 1.005, 1.388 | 11.78 | 0.055, 0.083 | 87, 69 | 2.77 | I | |
| M6_4.5 | 0.0316 | 640 1024 | 10, 10 | 1.005, 1.135 | 4.46 | 0.033, 0.038 | 283, 260 | 1.83 | III | |
| M6_6.5 | 0.0316 | 640 1024 | 10, 10 | 1.005, 1.199 | 6.50 | 0.033, 0.041 | 283, 249 | 2.64 | II | |
| M6_8.4 | 0.0316 | 640 1024 | 10, 10 | 1.005, 1.264 | 8.42 | 0.033, 0.044 | 283, 240 | 3.39 | II | |
| M6_9.6 | 0.0316 | 640 1024 | 10, 10 | 1.005, 1.308 | 9.64 | 0.033, 0.046 | 283, 235 | 3.85 | I | |
| M7_8.4 | 0.08 | 512 768 | 100, 100 | 1.005, 1.655 | 8.35 | 0.100, 0.192 | 273, 191 | 2.23 | II | |
| M8_0.0 | 0.0516 | 768 1280 | 50 | 1.005 | — | 0.050 | 612 | — | — | |
| M9_0.0 | 0.0516 | 768 1280 | 90 | 1.005 | — | 0.039 | 1984 | — | — | |
| MSS_NU | 0.0516 | 768 1280 | 15, 17 | 12.56, 17.59 | 10.52 | 1.029, 1.495 | 51, 57 | 1.99 | II | |
| P_2Dg | 0.0516 | 512 768 | 34, 34llCorresponding planetary masses used in Lin & Papaloizou (1986) modified formula, see Apendix A. | 1.005, 1.444 | 8.78 | 0.059 | 283 | — | II | |
| 2DgsP_2Dg | 0.0516 | 512 768 | 34llCorresponding planetary masses used in Lin & Papaloizou (1986) modified formula, see Apendix A.,1, 34llCorresponding planetary masses used in Lin & Papaloizou (1986) modified formula, see Apendix A. | 1.0,1.0, 1.44 | 8.78 | 0.240 | 0.25 | — | I | |
| 2Dg_2Dg | 0.0516 | 512 768 | 34llCorresponding planetary masses used in Lin & Papaloizou (1986) modified formula, see Apendix A., 34llCorresponding planetary masses used in Lin & Papaloizou (1986) modified formula, see Apendix A. | 1.005, 1.444 | 8.78 | — | — | — | I |
8 Conclusions
We performed 2D hydrodynamic simulations of compact systems in the sub-thermal mass regime to study the disk’s surface density evolution.
We identify two regimes that create non-axisymmetric structures, depending on the interplanetary separation in units of (the average disk scale height around the planets):
-
•
For , a density ring that separates the planets becomes unstable to the RWI forming vortices with a wide range of aspects ratios down to .
-
•
For the most compact systems with , the planets fully share their density gaps and present long-lived elongated vortices around the stable co-rotational Lagrange points.
The vortices in both cases do not show any signs of dissipating after 5,000 - 10,000 orbits and we suggest that their longevity is promoted by their frequent interaction of spiral density waves launched by the neighboring planets.
Overall, our results show that long-lived non-axisymmetric structures inside density gaps are prevalent in compact systems with Neptune-mass planets, in contrast to single planets that create vortices at the gap edges. This distinctive feature, along with the shallower density gaps, may be smoking guns of compact multi-planet systems, possibly trapped into mean-motion resonances.
Appendix A Simulations with a 1D axisymmetric planetary torque
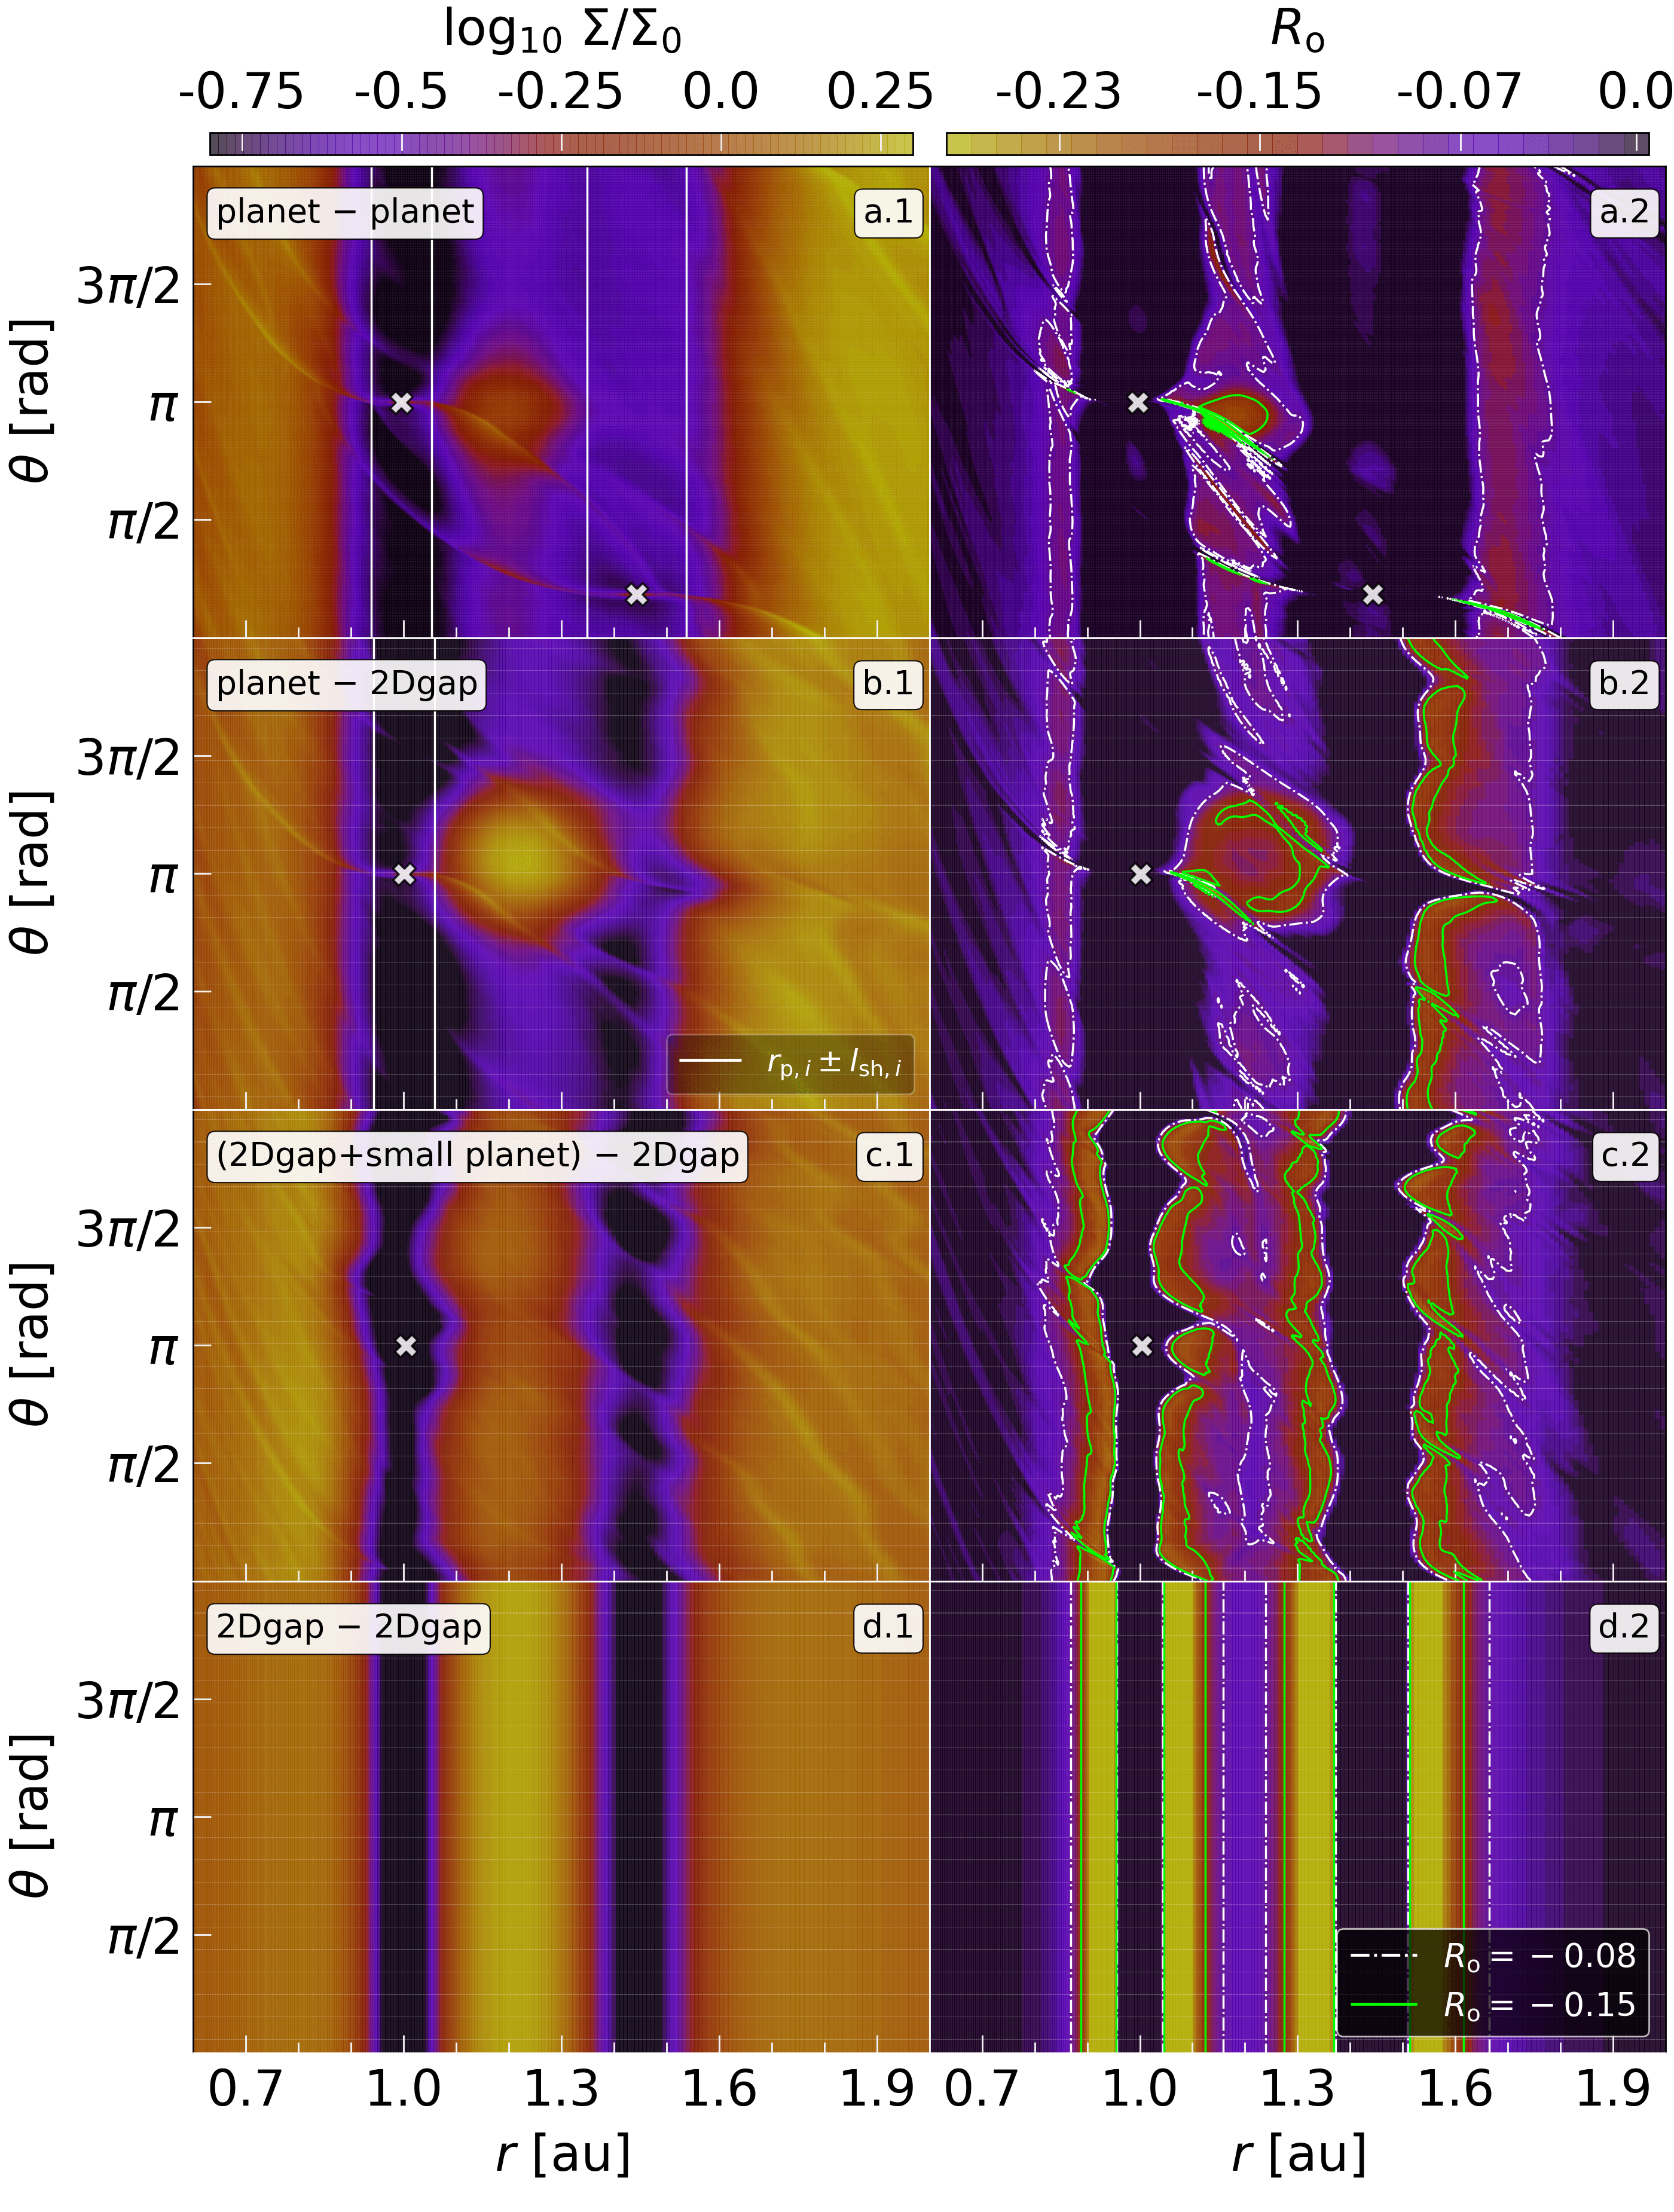
In order to study the influence of planetary torque on the vortex generation and lifetime, we perform extra simulations that include the torque density distribution of the impulse approximation described by Lin & Papaloizou (1986, Eq. 14 therein). A multiplicative factor of 0.3 is used to match the depth of the gaps to those in our simulations (otherwise the gaps are too deep). The 1D approximation is extended over the azimuth to open a fully axisymmetric gap, we will refer to this as 2Dgap.
Three configurations have been tested to compare the planetplanet case (model ), namely: the planet2Dgap, 2Dgap2Dgap and (2Dgapsmall planet)2Dgap. In the latter case we embed a low-mass planet of mass at the center of the inner gap open by the axisymmetric torque to drive radial perturbations from spiral density waves.
The Figure 7 shows all the cases after orbits and reveals that in a 2Dgap2Dgap case, there is no vortex formation anywhere in the disk. The planet2Dgap case resembles the behavior of the planetplanet case, showing a vortex with higher density values and larger radial extension. However, its Rossby number distribution is non-centrally concentrated and weaker in the center. Finally, the (2Dgapsmall planet)2Dgap case shows a turbulent environment, but no vortex has survived. In the early stages, this configuration forms two main vortices around au. While one of them decays after orbits, the other migrates inward across the inner gap ( orbits) to decay in the inner disk after orbits. We have also appreciated this vortex migration effect for a planet2Dgap case with a more compact configuration (model ).
References
- ALMA Partnership et al. (2015) ALMA Partnership, Brogan, C. L., Pérez, L. M., et al. 2015, ApJ, 808, L3, doi: 10.1088/2041-8205/808/1/L3
- Andrews (2020) Andrews, S. M. 2020, ARA&A, 58, 483, doi: 10.1146/annurev-astro-031220-010302
- Bae et al. (2018) Bae, J., Pinilla, P., & Birnstiel, T. 2018, ApJ, 864, L26, doi: 10.3847/2041-8213/aadd51
- Bae et al. (2019) Bae, J., Zhu, Z., Baruteau, C., et al. 2019, ApJ, 884, L41, doi: 10.3847/2041-8213/ab46b0
- Baruteau et al. (2019) Baruteau, C., Barraza, M., Pérez, S., et al. 2019, MNRAS, 486, 304, doi: 10.1093/mnras/stz802
- Benítez-Llambay et al. (2019) Benítez-Llambay, P., Krapp, L., & Pessah, M. E. 2019, ApJS, 241, 25, doi: 10.3847/1538-4365/ab0a0e
- Benítez-Llambay & Masset (2016) Benítez-Llambay, P., & Masset, F. S. 2016, ApJS, 223, 11, doi: 10.3847/0067-0049/223/1/11
- Birnstiel et al. (2013) Birnstiel, T., Dullemond, C. P., & Pinilla, P. 2013, A&A, 550, L8, doi: 10.1051/0004-6361/201220847
- Bodo et al. (2005) Bodo, G., Chagelishvili, G., Murante, G., et al. 2005, A&A, 437, 9, doi: 10.1051/0004-6361:20041046
- Boehler et al. (2021) Boehler, Y., Ménard, F., Robert, C. M. T., et al. 2021, A&A, 650, A59, doi: 10.1051/0004-6361/202040089
- Bowler & Nielsen (2018) Bowler, B. P., & Nielsen, E. L. 2018, Occurrence Rates from Direct Imaging Surveys (Cham: Springer International Publishing), 1967–1983, doi: "10.1007/978-3-319-55333-7_155"
- Brauer et al. (2008) Brauer, F., Dullemond, C. P., & Henning, T. 2008, A&A, 480, 859, doi: 10.1051/0004-6361:20077759
- Brož et al. (2018) Brož, M., Chrenko, O., Nesvorný, D., & Lambrechts, M. 2018, A&A, 620, A157, doi: 10.1051/0004-6361/201833855
- Carter et al. (2012) Carter, J. A., Agol, E., Chaplin, W. J., et al. 2012, Science, 337, 556, doi: 10.1126/science.1223269
- Cimerman et al. (2018) Cimerman, N. P., Kley, W., & Kuiper, R. 2018, A&A, 618, A169, doi: 10.1051/0004-6361/201833591
- Cimerman & Rafikov (2021) Cimerman, N. P., & Rafikov, R. R. 2021, arXiv e-prints, arXiv:2108.01423. https://arxiv.org/abs/2108.01423
- Cui et al. (2021) Cui, Z., Papaloizou, J. C. B., & Szuszkiewicz, E. 2021, arXiv e-prints, arXiv:2108.00792. https://arxiv.org/abs/2108.00792
- Cumming et al. (2008) Cumming, A., Butler, R. P., Marcy, G. W., et al. 2008, PASP, 120, 531, doi: 10.1086/588487
- de Val-Borro et al. (2007) de Val-Borro, M., Artymowicz, P., D’Angelo, G., & Peplinski, A. 2007, A&A, 471, 1043, doi: 10.1051/0004-6361:20077169
- de Val-Borro et al. (2006) de Val-Borro, M., Edgar, R. G., Artymowicz, P., et al. 2006, MNRAS, 370, 529, doi: 10.1111/j.1365-2966.2006.10488.x
- Dempsey et al. (2020) Dempsey, A. M., Lee, W.-K., & Lithwick, Y. 2020, ApJ, 891, 108, doi: 10.3847/1538-4357/ab723c
- Dipierro et al. (2015) Dipierro, G., Price, D., Laibe, G., et al. 2015, MNRAS, 453, L73, doi: 10.1093/mnrasl/slv105
- Dong et al. (2011a) Dong, R., Rafikov, R. R., & Stone, J. M. 2011a, ApJ, 741, 57, doi: 10.1088/0004-637X/741/1/57
- Dong et al. (2011b) Dong, R., Rafikov, R. R., Stone, J. M., & Petrovich, C. 2011b, ApJ, 741, 56, doi: 10.1088/0004-637X/741/1/56
- Dong et al. (2015) Dong, R., Zhu, Z., & Whitney, B. 2015, ApJ, 809, 93, doi: 10.1088/0004-637X/809/1/93
- Duffell (2015) Duffell, P. C. 2015, ApJ, 807, L11, doi: 10.1088/2041-8205/807/1/L11
- Duffell (2020) —. 2020, ApJ, 889, 16, doi: 10.3847/1538-4357/ab5b0f
- Duffell & Dong (2015) Duffell, P. C., & Dong, R. 2015, ApJ, 802, 42, doi: 10.1088/0004-637X/802/1/42
- Fedele et al. (2021) Fedele, D., Toci, C., Maud, L., & Lodato, G. 2021, A&A, 651, A90, doi: 10.1051/0004-6361/202141278
- Flaherty et al. (2015) Flaherty, K. M., Hughes, A. M., Rosenfeld, K. A., et al. 2015, ApJ, 813, 99, doi: 10.1088/0004-637X/813/2/99
- Flaherty et al. (2018) Flaherty, K. M., Hughes, A. M., Teague, R., et al. 2018, ApJ, 856, 117, doi: 10.3847/1538-4357/aab615
- Flock et al. (2015) Flock, M., Ruge, J. P., Dzyurkevich, N., et al. 2015, A&A, 574, A68, doi: 10.1051/0004-6361/201424693
- Francis & van der Marel (2020) Francis, L., & van der Marel, N. 2020, ApJ, 892, 111, doi: 10.3847/1538-4357/ab7b63
- Fung & Ono (2021) Fung, J., & Ono, T. 2021, ApJ, 922, 13, doi: 10.3847/1538-4357/ac1d4e
- Goldreich & Tremaine (1980) Goldreich, P., & Tremaine, S. 1980, ApJ, 241, 425, doi: 10.1086/158356
- Goodman & Rafikov (2001) Goodman, J., & Rafikov, R. R. 2001, ApJ, 552, 793, doi: 10.1086/320572
- Haffert et al. (2019) Haffert, S. Y., Bohn, A. J., de Boer, J., et al. 2019, Nature Astronomy, 3, 749, doi: 10.1038/s41550-019-0780-5
- Hallam & Paardekooper (2017) Hallam, P. D., & Paardekooper, S. J. 2017, MNRAS, 469, 3813, doi: 10.1093/mnras/stx1073
- Hammer et al. (2021) Hammer, M., Lin, M.-K., Kratter, K. M., & Pinilla, P. 2021, MNRAS, doi: 10.1093/mnras/stab1079
- Hayashi (1981) Hayashi, C. 1981, Progress of Theoretical Physics Supplement, 70, 35, doi: 10.1143/PTPS.70.35
- Hunter (2007) Hunter, J. D. 2007, Computing in Science and Engineering, 9, 90, doi: 10.1109/MCSE.2007.55
- Isella et al. (2018) Isella, A., Huang, J., Andrews, S. M., et al. 2018, ApJ, 869, L49, doi: 10.3847/2041-8213/aaf747
- Kanagawa et al. (2016) Kanagawa, K. D., Muto, T., Tanaka, H., et al. 2016, PASJ, 68, 43, doi: 10.1093/pasj/psw037
- Kanagawa & Szuszkiewicz (2020) Kanagawa, K. D., & Szuszkiewicz, E. 2020, ApJ, 894, 59, doi: 10.3847/1538-4357/ab862f
- Kanagawa et al. (2017) Kanagawa, K. D., Tanaka, H., Muto, T., & Tanigawa, T. 2017, PASJ, 69, 97, doi: 10.1093/pasj/psx114
- Kanagawa et al. (2015) Kanagawa, K. D., Tanaka, H., Muto, T., Tanigawa, T., & Takeuchi, T. 2015, MNRAS, 448, 994, doi: 10.1093/mnras/stv025
- Kanagawa et al. (2018) Kanagawa, K. D., Tanaka, H., & Szuszkiewicz, E. 2018, ApJ, 861, 140, doi: 10.3847/1538-4357/aac8d9
- Keppler et al. (2018) Keppler, M., Benisty, M., Müller, A., et al. 2018, A&A, 617, A44, doi: 10.1051/0004-6361/201832957
- Kokubo & Ida (1998) Kokubo, E., & Ida, S. 1998, Icarus, 131, 171, doi: 10.1006/icar.1997.5840
- Krapp et al. (2018) Krapp, L., Gressel, O., Benítez-Llambay, P., et al. 2018, ApJ, 865, 105, doi: 10.3847/1538-4357/aadcf0
- Les & Lin (2015) Les, R., & Lin, M.-K. 2015, MNRAS, 450, 1503, doi: 10.1093/mnras/stv712
- Li et al. (2001) Li, H., Colgate, S. A., Wendroff, B., & Liska, R. 2001, ApJ, 551, 874, doi: 10.1086/320241
- Li et al. (2000) Li, H., Finn, J. M., Lovelace, R. V. E., & Colgate, S. A. 2000, ApJ, 533, 1023, doi: 10.1086/308693
- Lin & Papaloizou (1986) Lin, D. N. C., & Papaloizou, J. 1986, ApJ, 309, 846, doi: 10.1086/164653
- Lin (2012) Lin, M.-K. 2012, ApJ, 754, 21, doi: 10.1088/0004-637X/754/1/21
- Lissauer et al. (2011a) Lissauer, J. J., Ragozzine, D., Fabrycky, D. C., et al. 2011a, ApJS, 197, 8, doi: 10.1088/0067-0049/197/1/8
- Lissauer et al. (2011b) Lissauer, J. J., Fabrycky, D. C., Ford, E. B., et al. 2011b, Nature, 470, 53, doi: 10.1038/nature09760
- Lissauer et al. (2014) Lissauer, J. J., Marcy, G. W., Bryson, S. T., et al. 2014, ApJ, 784, 44, doi: 10.1088/0004-637X/784/1/44
- Lodato et al. (2019) Lodato, G., Dipierro, G., Ragusa, E., et al. 2019, MNRAS, 486, 453, doi: 10.1093/mnras/stz913
- Long et al. (2018) Long, F., Pinilla, P., Herczeg, G. J., et al. 2018, ApJ, 869, 17, doi: 10.3847/1538-4357/aae8e1
- Lovelace et al. (1999) Lovelace, R. V. E., Li, H., Colgate, S. A., & Nelson, A. F. 1999, ApJ, 513, 805, doi: 10.1086/306900
- Malhotra (1993) Malhotra, R. 1993, Nature, 365, 819, doi: 10.1038/365819a0
- Masset (2000) Masset, F. 2000, A&AS, 141, 165, doi: 10.1051/aas:2000116
- Mayor et al. (2011) Mayor, M., Marmier, M., Lovis, C., et al. 2011, arXiv e-prints, arXiv:1109.2497. https://arxiv.org/abs/1109.2497
- Miranda & Rafikov (2020) Miranda, R., & Rafikov, R. R. 2020, ApJ, 904, 121, doi: 10.3847/1538-4357/abbee7
- Montesinos et al. (2020) Montesinos, M., Garrido-Deutelmoser, J., Olofsson, J., et al. 2020, A&A, 642, A224, doi: 10.1051/0004-6361/202038758
- Müller et al. (2018) Müller, A., Keppler, M., Henning, T., et al. 2018, A&A, 617, L2, doi: 10.1051/0004-6361/201833584
- Öberg et al. (2021) Öberg, K. I., Guzmán, V. V., Walsh, C., et al. 2021, ApJS, 257, 1, doi: 10.3847/1538-4365/ac1432
- Okuzumi et al. (2016) Okuzumi, S., Momose, M., Sirono, S.-i., Kobayashi, H., & Tanaka, H. 2016, ApJ, 821, 82, doi: 10.3847/0004-637X/821/2/82
- Ono et al. (2016) Ono, T., Muto, T., Takeuchi, T., & Nomura, H. 2016, ApJ, 823, 84, doi: 10.3847/0004-637X/823/2/84
- Pérez et al. (2020) Pérez, S., Casassus, S., Hales, A., et al. 2020, ApJ, 889, L24, doi: 10.3847/2041-8213/ab6b2b
- Petigura et al. (2013) Petigura, E. A., Howard, A. W., & Marcy, G. W. 2013, Proceedings of the National Academy of Science, 110, 19273, doi: 10.1073/pnas.1319909110
- Petrovich & Rafikov (2012) Petrovich, C., & Rafikov, R. R. 2012, ApJ, 758, 33, doi: 10.1088/0004-637X/758/1/33
- Pierens (2021) Pierens, A. 2021, MNRAS, 504, 4522, doi: 10.1093/mnras/stab183
- Pinilla et al. (2012) Pinilla, P., Benisty, M., & Birnstiel, T. 2012, A&A, 545, A81, doi: 10.1051/0004-6361/201219315
- Pu & Wu (2015) Pu, B., & Wu, Y. 2015, ApJ, 807, 44, doi: 10.1088/0004-637X/807/1/44
- Rafikov (2002) Rafikov, R. R. 2002, ApJ, 569, 997, doi: 10.1086/339399
- Rafikov & Petrovich (2012) Rafikov, R. R., & Petrovich, C. 2012, ApJ, 747, 24, doi: 10.1088/0004-637X/747/1/24
- Rodenkirch et al. (2021) Rodenkirch, P. J., Rometsch, T., Dullemond, C. P., Weber, P., & Kley, W. 2021, A&A, 647, A174, doi: 10.1051/0004-6361/202038484
- Rometsch et al. (2021) Rometsch, T., Ziampras, A., Kley, W., & Béthune, W. 2021, A&A, 656, A130, doi: 10.1051/0004-6361/202142105
- Rowe et al. (2014) Rowe, J. F., Bryson, S. T., Marcy, G. W., et al. 2014, ApJ, 784, 45, doi: 10.1088/0004-637X/784/1/45
- Shakura & Sunyaev (1973) Shakura, N. I., & Sunyaev, R. A. 1973, A&A, 500, 33
- Surville & Barge (2015) Surville, C., & Barge, P. 2015, A&A, 579, A100, doi: 10.1051/0004-6361/201424663
- Takahashi & Inutsuka (2016) Takahashi, S. Z., & Inutsuka, S.-i. 2016, AJ, 152, 184, doi: 10.3847/0004-6256/152/6/184
- Tsiganis et al. (2005) Tsiganis, K., Gomes, R., Morbidelli, A., & Levison, H. F. 2005, Nature, 435, 459, doi: 10.1038/nature03539
- Ueda et al. (2021) Ueda, T., Flock, M., & Birnstiel, T. 2021, ApJ, 914, L38, doi: 10.3847/2041-8213/ac0631
- van der Marel & Mulders (2021) van der Marel, N., & Mulders, G. D. 2021, AJ, 162, 28, doi: 10.3847/1538-3881/ac0255
- van der Walt et al. (2011) van der Walt, S., Colbert, S. C., & Varoquaux, G. 2011, Computing in Science and Engineering, 13, 22, doi: 10.1109/MCSE.2011.37
- Wagner et al. (2018) Wagner, K., Follete, K. B., Close, L. M., et al. 2018, ApJ, 863, L8, doi: 10.3847/2041-8213/aad695
- Yee et al. (2021) Yee, S. W., Tamayo, D., Hadden, S., & Winn, J. N. 2021, AJ, 162, 55, doi: 10.3847/1538-3881/ac00a9
- Zhang et al. (2015) Zhang, K., Blake, G. A., & Bergin, E. A. 2015, ApJ, 806, L7, doi: 10.1088/2041-8205/806/1/L7
- Zhang et al. (2021) Zhang, K., Booth, A. S., Law, C. J., et al. 2021, ApJS, 257, 5, doi: 10.3847/1538-4365/ac1580
- Zhang & Zhu (2020) Zhang, S., & Zhu, Z. 2020, MNRAS, 493, 2287, doi: 10.1093/mnras/staa404
- Zhang et al. (2018) Zhang, S., Zhu, Z., Huang, J., et al. 2018, ApJ, 869, L47, doi: 10.3847/2041-8213/aaf744
- Zhu et al. (2018) Zhu, W., Petrovich, C., Wu, Y., Dong, S., & Xie, J. 2018, ApJ, 860, 101, doi: 10.3847/1538-4357/aac6d5
- Zhu et al. (2011) Zhu, Z., Nelson, R. P., Hartmann, L., Espaillat, C., & Calvet, N. 2011, ApJ, 729, 47, doi: 10.1088/0004-637X/729/1/47