Energy transfer and vortex structures: Visualizing the incompressible turbulent energy cascade
Abstract
The transfer of kinetic energy from large to small scales is a hallmark of turbulent flows. Yet, a precise mechanistic description of this transfer, which is expected to occur via an energy cascade, is still missing. Several conceptually simple configurations with vortex tubes have been proposed as a testing ground to understand the energy cascade. Here, we focus on incompressible flows and compare the energy transfer occurring in a statistically steady homogeneous isotropic turbulent (HIT) flow with the generation of fine-scale motions in configurations involving vortex tubes. We start by filtering the velocity field in bands of wavenumbers distributed logarithmically, which allows us to study energy transfer in Fourier space and also visualize the energy cascade in real space. In the case of a statistically steady HIT flow at a moderate Reynolds number, our numerical results do not reveal any significant correlation between regions of intense energy transfers and vorticity or strain, filtered in corresponding wavenumber bands, nor any simple self-similar process. In comparison, in the transient turbulent flow obtained from the interaction between two antiparallel vortex tubes, we observe a qualitatively simpler organization of the intense structures, as well as of the energy transfer. The process leading to vortex reconnection via flattening of interacting vortex cores in two intense ribbons of vorticity, also appears as qualitatively different from the physics of HIT. Our results indicate that the specific properties of the transient flows affect the way energy is transferred, and may not be representative of HIT.
keywords:
Turbulent cascade, vortex dynamics, energy transfer1 Introduction
The cornerstone of our understanding of turbulence rests on the notion that for three-dimensional incompressible flows at a very high Reynolds number, energy is transferred from the large scale at which the flow is stirred down to very small scales where fluid motion is damped by viscosity (Taylor, 1935; de Karman & Howarth, 1938; Kolmogorov, 1941). Richardson (1922) famously described the cascade in terms of whirls that generates ever smaller whirls, down to a scale where viscosity prevents any further small-scale generation. This underlying self-similar picture has since become widely accepted, at least as a theoretical starting point (Frisch, 1995). A precise description of the mechanisms leading to the cascade, however, has remained elusive.
The importance of understanding how energy cascades down to the dissipative scale cannot be overstated. The question arises naturally in order to model the decay of turbulence (Batchelor & Townsend, 1947, 1948b, 1948a; Moffatt, 2002), and, by extension, the decay of turbulence generated by a grid in a wind tunnel (Ueberoi, 1963; van Atta & Chen, 1968; Warhaft & Lumley, 1978; Sreenivasan et al., 1980; Antonia et al., 2003; Sinhuber et al., 2015). Additionally, the development of subgrid-scale models in the context of large-eddy simulations (LES), one of the most used numerical techniques in fluid dynamics, amounts to providing a parameterization of the energy transfer from the resolved to the unresolved scales of a flow in a numerical simulation (Smagorinsky, 1963; Leonard, 1975; Bardina et al., 1980; Germano et al., 1991; Meneveau, 1994; Metais & Lesieur, 1996). Due to its significance, this problem has been extensively studied, even in the simplest case of homogeneous, isotropic turbulence, both experimentally (Liu et al., 1994; Tao et al., 2002; Katz & Sheng, 2010) and numerically (Menon et al., 1994; Kerr et al., 1996; Meneveau & Katz, 2000). One of the main research questions is quantifying the locality of the energy transfer in Fourier space (Kraichnan, 1966; Zhou, 1993; Mininni et al., 2005; Domaradzki et al., 2009; Aluie & Eyink, 2009; Eyink & Aluie, 2009). Detailed studies of the contribution of triads of wavenumbers in the energy transfer point to a subtle structure: some of the triads contribute to a nonlocal energy transfer (Domaradzki & Rogallo, 1990), with possible consequences to the structure and dynamics of the smallest eddies in the flow (Brasseur & Wei, 1994; Yeung et al., 1995). The locality of the energy transfer in Fourier space can also be directly studied by representing the flux of energy between wavenumber bands (Favier et al., 2014; Verma et al., 2018; Alexakis et al., 2005b), a method which we will use extensively here. We note that the analysis in terms of wavenumber bands can also be used for more complex flows, e.g. involving convection and rotation (Favier et al., 2014; Kunnen et al., 2016), and in the case of magnetohydrodynamic turbulence, this approach reveals subtle exchanges between kinetic and magnetic energy (Mininni et al., 2005; Alexakis et al., 2005b; Aluie & Eyink, 2010; Teaca et al., 2011).
Aside from these applications, the notion of energy transfer is also essential to describe how an ordered, laminar flow evolves in time to become turbulent, by generating motion at increasingly small scales. In this context, visualization tools, from experiments as well as from direct numerical simulations (DNS) of the Navier-Stokes equations, have proven to be an invaluable tool to identify the physical mechanisms governing the formation of small-scale flow structures. It was recently realized that the elementary configuration of two colliding vortex rings (Lim & Nickels, 1992; McKeown et al., 2018, 2020) leads, at sufficiently high Reynolds numbers, to the development of a disordered flow with a energy spectrum, consistent with Kolmogorov prediction for turbulence (Kolmogorov, 1941). Remarkably, this spectrum results from a cascade of instabilities (Tao, 2016; Brenner et al., 2016) during the interaction between the vortices, which is responsible for the formation of small-scale flow structures (McKeown et al., 2020). The instability that mediates the cascade, known as the elliptical instability (Kerswell, 2002; Leweke et al., 2016), is induced by the deformation of the core of each filament due to the strain generated by the opposing vortex (McKeown et al., 2020). In another related flow, i.e. the reconnection between two vortex filaments at sufficiently high Reynolds numbers, Yao & Hussain (2020) observed the development of small-scale fluid motion with a Kolmogorov spectrum and also suggested an “avalanche” of iterative reconnections as a possible mechanism for the cascade.
An understanding of the underlying energy transfer mechanisms in these conceptually simple flow configurations could possibly lead to insights on the cascading motion in turbulence (Ostilla-Mónico et al., 2021; Yao & Hussain, 2022). In fact, the complex motion in turbulent flows has been conjectured to involve elementary coherent structures (Hussain, 1986); vortex tubes are likely candidates to capture these important dynamical processes (Siggia, 1981; Jiménez et al., 1993; Goto, 2008; Buaria et al., 2020). This has provided an essential motivation for the study of the interactions of vortex tubes (Siggia & Pumir, 1985; Brenner et al., 2016; Moffatt & Kimura, 2019) and suggests the use of a common approach to study the transfer of energy in both fully turbulent flows as well as various configurations of interacting vortex tubes.
Comparing energy transfer between turbulent flows and these various configurations is one of the main objectives of this work. As already mentioned, one of the assumptions often used is that the transfer of energy occurs in a self-similar manner. This hypothesis is clearly made in the phenomenological approach of Tennekes & Lumley (1972), who derived from elementary fluid mechanical considerations an explicit scaling expression for the energy transferred between scales. Consistent with the findings of McKeown et al. (2018, 2020), the work of Yoneda et al. (2021) also postulates a hierarchical structure of vortices to describe vortex stretching, inspired by the numerical results of Goto et al. (2017) and Motoori & Goto (2019).
To investigate these issues, we proceed by decomposing the velocity field into logarithmically spaced shells of wavenumbers, , such that , where is a fixed wavenumber corresponding to the largest scale flow structure. The use of logarithmic bands of wavenumbers, rather than linear ones (as in Zhou (1993); Alexakis et al. (2005b) for example) was chosen as it is particularly appropriate to study a self-similar problem, as turbulence has often been postulated to be. We introduce the corresponding band-passed filtered velocity fields , from which we can define associated quantities such as the vorticity, rate of strain, and kinetic energy. In particular, we will focus on the rate of energy transferred from the band of modes to the band as (c.f. below and Mininni et al. (2006) for the full derivation of this quantity). This equation allows us to identify the regions of the flow where is positive, indicating that energy is transferred from the band to . We can then use this to correlate the regions in real space where the flow transfers energy with the presence of regions of high vorticity or high strain in the flow and elucidate the mechanisms for energy transfer across scales. In the elementary case of homogeneous isotropic turbulent (HIT) flows, this method allows us to rule out any significant correlation between energy transfer and regions of intense vorticity or strain in HIT, a situation that was not substantially changed by imposing the large-scale structure of the flow suggested by Goto et al. (2017). In contrast, we find much stronger correlations between transfer and vorticity and strain in the case of turbulent generated by the interaction of two antiparallel vortices.
Our work is organized as follows. In the Methods section (Sec. 2), we present our approach to studying energy transfer and describe our numerical methods. The case of a statistically stationary homogeneous turbulent flow at moderately large Reynolds number () is considered in Section 3. In particular, we recover the locality properties of the energy transfer in Fourier space (Kraichnan, 1966; Tennekes & Lumley, 1972; Zhou, 1993; Aluie & Eyink, 2009). In Section 4, we consider the case of statistically unsteady flows, starting from the simple configuration of two initially antiparallel vortex tubes. We analyze the generation of small-scales in the flow in Fourier space and show that intense energy transfer correlates with the locations of filaments with intense vorticity. This correlation persists, up to the point where the flow develops a turbulent regime, with a spectrum. We demonstrate, however, that this simple correlation between the observed vortical structures and energy transfer scales does not hold when imposing a large-scale flow structure, consisting of four alternating vortex tubes in Section 5. Finally, we contextualize our results with a recent analysis of vortex stretching, and we present our conclusions in Section 6.
2 Methods
2.1 Analysis of energy transfer
To study the transfer of energy from one band of modes to another, we consider shells of wavenumbers, , defined by:
| (1) |
where is a fixed wavenumber, chosen here to be . In elementary terms, the sets correspond to spherical shells in wavenumber space, around the wavenumber , and of width . With the value of chosen here, the number of Fourier modes in the lowest shell, , is , which minimizes the effect of discretization.
Furthermore, we define the band-passed filter of the velocity field, , as:
| (2) |
In the same spirit, we define the filtered vorticity field as the curl of , the filtered strain rate tensor as the symmetric part of the derivative tensor of , the filtered kinetic energy as , the filtered the strain rate magnitude as , and the filtered dissipation rate, , as .
To study the rate of energy transfer between scales, we follow Alexakis et al. (2005a); Mininni et al. (2006), and consider the rate of energy transfer :
| (3) |
This third-order correlator represents the energy transferred from shell to shell due to the interaction with the velocity field in shell . This operator can be derived from the Navier-Stokes equation, and we note that it does not give information on the amount of energy shells and transfer to , just on what transfers from to (Alexakis et al., 2005a; Mininni et al., 2006). Here, we do not restrict ourselves to the integral over the entire volume in Eq. 3, but we also consider the integrand . In fact, the integral in Eq. 3 averages out potentially useful information contained in . We also note that both and generally depend on time. In the special case of statistically steady flows, upon which most earlier studies have focused, a time average is also performed in the definition of . Here, we will examine both time-dependent and statistically stationary problems, in which case we will consider the temporally averaged value for .
Summing over the middle shells, , one obtains the energy transfer from shell to shell through the whole velocity field:
| (4) |
This operator can be integrated over space to obtain , i.e. the energy transfer rate from shell to shell in the entire volume.
Finally, one can sum the operator or over the shells to obtain the rate of energy received by the shell from the whole velocity field, i.e. all shells:
| (5) |
Again, by integrating over the volume, one obtains . This parameter can then be used calculate the energy flux in the cascade as:
| (6) |
which expresses the energy flux through the shell (Mininni et al., 2006).
In this manuscript, we will focus on the behaviour of , which we denote for simplicity as . Similarly, we denote the averaged quantity, by . In an analogous manner, we express as , and so on. Furthermore, because in a turbulent flow, energy is ultimately transferred down to very large wavenumbers (very small scales) where it is dissipated by viscosity at a rate , we systematically normalize the and operators by dividing by the dissipation rate in the flow.
In general, positive values of imply that energy is transferred from shell to , while negative values mean energy is transferred from to . All of the previously defined quantities have been determined numerically in our DNS and are presented in the analysis below. We stress that one of the main novel aspects of our work consists of examining not only the integral quantities , but also visualizing the field in physical space. This quantity allows us to monitor where the energy transfer occurs in real space, even if the interpretation is not totally straightforward. Since the role of the mediating velocity component in the shell is averaged out, this could result in an oversimplification of the energy transfer process. Furthermore, the correlators and derived quantities are not Galillean invariant (Aluie & Eyink, 2009). However, in the examples considered here, the mean velocity is very small, or even exactly zero in the spectral simulations, which alleviates the issues mentioned in Aluie & Eyink (2009), and allows us to interpret these as good approximations for the physics of the energy transfer.
Finally, even if it is known that the and operators are antisymmetric, i.e. and , because energy is conserved by the triadic interactions, does not share this property as it is defined only up to a divergence. An elementary calculation leads us to the equality: . The divergence term integrates to , which guarantees that the global balance , even if locally are not equal to zero.
2.2 Details of the DNS
The DNS for the two antiparallel vortex tubes were carried out using the energy conserving finite-difference code described in Appendix C of McKeown et al. (2018). In essence, this is a centered, energy-conserving, second-order finite difference code which has a fractional time-stepping mechanism. The nonlinear terms are treated explicitly using a third-order Runge-Kutta scheme, while the viscous term is treated implicitly using a second-order Crank-Nicholson method. The simulations shown here were obtained in a cubic periodic domain of side length , with up to grid points for the circulation Reynolds number , where is the circulation of the vortices and the kinematic viscosity of the fluid. The other parameter that defines the system is the ratio , where is the radius of the vortex cores, and is the initial distance between the vortices. For this configuration, , and .
Aside from the unforced anti-parallel tubes, which are left to freely evolve from initial conditions, we also simulate statistically stationary turbulence with two types of forcing: a random isotropic forcing (Eswaran & Pope, 1988), with the forcing parameters chosen following Chouippe & Uhlmann (2015), and we also used a forcing inspired by Goto et al. (2017) of the form:
| (7) |
This is a single-mode forcing which generates four counter-rotating vortex tubes, parallel to the axis and centered in the plane at with , = or .
We also implement a spectral code to perform DNS of the Navier-Stokes equations, both to simulate homogeneous isotropic turbulence (HIT) and to investigate the configuration of two perpendicular vortex tubes (Ostilla-Mónico et al., 2021). The code solves the Navier-Stokes equations in a triply periodic box , as described in Pumir (1994). The DNS study of HIT was carried out using Fourier modes, at a Reynolds number . The quality of the spatial resolution can be judged by the product , where is the largest Fourier mode included in the simulation, and , the Kolmogorov length. The value of shows that the small scales are satisfactorily resolved. We compare the results of the two codes to study HIT, and verified that the results presented in Section 3 are robust.
To simulate the interaction of two intially perpendicular vortex tubes, we insert two vortex tubes in the cubic domain, whose centerlines are given by , and , , both with a circulation , as detailed in Ostilla-Mónico et al. (2021). The signs of the circulations are selected so that the two vortices close to and move in the direction . Numerically, we set and . We do not force the flow and let the tubes freely evolve. We run the simulation at several resolutions, from up to grid points, to ensure spatial accuracy. The core size of the vortices was chosen to be slightly smaller than . In this manuscript, we focus on the run at .
For each flow configuration, the resulting flow parameters (i.e. the vorticity modulus, the strain modulus or energy transfer rate) are examined in the 3D visualization program Dragonfly (Object Research Systems).
3 Characteristics of the energy transfer in homogeneous isotropic turbulence
In this section, we consider the energy transfer rate in the case of statistically stationary flows. We first re-analyze the transfer of energy for hydrodynamic turbulence at a moderate Taylor Reynolds number (), and show that it is consistent with turbulent flows at comparable in the literature (Mininni et al., 2005; Domaradzki & Carati, 2007; Eyink & Aluie, 2009). This allows us to provide relevant points of benchmarking and comparison for the study of time-dependent flows investigated in the following sections.
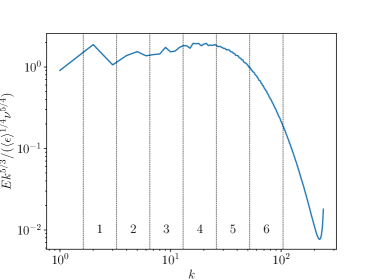
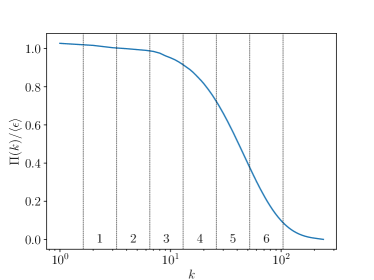
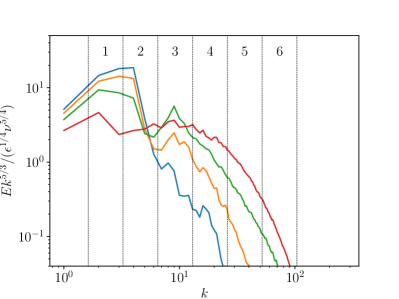
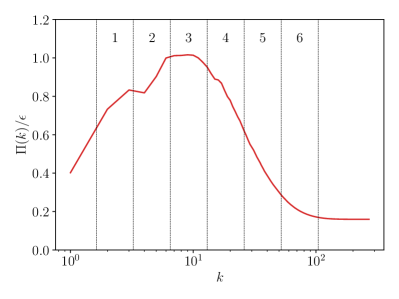
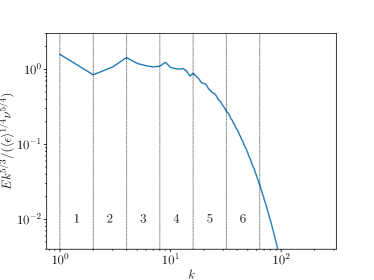
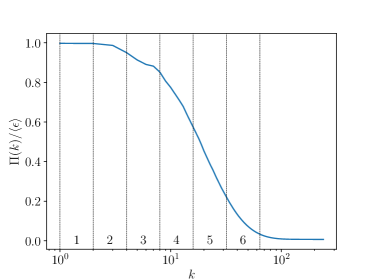
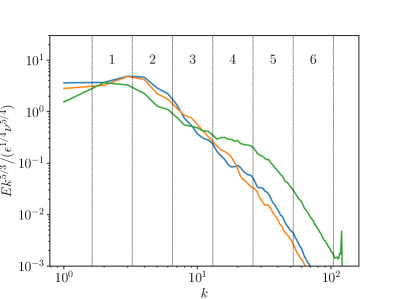
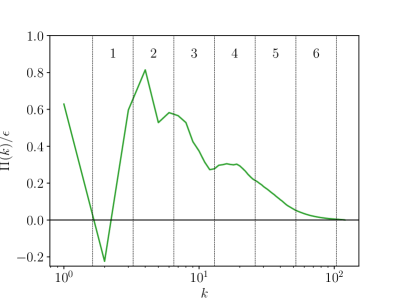
To characterize the flow, we show the energy spectrum and energy flux in Fig. 1(a-b). We also indicate where the spectral shell bands start and end. With the value of chosen to define the bands of wavenumbers for this flow, the range of inertial scales extends in wavenumber space from approximately the shell , up to the shell , which corresponds to the range . The first shell is still largely affected by the forcing, and the two shells corresponding to the highest wavenumbers, i.e. the shells and , lose the scaling and thereby correspond to the dissipative scales. To confirm this, we verified that the spatially-averaged dissipation rate is less than the transfer to small scales for . This is reflected in , normalized by , the time-averaged energy dissipation rate, being larger than 0.75 in the first four shells.
To further corroborate this, we show in Fig. 1(c-f) the vorticity magnitude in the shells , and , as well as the unfiltered vorticity. We observe that despite the statistical homogeneity of the flow, at smaller scales, the vorticity loses homogeneity and becomes localized in any moment of time at preferential areas. In fact, the regions of low vorticity, correspond to regions of low kinetic energy in the fluid. Furthermore, in the small scales, the extremes of the distribution become more pronounced. This is reflected in a paling of the vorticity in the visualizations, from the brownish vortices of in Fig.1(c) to the light vortices of in Fig.1(f).
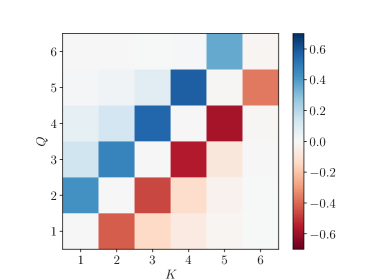
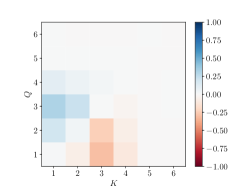
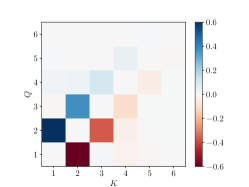
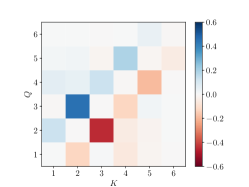
Having characterized the base flow, Fig. 2(a) shows . This quantity , defined by integrating Eq. (4), is calculated for the flow using different snapshots, uniformly distributed over a total duration of approximately one large eddy turnover time. We note that due to the statistically stationary nature of the flow and the integration of the energy transfer rate over all space, the values of for each single snapshot do not vary considerably over this time from the averaged values over the snapshots, which we show here. We find that when , the rate of energy transfer is positive from bands of wavenumbers to bands of wavenumbers . This corresponds to a transfer of energy toward small scales, a characteristic property of turbulent flows in three spatial dimensions. Interestingly, Fig. 2(a) shows that the transfer of energy is mostly concentrated around the diagonals, with a sharp decay away from the principal diagonal. The dominance of the terms close to the diagonal, i.e. from with , is qualitatively consistent with the notion that energy transfer is mainly local in wavenumber space, as documented many times in turbulent flows with a comparable range of inertial scales (Domaradzki & Rogallo, 1990; Zhou, 1993; Alexakis et al., 2005a; Domaradzki & Carati, 2007; Mininni et al., 2005; Verma et al., 2018). The transfer, however, also extends to larger modes: and . The rate of energy transferred from a band of wavenumbers to a more remote band in Fourier space is a statistic that is affected by the precise real-space mechanism in which the energy is transported across scales (Zhou, 1993; Alexakis et al., 2005a; Domaradzki et al., 2009). Several theoretical investigations of the decay of as a function of have led to the prediction of an exponential decay (Kraichnan, 1966; Tennekes & Lumley, 1972; Aluie & Eyink, 2009), corresponding to a power law decay in wavenumber space () since the center of the bands varies exponentially, , see Eq. (1).
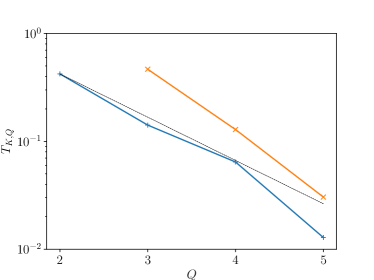
We reproduce these scalings below to further showcase the locality of the energy transfer. Fig. 2(b) shows the integrated energy transfer rate from (“+” symbols), or (“” symbols) to . Fig. 2(b) is consistent with an exponential decay of () when increases. This relationship corresponds to a power law relating wavenumber and , since the center of the bands also varies as . We also note that the decays seem to differ slightly between and . We interpret this as an effect of the limited inertial range in the simulation. In Fig. 2(b), we have also added straight line with a scaling, which corresponds to a power law with an exponent (again, since , the center of the band ). This scaling agrees well with and when . This power-law dependence, derived by Kraichnan (1966), see also Aluie & Eyink (2009), has been found in other numerical simulations at similar or larger (Domaradzki et al., 2009; Eyink & Aluie, 2009). The phenomenological approach by Tennekes & Lumley (1972) reaches the same conclusion by analyzing the energy transfer rate between scales and in terms of the deformation induced on a given vortex structure by the rate of strain at scale , and on the isotropy-restoring effect of strain at scale . Such an approach would suggest a correlation between and strain at scales and . Accordingly, we will use the exponential decay of as a function of to test for the adequacy of the time-dependent flows analyzed below in modeling the turbulent cascade.
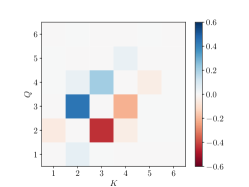
A final point for comparison between HIT and the flows analyzed later is provided by the behaviour of the triple correlator , shown for and in Fig. 2(c-d), respectively. For the mode, the triple correlator shows a similar behaviour to , predominantly concentrating transfer along the diagonal with . The rate of transfer to other modes, such as and is greatly reduced due to the character of the triadic interactions. We also observe a rapid decay in the influence of the mode for large values of . For the triple correlator, shown in Fig. 2(d), there is negligible transport of energy through the velocity shell if , again due to the triadic nature of the interactions. Conversely, we observe an extended transport band for values of and (and vice versa), indicating that this mode is responsible for the transfer of the off-diagonal energy modes. Once again, the dominant mode of transfer is .
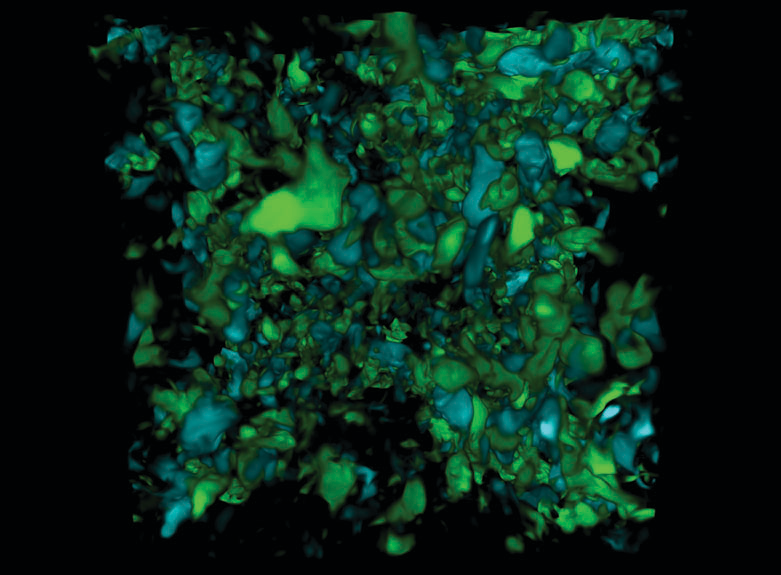
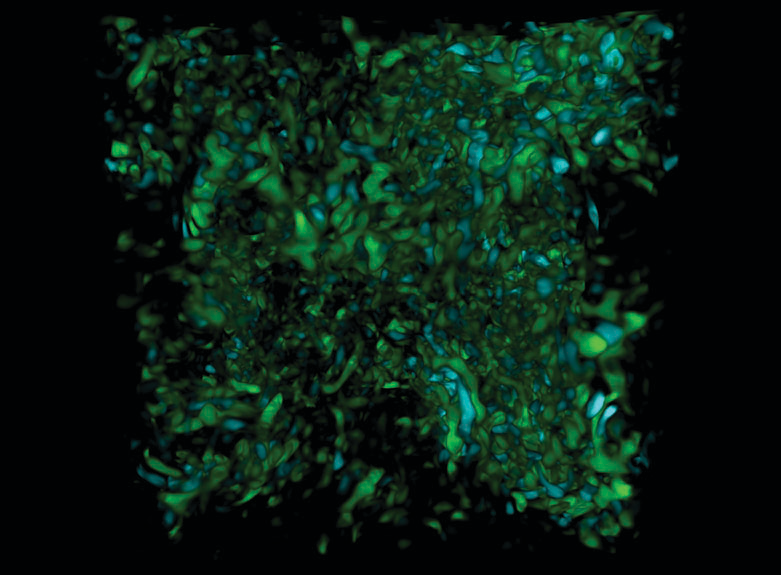
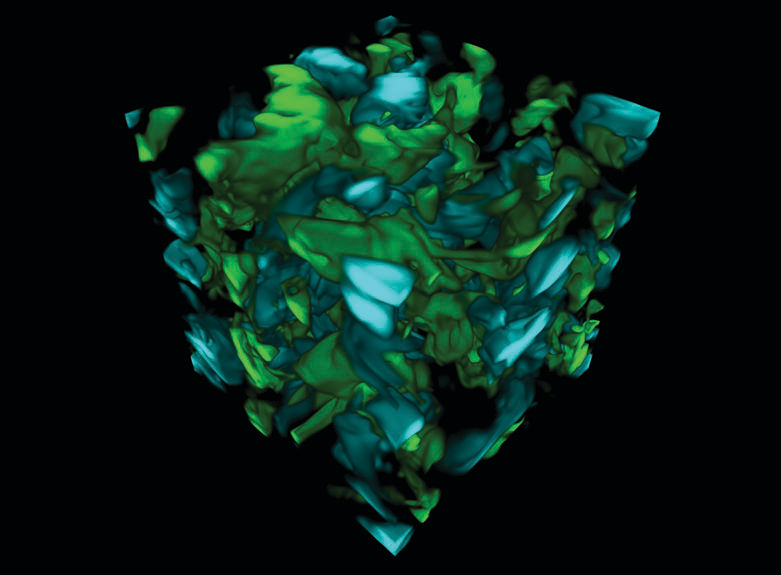
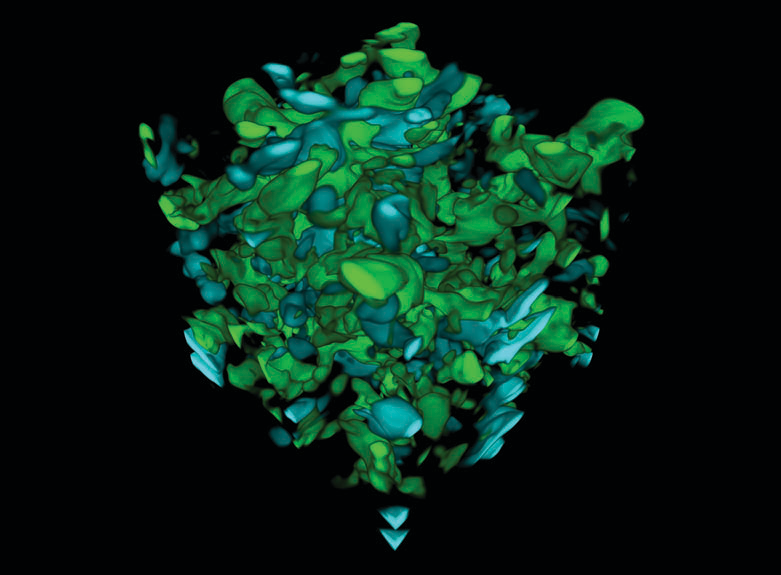
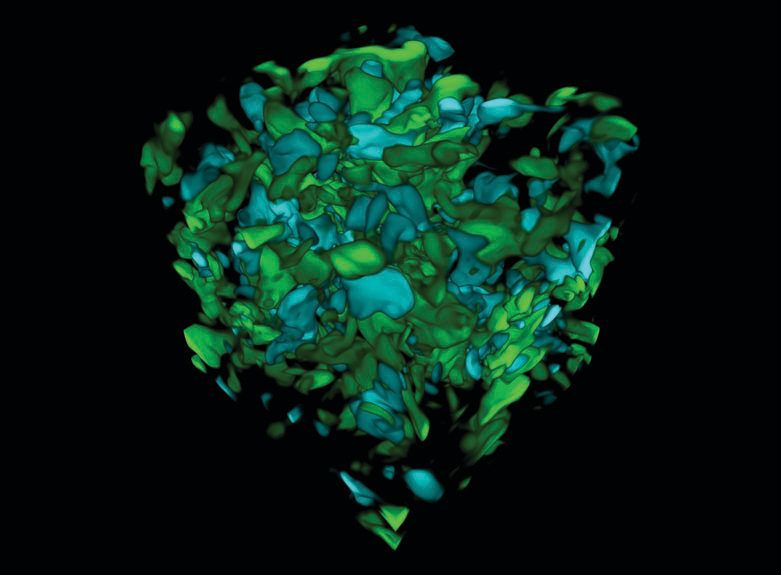
As previously stated, an aim of this paper is to visualize the transfer of energy across scales directly by showing in real space. To this end, Fig. 3 shows six snapshots of in HIT for different values of and , with the convention that blue regions correspond to a positive energy transfer towards small scales (), and green to a negative energy transfer. These are localized in the same regions of intense vortical activity visualized in Fig. 1, especially as the scales become smaller. However, the overall picture of the cascade is hard to observe from these snapshots, especially for finer scales. By calculating the Pearson correlation coefficients, we can make some more quantitative observations. The Pearson correlation coefficient between and , , and leads us to values which are consistently negative, but with a magnitude of , i.e. very close to zero. If the correlations are made with respect to the absolute value of instead, the correlation coefficients increase to the range of , though slightly higher for strain than for vorticity. This indicates that energy transfers occurs predominantly in regions of high vorticity, although the transfer can go in both directions. This is manifested by the absence of correlation with between the signed quantity and vorticity. Additionally, visualizing the regions of intense vorticity and strain, filtered around a shell , does not reveal any qualitatively strong correlation between the two fields. This impression is also confirmed by the weak values of the Pearson correlation coefficients we found, at most of order .

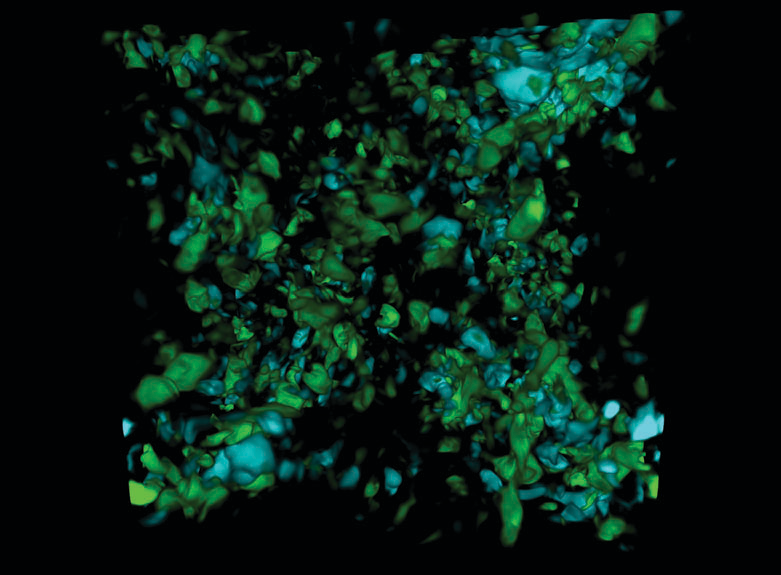
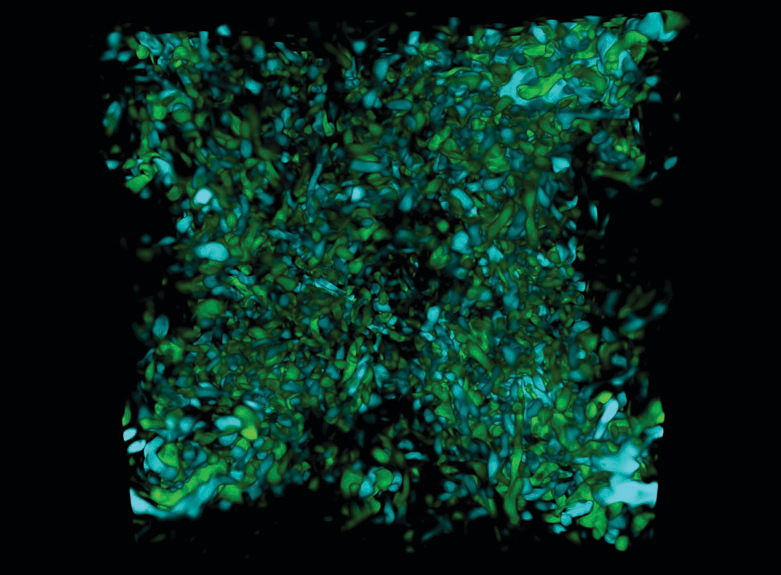
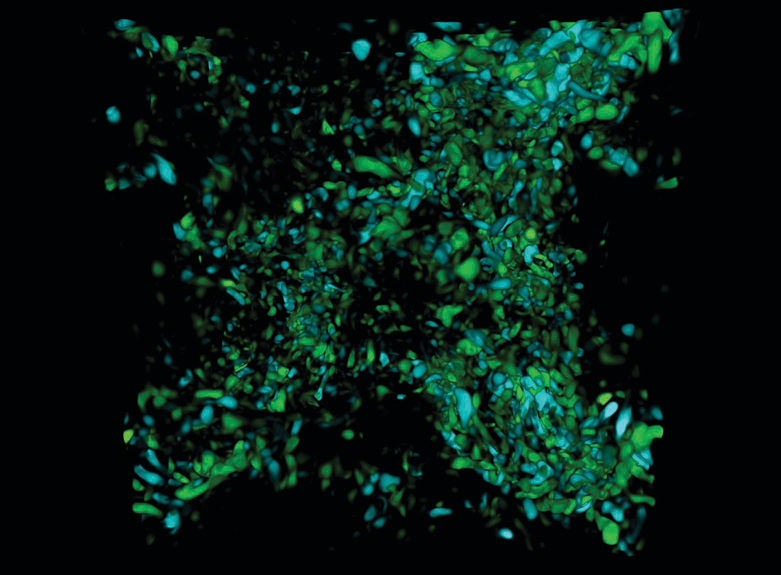
These statistics and visualizations confirm what is already known, i.e. that the turbulent cascade is a process involving the interaction of multiple scales. In particular, the lack of correlation between and , , or the vorticity components and , indicates that the enticing energy cascade proposed by Tennekes & Lumley (1972), resting on a description of the action of strain and vorticity at neighbouring scales, is oversimplified; it does, however, provide the correct prediction for the qualitative scaling of the integrated rate of energy transfer, . In the following sections, we consider simpler flows, in order to obtain a clearer visualization of the energy transport mechanisms in real space. The analysis presented above will be used to set comparison benchmarks for the statistical metrics of these simpler flows, which will indicate how representative these flows are of the general turbulent cascade observed in HIT.
4 Time-dependent flows: energy transfer in interacting vortex tubes.
In our previous work, we demonstrated that the interaction between antiparallel vortex tubes leads to an energy cascade composed of discrete and iterative events which were isolated and visualized (McKeown et al., 2020). These dynamics result in the formation of a transient energy spectrum, as shown in Fig. 4(a). We also show the instantaneous energy flux in Fig. 4(b) during the turbulent breakdown, divided by the dissipation rate at the corresponding time, . We now visualize the transfer of energy during the flow evolution, from smooth antiparallel tubes to a turbulent cloud and compare with the results obtained for HIT to assess how well this breakdown reproduces the canonical turbulent cascade.
The Reynolds number is defined here as the dimensionless ratio between the circulation of the tubes at , , and the kinematic viscosity: . As shown by McKeown et al. (2020), at high Reynolds numbers, , initially anti-parallel vortex tubes are subjected to an elliptical instability, leading to the formation of anti-parallel tubes, perpendicular to the original vortices. The pattern reproduces itself in a cascade-like manner, eventually giving rise to turbulence. In the following, we distinguish the two phases of the evolution and characterize the corresponding transfers of energy between bands of wavenumbers. We analyze the run at from McKeown et al. (2020). The time, , is non-dimensionalized using , where is the initial tube separation, as done in McKeown et al. (2020).
4.1 Early stage: development of the instability
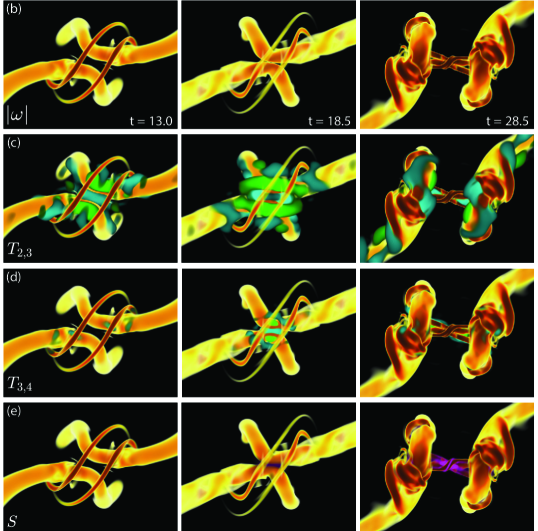
Fig. 5 illustrates the evolution of the two tubes during the phase where the dissipation rate strongly increases, before a turbulent, energy spectrum develops. Fig. 5(a) shows the integrated energy transfer rate, in Fourier space, whereas Fig. 5(b) shows the development of the instabilities through volumetric visualizations of the vorticity modulus, . At the earliest time shown (), the instability begins to develop, as indicated by the perturbations in the vortex cores, and little energy transfer occurs across scales. At the intermediate time, , the most pronounced transfer is between the band and the band . This corresponds to a wavelength equal to roughly the size of the computational box, which corresponds to the perturbation wavelength from the instability. At a later time , the energy transfer also encompasses other pairs of modes at higher wavenumbers, which all correspond to energy transfer toward smaller scales. These transpire in adjacent shells, i.e. with , similar to what was observed in the previous section for the case of homogeneous isotropic turbulence.
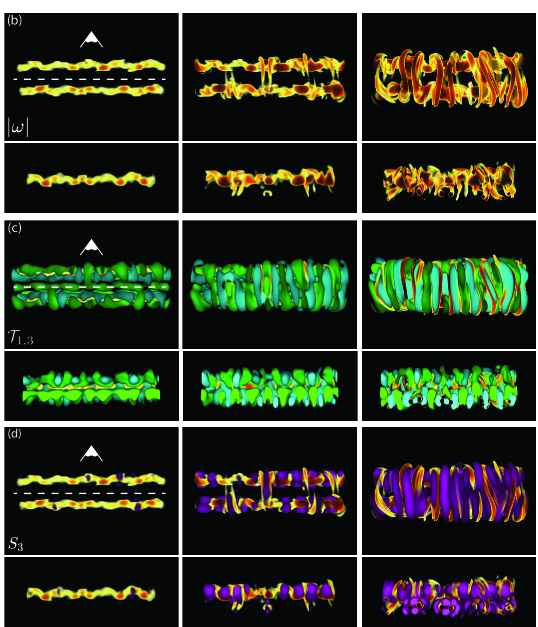
As the most intense energy transfer over the time interval illustrated in Fig. 5(a) occurs between and , panel (c) shows a visualization of , with regions of intense positive (negative) energy transfer from to in blue (green). As the flow develops, an alternating pattern of regions of positive and negative energy transfer emerges perpendicular to the interacting tubes. The transfer of energy is predominantly negative (green) between pairs of interacting vortex tubes. Since the quantities in Fig. 5(a) are scaled by the instantaneous energy dissipation, which remains relatively weak up to , this implies that the exchange of energy is not particularly large at this instant. Physically, the growth of energy in the band of wavenumbers mostly arises from this initial instability. At later stages (), however, a positive energy transfer between the tubes (blue regions in Fig. 5(c) overwhelms the negative energy transfer (green). This observation indicates a qualitative change in the interaction between the two tubes, from a regime governed by the growth of an instability, to a regime with strong nonlinear interactions and energy transfer.
It is interesting to note that the rate of strain filtered in the band, and visualized in magenta in Fig. 5(d), closely follows the local amplification of positive and negative energy transfer seen in Fig. 5(c). In fact, at the early times shown ( and ), the development of intense strain regions precedes the formation of intense tubes, clearly visible at .
The qualitatively strong correlations between the structures of intense regions of and , clearly visible in Fig. 5, are confirmed by evaluating the Pearson correlation coefficients between and . We find a value of the correlation coefficient of order 0.7-0.8, much stronger than what was found for HIT (). The regions of intense transfer, also exhibit a stronger degree of correlation with strain or vorticity, filtered in the wavenumber band or , with a Pearson coefficient of . Furthermore, at and , we find a correlation coefficient of between and , as well as between and the variables , and , unlike the practically zero correlation coefficients found in HIT. This indicates that transfer across this pair of shells is comparatively more associated with a forward transfer of energy which happens in regions of high vorticity/strain than what is present in a HIT flow. A consequence of this observation is that energy transfer can be examined locally, at these times, through the interactions of discrete flow structures. However, the flow is not yet comparable to homogeneous isotropic turbulence, as the energy spectrum differs from the classical -regime, and the structure of the spectrum also substantially differs from what is observed in HIT flows, as examined in Sec. 3.
4.2 Later stage: the turbulent regime

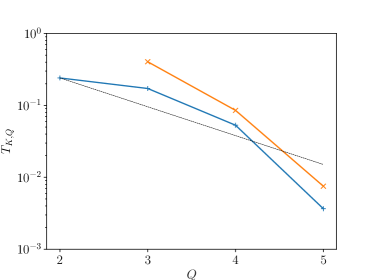
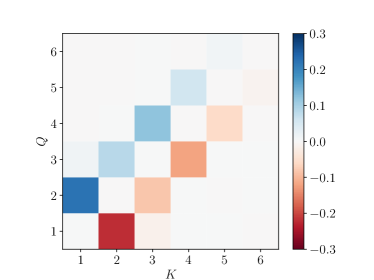
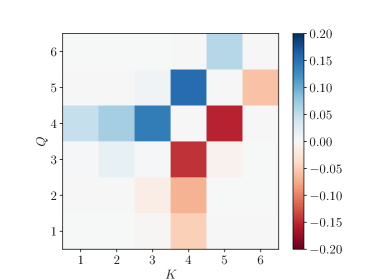
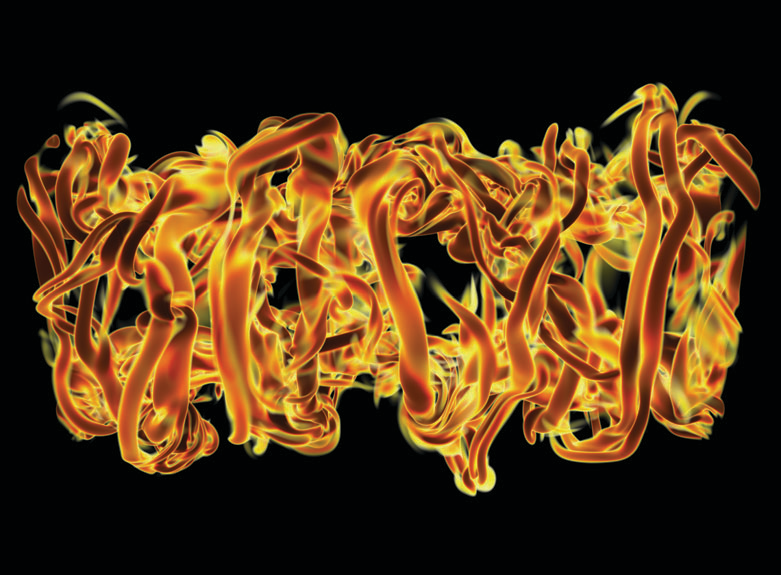
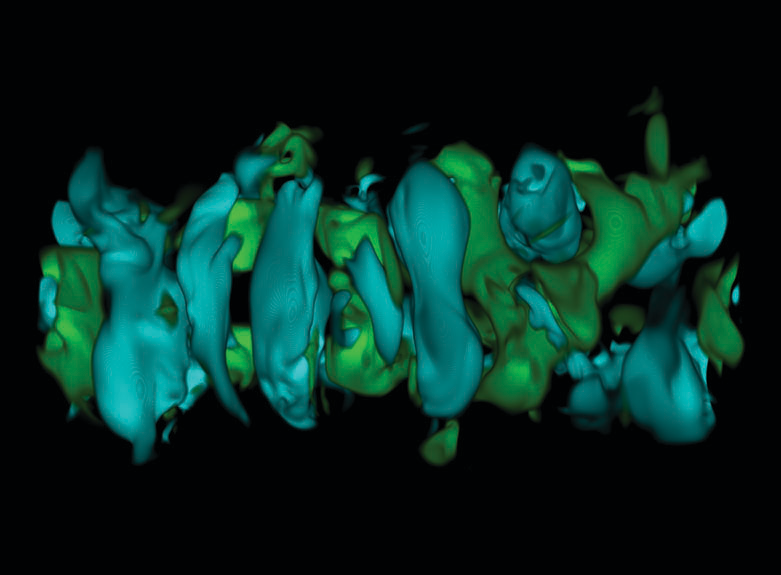
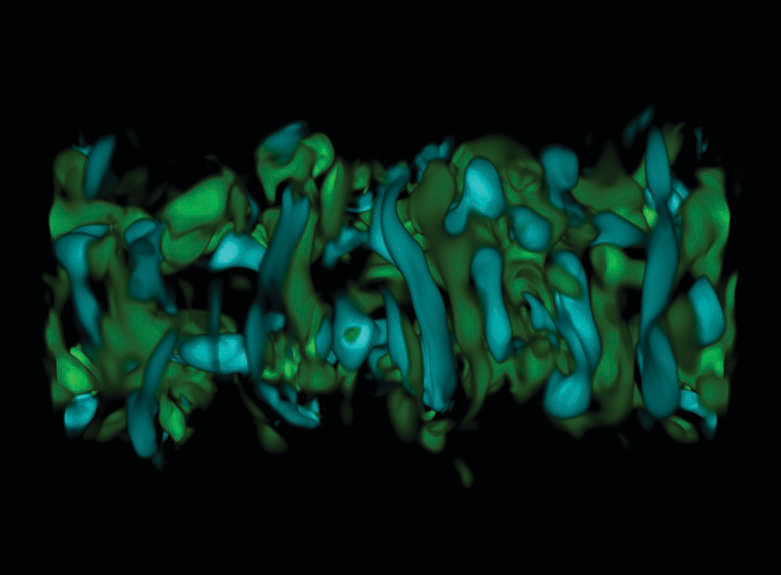
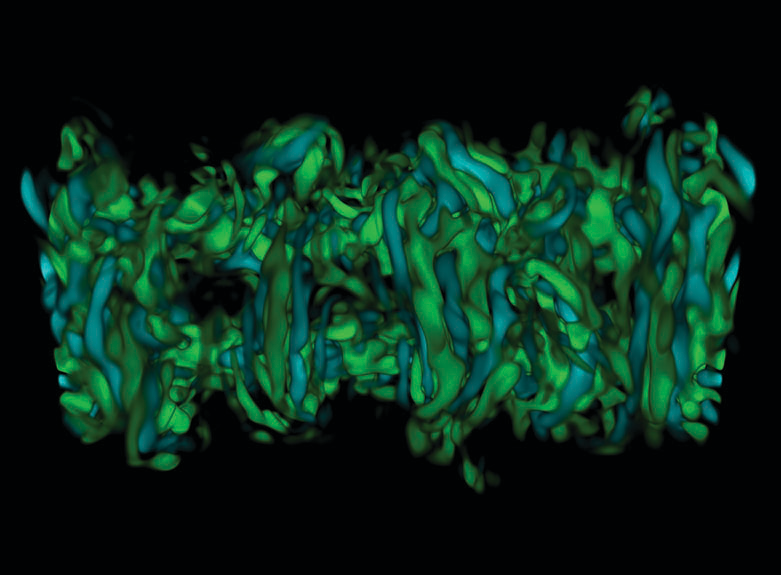
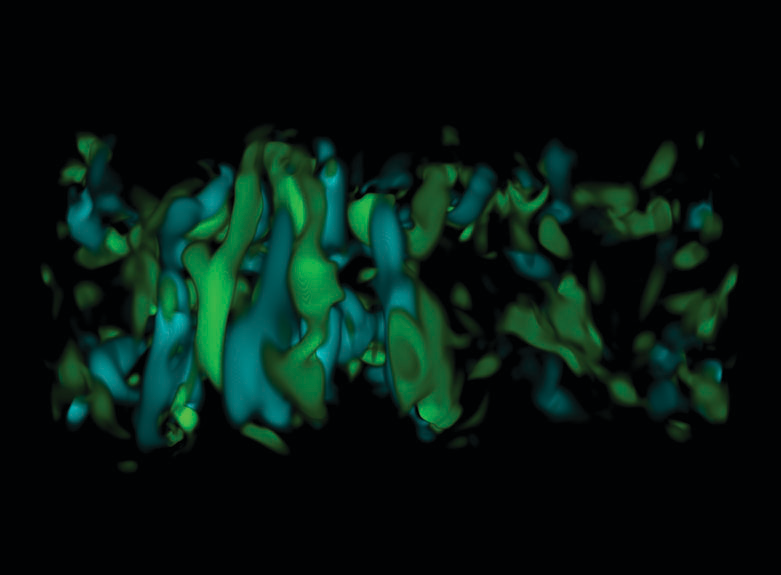
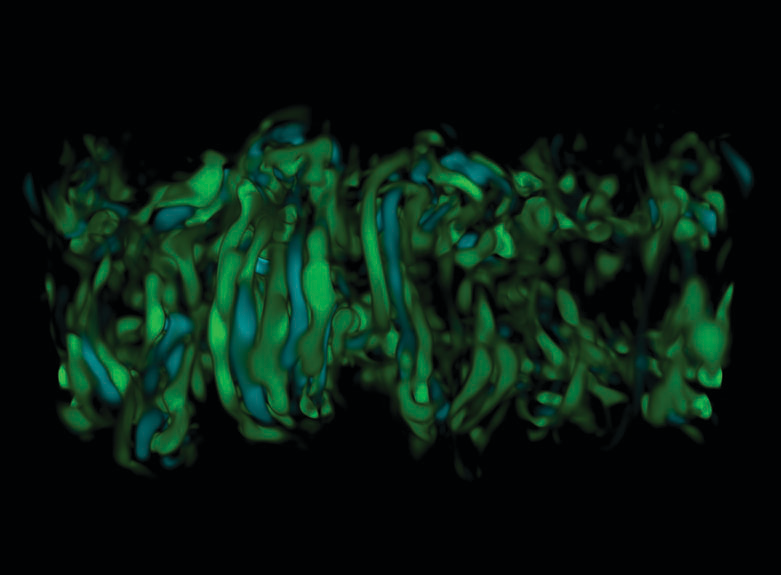
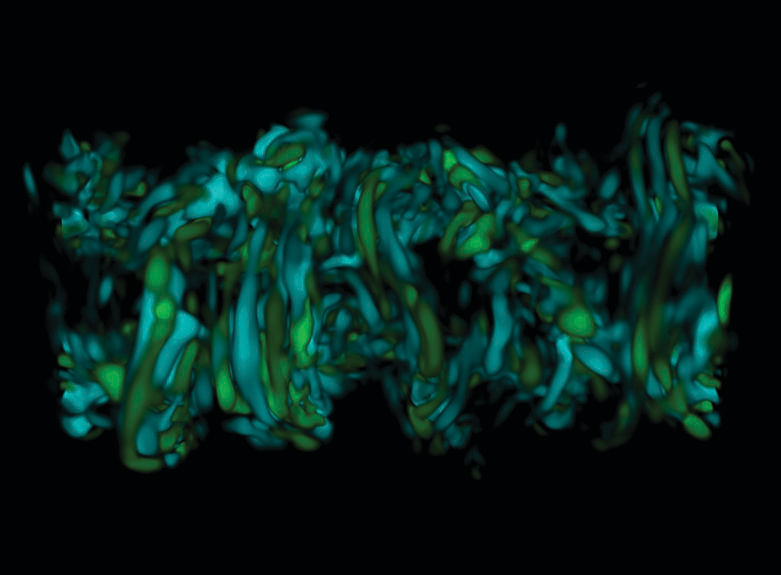
Figure 4(a) shows how the flow develops the classical spectrum, which coincides with the peak in the instantaneous dissipation rate (McKeown et al., 2020). It is therefore of fundamental interest to study energy transfer in this regime, where we observe a turbulent spectrum in a flow which may be viewed as conceptually simpler than the HIT flow studied in Section 3. For future comparison with the HIT configuration, we note that the Taylor Reynolds number of the flow studied in McKeown et al. (2020); Ostilla-Mónico et al. (2021) is estimated to be of the order of , which indicates that the inertial range encompasses a more restricted range of spatial scales compared to our HIT run at . This means that the shell will be affected significantly by dissipation, and cannot be considered to belong to the integral range. The transfers of energy from to smaller scales will accordingly be weaker than those seen in HIT.
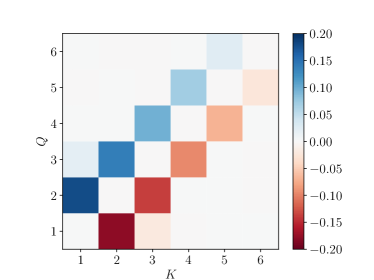
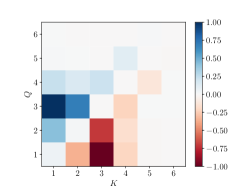
Fig. 6 shows the energy transfer statistics for the flow at time , which corresponds to the peak in the energy dissipation rate. Fig. 6(a) shows the normalized integrated 2D energy transfer spectrum, , at this time, which reveals an ongoing transfer of energy towards small scales, mostly concentrated along the diagonal. The large energy transfer in , clearly visible at earlier times, shown in Fig. 5(a), remains present, albeit in a much weaker form, as it is now smaller than . This is highlighted in Fig. 6(b), where the scaling of the term is shown. Our analysis of the third-order correlator, (see Eq. 3) for HIT, shown in Fig. 6(c-d) reveals similar features. The pattern is qualitatively similar to that of HIT, shown in Fig. 2(c-d), but the shell is not as active as in homogeneous isotropic turbulence, due to the memory of the initial conditions of the vortex tubes.
The transient turbulent flow which results from the iterative cascade of instabilities documented in McKeown et al. (2020), exhibits a complicated structure, clearly visible from the structure of the vorticity modulus, shown in Fig. 7(a). Furthermore, Fig. 7(b-g) shows all the energy transfer interactions between the first four shells. Remarkably, at all scales represented, the intense contributions to the energy transfer are observed in the vicinity of the interacting vortex pairs which were formed as a result of the elliptical instability. This is suggestive of the important role played by these vortex pairs and by their iterative interactions in transferring energy across scales. Although it is clear that most intense regions of energy transfer, be it towards small scales or towards large scales (blue or green, respectively) occur very often between pairs of vortex tubes, it is not clear whether a given pair of vortex tubes will give rise to a transfer towards small or towards large scales; both cases can be observed, depending on the particular pair considered. This extends the observations in HIT, Section 3, that the energy transfer associated with intense structures, can be either up- or down-scale.
As it was the case at earlier times, see Section 4.1, we can confirm the visual intuition of correlations between the structures of intense regions of and by determining the Pearson correlation coefficients. First, we find a high correlation coefficient of between and for the shells , and , similar to what was reported at earlier times. This indicates that regions of high vorticity and high strain correspond to each other in this flow, unlike in HIT.
We also find a value of the correlation coefficient of between and and , as well as with and . In addition, we find a similar correlation coefficient between and all of , , and . By calculating the correlation coefficient for with the strains and vorticities mentioned above, we find that it is consistently of the order for the pairs , and , as was seen at earlier times. This correlation indicates a much closer overlap between regions of high strain and vorticity and those of intense energy transfer than what was observed for HIT (see Section 3). Furthermore, in this late stage, the presence of a negative correlation between the signed and vorticity and strain shows that there is weak preference for transport to smaller scales associated with intense vorticity or strain.
While the configuration of two originally antiparallel tubes leads to a flow exhibiting a transient energy spectrum, along with an integrated energy transfer spectrum reminiscent of HIT flows, it differs in the correlations between strain and vorticity. This flow can still be useful as a conceptually simple configuration for testing and visualizing hypotheses about the role of vortex interactions in the conveyance of energy to smaller scales. However, it should be emphasized that the interaction between two vortex tubes does not fully encompass the multi-scale interactions needed in an accurate model for the energy cascade. In Appendix A, we additionally consider the distinct case of two vortex tubes originally perpendicular to each other. The dynamics in this flow leads to the rapid production of small-scale of motion. For this reason, this configuration has been suggested as a canonical flow to study the turbulent cascade (Yao & Hussain, 2022). As clearly demonstrated by Ostilla-Mónico et al. (2021), however, the dynamics are completely different from those considered in this section. Here, the tubes initially stretch and flatten prior to contacting one another, producing very thin vortex sheets. The influence of the fluid viscosity at this scale eventually becomes significant, which leads to the reconnection of the vortex tubes. Small-scale vortices are generated away from the region where the vortices reconnect (Ostilla-Mónico et al., 2021). The visualization of the energy transfer and comparison of and other statistics to those of HIT, presented in Appendix A, highlights significant differences with the flows studied in Sections 3 and 4, so care must be taken when using this flow as a model for the energy cascade.
5 The role of the large-scale strain and vorticity fields
The discussion in section 3 did not provide any indication that the most intense structures of the vorticity field are particularly important to understand the energy transfer in HIT. The complexity of the interactions between scales in the flow comes, to a large extent, from the multiplicity of scales involved, including at the largest scales. The analysis of the two anti-parallel tubes has shown that with a carefully chosen initial condition, the large-scale flow structures can be ordered, and that this can help us directly visualize this transient energy cascade.
In this section, we consider the possibility of constraining the largest scales of the flow in a statistically stationary manner, in an attempt to simplify the complex dynamics analyzed in Section 3. We are motivated by the work of Goto et al. (2017) who showed that a relatively simple flow configuration at large scales developed a sustained turbulent state, where the identification of certain features associated with vortex stretching corresponded to the transfer of energy across scales. Following Goto et al. (2017), we study here a configuration forced by a simple forcing mode, in Fourier space (see Eq. 7), which leads to a large scale organization of the flow with four columnar vortices arising in a sustained manner. In the statistically stationary flow, the results of Goto et al. (2017); Yoneda et al. (2021) suggest that the resulting vorticity field is organized in a hierarchical manner. Namely, the stretching that amplifies the vorticity in a waveband is induced by vorticity in bands , with a length-scale larger than yet close to . This process iterates in a self-similar manner down the scales from the first four large-scale tubes to the dissipation scale. This enticing self-similar picture is reminiscent of the one proposed by Tennekes & Lumley (1972), although based on a qualitatively different picture of the role of strain in the energy transfer across scales. The scenario proposed by Goto et al. (2017) also shares qualitative similarities with the iterative cascade in the configuration of two antiparallel vortex tubes (McKeown et al., 2020). However, recent works indicate that the role of vortex stretching in the cascade of energy is subdominant, compared to the amplification of strain (Carbone & Bragg, 2020; Johnson, 2020, 2021).
Fig. 8 provides an elementary characterization of the turbulence in the flow. The Reynolds number is estimated to be . Understandably, the flow deviates from the typical spectra at the largest scales, as shown in Fig. 8(a), or the energy flux spectrum , as shown in Fig. 8(b). However, it is in these largest scales that we can visually appreciate the organizing effect of the forcing. The visualization of in Fig. 8(c) showcases the four tubes generated by the forcing. In , shown in Fig. 8(d), we observe the hierarchical arrangement suggested by Goto et al. (2017), where the vorticity preferentially aligns the next hierarchy of filaments perpendicular to the large-scale vortex tubes. The vorticity filtered at and the unfiltered vorticity, indicated in Fig. 8(e-f) respectively, show less preferential alignment,though the flow is clearly anisotropic. We also note that the size of the most intense structures of the vorticity field, shown in Fig. 8(f), are smaller than those of HIT at , shown in Fig. 1. This observation could be explained by the reduced Reynolds number of the flow illustrated in Fig. 10, , which is less than that in the HIT flow shown in Fig. 1.
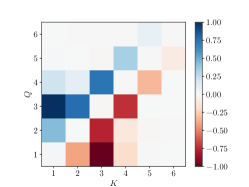
To further study this flow, in Fig. 9 we show an analysis of energy transfer at a time after the flow has reached a statistically steady state. Fig. 9(a) shows the integrated 2D energy transfer spectrum, . Beyond a qualitative resemblance with comparable figures previously examined, we notice that the transfer from to modes at higher wavenumbers does not decay with increasing wavenumber as fast as in the case of HIT, as shown in Fig. 2(a). Rather the transfer from the shell extends appreciably to bands beyond . This is confirmed in Fig. 9(b), which shows a weak decay of with increasing , far from the power laws obtained for HIT in Fig. 2(b). This is reminiscent of the antiparallel tube interaction, see Fig. 6(a-b). For both the anti-parallel tubes and the present flow configuration, the organized nature of the flow in the band leads to an efficient transfer of energy, reaching out to scales (values of ) beyond what would occur in the case of an HIT flow with a much less structured forcing at the largest scales.
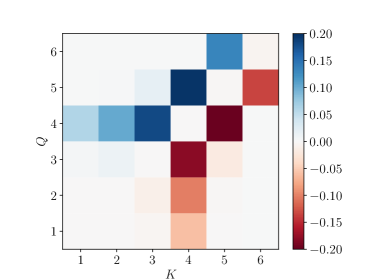
Conversely, the transfer in Fig. 9(b) decays more rapidly than in the HIT case, see Fig. 2. In addition, the mode seems to transfer very little energy to , and this “step” of the cascade seems missing, as shown in Fig. 9(a). This is further confirmed by examining the triple correlator between 3 bands , as defined by Eq. (3), and fixing , as shown in Fig. 9(c). This shell is absent from the overall transport of energy, unlike for the case of HIT. It thus appears that, although the forcing introduced by Goto et al. (2017) induces a clear ordering of the velocity at large scale, it does not provide insight to the subtleties of the transport in the large-wavelength shells. Meanwhile, the triple correlator with shell, shown in Fig. 9(d), seems largely similar to the case of HIT, indicating that once the strain field becomes largely isotropic, the phenomenology begins to better resemble that of the general turbulent cascade.
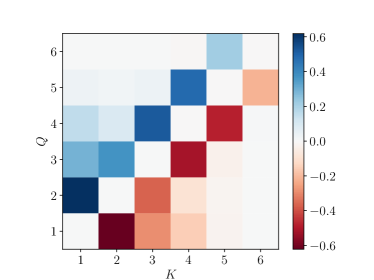
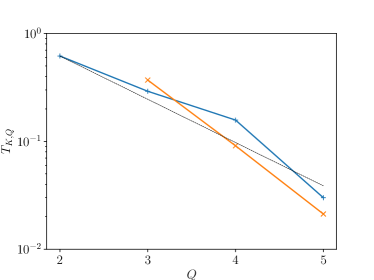
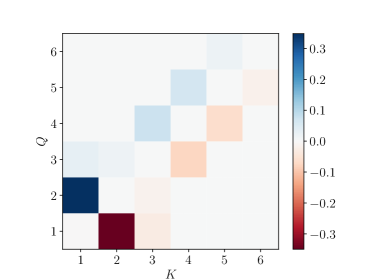
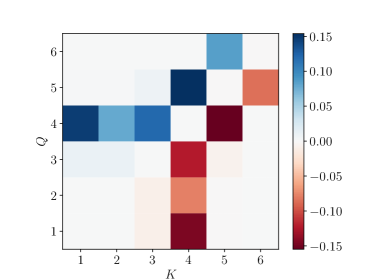
Fig. 10 visualizes the energy transfer rate, , in real space. As was the case in HIT (see Fig. 3(a-f), Fig. 10 shows that regions of intense energy transfer from to with (blue regions), and from (green regions) are somewhat spread throughout the flow, without any strong correlation with the most intense structures of the vorticity field. Our attempts to correlate the energy transfer rate with the regions where did not reveal as strong a correlation as the one visually observed by Goto et al. (2017) when analyzing vortex stretching. More generally, as was the case in the HIT configuration (see Fig. 3(a-f)), we did not observe any convincing correlation between regions where is intense and regions of intense values of or .

The lack of any visual correlation in the energy transfer between scales, , and the various components of vorticity, , and strain, , at a scale or , is confirmed by calculating the Pearson correlation coefficient between these quantities. As was the case for HIT considered in Section 3, we find negligible correlations between and , , and (on the order of ). The correlation between and strain and vorticity filtered at scales or are slightly larger, but remain small, when compared to those in Section 4.2. This confirms the visual impression of a lack of correlation between energy transfer and strain or vorticity at a given scale. In addition, our visualizations and the calculation of the Pearson correlation coefficient do not reveal any particularly strong correlation between strain and vorticity, filtered at the same scale, in agreement with the HIT configuration detailed in Section 3.
This leads us to the conclusion that the organized structure of vortex stretching found by Goto et al. (2017), and analyzed by Yoneda et al. (2021), does not particularly help in identifying a simple underlying structure of energy transfer. This is particularly true at the smallest scales, where the transfer of energy strongly resembles that of HIT. In this sense, the remarkably simple picture, observed in the interaction of antiparallel vortex tubes and in the configuration studied by Goto et al. (2017), appears to be the result of a strong influence of the large-scale forcing (or initial conditions), even if the flow with two antiparallel tubes shows statistics closer to those of HIT. This makes both flows ideal for the study of the energy transfer associated to vortex stretching, but less applicable to the general case of the turbulent cascade.
6 Summary and conclusion
In this work, we investigated the transfer of energy between bands of wavenumbers in several previously studied flow configurations in order to study the turbulent energy cascade. To this end, we decomposed the velocity fields by splitting the wavenumber space into shells of wavenumbers, , centered around , as defined by Eq. 1. The energy transfer rate between bands of wavenumbers and is then written as an integral over a scalar quantity, . This allowed us to characterize not only the energy transfer in Fourier space, by representing as a function of and , but also to visualize this quantity in real space, characterizing the regions where is large. We also examined the possibility of correlating this field with the vorticity and strain, filtered in the same bands of wavenumbers and , to examine how energy transfer coincides with regions of high strain or vorticity.
We first used this decomposition to consider the canonical configuration of a statistically stationary homogeneous isotropic turbulent flow (in the presence of an external forcing), at a moderately high Reynolds number, . In agreement with earlier studies, we verified that in Fourier space, the energy transfer is mostly local, i.e. decreases precipitously with . Our numerical results are consistent with earlier numerical works (Alexakis et al., 2005b; Mininni et al., 2005), which found that , in agreement with earlier predictions of Kraichnan (1966); Tennekes & Lumley (1972); Eyink & Aluie (2009).
While the structure of the energy transfer for HIT in Fourier space, as defined by the integrated second-order correlator , has a remarkably simple structure, we could not find any clear structure of the energy transfer function, in real space. Visually, this function neither correlates with the regions of most intense vorticity or strain in the flow, nor with the vorticity or strain filtered in bands or , as defined by Eq. 1. This lack of correlation was validated by by calculating the Pearson correlation coefficient between these sets of variables. We also observed that the vorticity and strain, themselves, are weakly correlated in real space. We notice that the prediction of Tennekes & Lumley (1972) about the locality of the energy transfer was based on a physical picture grounded on an analysis of the effect of strain at the largest scale. The lack of correlation between and the strain thus appears unexpected in this respect.
We then considered the transfer of energy in time-dependent flows, taking as initial condition two laminar, antiparallel counter-rotating vortices, which rapidly break down and develop intense small-scale motions and eventually generate a transient energy spectrum. Using our method, we co-localized the intense vortex structures, which develop in the flow as a result of the interaction between the two original vortices, with the regions of intense energy transfer directed mostly towards small scales. This simple correlation between intense vortices and regions of intense energy transfer persists even in the turbulent regime, with a energy spectrum. We noticed, however, that the correlation between the energy transfer function, and vorticity or strain, filtered at similar scales, remained relatively small, even if larger than for the HIT case. This implies that in these seemingly simple flows, the interaction between scales is much more complicated than what one could have inferred from the visualisations of the flow.
We finally attempted to use this method on the forcing proposed by Goto et al. (2017), which structures the large scale-structures while resulting in a statistically stationary turbulent flow. In their original studies, this forcing was very useful in clarifying the structure of vortex stretching in the flow. However, visualizing did not particularly aid in clarifying the structure of energy transfer in the flow. It is thus interesting to contrast the results shown here with the simpler picture obtained by analyzing vortex stretching by Goto et al. (2017) and Motoori & Goto (2019). Vortex stretching reveals a more intuitive picture, whereby the strain generated at scale correlates strongly with vorticity, filtered at a scale or . This picture emerges clearly from the analysis of the flow considered in Section 5, for and , and is qualitatively similar to what has been obtained with two parallel tubes by McKeown et al. (2018, 2020). It is important to recall, however, that the integrated energy transfer rate, (and the corresponding scalar function, ), fundamentally differs from the observables used to characterize vortex stretching by Goto et al. (2017) and Yoneda et al. (2021). As stressed recently (Carbone & Bragg, 2020; Johnson, 2021), vortex stretching does not coincide with energy transfer. In fact, nonlinear interactions involving strain contribute more to energy transfer than vortex stretching, except at the smallest, dissipative scales of the flow. Hence, what is revealed by examining vorticity amplification appears unlikely to be related to energy transfer. Indeed, even in configurations where the analysis of Goto et al. (2017) provides a clear scaling argument of vortex stretching, as studied by Yoneda et al. (2021), we could not identify any particularly strong correlation between energy transfer with intense vorticity nor with intense strain at the various scales considered.
The additional flow configuration of two initially perpendicular vortex tubes (see Appendix A), which leads to reconnection via a strong flattening of the cores followed by their subsequent breakdown, has also been often considered an ideal testing ground to study the energy cascade. Although a turbulent regime has been observed at Reynolds numbers higher than what has been studied here, our results reveal a correlation between vorticity, strain, and energy transfer at similar scales that is strongest in the regime where the two tubes are about to reconnect. This regime, however, does not appear to accurately capture the transfer of energy that occurs in HIT.
Although our work encompasses a limited range of Reynolds numbers (), we do not expect that increasing will lead to any significant change in the complex picture discussed, based on the numerical data used in this study.
Acknowledgements.
We acknowledge the Research Computing Data Core, RCDC, at the University of Houston for providing us with computational resources and technical support. AP was supported by the International Research Project ‘Non-Equilibrium Physics of Complex Systems’ (IRP-PhyComSys, France-Israel), and by the French Agence Nationale de la Recherche, under Contract No. ANR-20-CE30-0035 (project TILT). MPB acknowledges the Simons Foundation and ONR N00014-17-1-3029. Declaration of interests: The authors report no conflicts of interest.References
- Alexakis et al. (2005a) Alexakis, A., Mininni, P. D. & Pouquet, A. 2005a Imprint of large-scale flows on turbulence. Phys. Rev. Lett. 95 (26), 264503.
- Alexakis et al. (2005b) Alexakis, A., Mininni, P. D. & Pouquet, A. 2005b Shell-to-shell energy transfer in magnetohydrodynamics. I. Steady state turbulence. Phys. Rev. E 72, 046301.
- Aluie & Eyink (2009) Aluie, H. & Eyink, G. L. 2009 Localness of energy cascade in hydrodynamic turbulence. ii. sharp spectral filter. Physics of Fluids 21 (11), 115108.
- Aluie & Eyink (2010) Aluie, Hussein & Eyink, Gregory L 2010 Scale locality of magnetohydrodynamic turbulence. Physical review letters 104 (8), 081101.
- Antonia et al. (2003) Antonia, R. J., Smalley, R. J., Zhou, T. & Anselmet, F. 2003 Similarity of energy structure functions in decaying homogeneous isotropic turbulence. J. Fluid Mech. 487, 245–269.
- van Atta & Chen (1968) van Atta, C. W. & Chen, W. Y. 1968 Correlation measurements in grid turbulence using digital harmonic analysis. J. Fluid Mech. 34, 497–515.
- Bardina et al. (1980) Bardina, J., Ferziger, J. H. & Reynolds, W. C. 1980 Improved subgrid scale models for large eddy simulation. AIAA Pap. 80-1357.
- Batchelor & Townsend (1947) Batchelor, G. K. & Townsend, A. A. 1947 The nature of turbulent motion at large wave-numbers. Proc. R. Soc. Lond. A 190, 534–550.
- Batchelor & Townsend (1948a) Batchelor, G. K. & Townsend, A. A. 1948a Decay of isotropic turbulence in the final period. Proc. R. Soc. Lond. A 194, 527–543.
- Batchelor & Townsend (1948b) Batchelor, G. K. & Townsend, A. A. 1948b Decay of isotropic turbulence in the initial period. Proc. R. Soc. Lond. A 193, 539–558.
- Brasseur & Wei (1994) Brasseur, J. G. & Wei, C. H. 1994 Interscale dynamics and local isotropy in high reynolds number turbulence within triadic interactions. Phys. Fluids 6, 842–870.
- Brenner et al. (2016) Brenner, M. P., Hormoz, S. & Pumir, A. 2016 Potential singularity mechanism for the euler equations. Phys. Rev. Fluids 1, 084503.
- Buaria et al. (2020) Buaria, D., Pumir, A. & Bodenschatz, E. 2020 Self-attenuation of extreme events in navier–stokes turbulence. Nat Commun 11, 5852.
- Carbone & Bragg (2020) Carbone, M. & Bragg, A. D. 2020 Is vortex stretching the main cause of the turbulent energy cascade ? J. Fluid Mech. 883, R2.
- Chouippe & Uhlmann (2015) Chouippe, A. & Uhlmann, M. 2015 Forcing homogeneous turbulence in direct numerical simulation of particulate flow with interface resolution and gravity. Physics of Fluids 27 (12), 123301.
- Domaradzki & Carati (2007) Domaradzki, J. A. & Carati, D. 2007 A comparison of spectral sharp and smooth filters in the analysis of nonlinear interactions and energy transfer in turbulence. Physics of fluids 19 (8), 085111.
- Domaradzki & Rogallo (1990) Domaradzki, J. A. & Rogallo, R. S. 1990 Local energy transfer and nonlocal interactions in homogeneous, isotropic turbulence. Phys. Fluids A2, 413–426.
- Domaradzki et al. (2009) Domaradzki, J. A., Teaca, B. & Carati, D. 2009 Locality properties of the energy flux in turbulence. Physics of fluids 21 (2), 025106.
- Eswaran & Pope (1988) Eswaran, V & Pope, SB 1988 An examination of forcing in direct numerical simulations of turbulence. Computers & Fluids 16 (3), 257–278.
- Eyink & Aluie (2009) Eyink, G. L. & Aluie, H. 2009 Localness of energy cascade in hydrodynamic turbulence. i. smooth coarse graining. Physics of Fluids 21 (11), 115107.
- Favier et al. (2014) Favier, B., Silvers, L. J. & Proctor, M. R. E. 2014 Inverse cascade and symmetry breaking in rapidly rotating boussinesq convection. Phys. Fluids 26, 096605.
- Frisch (1995) Frisch, Uriel 1995 Turbulence: the legacy of AN Kolmogorov. Cambridge university press.
- Germano et al. (1991) Germano, Massimo, Piomelli, Ugo, Moin, Parviz & Cabot, William H 1991 A dynamic subgrid-scale eddy viscosity model. Physics of Fluids A: Fluid Dynamics 3 (7), 1760–1765.
- Goto (2008) Goto, S. 2008 A physical mechanism of the energy cascade in homogeneous and isotropic turbulence. J. Fluid Mech. 605, 355–366.
- Goto et al. (2017) Goto, S., Saito, G. & Kawahara, G. 2017 Hierarchy of antiparallel vortex tubes in spatially periodic turbulence at high Reynods number. Phys. Rev. Fluids 2, 064603.
- Hussain (1986) Hussain, A. K. M. F. 1986 Coherent structures and turbulence. J. Fluid Mech. 173, 303–356.
- Jiménez et al. (1993) Jiménez, J, Wray, A., Saffman, P. & Rogallo, R. 1993 The structure of intense vorticity in isotropic turbulence. J. Fluid Mech. 225, 65–90.
- Johnson (2020) Johnson, P. L. 2020 Energy transfer from large to small scales in turbulence by multiscale nonlinear strain and vorticity interactins. Phys. Rev. Lett. 124, 104501.
- Johnson (2021) Johnson, P. L. 2021 On the role of vorticity stretching and strain self-amplification in the turbulence energy cascade. J. Fluid Mech. 922, A3.
- de Karman & Howarth (1938) de Karman, T. & Howarth, L. 1938 On the statistical theory of isotropic turbulence. Proc. Roy. Soc. Lond. A 164, 192–215.
- Katz & Sheng (2010) Katz, J. & Sheng, J. 2010 Applications of holography in fluid mechanics and particle dynamics. Ann. Rev. Fluid Mech. 42, 531–55.
- Kerr et al. (1996) Kerr, R. M., Domaradzki, J. A. & Barbier, G. 1996 Small-scale properties of nonlinear interactions and subgrid-scale energy transfer in isotropic turbulence. Phys. Fluids 8, 197–208.
- Kerswell (2002) Kerswell, R. R. 2002 Elliptical instability. Ann. Rev. Fl. Mech. 34, 83–113.
- Kolmogorov (1941) Kolmogorov, A. N. 1941 The local structure of turbulence in incompressible viscous fluids for very high Reynolds numbers. Dokl. Akad. Nauk SSSR 30 (4), 299–303.
- Kraichnan (1966) Kraichnan, R. H. 1966 Isotropic turbulence and inertial range structures. Phys. Fluids 9, 1728–1752.
- Kunnen et al. (2016) Kunnen, R. P. J., Ostilla-Mónico, R., van der Poel, E. P., Verzicco, R. & Lohse, D. 2016 Transition to geostrophic convection: the role of the boundary conditions. J. Fluid Mech. 799, 413–432.
- Leonard (1975) Leonard, Athony 1975 Energy cascade in large-eddy simulations of turbulent fluid flows. In Advances in geophysics, , vol. 18, pp. 237–248. Elsevier.
- Leweke et al. (2016) Leweke, T., Le Dizès, S. & Williamson, C. H. K 2016 Dynamics and instabilities of vortex pairs. Ann. Rev. Fl. Mech. 48, 507–541.
- Lim & Nickels (1992) Lim, T. T. & Nickels, T. B. 1992 Instability and reconnection in the head-on collision of two vortex rings. Naure 357, 225–227.
- Liu et al. (1994) Liu, S., Meneveau, C. & Katz, J. 1994 On the properties of similarity subgrid-scale models as deduced from measurements in a turbulent jet. J. Fluid Mech. 257, 83–119.
- McKeown et al. (2018) McKeown, R., Ostilla-Mónico, R., Pumir, A., Brenner, M. P. & Rubinstein, S. M. 2018 A cascade leading to the emergence of small scale structures in vortex ring collisions. Phys. Rev. Fluids 3, 124702.
- McKeown et al. (2020) McKeown, R., Ostilla-Mónico, R., Pumir, A., Brenner, M. P. & Rubinstein, S. M. 2020 Turbulence generation through an iterative cascade of the elliptical instability. Sci. Adv. 6, eaaz2717.
- Meneveau (1994) Meneveau, Charles 1994 Statistics of turbulence subgrid-scale stresses: Necessary conditions and experimental tests. Physics of Fluids 6 (2), 815–833.
- Meneveau & Katz (2000) Meneveau, C. & Katz, J. 2000 Scale-invariance and turbulence models for large-eddy simulation. Ann. Rev. Fluid Mech. 32, 1–32.
- Menon et al. (1994) Menon, S., Yeung, P. K. & Kim, W. W. 1994 Effect of subgrid models on hte computed interscale energy transfer in isotropic turbulence. AIAA Pap. 94-2387.
- Metais & Lesieur (1996) Metais, O. & Lesieur, M. 1996 New trends in large-eddy simulations of turbulence. Ann. Rev. Fluid Mech. 28, 45–82.
- Mininni et al. (2005) Mininni, P. D., Alexakis, A. & Pouquet, A. 2005 Shell-to-shell energy transfer in magnetohydrodynamics. ii. kinematic dynamo. Phys. Rev. E 72, 046302.
- Mininni et al. (2006) Mininni, P. D., Alexakis, A. & Pouquet, A. 2006 Large-scale flow effects, energy transfer, and self-similarity on turbulence. Phys. Rev. E 74 (1), 016303.
- Moffatt (2002) Moffatt, H. K. 2002 G. k. batchelor and the homogenization of turbulence. Ann. Rev. Fluid Mech. 34, 19–35.
- Moffatt & Kimura (2019) Moffatt, H. K. & Kimura, Y. 2019 Towards a finite-time singularity of the navier-stokes equations. part i. derivation and analysis of dynamical system. J. Fluid Mech. 870, 930–967.
- Motoori & Goto (2019) Motoori, Y. & Goto, S. 2019 Generation mechanism of a hierarchy of vortices in a turbulent boundary layer. J. Fluid Mech. 865, 1085–1109.
- Ostilla-Mónico et al. (2021) Ostilla-Mónico, R., McKeown, R., Ostilla-Mónico, R., Brenner, M. P., Rubinstein, S. M. & Pumir, A. 2021 Cascades and reconnection in interacting vortex filaments. Phys. Rev. Fluids 6, 074701.
- Pumir (1994) Pumir, A. 1994 A numerical study of pressure fluctuations in three-dimensional, incompressible, homogeneous, isotropic turbulence. Phys. Fluids 6, 2071–2083.
- Richardson (1922) Richardson, L. F. 1922 Weather prediction by numerical processes. Cambridge university press.
- Siggia (1981) Siggia, E. D. 1981 Numerical study of small-scale intermittency in three-dimensional turbulence. J. Fluid Mech. 107, 375–406.
- Siggia & Pumir (1985) Siggia, E. D. & Pumir, A. 1985 Incipient singularities in the navier-stokes equations. Phys. Rev. Lett. 55, 1749–1752.
- Sinhuber et al. (2015) Sinhuber, M., Bodenschatz, E. & Bewley, G. P. 2015 Decay of turbulence at high reynolds number turbulence. Phys. Rev. Lett. 114, 034501.
- Smagorinsky (1963) Smagorinsky, J. 1963 General circulation experiments with the primitive equations: I. The basic experiment. Mon. Wea. Rev. 91, 99–164.
- Sreenivasan et al. (1980) Sreenivasan, K. S., Tavoularis, S., Henry, R. & Corrsin, S. 1980 Temperature fluctuations and scales in grid-generated turbulence. J. Fluid Mech. 100, 597–621.
- Tao et al. (2002) Tao, B., Katz, J. & Meneveau, C. 2002 Statistical geometry of subgrid-scale stresses determined from holographic particle image velocimetry measurements. J. Fluid Mech. 457, 35–78.
- Tao (2016) Tao, T. 2016 Finite time blowup for an averaged three-dimensional navier-stokes equation. J. Amer. Math. Soc. 29, 601–674.
- Taylor (1935) Taylor, G. I. 1935 Statistical theory of turbulence. Proc. Roy. Soc. Lond. A 151, 421–444.
- Teaca et al. (2011) Teaca, Bogdan, Carati, Daniele & Andrzej Domaradzki, J 2011 On the locality of magnetohydrodynamic turbulence scale fluxes. Physics of Plasmas 18 (11), 112307.
- Tennekes & Lumley (1972) Tennekes, H. & Lumley, J. L. 1972 A first course in turbulence. The M.I.T. Press.
- Ueberoi (1963) Ueberoi, M. S. 1963 Energy transfer in isotropic turbulence. Phys. Fluids 8, 1048–1056.
- Verma et al. (2018) Verma, B., Kumar, A., Kumar, P., Barman, S., Chatterjee, A. G., Samtaney, R. & Stepanov, R. A. 2018 Energy spectra and fluxes in dissipation range of turbulent and laminar flows 53, 862–873.
- Warhaft & Lumley (1978) Warhaft, Z. & Lumley, J. L. 1978 An experimental study of the decay of temperature fluctuations in grid turbulence. J. Fluid Mech. 88, 659–684.
- Yao & Hussain (2020) Yao, J. & Hussain, F. 2020 A physical model of turbulence cascade via vortex reconnection sequence and avalanche. J. Fluid Mech. 883, A51.
- Yao & Hussain (2022) Yao, J. & Hussain, F. 2022 Vortex reconnection and turbulence cascade. Annu. Rev. Fluid Mech. 54, 317–347.
- Yeung et al. (1995) Yeung, P. K., Brasseur, J. G. & Wang, Q.Z. 1995 Dynamics of direct large-small scale couplings in coherently forced turbulence : concurrent physical- and fourier-space views. J. Fluid Mech. 283, 43–75.
- Yoneda et al. (2021) Yoneda, T., Goto, S. & Tsuruhashi, T. 2021 Mathematical reformulation of the kolmogorov-richardson energy cascade in terms of vortex stretching. arXiv:2105.12459.
- Zhou (1993) Zhou, Ye 1993 Degrees of locality of energy transfer in the inertial range. Physics of Fluids A: Fluid Dynamics 5 (5), 1092–1094.
Appendix A Initially perpendicular vortex tubes: reconnection and energy transfer
Here, we consider the flow configuration of two initially perpendicular vortex tubes and examine how their interaction and breakdown relates to the energy transfer behaviors detailed in Sections 3 and 4. The interaction between these tubes generates small-scale flow structures, but not the classic spectra at the Reynolds number in our simulations, as shown in Fig. 11(a). In addition, we also show the energy flux in Fig. 11(b). While energy is transferred to smaller scales, this transfer is much smaller than for the anti-parallel tubes analyzed earlier.
In this configuration, the dynamics lead to the formation of intense vortex sheets as the tubes initially stretch and flatten prior to contacting one another. These vortex sheets then burst, leading to a reconnection of the vortex tubes which generates a residual a cloud of fine-scale vortices (Ostilla-Mónico et al., 2021). This evolution shares many features with the more classical configuration used to study vortex reconnection that starts with two initially close, antiparallel vortices with a perturbation in their position (Brenner et al., 2016; Yao & Hussain, 2022). The run analyzed here is described in detail in Ostilla-Mónico et al. (2021). The Reynolds number of this run, , is sufficient to replicate most of the phenomena observed in symmetric configurations studied at higher Reynolds numbers, e.g. by Yao & Hussain (2020). However, it is still too low to observe evidence of a genuinely turbulent flow with a characteristic energy spectrum.
Fig. 12(a) shows the integrated energy transfer spectrum, at 3 different stages of the evolution: as the vortices approach each other (, left column), shortly before they reconnect (, center column), and after reconnection (, right column), while the vorticity field at these times is shown in Fig. 12(b). The maximum kinetic energy dissipation rate, defined as , where represents an average in space and time, grows by shortly after the time shown in the central column, in the time range .
Even at the earliest time shown, significant energy transfer occurs between shells and , and between shells and , while energy transfer from higher modes at shells () to is much weaker. When the strong interaction between the tubes commences just prior to reconnection, at , the transfer of energy between and decreases significantly and actually changes sign, indicating a net transfer toward the larger scale. Most of the energy transfer to smaller scales originates from the mode, see also Fig. 2 of Ostilla-Mónico et al. (2021).
As the energy transfer between wavenumber bands is mostly concentrated between and as well as and , we superimpose on the vorticity field the regions of intense energy transfer in Fig. 12(c) and for 12(d). The regions where the energy transfers toward smaller scales (i.e. ) are shown in blue, and the regions of intense energy transfer toward larger scales (i.e. ) are shown in green. At the earliest time shown, much of the energy transfer from towards is concentrated in the region where the tubes come closest together, visible as the blue region between the filaments on the left column of Fig. 12(c). Conversely, we observe a negative transfer toward the larger scale on the other sides of the tubes. At this early time, we do not observe any significant transfer between shells and , as shown in Fig. 12(d).
At , when the vortex tubes have begin reconnecting, the band structure of regions of positive and negative energy transfer between and persists, as shown in the middle column of Fig. 12(c). The positive transfer of energy between the tubes, however, is no longer as strong as it was at . The negative transfer, seen on the other side of the tubes, become simplified. The intense interaction between the tubes gives rise to a strong transfer of energy between the and shells, as shown in the center column of Fig. 12(d).
At the later time, , after the vortex tubes locally reconnect and separate, Fig. 12(a) reveals that an active transfer of energy evolves over a broader range of wavenumber bands, and not just around , though is still the largest transfer. At this time, the flow exhibits a characteristic bow-like structure behind the reconnected vortices, with active small-scale motion (Ostilla-Mónico et al., 2021). The right column of Fig. 12(c) shows that regions of positive and negative energy transfer between the and shells are located along the two separating tubes, particularly in the regions where the interacting tubes had reconnected. Also, a significant amount of energy transfer at smaller scales is localized in the two residual braided vortices, as shown in the right column of Fig. 12(d). As suggested by Yao & Hussain (2020), this is the region where one observes, at much higher Reynolds numbers, a proliferation of very small-scale motion, leading to a energy spectrum. A faint signature of this can be seen in the relatively large value of , larger than , in the final panel of Fig. 12(a). This suggests a strong energy transfer toward bands of higher wavenumbers, which is consistent with the development of a energy spectrum at large wavenumbers, observed in higher Reynolds-number reconnections by Yao & Hussain (2020). These late-stage dynamics occur according to a cascade of instabilities (Yao & Hussain, 2020), possibly similar to the one documented by McKeown et al. (2020).
We also note that the strain, shown in panels (e) is most intense in the spaces between interacting vortices, even if little more can be said about it. Indeed, the correlations for this flow between and the filtered strains and vorticities are much weaker than for the originally anti-parallel tubes, detailed in Section 4. They are practically zero for the signed values of and in the range of for in the shells , , and . This can be explained by the fact that the relationship between energy transfer and both strain and vorticity is less direct in this flow, especially as there are large regions of the flow where no appreciable energy transfer occurs. Similarly, there is a larger correlation () between and for , , and than what is observed previously, even though not for . This indicates again that the first shell is rather inactive in this flow, as most of the dynamics is concentrated in a very small region.
The results of this section set a limit on how much further analysis can be done to relate the local dynamics in this system to those of the general HIT case. Although the flattening of the two interacting tubes into vortex sheets, observed in many simulations (Yao & Hussain, 2022), does lead to the formation of small-scale flow structures, its signature on the transfer of energy toward small scales is qualitatively different from what is seen in HIT, as detailed in Section 3. The faint cascade observed at later times is restricted to very small scales (i.e. large wavenumbers), where viscous effects are already significant. The transfer of energy is therefore much reduced, compared to the other flows considered, with a clear inertial regime.