Saliency in Augmented Reality
Abstract.
With the rapid development of multimedia technology, Augmented Reality (AR) has become a promising next-generation mobile platform. The primary theory underlying AR is human visual confusion, which allows users to perceive the real-world scenes and augmented contents (virtual-world scenes) simultaneously by superimposing them together. To achieve good Quality of Experience (QoE), it is important to understand the interaction between two scenarios, and harmoniously display AR contents. However, studies on how this superimposition will influence the human visual attention are lacking. Therefore, in this paper, we mainly analyze the interaction effect between background (BG) scenes and AR contents, and study the saliency prediction problem in AR. Specifically, we first construct a Saliency in AR Dataset (SARD), which contains 450 BG images, 450 AR images, as well as 1350 superimposed images generated by superimposing BG and AR images in pair with three mixing levels. A large-scale eye-tracking experiment among 60 subjects is conducted to collect eye movement data. To better predict the saliency in AR, we propose a vector quantized saliency prediction method and generalize it for AR saliency prediction. For comparison, three benchmark methods are proposed and evaluated together with our proposed method on our SARD. Experimental results demonstrate the superiority of our proposed method on both of the common saliency prediction problem and the AR saliency prediction problem over benchmark methods. Our dataset and code are available at: https://github.com/DuanHuiyu/ARSaliency.
1. Introduction
With the evolution of multimedia technology, head-mounted display (HMD) technologies (e.g., Virtual Reality (VR), Augmented Reality (AR), Mixed Reality (MR), etc.) have attracted more attention recently and have become promising next-generation display solutions (Cakmakci and Rolland, 2006; Zhan et al., 2020). Among these technologies, AR aims at enriching the real-world information by superimposing virtual contents on it, which promises to be the next-generation mobile platform. Since AR technology can display augmented contents while keeping real-world information, it has great potentials in many applications, such as communication, entertainment, health care, education, engineering design, etc.
The superimposition of background (BG) scenes (i.e., real-world scenes) and AR contents (i.e., virtual-world contents) in AR display will cause visual confusion (Woods et al., 2010; Peli and Jung, 2017), which alters the way that humans perceive both of the real world and virtual world (Duan et al., 2022b, a, c). The primary value of AR is to enrich the real-world information, however, inappropriate augmented design may affect the Quality of Experience (QoE) of users (Duan et al., 2022b), arouse inattentional blindness (Mack, 2003), and may even cause danger (Wang et al., 2021). Therefore, it is important to analyze and model the visual attention behaviour of humans in AR environment.
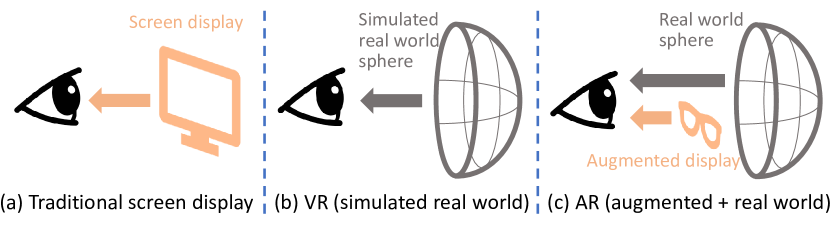
Visual attention analysis and prediction have long been important tasks in both multimedia and computer vision research (Itti et al., 1998; Rai et al., 2017; Borji, 2019), since they can give new insights about human attention mechanisms and contribute to many multimedia applications, such as image compression, object and motion detection, etc. Many previous works on saliency datasets (Bylinskii et al., 2015; Jiang et al., 2015) and saliency prediction models (Judd et al., 2009; Che et al., 2020) have been conducted on screen display as shown in Figure 1 (a). Recently, with the popularity of head-mounted displays, some visual attention datasets (Rai et al., 2017; David et al., 2018) and saliency prediction models (Zhang et al., 2021) towards VR technology have been proposed as demonstrated in Figure 1 (b). Most of these works focused on the saliency tasks on omnidirectional images/videos (Rai et al., 2017), or egocentric videos (Zhang et al., 2017). Although AR technology has great potentials, most of existing AR studies mainly focus on egocentric video understanding (Grauman et al., 2021), while they may ignore that the augmented contents are also important for AR. Zhu et al. (Zhu et al., 2019) have constructed a saliency dataset for omnidirectional videos with augmented bounding box contents on them. However, as shown in Figure 2 (a), it is hard to acquire real-world omnidirectional view in AR applications, and augmented contents are usually complex and have various superimposition degrees rather than overlaying simple bounding boxes. Duan et al. (Duan et al., 2022b) have studied the visual confusion effect in AR technology. However, they only explored the influence of visual confusion on quality of experience (QoE), while the visual attention research is still lacking. As shown in Figure 1 (c), the visual confusion caused by the superimposition of AR contents and BG scenes is significant in AR, however, the understanding of saliency in Augmented Reality environment is still limited.
Modeling the visual attention in AR can help better design, display, and adaptively adjust the virtual contents to accord the expectation of human vision (Kruijff et al., 2010), as well as contribute to AR QoE assessment (Duan et al., 2022b) and augmented image compression method design (Zhu et al., 2019) etc. Therefore, in this work, we aim at analyzing the human visual attention behavior in AR thoroughly and building an accurate saliency prediction paradigm for AR. To achieve this objective, we are facing the following research challenges:
(i) Building a dataset for AR saliency. Although there are many famous AR products, e.g., HoloLens (Microsof, 2022), Magic Leap (Leap, 2022), Epson AR (EPSON, 2022), etc., it is hard to conduct controllable eye-tracking experiments with these devices in real scenes. Moreover, the experimental scenarios may also be limited by the experimental environment.
(ii) Understanding the effect of visual confusion on AR saliency. As a common observation, a higher opacity value for augmented contents may make them clearer and attract more attention, while a lower opacity value for augmented contents may make background scenes clearer and attract more attention. Despite this general consensus, we observe that our understanding of the influence of the mixing level is still limited, and this general consensus cannot be generalized to various complex applications.
(iii) Modeling AR saliency. Since humans can perceive two layers of images in Augmented Reality, i.e., an AR image and a BG image, it is necessary and significant to study how to jointly exploit these two parts of information to build an accurate saliency model for AR.
In this work, to solve the dataset challenge, we first propose to conduct the AR eye-tracking experiment under the VR environment. As shown in Figure 1 (b) and (c), since VR is used to simulate real world scenes, it is also competent to be used as BG scenes in the AR experiments. Specifically, we collect 450 omnidirectional images as BG images, and 450 common images including 150 graphic images, 150 natural images, 150 webpage images as AR images. To better understand the influence of mixing levels on the saliency in AR, three mixing levels are used during the eye tracking experiment, and the experiment of each mixing level is conducted among different subjects. To better predict the visual attention in AR, we propose a vector quantization-based saliency model and utilize multi-decoders to integrate obtained information for joint prediction. For comparison, three benchmark paradigms for AR saliency prediction are proposed and evaluated based on our dataset. Experimental results demonstrate that our proposed model achieves state-of-the-art performance compared to other baseline methods. The contributions are summarized as follows.
-
•
We build the first AR saliency dataset that considers the visual confusion effect in AR.
-
•
We analyze the influence of visual confusion on visual attention for various stimuli.
-
•
A saliency prediction model for predicting AR saliency is proposed.
-
•
Three benchmark methods are proposed and evaluated based on our dataset, and our proposed model achieves state-of-the-art performance.
2. Related Work
2.1. Eye-tracking Datasets
Traditional Saliency Datasets. Humans have remarkable abilities to search and focus on salient regions in a scene (Marois and Ivanoff, 2005; Bundesen et al., 2015), which allows us to efficiently process a large amount of information. This neural mechanism is known as visual attention. To understand and model visual attention behavior, many eye-tracking datasets have been constructed. MIT1003 (Judd et al., 2009) is a large-scale saliency dataset, which contains 1003 images. MIT300 and CAT2000 (Bylinskii et al., 2015) are two widely used benchmark datasets, which contains 300 and 2000 test images respectively. SALICON (Jiang et al., 2015) is currently the largest crowd-sourced saliency dataset, which contains 10000 training images, 5000 validation images and 5000 test images collected through mouse tracking using Amazon Mechanical Turk (AMT). This dataset is widely used to pretrain saliency models.
VR/AR Saliency Datasets. Recently, with the popularity of HMDs and the concept of XR, many eye-tracking datasets have been constructed towards the applications in these new display technologies (Zhu et al., 2021). Salient360 (Rai et al., 2017) is one of the earliest omnidirectional datasets for saliency prediction, which contains 98 stimuli including indoor, outdoor and people scenes. For each omnidirectional image, at least 40 subjects were recruited to view the stimuli for 25 seconds. AOI (Xu et al., 2021) is a large-scale omnidirectional saliency dataset, which contains 600 images and the corresponding head/eye fixations obtained from 30 subjects. All of these datasets are constructed towards the VR saliency detection task. Zhu et al. (Zhu et al., 2019) have established a saliency dataset for 50 omnidirectional videos with bounding boxes. However, this is still an omnidirectional saliency task. Moreover, the bounding box contents can only cover part of AR applications, and they only overlay the AR contents on BG scenes, which ignores the mixing value between AR and BG. In this work, we argue that the interaction between AR contents and BG scenes is important in AR display, and study this important task among various scenarios within perceptual viewport images.
2.2. Saliency Prediction Models
Classical Saliency Models. Most traditional methods have modeled visual saliency based on the bottom-up mechanism. The early models mainly relied on extracting simple low-level feature maps such as intensity, color, and orientation etc (Itti et al., 1998). Some subsequent models incorporated middle-level and high-level features to better predict visual attention (Liang and Hu, 2015; Judd et al., 2009). These classical methods including Attention for Information Maximization (AIM) (Bruce and Tsotsos, 2005), Graph-based Visual Saliency (GBVS) (Harel et al., 2006), Judd model (Judd et al., 2009), etc., are still highly influential in current visual attention research.
Deep Saliency Models. With the development of deep neural network (DNN), the saliency prediction task has achieved significant improvement recently (Vig et al., 2014; Wang et al., 2015; Kruthiventi et al., 2017; Wang et al., 2016; Tu et al., 2022). Huang et al. (Huang et al., 2015) proposed a two stream convolutional neural network (CNN) to extract coarse and fine features to compute saliency map. Cornia et al. (Cornia et al., 2018) used long short-term memory (LSTM) to enhance the extracted feature maps from a dilated CNN to predict saliency. Pan et al. (Pan et al., 2017) proposed to use the generative adversarial network (GAN) to calculate the saliency map. Che et al. (Che et al., 2020) studied the influence of transformation on visual attention and proposed a GazeGAN model based on U-Net for saliency prediction. These models based on the top-down mechanism have been widely used in various research fields recently (Borji, 2019).
2.3. Augmented Reality
This work mainly concerns head-mounted AR application rather than mobile phone based AR application. Early head-mounted AR devices, e.g., Google Glass (Google, 2022), generally display augmented contents for only one eye and used another eye for perceiving real-world scenes based on binocular visual confusion (Duan et al., 2022b; Carmigniani et al., 2011). However, binocular rivalry caused by binocular visual confusion may strongly affect the QoE (Kruijff et al., 2010; Duan et al., 2022b). Recently, most AR technologies are built based on monocular visual confusion to avoid occluding when displaying augmented contents, such as Microsoft HoloLens (Microsof, 2022), Magic Leap (Leap, 2022), Epson AR (EPSON, 2022), etc., since monocular rivalry is much weaker than binocular rivalry (O’Shea et al., 2009). In this paper, we mainly consider these monocular visual confusion based technologies. This type of device generally has external cameras and internal gyroscope sensors to register the location of augmented contents in real-world environment, thus it is easy to get the position relationship between the AR contents and BG scenes (Zhan et al., 2020; Duan et al., 2022b).
3. SARD: Saliency in AR Dataset
3.1. Experimental Methodology
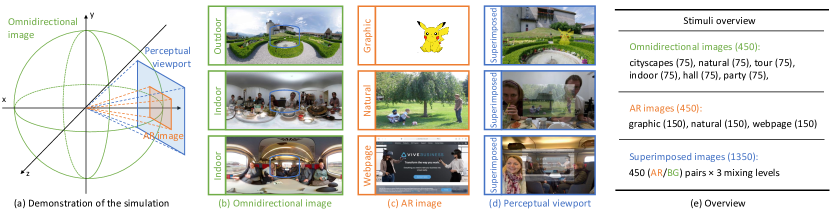
In real applications, since AR usually needs external cameras on HMDs to register and locate real-world scenes for augmented rendering, thus it is possible to capture background scenes, obtain AR contents, and acquire the relationship between AR contents and BG scenes. An intuitive way to conduct AR eye tracking experiment is wearing AR devices in various environments and then collecting eye movement data. However, this way suffers from uncontrollable experimental environments and limited experimental scenarios (Duan et al., 2022b). Another way to simulate AR scenarios is using a big screen with displaying superimposed AR/BG images on it. However, big screens cannot create immersive experience, which may not be appropriate in this study. As discussed in Sec. 1 and Figure 1, VR can simulate real world scenes (Duan et al., 2017, 2018), which is capable to simulate the BG scenes in AR applications. Therefore, as demonstrated in Figure 2 (a), we adopt the method of conducting AR eye-tracking experiments in VR environment for controllable experimental environments and diverse experimental scenarios.
3.2. Data Collection
Stimuli. We first collect 450 omnidirectional images from (Xu et al., 2021) as BG scenes, which contains six categories of scenes, i.e., cityscapes, natural landscapes, human tour scenes, indoor scenes, indoor hall scenes, and human party scenes. Example images are shown in Figure 2 (b). We then collect 450 common images online as AR contents, which consist of three types of images including graphic images, natural images, and webpage images as demonstrated in Figure 2 (c). For graphic images, only graphic areas are non-transparent, and for natural and webpage images, the whole images are non-transparent. The 450 omnidirectional images and 450 AR images are randomly paired to generate 1350 various perceptual scenarios with three mixing values, and the perceptual viewport images are formulated as:
| (1) |
where and are AR and BG images, respectively, is the intrinsic transparency matrix for AR contents, is the mixing value to generate superimposed images. is usually a 0-1 matrix, where 0 means transparent and 1 means non-transparent. Since perceptual viewports are usually larger than the field-of-view (FOV) of AR contents, we pad each AR image to the perceptual viewport size with 0 values for both of the color space and the transparency space, and keep the raw color and transparency values for original contents. The examples of generated superimposed images are shown in Figure 2 (d). Note that this generation method for superimposed images is only used for the construction of the dataset. During the eye-tracking experiment, the superimposition process is conducted in Unity3D (Unity, 2022) as illustrated below in “Procedure”.
Apparatus. We use a HTC VIVE Pro Eye (HTC, 2022) as the hardware apparatus to display omnidirectional scenes and AR stimuli, as well as to collect eye movement data. The resolution of the displays inside HTC VIVE Pro Eye is pixels per eye which covers FOV. The refresh rate of the displays is 90 Hz. Moreover, this HMD has Tobii eye-tracker inside it with the sampling frequency of 90 Hz.
Subjects. Since 3 mixing levels are imposed for each AR/BG pair, subjects may remember the scenario if they have accessed it before and it may influence the reliability of collected data. Thus, we recruit a large number of subjects, i.e., 60 subjects (20 females and 40 males), and each subject randomly watches only one mixing level of AR/BG pairs. As a result, each subject views totally 450 scenarios without scene repeat, and each superimposed viewport is viewed by 20 subjects. Before participating in the test, all subjects have read and signed a consent form which explained the human study. All participants have normal or correct-to-normal visual acuity during the experiment.
Procedure. The software system is designed using Unity3D (Unity, 2022) to control the experimental procedure and record all data. For each AR/BG pair and one mixing value , we set the omnidirectional (BG) image to cover the whole space, and set the AR image at the center viewport of the BG with adjusting the transparency value of it (the AR image) to in Unity. Before the formal experiment, a simple training session is conducted for subjects to make them familiarize with the HMD and scenarios. During the formal experiment, for each subject, 450 scenarios are randomly divided into 3 sessions with 150 scenarios per session. Unlike previous omnidirectional saliency prediction task in VR, our work focuses more on the saliency within the perceptual viewport of AR. Therefore, in our study, to make the perceptual viewport relatively fixed, subjects are seated in a fixed chair facing the center viewport of the BG rather than a swivel chair which is usually used for VR experiments (Rai et al., 2017; Xu et al., 2021), and they are encouraged to rotate their head freely but cannot turn their body. The duration for viewing each superimposed scenario is set to 5 seconds. After viewing each superimposed image, we insert a gray omnidirectional image with a red dot located at longitude = and latitude = , and no AR content is displayed. The subjects are encouraged to fixate on the red dot before the next image. At the beginning of each session, we re-calibrate the eye-tracker to ensure the reliability of the acquired data.
3.3. Data Processing and Analysis
Data Processing. The raw eye movement data are recorded in the format of [pitch, yaw, roll], thus we first convert the raw data to latitude and longitude coordinates. Then we process the gaze data to extract the fixation points. Fixation occurs when user’s eyes fixate at a specific region for a short period of time. We derive fixation by removing saccade (fast eye movement change) from the data. Specifically, we first calculate the distance and velocity between consecutive gaze points. Then the mean absolute deviation (MAD) (Voloh et al., 2019) in gaze position is calculated within a seven-sample sliding window ( 80 ms) and potential fixations are defined as windows with a MAD less than (Peterson et al., 2016; Haskins et al., 2020). Fixations with durations shorter than 100 ms are excluded (Peterson et al., 2016; Wass et al., 2013). Finally, a 2D Gaussian kernel with of visual angle (Rai et al., 2017; Zhang et al., 2018b) is imposed to all fixations to generate the saliency map for an image.
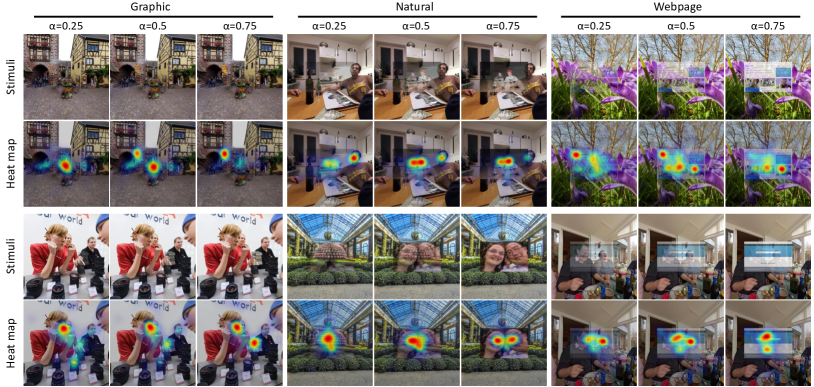
Qualitative Data Analysis. Figure 3 demonstrates some sampled saliency maps of the corresponding perceptual viewport images. Similar to the general consensus as mentioned in the introduction, we first find that a higher opacity value (i.e., higher , lower transparency) generally leads more attention on augmented contents, while a lower opacity value makes the background scenes more salient. Furthermore and more importantly, we also find that visual attention in AR environment (i.e., superimposed stimuli) is jointly and significantly influenced by the AR image, BG image and mixing value. As shown in the examples of the first two rows in Figure 3, for , subjects tend to fixate more on salient regions of the background images, for , subjects tend to focus more on salient regions of the augmented images, for , subjects tend to fixate on the salient regions of both AR and BG images. Thus we can clearly observe the saliency transform procedure from these three examples. For the three examples of the last two rows in Figure 3, saliency maps for and are more similar compared to , which means that the transition is slight when is less than 0.5. Therefore, Figure 3 qualitative illustrates that visual attention in AR environment is jointly influenced by the AR image, BG image and mixing value rather than only influenced by the mixing value.
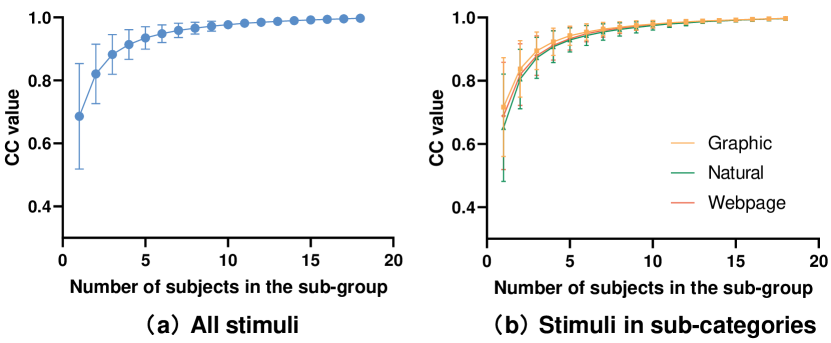
Quantitative Data Analysis. As shown in Figure 4, we first analyze the consistency of eye fixation distributions across subjects when the number of subjects increases. The consistency of eye fixations between two groups is measured by calculating the linear correlation coefficient (CC). Figure 4 (a) shows the CC values between sub-group (with fewer subjects) saliency maps and overall (all subjects) saliency maps, which are calculated and averaged among all stimuli. It can be observed that the CC value, i.e., consistency, increases and converges along with the increased subject number. Moreover, according to the consistency value and standard deviation value, we recommend that at least 10 subjects are required to obtain good consistency for conducting AR saliency experiment. We also analyze the consistency of eye fixation distributions across subjects for stimuli in sub-categories and show the results in Figure 4 (b). It can be observed that there is no obvious difference between different types of stimuli.
We further analyze the correlation between the saliency maps of the stimuli with different mixing values. Two correlation metrics including the linear correlation coefficient (CC) and the similarity measurement (SIM) are used for measuring the correlation. Figure 5 (a) shows the CC comparisons between different mixing levels for all stimuli. The three CC values are calculated between mixing value 1 (m1: ) and mixing value 3 (m3: ), mixing value 1 (m1: ) and mixing value 2 (m2: ), mixing value 2 (m2: ) and mixing value 3 (m3: ), respectively, and then averaged among all stimuli. It can be observed that the averaged CC of “m1 & m3” is significantly less than that of “m1 & m2” and “m2 & m3”, which quantitatively illustrates that the mixing value significantly influences the visual attention in AR, and saliency maps of superimposed images with middle mixing values ( near 0.5) tend to fuse the saliency maps of superimposed images with side mixing values ( away from 0.5). Figure 5 (b) shows the CC comparisons between different mixing levels for the stimuli in sub-categories. It can be observed that the averaged CC of graphic images is significantly larger than that of natural and webpage stimuli. The reason may be that the stimuli with graphic augmented contents in our dataset have less superimposed areas compared to natural and webpage contents thus have less influence on visual attention for various mixing values.
4. Vector Quantized Saliency (VQSal) Prediction in AR
As discussed above in Sec. 3.3, the AR image, BG image and mixing value in a perceptual scenario jointly influence the visual attention in AR. Thus, it is important to consider how to integrate these three types of information for saliency prediction in AR. In this section, we first propose a vector quantization (VQ) based method for visual saliency prediction as described in Sec. 4.1 and Sec. 4.2. Most recent top-down saliency models, e.g., SALICON (Huang et al., 2015), ML-Net (Cornia et al., 2016), SAM-VGG/ResNet (Cornia et al., 2018), SalGAN (Pan et al., 2017), rely on well-pretrained encoders to work well. These encoders are usually pretrained on the ImageNet classification task (Deng et al., 2009). Different from these methods, in this work, we find that using unsupervised discrete representation learning as the pretraining method can lead even better saliency prediction performance. Then, a specifically designed multi-decoder fusion network for AR saliency prediction is proposed in Sec. 4.3.
4.1. Learning a Discrete Representation Model with Perceptually Rich Information
The procedure of the vector quantized pretraining is demonstrated in Figure 6 (a). Instead of building on individuals pixels, neural discrete representation learning (van den Oord et al., 2017) aims to represent any image by a spatial collection of codebook entries from the codebook , where is the dimensionality of codes and is the learned perceptually rich code book. Specifically, a given image is first encoded by the encoder to get the feature vector . Then each spatial code in is quantized by to its closest codebook entry in the codebook via Finally, the image can be reconstructed from these codebook entries by , where is the output of the whole model. The overall discrete representation learning pipeline is:
| (2) |
Since both of the codebook () and the model (i.e., and ) are required to be learned. The vector quantized loss function can be represented as:
| (3) |
| (4) |
where is the well-known perceptual loss (Johnson et al., 2016; Zhang et al., 2018a), indicates the stop-gradient, is the “commitment loss” with weighting factor (van den Oord et al., 2017).
To get good reconstruction quality for this discrete representation learning, we follow the VQGAN (Esser et al., 2021) to learn a perceptually rich codebook via GAN as follows:
| (5) |
4.2. Transfer Learning for Saliency Prediction
Through the discrete representation model learned above, we can represent any image using a spatial collection of codebook entries , and directly reconstruct the image using these codes (visual tokens) via the decoder . The representation code includes the extremely compressed but perceptually rich information of an image, which can be directly used to decode and predict visual saliency information. Moreover, since the decoder learned during the unsupervised discrete reconstruction process can well recover most of image information, its knowledge can be easily transferred to predict visual saliency maps and learn the saliency relationship from these visual tokens. Specfically, in transfer learning, we freeze the feature extraction and quantization parts, and only finetune the decoder part to perform saliency prediction as shown in Figure 6 (b). Our proposed VQSal model can be represented as:
| (6) |
where is the decoder for saliency density prediction, and are frozen encoder and quantization networks, respectively. The loss function of the saliency prediction in our paper is defined as:
| (7) |
where , CC and KL are two widely used metrics for measuring the accuracy of the predicted saliency maps (Che et al., 2020). The weighting factor is empirically set as 0.2 in this paper.
| Model Metric | AUC | CC | IG | KL | NSS | SIM |
|---|---|---|---|---|---|---|
| SALICON (Huang et al., 2015) | 0.824 | 0.716 | 34.77 | 5.723 | 1.404 | 0.637 |
| ML-Net (Cornia et al., 2016) | 0.809 | 0.675 | 34.79 | 5.707 | 1.509 | 0.591 |
| SAM-VGG (Cornia et al., 2018) | 0.856 | 0.836 | 34.98 | 5.571 | 1.802 | 0.738 |
| SAM-ResNet (Cornia et al., 2018) | 0.855 | 0.844 | 35.04 | 5.535 | 1.809 | 0.738 |
| SalGAN (Pan et al., 2017) | 0.858 | 0.848 | 35.16 | 5.449 | 1.763 | 0.743 |
| GazeGAN (Che et al., 2020) | 0.853 | 0.826 | 34.71 | 5.760 | 1.736 | 0.732 |
| VQSal (Ours) | 0.863 | 0.869 | 35.18 | 5.434 | 1.863 | 0.766 |
| Type | Type I | Type II | Type III | ||||||||||||
|---|---|---|---|---|---|---|---|---|---|---|---|---|---|---|---|
| Model Metric | AUC | sAUC | CC | NSS | SIM | AUC | sAUC | CC | NSS | SIM | AUC | sAUC | CC | NSS | SIM |
| IT (Itti et al., 1998) | 0.541 | 0.509 | 0.075 | 0.272 | 0.105 | 0.628 | 0.528 | 0.262 | 0.859 | 0.238 | 0.622 | 0.533 | 0.308 | 1.004 | 0.369 |
| AIM (Bruce and Tsotsos, 2005) | 0.701 | 0.557 | 0.237 | 0.689 | 0.371 | 0.826 | 0.559 | 0.534 | 1.441 | 0.468 | 0.838 | 0.551 | 0.572 | 1.531 | 0.467 |
| GBVS (Harel et al., 2006) | 0.766 | 0.510 | 0.332 | 0.848 | 0.424 | 0.850 | 0.547 | 0.601 | 1.623 | 0.515 | 0.853 | 0.550 | 0.595 | 1.575 | 0.510 |
| SR (Hou and Zhang, 2007) | 0.637 | 0.513 | 0.120 | 0.359 | 0.329 | 0.791 | 0.550 | 0.458 | 1.279 | 0.456 | 0.811 | 0.552 | 0.522 | 1.443 | 0.470 |
| SUN (Zhang et al., 2008) | 0.679 | 0.534 | 0.188 | 0.640 | 0.352 | 0.806 | 0.568 | 0.491 | 1.462 | 0.445 | 0.827 | 0.569 | 0.561 | 1.635 | 0.465 |
| PFT (Guo et al., 2008) | 0.634 | 0.512 | 0.107 | 0.324 | 0.327 | 0.796 | 0.551 | 0.478 | 1.342 | 0.457 | 0.820 | 0.551 | 0.569 | 1.587 | 0.484 |
| SMVJ (Cerf et al., 2007) | 0.803 | 0.529 | 0.439 | 1.123 | 0.457 | 0.853 | 0.549 | 0.611 | 1.626 | 0.520 | 0.853 | 0.549 | 0.584 | 1.523 | 0.503 |
| Judd (Judd et al., 2009) | 0.863 | 0.531 | 0.541 | 1.415 | 0.416 | 0.878 | 0.536 | 0.637 | 1.680 | 0.447 | 0.881 | 0.529 | 0.601 | 1.563 | 0.430 |
| SWD (Duan et al., 2011) | 0.853 | 0.540 | 0.566 | 1.483 | 0.466 | 0.880 | 0.554 | 0.722 | 1.946 | 0.528 | 0.880 | 0.545 | 0.693 | 1.830 | 0.507 |
| Murray (Murray et al., 2011) | 0.650 | 0.559 | 0.181 | 0.520 | 0.356 | 0.829 | 0.549 | 0.521 | 1.364 | 0.443 | 0.847 | 0.544 | 0.573 | 1.485 | 0.454 |
| CA (Goferman et al., 2011) | 0.707 | 0.533 | 0.231 | 0.674 | 0.378 | 0.822 | 0.564 | 0.528 | 1.488 | 0.486 | 0.832 | 0.563 | 0.558 | 1.558 | 0.488 |
| CovSal (Erdem and Erdem, 2013) | 0.864 | 0.520 | 0.695 | 1.859 | 0.608 | 0.872 | 0.538 | 0.768 | 2.143 | 0.649 | 0.872 | 0.532 | 0.751 | 2.035 | 0.641 |
| HFT (Li et al., 2012) | 0.765 | 0.522 | 0.347 | 0.937 | 0.429 | 0.857 | 0.554 | 0.646 | 1.788 | 0.551 | 0.860 | 0.559 | 0.654 | 1.795 | 0.548 |
| SALICON (Huang et al., 2015) | 0.828 | 0.567 | 0.520 | 1.364 | 0.499 | 0.867 | 0.563 | 0.655 | 1.725 | 0.557 | 0.871 | 0.567 | 0.651 | 1.706 | 0.549 |
| ML-Net (Cornia et al., 2016) | 0.853 | 0.579 | 0.655 | 2.141 | 0.569 | 0.856 | 0.586 | 0.642 | 1.943 | 0.506 | 0.877 | 0.590 | 0.728 | 2.259 | 0.561 |
| SAM-VGG (Cornia et al., 2018) | 0.892 | 0.555 | 0.846 | 2.412 | 0.716 | 0.881 | 0.580 | 0.747 | 2.102 | 0.635 | 0.897 | 0.577 | 0.840 | 2.362 | 0.690 |
| SalGAN (Pan et al., 2017) | 0.887 | 0.573 | 0.765 | 2.111 | 0.662 | 0.881 | 0.580 | 0.751 | 2.068 | 0.636 | 0.891 | 0.585 | 0.782 | 2.150 | 0.658 |
| GazeGAN (Che et al., 2020) | 0.887 | 0.548 | 0.809 | 2.219 | 0.661 | 0.882 | 0.576 | 0.741 | 2.058 | 0.631 | 0.894 | 0.571 | 0.804 | 2.214 | 0.669 |
| VQSal (Ours) | 0.899 | 0.576 | 0.873 | 2.606 | 0.741 | 0.885 | 0.587 | 0.747 | 2.120 | 0.644 | 0.900 | 0.597 | 0.840 | 2.419 | 0.697 |
| VQSal-AR (Ours) | - | - | - | - | - | - | - | - | - | - | 0.903 | 0.591 | 0.893 | 2.687 | 0.758 |
4.3. VQSal for AR Saliency Prediction
In AR saliency prediction task, three types of images including the AR image, BG image, and superimposed image can be obtained or calculated from a scenario (see Sec. 3.1 & 3.2), and all these three components significantly influence visual attention in AR (see Sec. 3.3, the superimposed image contains mixing value information). Therefore, a multi-decoder fusion network based on the VQSal model is further proposed to integrate AR image information, BG image information, and superimposed image information for AR saliency prediction. Figure 7 shows the overview of this VQSal-AR model. Specifically, three images are first fed into the feature extraction and quantization modules to get visual tokens for them, respectively:
| (8) |
where are input images, and are obtained visual tokens. These visual tokens are then fed into multi-decoders and finally integrated to produce the salieny map as follows:
| (9) |
where are three decoders, is the final convolution integration, is the predicted AR saliency map.
5. Experiments
5.1. Benchmark Methodology
Although AR images, BG images, and mixing values jointly and significantly influence the visual attention in AR (see Sec. 3.3), whether saliency models should consider all these parameters as input and how to calculate AR saliency accordingly still need to be discussed. Given an AR image , a BG image , and a mixing value , the superimposed perceptual viewport image can be calculated via Eq. (1). To get the AR saliency map , three benchmark methods for a given saliency model are defined as:
(i) Type I: only using , which is formulated as:
| (10) |
(ii) Type II: using , , and , which is formulated as:
| (11) |
(iii) Type III: using , , and , which is formulated as:
| (12) |
For classical saliency models, they are directly calculated on the corresponding images. For DNN models, they are retrained on SALICON (Jiang et al., 2015) first. Then for and , these DNN models are directly calculated on these images using pretrained weights to get and , and for , they are finetuned and calculated on our dataset using the protocol in Sec. 5.2 to get .
5.2. Experimental Results & Analysis
Experiments on SALICON (Jiang et al., 2015). We first conduct experiments on SALICON to validate the effectiveness of our VQSal model. SALICON (Jiang et al., 2015) is currently the largest saliency dataset with 10000, 5000, 5000 images for training, validation, and test, respectively. For fair comparison, six state-of-the-art saliency models including SALICON (Huang et al., 2015), ML-Net (Cornia et al., 2016), SAM-VGG (Cornia et al., 2018), SAM-ResNet (Cornia et al., 2018), SalGAN (Pan et al., 2017), GazeGAN (Che et al., 2020) are retrained on SALICON training set, and tested on SALICON validation set. Six widely used metrics including AUC, CC, IG, KL, NSS, SIM (Bylinskii et al., 2018) are used to compare the performance of these six models with our proposed VQSal model. Table 1 demonstrates that our VQSal model achieves state-of-the-art performance compared to other models among all six metrics.
Experiments on our SARD. We further conduct experiments on our SARD to validate the effectiveness and superiority of our VQSal and VQSal-AR models on the AR saliency prediction task. The benchmark study is first conducted among 13 classical saliency models including IT (Itti et al., 1998), AIM (Bruce and Tsotsos, 2005), GBVS (Harel et al., 2006), SR (Hou and Zhang, 2007), SUN (Zhang et al., 2008), PFT (Guo et al., 2008), SMVJ (Cerf et al., 2007), Judd (Judd et al., 2009), SWD (Duan et al., 2011), Murray (Murray et al., 2011), CA (Goferman et al., 2011), CovSal (Erdem and Erdem, 2013), HFT (Li et al., 2012), and 6 DNN saliency models including SALICON (Huang et al., 2015), ML-Net (Cornia et al., 2016), SAM-VGG (Cornia et al., 2018), SalGAN (Pan et al., 2017), GazeGAN (Che et al., 2020), as well as our VQSal model. Five widely used metrics including AUC, sAUC, CC, NSS, SIM (Bylinskii et al., 2018) are used to compare the performance of these baseline models with our proposed VQSal-AR model. For learning-based methods (i.e., SVR and DNN models), we divide the SARD into 5 splits with an equal number of three stimulus categories in each split and without scenario repeat. Then we run a 5-folds cross validation experiment with 4 splits for training and 1 split for testing in each validation fold. This 5-folds experiment can cover the whole dataset and get the prediction results for all images. Moreover, all DNN models are pretrained on SALICON (Jiang et al., 2015) first and then finetuned on our SARD.
Table 2 demonstrates the quantitative results of three types of benchmark methods and our VQSal-AR model. For classical models, Type II and Type III models generally perform better than Type I models. Comparing the Type II and Type III for classical models, for certain models, Type III method performs better, while for other models, Type II method is more efficient. For DNN models, Type I and Type III models generally perform better than Type II models. The reason may be that the Type I method is finetuned on our dataset and the Type III method includes the Type I saliency map as one input feature. Comparing the Type I and Type III for deep models, we find that for most saliency models, Type III performs better in terms of AUC and sAUC, while for other three evaluation metrics, both methods have their advantages. Moreover, our VQSal models achieves state-of-the-art performance for all three types of benchmark methods, and our VQSal-AR model performs much better compared to all other methods in terms of almost all metrics. Figure 8 also demonstrates the superiority of our VQSal-AR model.
5.3. Ablation Analysis
Ablation for VQSal. We first conduct an ablation study for the VQSal model and demonstrate the results as follows.
| Model Metric | AUC | CC | IG | KL | NSS | SIM |
|---|---|---|---|---|---|---|
| w/o pretraining | 0.792 | 0.606 | 34.16 | 6.147 | 1.155 | 0.594 |
| w/o | 0.837 | 0.744 | 34.46 | 5.935 | 1.432 | 0.699 |
| w/o | 0.854 | 0.854 | 34.28 | 6.067 | 1.839 | 0.744 |
| VQSal (all combined) | 0.863 | 0.869 | 35.18 | 5.434 | 1.863 | 0.766 |
We first observe the significant performance drop without the vector quantized pretraining on ImageNet, which manifests that learning a perceptually rich codebook is important for transfer learning on saliency prediction to work. Moreover, we also see that both of the and losses have significant improvement for our VQSal.
Ablation for VQSal-AR. First of all, comparing the results of the Type I method for VQSal and the VQSal-AR as shown in Table 2, we observe that our VQSal-AR strategy can significantly improve the performance on the AR saliency prediction task. We further show the effect of the SALICON dataset pretraining on our VQSal-AR model as follows (note that the pretrained weights of all three decoders in VQSal-AR are obtained from the pretrained decoder in VQSal, which is pretrained on SALICON).
| Model Metric | AUC | sAUC | CC | NSS | SIM |
|---|---|---|---|---|---|
| w/o pretraining on SALICON | 0.895 | 0.583 | 0.853 | 2.587 | 0.719 |
| VQSal-AR | 0.903 | 0.591 | 0.893 | 2.687 | 0.758 |
We see a significant performance drop for our VQSal-AR model if without pretraining on SALICON, thus as mentioned in Sec. 5.2, all DNN models are pretrained on SALICON and then finetuned on our dataset to get the results in Table 2 for fair comparison.
6. Conclusion
Visual attention analysis and prediction are important tasks for multimedia systems. In this paper, we mainly study human visual attention behavior in AR and its related saliency prediction task. We first construct a saliency in AR dataset (SARD), which contains 1350 superimposed images covering 450 AR/BG scenario pairs, and a large-scale eye-tracking experiment among 60 subjects is also conducted. Through qualitative and quantitative analysis, we conclude that visual attention in AR environment is jointly and significantly influenced by the AR contents, BG scenes and mixing values. For better predicting saliency in AR, we propose a general saliency prediction model VQSal and generalize it to the model VQSal-AR for AR application. Three benchmark methods are proposed and evaluated on our SARD, and our proposed VQSal-AR achieves state-of-the-art performance compared to these methods.
Our work considers the basic image saliency prediction task while real application scenarios are closer to the video saliency detection task due to head movements. Our future works will extend this study and focus on predicting augmented video saliency.
References
- (1)
- Borji (2019) Ali Borji. 2019. Saliency prediction in the deep learning era: Successes and limitations. IEEE Transactions on Pattern Analysis and Machine Intelligence (TPAMI) 43, 2 (2019), 679–700.
- Bruce and Tsotsos (2005) Neil Bruce and John Tsotsos. 2005. Saliency based on information maximization. Proceedings of the Advances in Neural Information Processing Systems (NeurIPS) 18 (2005).
- Bundesen et al. (2015) Claus Bundesen, Signe Vangkilde, and Anders Petersen. 2015. Recent developments in a computational theory of visual attention (TVA). Vision research 116 (2015), 210–218.
- Bylinskii et al. (2015) Zoya Bylinskii, Tilke Judd, Ali Borji, Laurent Itti, Frédo Durand, Aude Oliva, and Antonio Torralba. 2015. Mit saliency benchmark. (2015).
- Bylinskii et al. (2018) Zoya Bylinskii, Tilke Judd, Aude Oliva, Antonio Torralba, and Frédo Durand. 2018. What do different evaluation metrics tell us about saliency models? IEEE Transactions on Pattern Analysis and Machine Intelligence (TPAMI) 41, 3 (2018), 740–757.
- Cakmakci and Rolland (2006) Ozan Cakmakci and Jannick Rolland. 2006. Head-worn displays: a review. Journal of display technology 2, 3 (2006), 199–216.
- Carmigniani et al. (2011) Julie Carmigniani, Borko Furht, Marco Anisetti, Paolo Ceravolo, Ernesto Damiani, and Misa Ivkovic. 2011. Augmented reality technologies, systems and applications. Multimedia tools and applications 51, 1 (2011), 341–377.
- Cerf et al. (2007) Moran Cerf, Jonathan Harel, Wolfgang Einhäuser, and Christof Koch. 2007. Predicting human gaze using low-level saliency combined with face detection. Proceedings of the Advances in Neural Information Processing Systems (NeurIPS) 20 (2007).
- Che et al. (2020) Zhaohui Che, Ali Borji, Guangtao Zhai, Xiongkuo Min, Guodong Guo, and Patrick Le Callet. 2020. How is gaze influenced by image transformations? dataset and model. IEEE Transactions on Image Processing (TIP) 29 (2020), 2287–2300.
- Cornia et al. (2016) Marcella Cornia, Lorenzo Baraldi, Giuseppe Serra, and Rita Cucchiara. 2016. A deep multi-level network for saliency prediction. In Proceedings of the IEEE International Conference on Pattern Recognition (ICPR). 3488–3493.
- Cornia et al. (2018) Marcella Cornia, Lorenzo Baraldi, Giuseppe Serra, and Rita Cucchiara. 2018. Predicting human eye fixations via an lstm-based saliency attentive model. IEEE Transactions on Image Processing (TIP) 27, 10 (2018), 5142–5154.
- David et al. (2018) Erwan J David, Jesús Gutiérrez, Antoine Coutrot, Matthieu Perreira Da Silva, and Patrick Le Callet. 2018. A dataset of head and eye movements for 360 videos. In Proceedings of the ACM Multimedia Systems Conference. 432–437.
- Deng et al. (2009) Jia Deng, Wei Dong, Richard Socher, Li-Jia Li, Kai Li, and Li Fei-Fei. 2009. Imagenet: A large-scale hierarchical image database. In Proceedings of the IEEE Conference on Computer Vision and Pattern Recognition (CVPR). 248–255.
- Duan et al. (2022a) Huiyu Duan, Xiongkuo Min, Wei Shen, and Guangtao Zhai. 2022a. A Unified Two-Stage Model for Separating Superimposed Images. In Proceedings of the IEEE International Conference on Acoustics, Speech and Signal Processing (ICASSP). 2065–2069.
- Duan et al. (2022b) Huiyu Duan, Xiongkuo Min, Yucheng Zhu, Guangtao Zhai, Xiaokang Yang, and Patrick Le Callet. 2022b. Confusing Image Quality Assessment: Towards Better Augmented Reality Experience. arXiv:2204.04900
- Duan et al. (2022c) Huiyu Duan, Wei Shen, Xiongkuo Min, Yuan Tian, Jae-Hyun Jung, Xiaokang Yang, and Guangtao Zhai. 2022c. Develop then Rival: A Human Vision-Inspired Framework for Superimposed Image Decomposition. IEEE Transactions on Multimedia (TMM) (2022).
- Duan et al. (2018) Huiyu Duan, Guangtao Zhai, Xiongkuo Min, Yucheng Zhu, Yi Fang, and Xiaokang Yang. 2018. Perceptual Quality Assessment of Omnidirectional Images. In Proceedings of the IEEE International Symposium on Circuits and Systems (ISCAS). 1–5.
- Duan et al. (2017) Huiyu Duan, Guangtao Zhai, Xiaokang Yang, Duo Li, and Wenhan Zhu. 2017. IVQAD 2017: An immersive video quality assessment database. In Proceedings of the IEEE International Conference on Systems, Signals and Image Processing (IWSSIP). 1–5.
- Duan et al. (2011) Lijuan Duan, Chunpeng Wu, Jun Miao, Laiyun Qing, and Yu Fu. 2011. Visual saliency detection by spatially weighted dissimilarity. In Proceedings of the IEEE Conference on Computer Vision and Pattern Recognition (CVPR). 473–480.
- EPSON (2022) EPSON. 2022. EPSON AR. https://epson.com/moverio-augmented-reality.
- Erdem and Erdem (2013) Erkut Erdem and Aykut Erdem. 2013. Visual saliency estimation by nonlinearly integrating features using region covariances. Journal of vision 13, 4 (2013), 11–11.
- Esser et al. (2021) Patrick Esser, Robin Rombach, and Bjorn Ommer. 2021. Taming transformers for high-resolution image synthesis. In Proceedings of the IEEE Conference on Computer Vision and Pattern Recognition (CVPR). 12873–12883.
- Goferman et al. (2011) Stas Goferman, Lihi Zelnik-Manor, and Ayellet Tal. 2011. Context-aware saliency detection. IEEE Transactions on Pattern Analysis and Machine Intelligence (TPAMI) 34, 10 (2011), 1915–1926.
- Google (2022) Google. 2022. Google Glass. https://www.google.com/glass.
- Grauman et al. (2021) Kristen Grauman, Andrew Westbury, Eugene Byrne, Zachary Chavis, Antonino Furnari, Rohit Girdhar, Jackson Hamburger, Hao Jiang, Miao Liu, Xingyu Liu, et al. 2021. Ego4d: Around the world in 3,000 hours of egocentric video. arXiv:2110.07058
- Guo et al. (2008) Chenlei Guo, Qi Ma, and Liming Zhang. 2008. Spatio-temporal saliency detection using phase spectrum of quaternion fourier transform. In Proceedings of the IEEE Conference on Computer Vision and Pattern Recognition (CVPR). 1–8.
- Harel et al. (2006) Jonathan Harel, Christof Koch, and Pietro Perona. 2006. Graph-based visual saliency. Proceedings of the Advances in Neural Information Processing Systems (NeurIPS) 19 (2006).
- Haskins et al. (2020) Amanda J Haskins, Jeff Mentch, Thomas L Botch, and Caroline E Robertson. 2020. Active vision in immersive, 360 real-world environments. Nature Scientific Reports 10, 1 (2020), 1–11.
- Hou and Zhang (2007) Xiaodi Hou and Liqing Zhang. 2007. Saliency detection: A spectral residual approach. In Proceedings of the IEEE Conference on Computer Vision and Pattern Recognition (CVPR). 1–8.
- HTC (2022) HTC. 2022. HTC VIVE Pro Eye. https://www.vive.com/us/product/vive-pro-eye/overview/.
- Huang et al. (2015) Xun Huang, Chengyao Shen, Xavier Boix, and Qi Zhao. 2015. Salicon: Reducing the semantic gap in saliency prediction by adapting deep neural networks. In Proceedings of the IEEE International Conference on Computer Vision (ICCV). 262–270.
- Itti et al. (1998) Laurent Itti, Christof Koch, and Ernst Niebur. 1998. A model of saliency-based visual attention for rapid scene analysis. IEEE Transactions on Pattern Analysis and Machine Intelligence (TPAMI) 20, 11 (1998), 1254–1259.
- Jiang et al. (2015) Ming Jiang, Shengsheng Huang, Juanyong Duan, and Qi Zhao. 2015. Salicon: Saliency in context. In Proceedings of the IEEE Conference on Computer Vision and Pattern Recognition (CVPR). 1072–1080.
- Johnson et al. (2016) Justin Johnson, Alexandre Alahi, and Li Fei-Fei. 2016. Perceptual losses for real-time style transfer and super-resolution. In Proceedings of the European Conference on Computer Vision (ECCV). 694–711.
- Judd et al. (2009) Tilke Judd, Krista Ehinger, Frédo Durand, and Antonio Torralba. 2009. Learning to predict where humans look. In Proceedings of the IEEE International Conference on Computer Vision (ICCV). 2106–2113.
- Kruijff et al. (2010) Ernst Kruijff, J Edward Swan, and Steven Feiner. 2010. Perceptual issues in augmented reality revisited. In Proceedings of the IEEE International Symposium on Mixed and Augmented Reality. 3–12.
- Kruthiventi et al. (2017) Srinivas SS Kruthiventi, Kumar Ayush, and R Venkatesh Babu. 2017. Deepfix: A fully convolutional neural network for predicting human eye fixations. IEEE Transactions on Image Processing (TIP) 26, 9 (2017), 4446–4456.
- Leap (2022) Magic Leap. 2022. Magic Leap. https://www.magicleap.com.
- Li et al. (2012) Jian Li, Martin D Levine, Xiangjing An, Xin Xu, and Hangen He. 2012. Visual saliency based on scale-space analysis in the frequency domain. IEEE Transactions on Pattern Analysis and Machine Intelligence (TPAMI) 35, 4 (2012), 996–1010.
- Liang and Hu (2015) Ming Liang and Xiaolin Hu. 2015. Predicting eye fixations with higher-level visual features. IEEE Transactions on Image Processing (TIP) 24, 3 (2015), 1178–1189.
- Mack (2003) Arien Mack. 2003. Inattentional blindness: Looking without seeing. Current directions in psychological science 12, 5 (2003), 180–184.
- Marois and Ivanoff (2005) René Marois and Jason Ivanoff. 2005. Capacity limits of information processing in the brain. Trends in cognitive sciences 9, 6 (2005), 296–305.
- Microsof (2022) Microsof. 2022. HoloLens. https://www.microsoft.com/hololens.
- Murray et al. (2011) Naila Murray, Maria Vanrell, Xavier Otazu, and C Alejandro Parraga. 2011. Saliency estimation using a non-parametric low-level vision model. In Proceedings of the IEEE Conference on Computer Vision and Pattern Recognition (CVPR). 433–440.
- O’Shea et al. (2009) Robert P O’Shea, Amanda Parker, David La Rooy, and David Alais. 2009. Monocular rivalry exhibits three hallmarks of binocular rivalry: Evidence for common processes. Vision research 49, 7 (2009), 671–681.
- Pan et al. (2017) Junting Pan, Cristian Canton Ferrer, Kevin McGuinness, Noel E O’Connor, Jordi Torres, Elisa Sayrol, and Xavier Giro-i Nieto. 2017. Salgan: Visual saliency prediction with generative adversarial networks. arXiv:1701.01081
- Peli and Jung (2017) Eli Peli and Jae-Hyun Jung. 2017. Multiplexing prisms for field expansion. Optometry and vision science: official publication of the American Academy of Optometry 94, 8 (2017), 817.
- Peterson et al. (2016) Matthew F Peterson, Jing Lin, Ian Zaun, and Nancy Kanwisher. 2016. Individual differences in face-looking behavior generalize from the lab to the world. Journal of Vision (JoV) 16, 7 (2016), 12–12.
- Rai et al. (2017) Yashas Rai, Jesús Gutiérrez, and Patrick Le Callet. 2017. A dataset of head and eye movements for 360 degree images. In Proceedings of the ACM on Multimedia Systems Conference. 205–210.
- Tu et al. (2022) Danyang Tu, Xiongkuo Min, Huiyu Duan, Guodong Guo, Guangtao Zhai, and Wei Shen. 2022. End-to-End Human-Gaze-Target Detection With Transformers. In Proceedings of the IEEE Conference on Computer Vision and Pattern Recognition (CVPR). 2202–2210.
- Unity (2022) Unity. 2022. Unity. https://unity.com/.
- van den Oord et al. (2017) Aäron van den Oord, Oriol Vinyals, and Koray Kavukcuoglu. 2017. Neural Discrete Representation Learning. In Proceedings of the NeurIPS.
- Vig et al. (2014) Eleonora Vig, Michael Dorr, and David Cox. 2014. Large-scale optimization of hierarchical features for saliency prediction in natural images. In Proceedings of the IEEE Conference on Computer Vision and Pattern Recognition (CVPR). 2798–2805.
- Voloh et al. (2019) Benjamin Voloh, Marcus Watson, Seth König, and Thilo Womelsdorf. 2019. MAD saccade: statistically robust saccade threshold estimation. (2019).
- Wang et al. (2015) Lijun Wang, Huchuan Lu, Xiang Ruan, and Ming-Hsuan Yang. 2015. Deep networks for saliency detection via local estimation and global search. In Proceedings of the IEEE Conference on Computer Vision and Pattern Recognition (CVPR). 3183–3192.
- Wang et al. (2016) Linzhao Wang, Lijun Wang, Huchuan Lu, Pingping Zhang, and Xiang Ruan. 2016. Saliency detection with recurrent fully convolutional networks. In Proceedings of the European Conference on Computer Vision (ECCV). 825–841.
- Wang et al. (2021) Yuwei Wang, Yimin Wu, Cheng Chen, Bohan Wu, Shu Ma, Duming Wang, Hongting Li, and Zhen Yang. 2021. Inattentional Blindness in Augmented Reality Head-Up Display-Assisted Driving. International Journal of Human–Computer Interaction (2021), 1–14.
- Wass et al. (2013) Sam V Wass, Tim J Smith, and Mark H Johnson. 2013. Parsing eye-tracking data of variable quality to provide accurate fixation duration estimates in infants and adults. Behavior Research Methods 45, 1 (2013), 229–250.
- Woods et al. (2010) Russell L Woods, Robert G Giorgi, Eliot L Berson, and Eli Peli. 2010. Extended wearing trial of Trifield lens device for ‘tunnel vision’. Ophthalmic and physiological optics 30, 3 (2010), 240–252.
- Xu et al. (2021) Mai Xu, Li Yang, Xiaoming Tao, Yiping Duan, and Zulin Wang. 2021. Saliency prediction on omnidirectional image with generative adversarial imitation learning. IEEE Transactions on Image Processing (TIP) 30 (2021), 2087–2102.
- Zhan et al. (2020) Tao Zhan, Kun Yin, Jianghao Xiong, Ziqian He, and Shin-Tson Wu. 2020. Augmented reality and virtual reality displays: Perspectives and challenges. Iscience (2020), 101397.
- Zhang et al. (2008) Lingyun Zhang, Matthew H Tong, Tim K Marks, Honghao Shan, and Garrison W Cottrell. 2008. SUN: A Bayesian framework for saliency using natural statistics. Journal of vision 8, 7 (2008), 32–32.
- Zhang et al. (2017) Mengmi Zhang, Keng Teck Ma, Joo Hwee Lim, Qi Zhao, and Jiashi Feng. 2017. Deep future gaze: Gaze anticipation on egocentric videos using adversarial networks. In Proceedings of the IEEE Conference on Computer Vision and Pattern Recognition (CVPR). 4372–4381.
- Zhang et al. (2018a) Richard Zhang, Phillip Isola, Alexei A Efros, Eli Shechtman, and Oliver Wang. 2018a. The unreasonable effectiveness of deep features as a perceptual metric. In Proceedings of the IEEE Conference on Computer Vision and Pattern Recognition (CVPR). 586–595.
- Zhang et al. (2021) Xue Zhang, Gene Cheung, Yao Zhao, Patrick Le Callet, Chunyu Lin, and Jack ZG Tan. 2021. Graph learning based head movement prediction for interactive 360 video streaming. IEEE Transactions on Image Processing (TIP) 30 (2021), 4622–4636.
- Zhang et al. (2018b) Ziheng Zhang, Yanyu Xu, Jingyi Yu, and Shenghua Gao. 2018b. Saliency detection in 360 videos. In Proceedings of the European Conference on Computer Vision (ECCV). 488–503.
- Zhu et al. (2021) Yucheng Zhu, Guangtao Zhai, Yiwei Yang, Huiyu Duan, Xiongkuo Min, and Xiaokang Yang. 2021. Viewing behavior supported visual saliency predictor for 360 degree videos. IEEE Transactions on Circuits and Systems for Video Technology (TCSVT) (2021).
- Zhu et al. (2019) Yucheng Zhu, Dandan Zhu, Yiwei Yang, Huiyu Duan, Qiangqiang Zhou, Xiongkuo Min, Jiantao Zhou, Guangtao Zhai, and Xiaokang Yang. 2019. A saliency dataset of head and eye movements for augmented reality. arXiv (2019).