11email: eduardo.mericia@inpe.br 22institutetext: Center for Gravitation and Cosmology, YangZhou University, Yangzhou 224009, China
22email: larissa@yzu.edu.cn 33institutetext: CNRS-UCB International Research Laboratory, Centre Pierre Binétruy, IRL2007, CPB-IN2P3, Berkeley, CA 94720, USA 44institutetext: Instituto de Física de Cantabria (CSIC-UC), Avenida de los Castros s/n, 39005 Santander, Spain 55institutetext: Instituto de Física, Universidade de São Paulo, R. do Matão, 1371 - Butantã, 05508-09 - São Paulo, SP, Brazil 66institutetext: University College London, Gower Street, London, WC1E 6BT, UK 77institutetext: Department of Physics and Electronics, Rhodes University, PO Box 94, Grahamstown, 6140, South Africa 88institutetext: Department of Astronomy, School of Physical Sciences, University of Science and Technology of China, Hefei, Anhui 230026, China 99institutetext: CAS Key Laboratory for Research in Galaxies and Cosmology, University of Science and Technology of China, Hefei, Anhui 230026, China 1010institutetext: School of Astronomy and Space Science, University of Science and Technology of China, Hefei, Anhui 230026, China 1111institutetext: Unidade Acadêmica de Física, Universidade Federal de Campina Grande, R. Aprígio Veloso, Bodocongó, 58429-900 - Campina Grande, PB, Brazil 1212institutetext: Centro de Gestão e Estudos Estratégicos SCS Qd 9, Lote C, Torre C S/N Salas 401 a 405, 70308-200 - Brasília, DF, Brazil 1313institutetext: Instituto de Física, Universidade de Brasília, Campus Universitário Darcy Ribeiro, 70910-900 - Brasília, DF, Brazil 1414institutetext: School of Aeronautics and Astronautics, Shanghai Jiao Tong University, Shanghai 200240, China 1515institutetext: Shanghai Astronomical Observatory, Chinese Academy of Sciences, Shanghai 200030, China 1616institutetext: Kavli Institute for the Physics and Mathematics of the Universe (KIPMU), University of Tokyo, 5-1-5 Kashiwa-no-Ha, Kashiwa Shi, Chiba 277-8568, Kashiwa-shi, Japan 1717institutetext: Technische Universität München, Physik-Department T70, James-Franck-Strasse 1, 85748, Garching, Germany
Testing synchrotron models and frequency resolution in BINGO 21 cm simulated maps using GNILC
Abstract
Context. The 21 cm hydrogen line is arguably one of the most powerful probes to explore the Universe, from recombination to the present times. To recover it, it is essential to separate the cosmological signal from the much stronger foreground contributions at radio frequencies. The Baryon Acoustic Oscillations from Integrated Neutral Gas Observations – BINGO radio telescope is designed to measure the 21 cm line and detect baryon acoustic oscillations (BAOs) using the intensity mapping technique.
Aims. This work analyses the performance of the Generalized Needlet Internal Linear Combination (GNILC) method, combined with a power spectrum debiasing procedure. The method was applied to a simulated BINGO mission, building upon previous work from the collaboration. It compares two different synchrotron emission models and different instrumental configurations, in addition to the combination with ancillary data to optimize both the foreground removal and recovery of the 21 cm signal across the full BINGO frequency band, as well as to determine an optimal number of frequency (redshift) bands for the signal recovery.
Methods. We have produced foreground emissions maps using the Planck Sky Model (PSM), the cosmological Hi emission maps are generated using the Full-Sky Log-normal Astro-Fields simulation Kit (FLASK) package and thermal noise maps are created according to the instrumental setup. We apply the GNILC method to the simulated sky maps to separate the Hi plus thermal noise contribution and, through a debiasing procedure, recover an estimate of the noiseless 21 cm power spectrum.
Results. We found a near optimal reconstruction of the Hi signal using a 80 bins configuration, which resulted in a power spectrum reconstruction average error over all frequencies of 3%. Furthermore, our tests showed that GNILC is robust against different synchrotron emission models. Finally, adding an extra channel with CBASS foregrounds information, we reduced the estimation error of the 21 cm signal.
Conclusions. The optimisation of our previous work, producing a configuration with an optimal number of channels for binning the data, impacts greatly the decisions regarding BINGO hardware configuration before commissioning. We were able to recover the Hi signal with good efficiency in the harmonic space, but have yet to investigate the effect of noise in the data, which will possibly impact the recovery of the Hi signal. This issue will be addressed in a forthcoming work.
Key Words.:
21 cm cosmology – baryon acoustic oscillations – radio astronomy – BINGO Telescope – component separation1 Introduction
Recently, it has been possible to study the creation and evolution of the Universe through various different cosmological experiments, shifting cosmology from a mere intellectual speculation to the prestigious nickname “precision cosmology”. Despite the sucessful endeavour of creating a cosmological model that matches most of the current observational challenges and constrain the cosmological parameter values precision, some aspects of the so-called “concordance model” need a much deeper investigation. Among them, the nature of the Dark Sector (dark matter and dark energy), which comprise about of the present composition of the Universe is among the most interesting open problems in modern astrophysics and cosmology.
The Baryon Acoustic Oscillations from Integrated Neutral Gas Observations – BINGO – telescope, a unique instrument designed to be one of the first radiotelescopes to measure Baryon Acoustic Oscillations (BAOs) in the radio band, may unveil more details about the late evolution of the universe (Abdalla et al. 2021a).
BINGO will detect the integrated signal of the cosmological neutral hydrogen (Hi signal) hyperfine transition at 1420 MHz (21 cm) frequency in redshift interval , corresponding to a redshifted frequency interval MHz. This survey will be conducted using a novel technique known as intensity mapping (IM) (Peterson et al. 2006). It allows the flux measurement of the signal produced by all Hi atoms, over large areas of the sky. Combined with the radial dimension offered by the observational frequency band, IM can produce very large surveys, covering a significant fraction of the cosmological volume. Cosmological Hi datacubes can be used to probe the Universe at lower redshifts, complementing the cosmological information obtained by CMB temperature and polarization, weak lensing and SN Ia data.
Nevertheless, the very faint radio signal from the 21 cm transition is easily covered by the much stronger foreground emission, mainly the Galactic diffuse component, constituted by synchrotron and free-free emissions, as well as extragalactic contribution from unresolved radio sources and CMB. Mitigating the foreground contamination to the detected signal is essential to recover the cosmological 21 cm information from the incoming data.
Various methods to separate the astrophysical foreground components from the targeted cosmological signal are available in the literature, and most of them were already tested in the battlefield of CMB data analysis. A good component separation method greatly contributes to the accurate reconstruction of the 21 cm signal. On the one side, it works towards leaving the foreground contamination in the data to a minimum and, on the other side, prevents the loss of portions of the 21 cm data. An efficient component separation method (or a combination of complementary methods) reduces the uncertainties arising during the separation process and their propagation into the 21 cm signal power spectrum, avoiding introducing some bias in the estimation of cosmological parameters.
Some of these methods assume prior knowledge of some foreground properties. Wiener Filtering (Bunn et al. 1994; Tegmark & Efstathiou 1996), for instance, assumes prior information on the frequency dependence of the foreground emission and of the power spectra of the components of sky emission (Delabrouille & Cardoso 2009). Other approaches, such as the Gibbs sampling approaches, assume a parametric model for the emission laws of the sky components (Jewell et al. 2004; Wandelt et al. 2004; Eriksen et al. 2004; Larson et al. 2007; Eriksen et al. 2008), and fit for the parameters and the amplitude of the various components in each sky pixel. These methods are considered to be “non blind” since they rely on prior information about the foregrounds that may not be very well understood.
Alternatively, the so-called “blind” approaches separate components of various physical origins in multi-frequency observations, relying only on their statistical independence. These methods include the Independent Component Analysis (ICA) (Baccigalupi et al. 2004), which maximizes some measures of the non-gaussianity of independent sources. Examples are FastICA, first used for foreground removal in CMB datasets (Maino et al. 2002, 2003) and later applied to Hi mapping (Wolz et al. 2015); and the Spectral Matching Independent Component Analysis (SMICA) (Delabrouille et al. 2003; Patanchon et al. 2005; Betoule et al. 2009), which uses decorrelation to identify independent components.
The Internal Linear Combination (ILC), and its variants (Tegmark & Efstathiou 1996; Tegmark et al. 2003; Bennett et al. 2003; Eriksen et al. 2004; Saha et al. 2006; Delabrouille et al. 2009; Basak & Delabrouille 2012, 2013; Remazeilles et al. 2011b), are component separation techniques that have been extensively applied to CMB data analysis, in particular on WMAP and Planck survey data, to obtain foreground-cleaned CMB maps. This technique can be adapted to extract maps of other components, such as the 21 cm signal, using an extension called the Generalized Needlet ILC (Remazeilles et al. 2011a), which will be used in this work to separate the 21 cm signal from the foregrounds.
This work tests the performance of the GNILC method in recovering the Hi signal in the presence of the different synchrotron models and with different binning in the frequency channels. We present reconstructed Hi simulated maps and power spectra in the presence of a combination of various foregrounds and white noise.
The paper is organized as follows. In Section 2 we give a brief overview of the instrument. In Section 3, we present the cosmological signal, astrophysical foregrounds and instrumental noise models used in our analysis, with a complementary discussion of the masking process and the description of our simulation plan. Section 4 contains a brief description of GNILC, the foreground removal method used in this work. Section 5 describes the debiasing method used to correct the reconstructed power spectra. Then, in the Sections 6 and 7, we present the results and the conclusions of this work, respectively.
2 Instrument overview
The BINGO telescope is under construction in Paraiba, Brazil, and will be located at coordinates 7∘ 2′ 27.6′′ S; 38∘ 16′ 4.8′′ W. The site selection process is described in Peel et al. (2019). BINGO is designed to observe in a frequency interval between MHz, corresponding to a redshift interval . BINGO will operate as a transit instrument, covering an instantaneous -wide declination strip centered at . Its field of view will cover a wide declination strip, measured from center to center, with an angular resolution arcmin at the central frequency of the band (1120 MHz). This accounts for a daily sky coverage of square degrees. In this work, we consider for the entire BINGO frequency range.
The BINGO optics follows an off-axis crossed-Dragone configuration (Dragone 1978), with a primary, 40 m diameter paraboloid and a secondary 34 m diameter hyperboloid. The secondary dish illuminates a focal surface with 28 corrugated horns, each one feeding a polarizer coupled to two magic tees. The optics and the horn design and fabrication are described, respectively, in (Abdalla et al. 2021b; Wuensche et al. 2020). BINGO will operate with a full correlation receiver per horn, connecting two radiometer chains to each magic tee. Radiometers are expected to operate at a nominal system temperature K.
Referring to the discussion of Section 2 of Wuensche et al. (2021), after 1 year of observations at duty cycle, with 30 frequency (redshift) bins and HEALpix resolution (comparable to the nominal angular resolution of the telescope) BINGO should achieve an estimated sensitivity of 102 K.
3 Simulated data
This work builds upon and optimizes aspects of BINGO previous analyses. We use a simulated data set similar to the one described in Fornazier et al. (2021), and extends that work using different synchrotron models and assessing the capability of clearly recovering the Hi signal as a function of the number of channels used in the reconstruction.
This choice allows us to assess the level of systematic differences introduced by our lack of knowledge on the foregrounds. It also introduces different samplings of the data and includes ancillary data from the CBASS experiment (Jones et al. 2018). We particularly find that this will greatly help our decision regarding the final binning of the data, itself impacting the hardware configuration required by BINGO.
All maps used in this work are generated with the HEALpix package (Górski et al. 2005) with . More details on the components included in the simulated data are found in Section 3.1 and on simulation sets in Section 3.3.
3.1 Cosmological, astrophysical and noise components
The Hi maps are generated using the Full-Sky Log-normal Astro-Fields Simulation Kit (FLASK) package (Xavier et al. 2016), using the s created by the Unified Cosmological Library for s (UCLCL) code (McLeod et al. 2017; Loureiro et al. 2019), and with a log-normal distribution with a very small deviation from a pure Gaussian. For more details on generating Hi maps using FLASK, see Liccardo et al. (2021).
The foreground simulations are generated using the Planck Sky Model (PSM) software (Delabrouille et al. 2013). The Galactic foregrounds are synchrotron radiation, free-free emission, the anomalous microwave emission (AME) and thermal dust (TD). The extragalactic contaminants include unresolved or faint radio point sources (FRPS) and the thermal and kinetic Sunyaev Zel’dovich (SZ) effects. Bright radio point sources are not considered, since they can be masked out during the analysis. For more details on foregrounds models, see Abdalla et al. (2021a), and generating their respective maps using PSM, see Fornazier et al. (2021).
To produce the synchrotron component, we used as template the reprocessed Haslam 408 MHz all sky map, presented in Remazeilles et al. (2015). This map is then extrapolated to the BINGO frequencies (980-1260 MHz) through a power law, given by
| (1) |
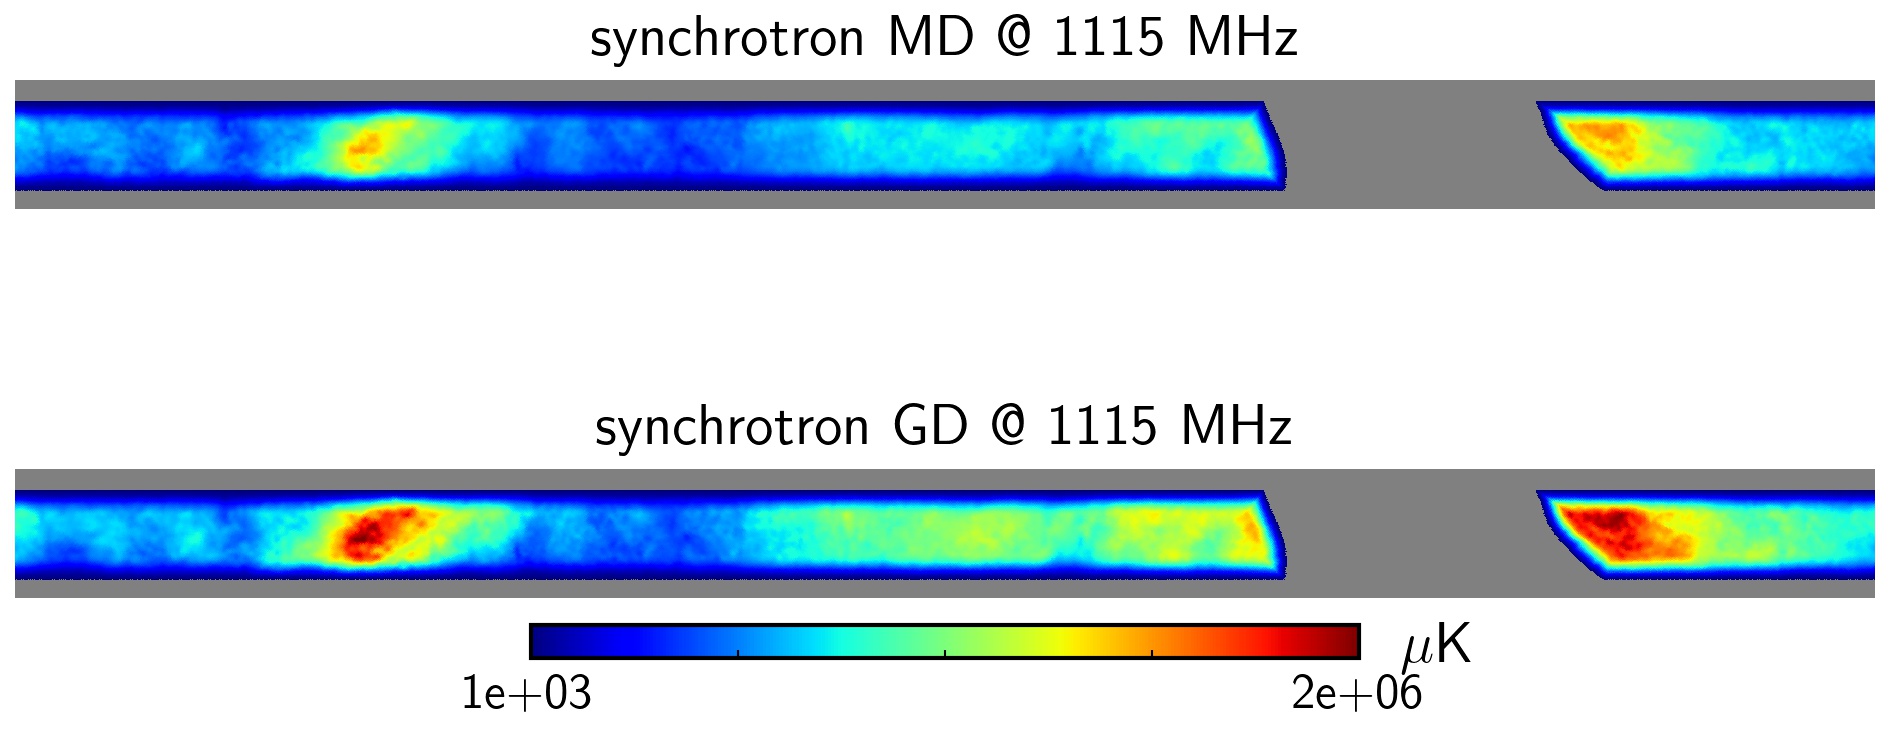
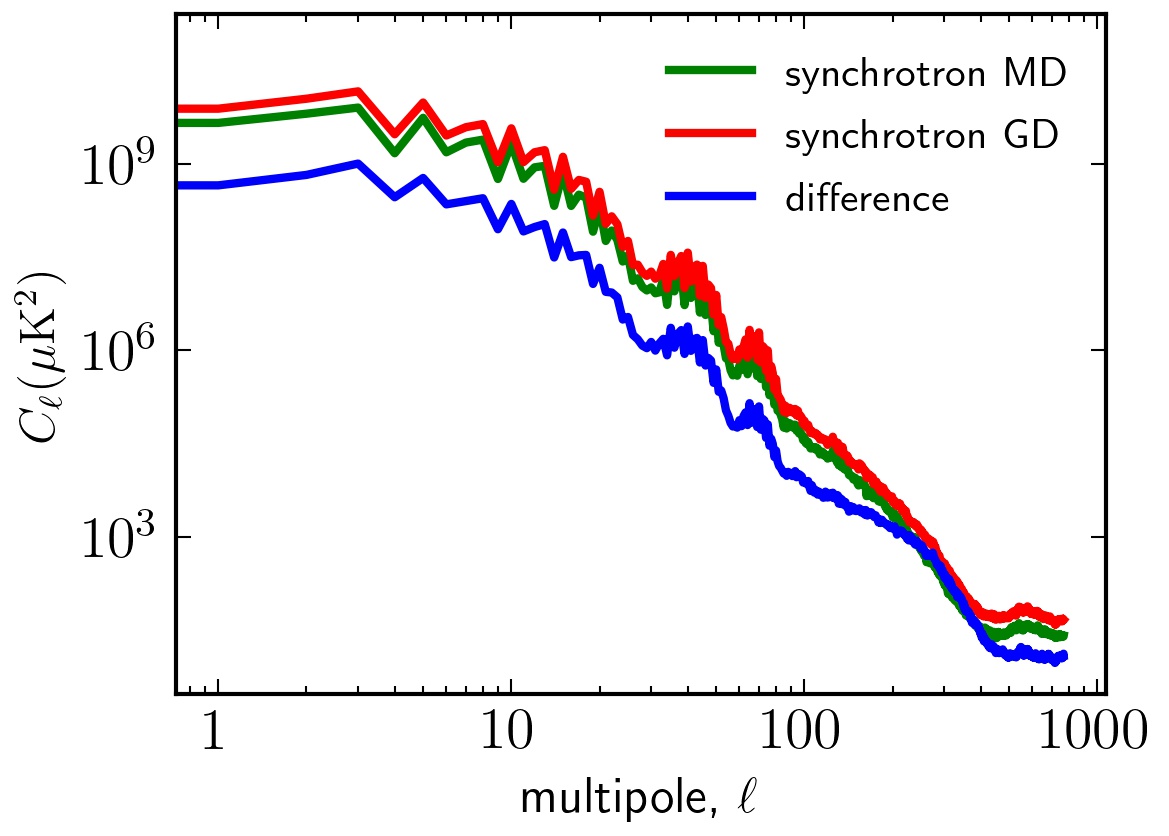
where is the template map, defined in the reference frequency and in the pixel ; is the spatially variable spectral index. In our simulations, we considered synchrotron maps produced with two models of non-uniform over the sky: the Miville-Deschênes et al. (2008) model (hereafter, synchrotron MD), which uses WMAP data at 23 GHz, and Giardino et al. (2002) model (hereafter, synchrotron GD), which is the result of the combination of the full-sky map of synchrotron emission at 408 MHz from Haslam et al. (1982), the northern-hemisphere map at 1420 MHz from Reich & Reich (1986) and the southern-hemisphere map at 2326 MHz from Jonas et al. (1998). The spectral index map of the synchrotron MD model has a mean value of -3.00 and a standard deviation of 0.06. These values for the synchrotron GD model are -2.9 and 0.1. Figure 1 shows the synchrotron emission maps generated with the two pixel dependent spectral index models described above, and Figure 2 presents their respective power spectra.
Although the thermal emission from dust grains is subdominant in the BINGO frequency band, we chose to include this component in the data in order to obtain a simulated sky closer to reality. We use the Galactic dust emission maps and a corresponding model obtained from the Planck 2015 data release using the GNILC method (Planck Collaboration et al. 2016).
As instrumental systematics, we consider only the thermal (white) noise contribution over the sky, with an expected system temperature of 70 K. Due to the 28 horns arrangement in the BINGO focal plane (double rectangular scheme, see Wuensche et al. (2021)), the observation time is not uniformly distributed over the sky area covered by the instrument. In this case, each horn covers the pixels of a fixed-latitude ring. Therefore, the total observation time of a pixel and, consequently, the root mean square (RMS) value of thermal noise per pixel depends on the latitude. Strong inhomogeneities in the innermost part of the covered region are avoided by repositioning the horns every year of the mission, within a total of = 5 years, which achieves a better distribution of observation time over the pixel in the covered area (Liccardo et al. 2021). Furthermore, we assume that the noise level map is the same for all frequency channels.
The RMS properties of the noise simulations used int his work follow the prescriptions published in Fornazier et al. (2021).
3.2 The masking process
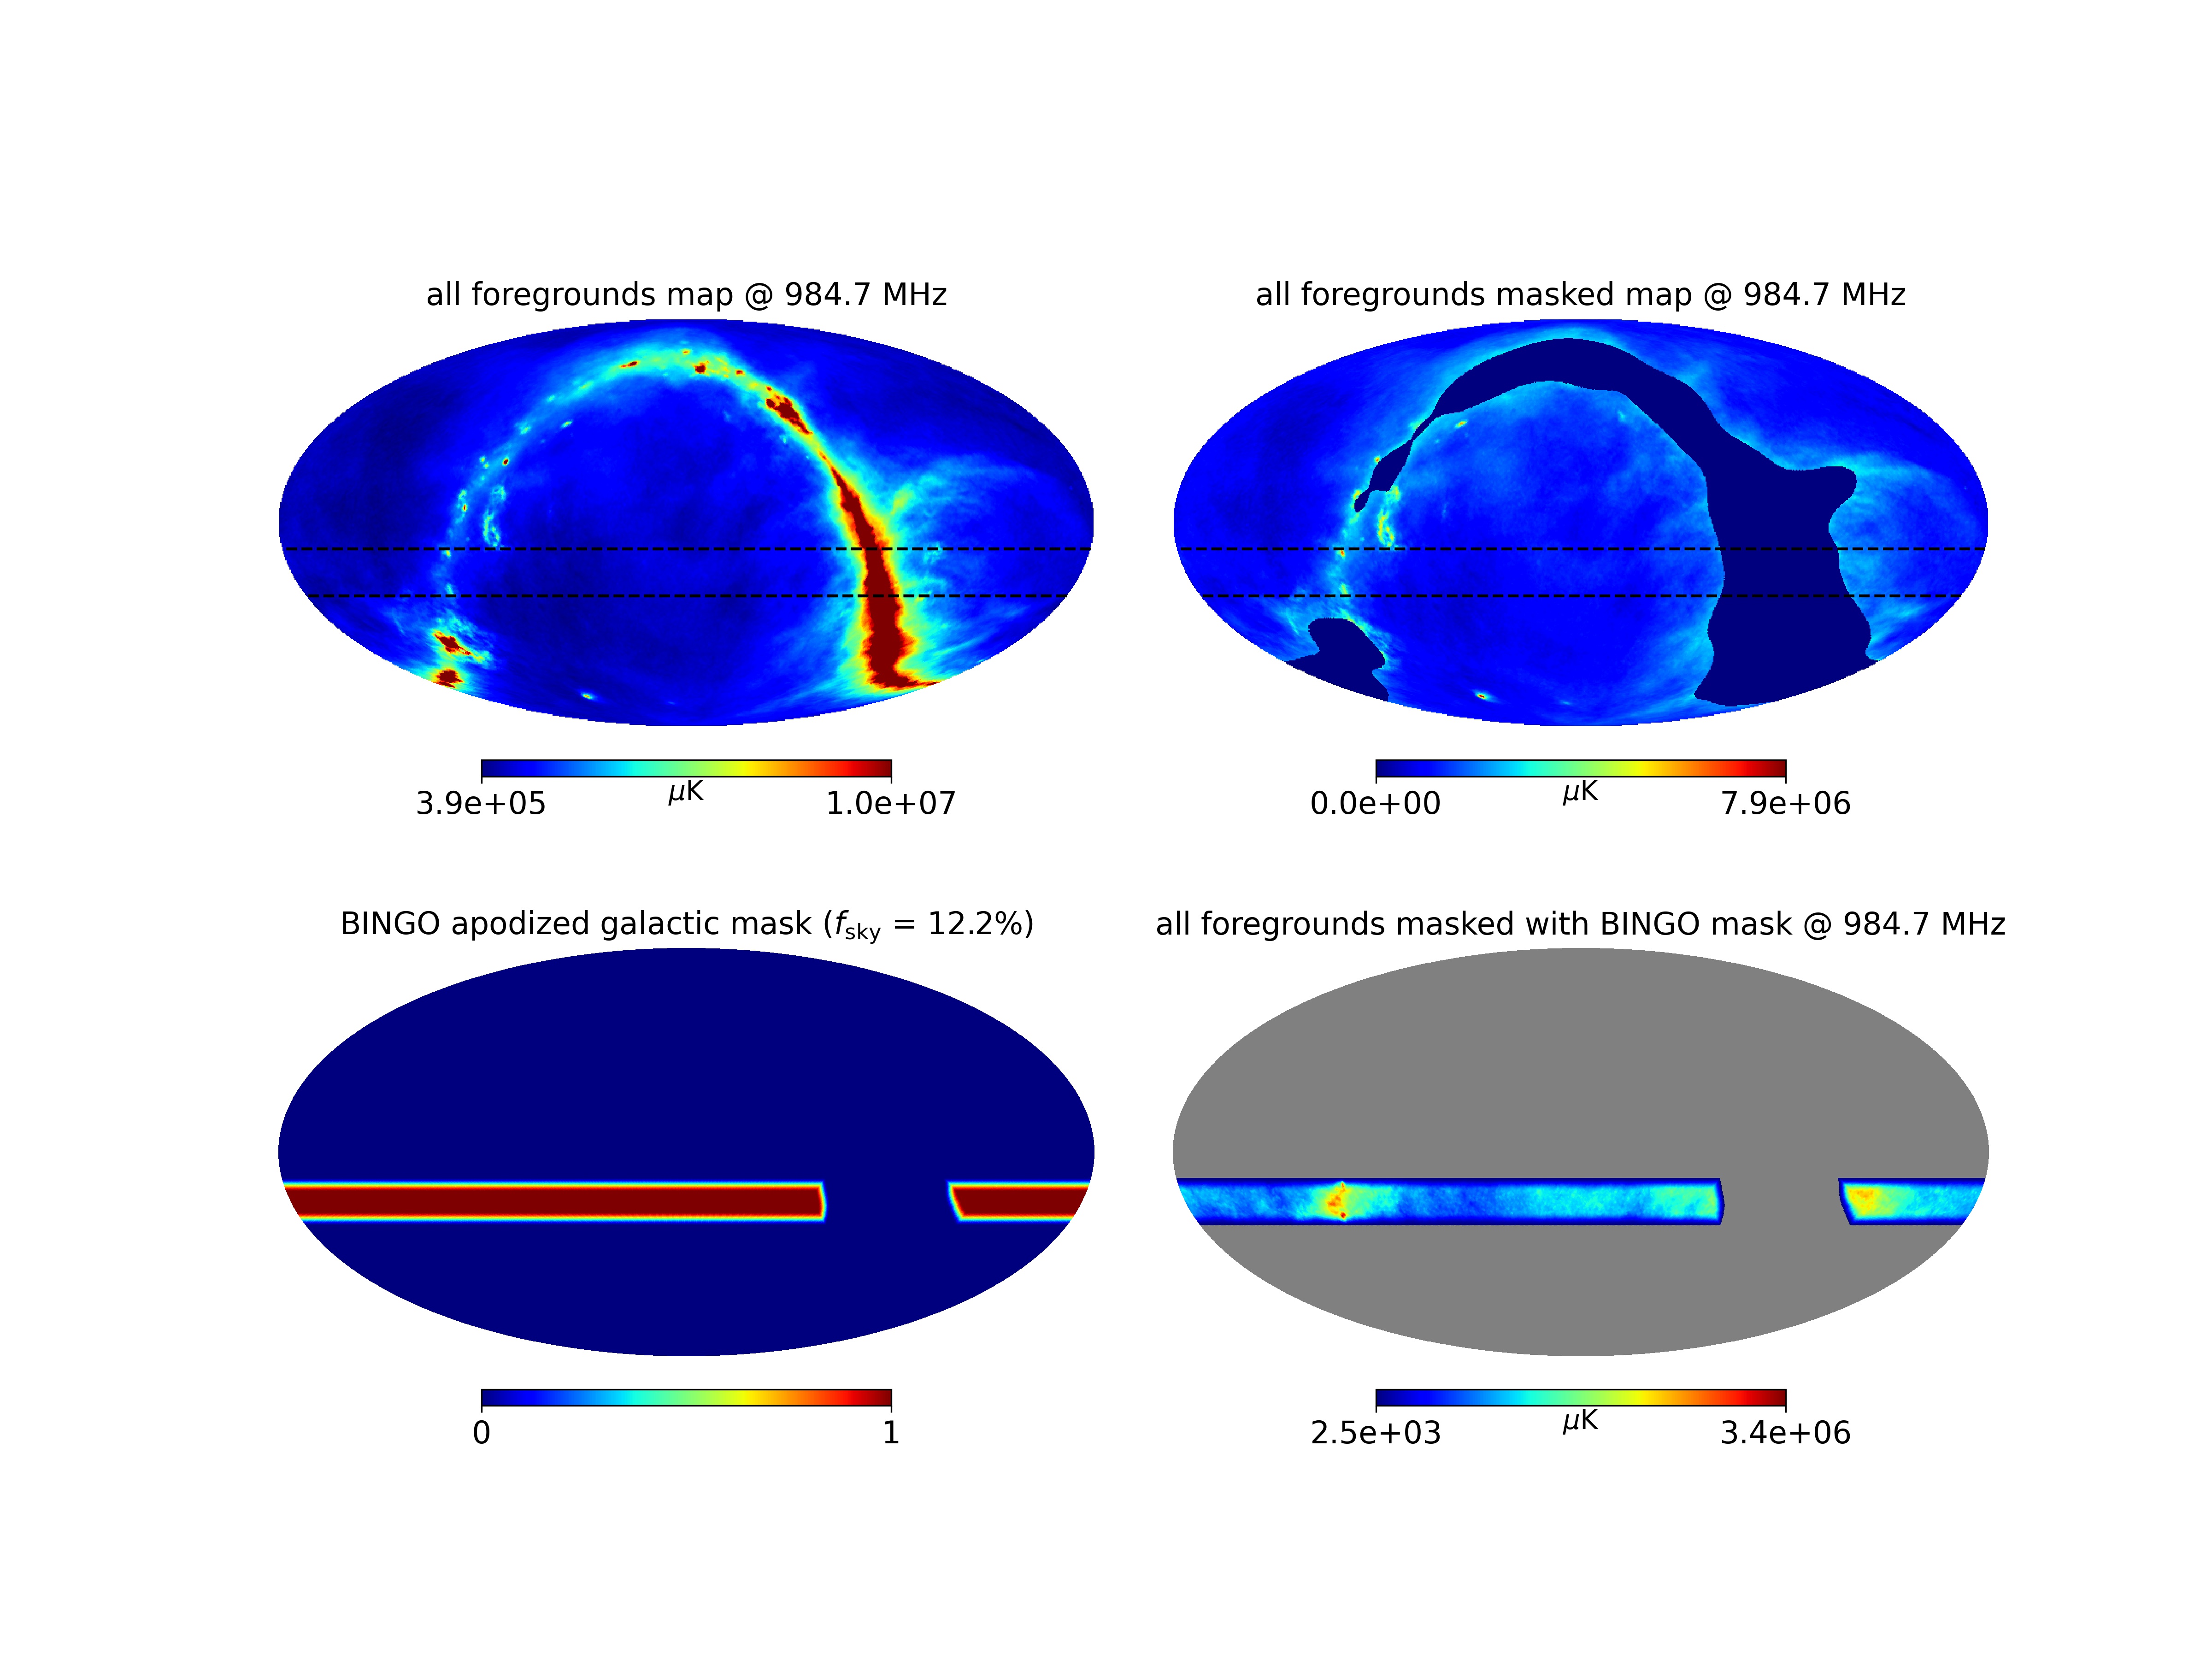
In order to remove the region of the galactic plane where the foregrounds are more intense, and consequently facilitate the component separation process, we applied a galactic mask to the simulated maps. The Figure 3 shows the combined emission at 984.7 MHz of all foregrounds considered in our simulations, as well as the region of the sky covered by BINGO. The observed region is a declination strip of centered on . Note that the region where the galactic foregrounds are more intense crosses the area covered by the instrument. The brightness temperature in this intersection region reaches 56 K.
We used a galactic mask which covers 20% of the sky, cutting off the most intense emission region of the galactic plane. The result of applying this mask to the foregrounds map can be seen in the Figure 3. The maximum temperature within the area covered by BINGO after masking is about 6.5 K.
The BINGO observed region is defined by the feed horn arrangement in the focal plane and by the observation strategy (see Wuensche et al. 2021). The effective masked region is then the intersection between the galactic mask discussed above and the observed region. To avoid boundary artifacts in calculating the power spectrum of the maps, we use the NaMaster 111https://namaster.readthedocs.io (Alonso et al. 2019) package to produce an apodization of type C2 and width in the mask. The result is shown in the bottom right panel of Figure 3, with a visible area of 12.2 % of the sky.
3.3 Assembling the simulated foreground maps
The set of sky simulations used in this work was created to investigate the efficiency of our component separation pipeline against simulated foregrounds with different synchrotron models, for different numbers of frequency channels and and with the addition of foregrounds and noise data from another experiment, at a frequency outside the BINGO band.
In order to test the robustness of the method against different foregrounds models, we created two sets of simulated data. Each set contains a different synchrotron model (MD or GD), in addition to all other components described in the Section 3.1. These sets were created with the BINGO project baseline configuration of 30 frequency bins and were called MD30 and GD30.
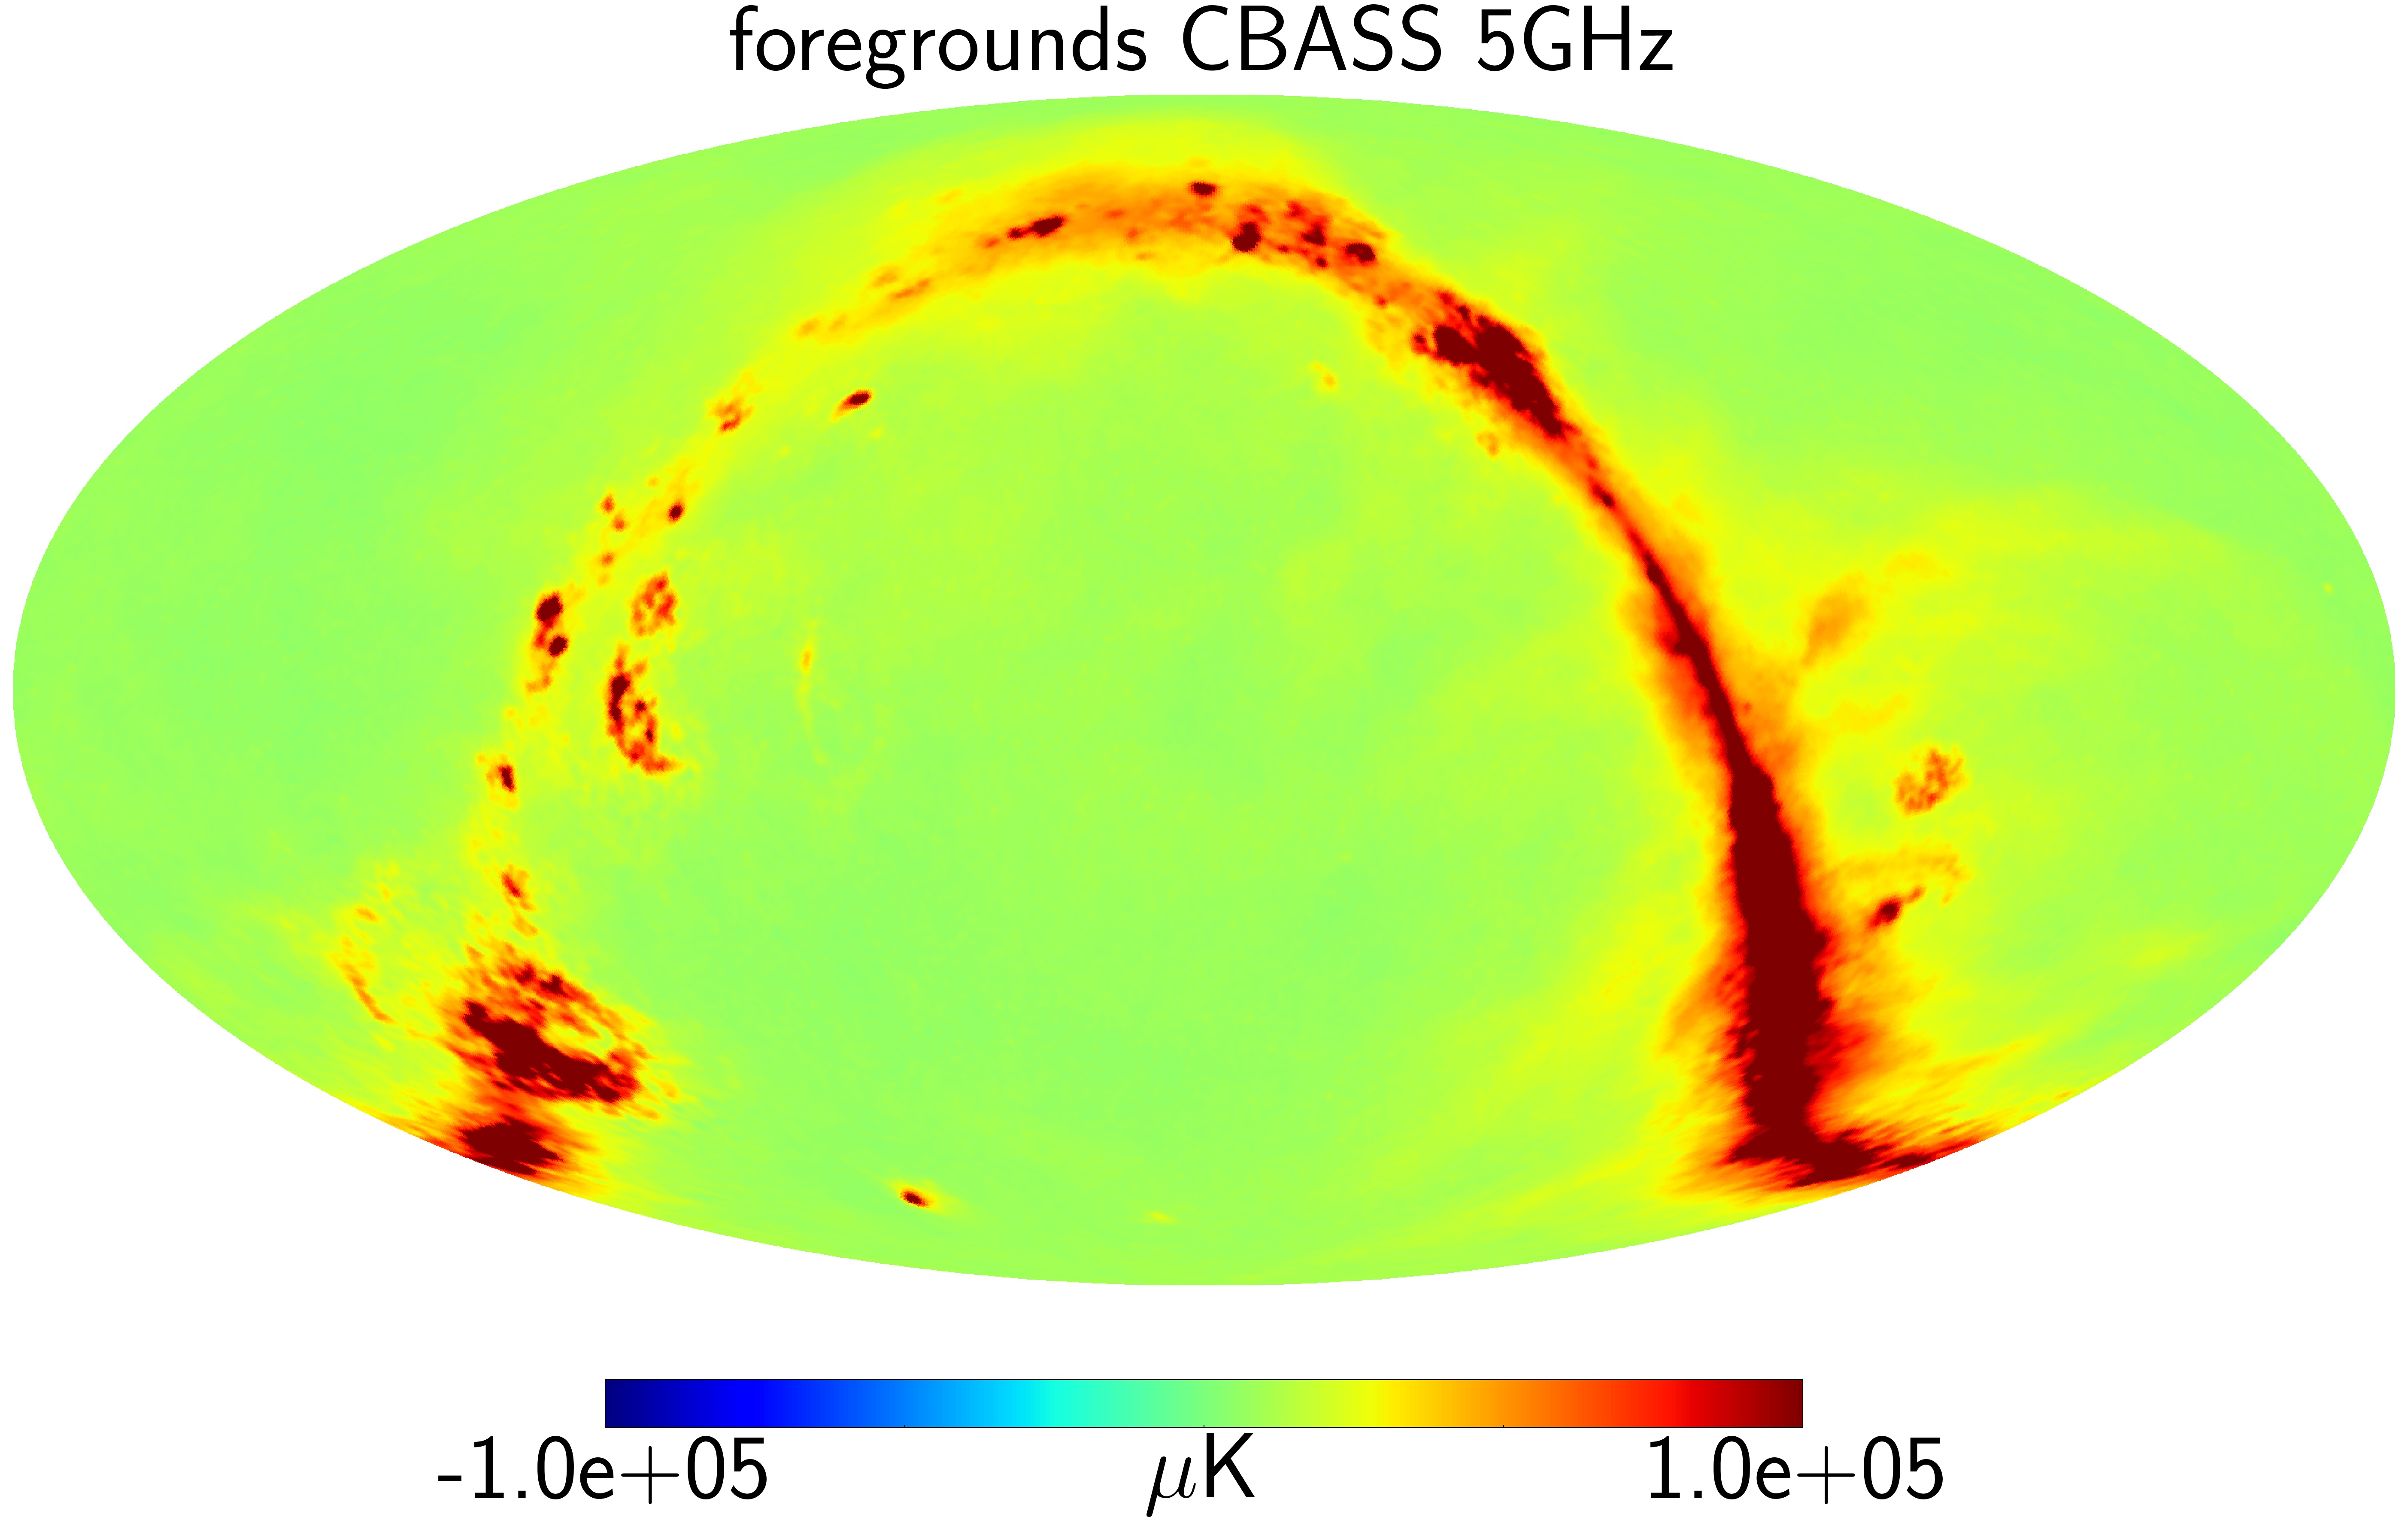
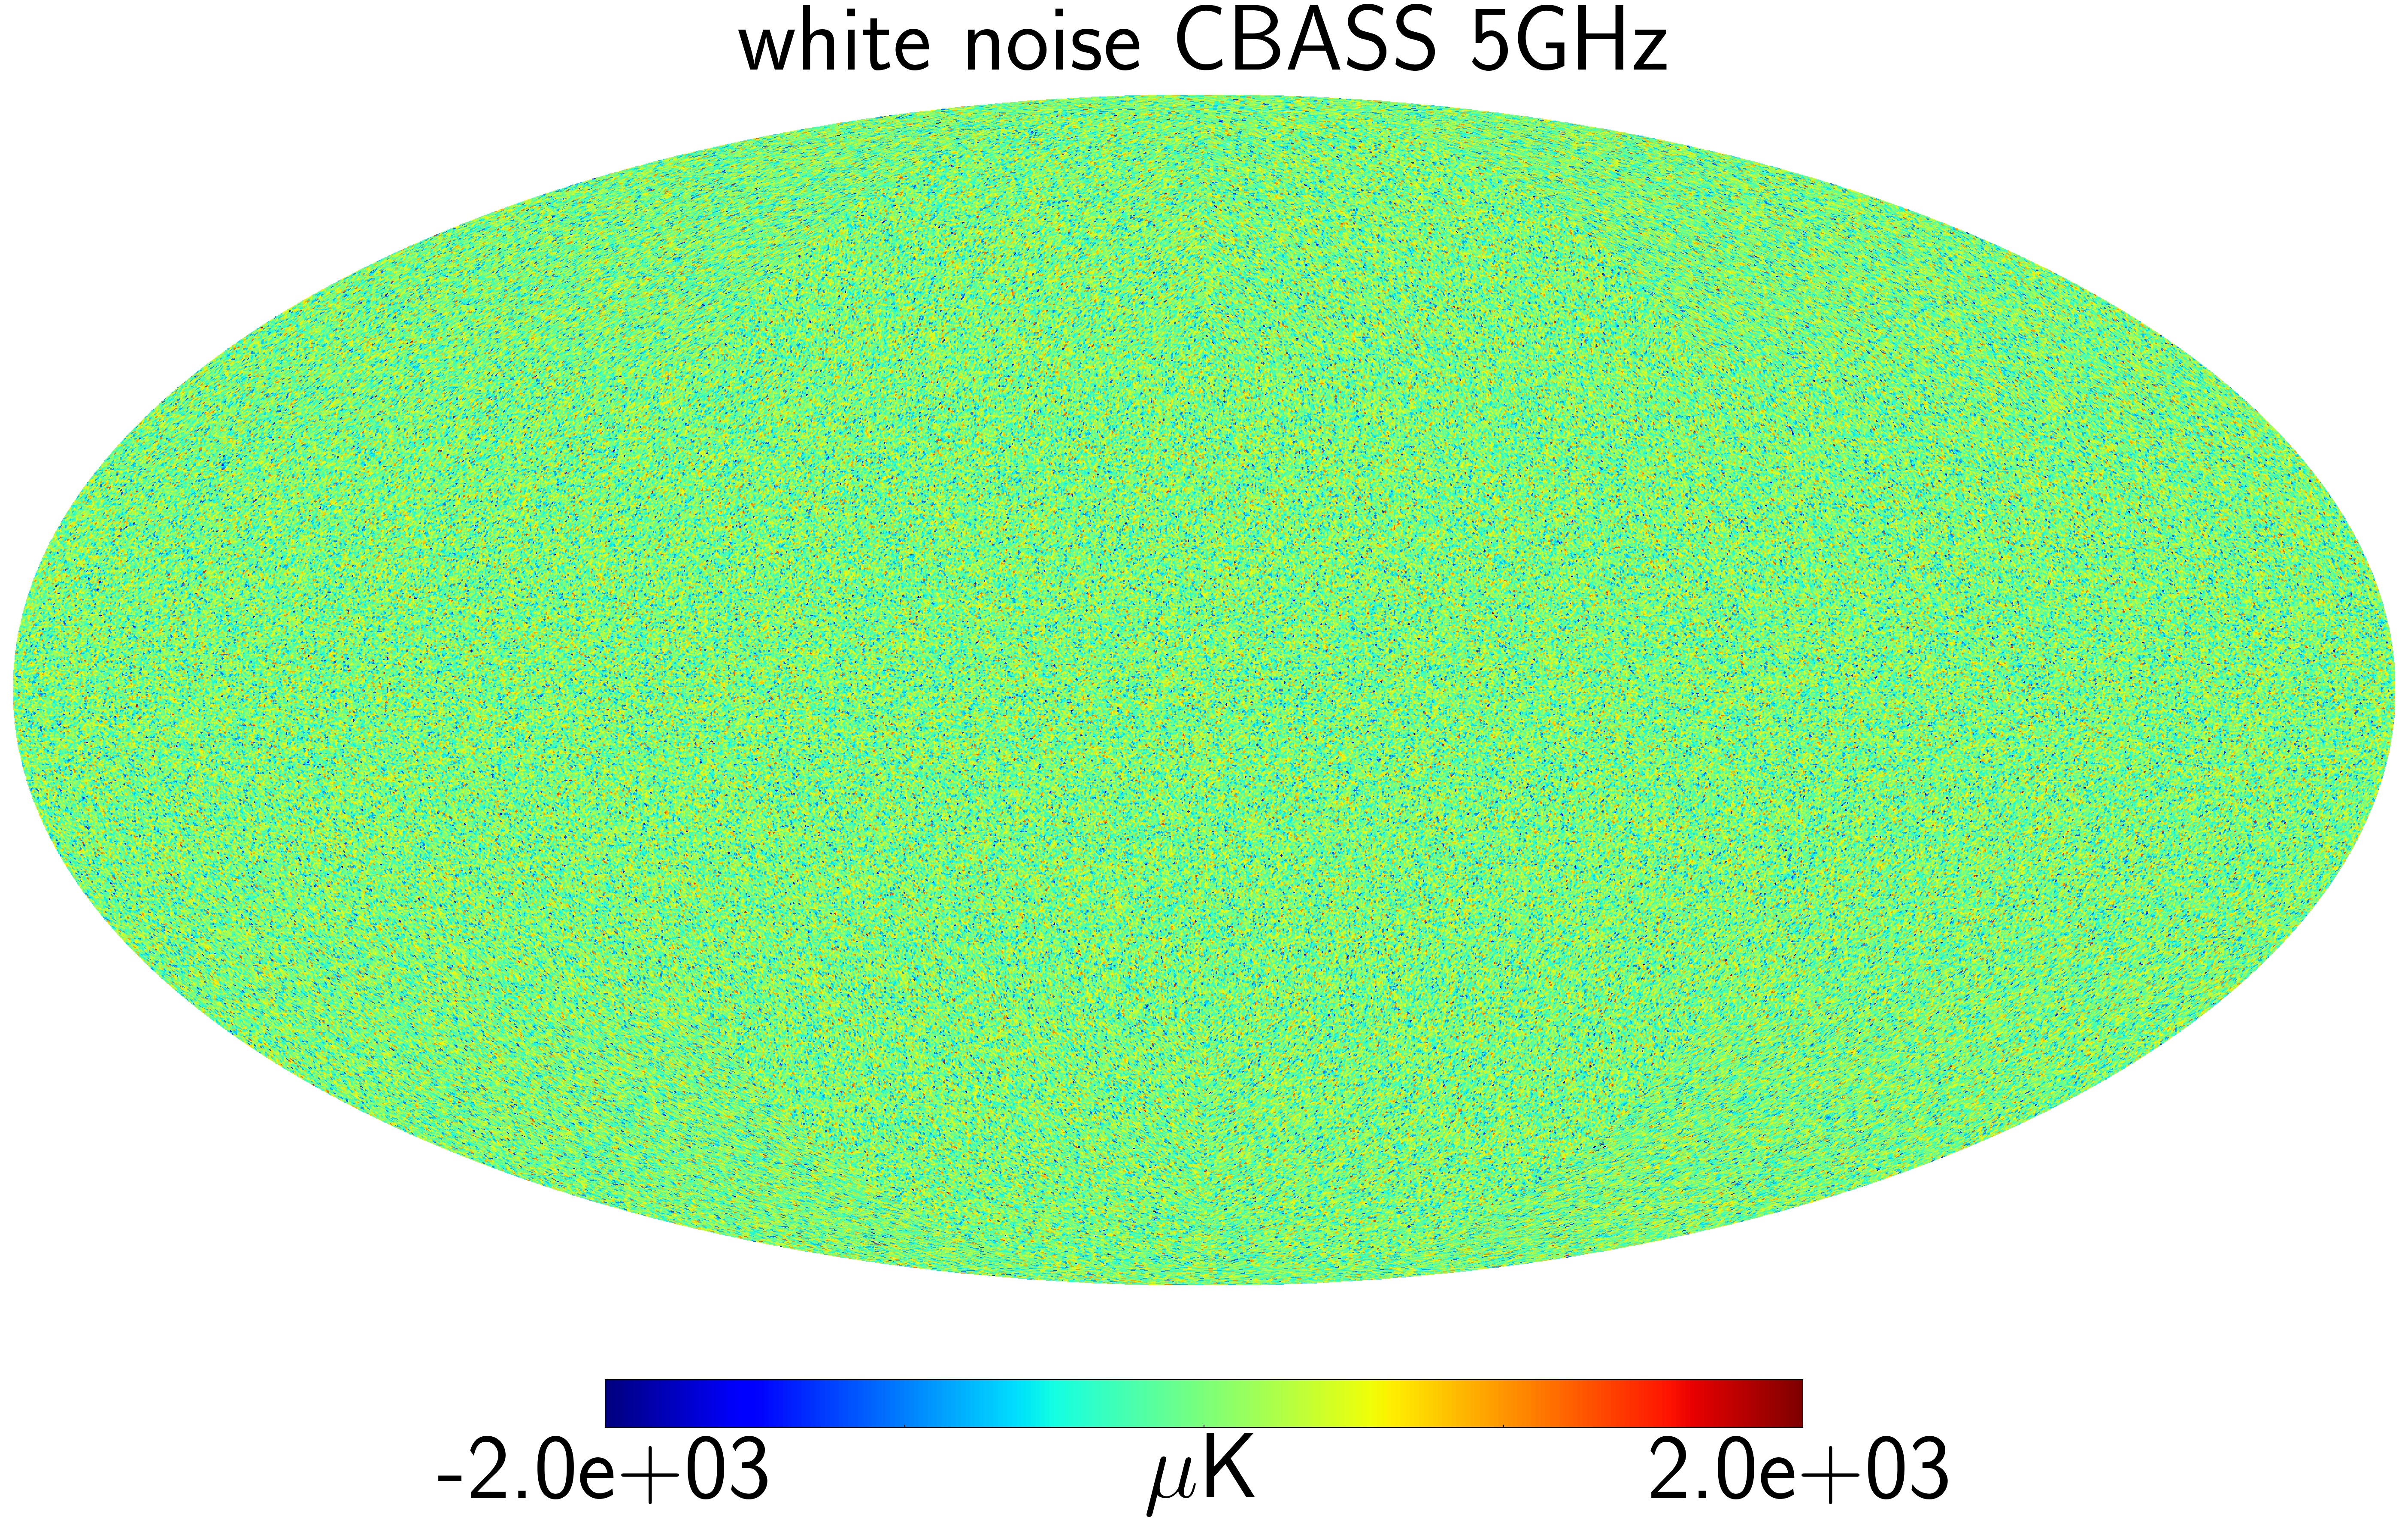
The sky at low radio frequencies (¡ 10 GHz) is dominated by astrophysical foregrounds, mainly Galactic synchrotron emission. Independent foreground observations in frequencies outside the BINGO band may improve the characterization of the synchrotron contribution and other components, facilitating its removal. The C-Band All-Sky Survey (CBASS) is an all-sky survey at a frequency of 5 GHz and 1 GHz bandwidth, with a sensitivity RMS (per beam) and a resolution of 45 arcmin, designed to provide complementary data to the CMB surveys (Jones et al. 2018). Therefore, we also perform a component separation test adding the simulated CBASS sky and noise to the MD30 base dataset. We call the result of this data combination MD30+CBASS. The CBASS noise level is for a HEALpix . The simulated CBASS all-sky foreground and noise emission maps are shown in Figure 4.
3.4 Simulation plan
We generated sets of simulated data with 20, 30, 40, 60 and 80 frequency bins to evaluate the reconstruction efficiency the 21 cm signal with respect to different number of channels. To perform this test, we used the MD model for the synchrotron component, keeping the other components as described in the Section 3.1. The created sets were called MD20, MD30, MD40, MD60 and MD80.
The BINGO input maps used in the tests described above are the result of the sum of Hi and foregrounds, convolved with a 40 arcmin beam, plus the estimated BINGO noise. In the case of combining BINGO and CBASS data, in addition to the BINGO frequency bins, we added a channel with CBASS foregrounds plus noise. In this configuration, the maps of the cosmological and astrophysical components, both from BINGO and CBASS, are convolved with a beam of 45 arcmin. The CBASS foregrounds map contains the same components considered in the BINGO data (see Section 3.1). A summary of our simulation plan, defined by the foregrounds configuration, is tabulated in Table 1.
| Set | Foregrounds | Number of channels |
| MD30 | Synchrotron MD + freefree + AME + TD + SZ + FPS | 30 (BINGO) |
| MD30 | Synchrotron MD + freefree + AME + TD + SZ + FPS | 30 (BINGO) |
| +CBASS | + 1 (CBASS) | |
| GD30 | Synchrotron GD + freefree + AME + TD + SZ + FPS | 30 (BINGO) |
| MD20 | Synchrotron MD + freefree + AME + TD + SZ + FPS | 20 (BINGO) |
| MD40 | Synchrotron MD + freefree + AME + TD + SZ + FPS | 40 (BINGO) |
| MD60 | Synchrotron MD + freefree + AME + TD + SZ + FPS | 60 (BINGO) |
| MD80 | Synchrotron MD + freefree + AME + TD + SZ + FPS | 80 (BINGO) |
4 GNILC Method
The GNILC method was developed to be used in CMB experiments (Remazeilles et al. 2011b) and later adapted to the Hi IM (Olivari et al. 2016). The GNILC basic idea is to use not only spectral information but also spatial information (angular power spectrum) to discriminate between foregrounds and our targeted signal, considered here as Hi plus thermal noise (see Section 6.1). GNILC is a blind method, that is, it does not assume prior knowledge about the properties of foregrounds, but only about the power spectrum of the desired signal. We present below a short summary of the method, as applied to this work, and refer the reader to the original papers cited above for more details.
The sky signal at the frequency and pixel can be modeled as
| (2) |
where is the true targeted signal and is the contribution of the galactic and extragalactic foregrounds to the data. To adjust component separation to the local conditions of contamination, both in pixel and in harmonic spaces, the method uses a set of needlets , where indicates the range of angular scales selected by the bandpass. Thus, each is decomposed into a map , which is the result of the inverse spherical harmonic transform of . For each range of angular scales , we compute the data covariance matrix at each pixel , defining a pixel domain , centered on the pixel , so that is adjusted, for each needlet scale , according to the choice of the ILC bias value. The bias and the set of needlets are the input parameters for GNILC.
GNILC uses an estimate of the target signal covariance matrix, produced with a prior knowledge of the Hi noise power spectrum, to transform and diagonalize the data covariance matrix, disentangling foregrounds and signal subspaces on each needlet scale. This is the Principal Component Analysis (PCA) (Murtagh & Heck 1987) step of the method.
For each needlet scale and pixel , GNILC estimates the dimension of the foregrounds subspace (number of principal components) using the statistical Akaike Information Criterion (AIC) (Akaike 1974). Thus, the method construct an ILC filter for each needlet scale, using the previous results, and apply it to the data, to obtain the reconstructed signal .
Finally, the reconstructed needlet maps, are transformed to spherical harmonic space and their harmonic coefficients are again band-pass filtered by the respective needlet window, , and the filtered harmonic coefficients are transformed back to maps in pixel space, creating back a single map per needlet scale. These maps are then added to give, for each frequency channel , the full reconstructed map .
GNILC has two input parameters that control the locations used in the calculation of covariance matrices, both in the pixel and in the harmonic domains: the set of needlets and the ILC bias, and this work tested GNILC with different bias and needlet combinations. The best match for our simulations was the set of cosine-shaped needlets with peaks at and the ILC bias , and were the input parameters used in this work. The GNILC method was tested in this work using simulated data with different configurations and the results are presented in Section 6.
5 Debiasing procedure
Section 4 describes the GNILC method, referring to the signal of interest as the component to be recovered. Due to the characteristics of the 21 cm signal and the noise, we chose to recover both as a single component. For more details on this choice, see Section 6.1. After obtaining the reconstructed 21 cm plus noise maps, we use a debiasing procedure to reconstruct the power spectrum of the 21 cm signal as a single component. This method consists of estimating the residual noise content and the loss of the Hi signal, after passing the data through the ILC filter (see Section 4), and correcting their effects on the power spectra of the GNILC output maps. This procedure was also used by Fornazier et al. (2021) in the reconstruction of 21 cm power spectra from simulated data in a configuration of 30 frequency bins. Here we explore the same method considering different configurations, as presented in Table 1, and Section 6.2. A brief description of the technique is presented below.
The debiasing procedure to reconstruct the 21-cm power spectra is divided into two steps:
-
1.
Estimate the projected noise power spectra, , and debias the GNILC map power spectra from this additive bias.
-
2.
Estimate the multiplicative bias, , and correct the noise-debiased GNILC power spectra from it.
These two steps can be summarized by the equation
| (3) |
where is our final estimate of the 21-cm power spectrum at the frequency channel .
The additive noise bias is estimated by generating white noise map realisations for each frequency channel and projecting them through the ILC weights matrix, computed in Section 4 for the data. The power spectra of the resulting projected noise realisations are then averaged over all realisations.
The multiplicative bias is estimated by generating realisations of 21-cm signal maps at all frequency channels and computing the projected 21-cm signal by applying again the ILC weights matrix to the pure 21-cm map realisations. For each frequency channel , we then compute the ratios between the power spectra of the projected 21-cm realisations and the power spectra of the input 21-cm realisations, which we average over all realisations in order to estimate .
The accuracy of the estimation of additive and multiplicative biases depends directly on the number of realizations used. However, the choice of is not free, but limited by the available computational capacity. The greater the number of channels or realisations used, the longer the debiasing processing time. Considering our computing resources and the settings adopted for the simulated data, we chose to test the debiasing procedure with two different numbers of realisations, as can be seen in Section 6.2.
6 Results
Our component separation pipeline can be divided in two steps: the foreground removal stage, where we use GNILC method, described in the Section 4, to recover the 21 cm plus noise signal from the BINGO simulated data maps; and the debiasing stage, where we use the procedure described in the Section 5 to obtain the 21 cm power spectra from the GNILC output maps. The BINGO simulated data maps used in this work are result of the sum of astrophysical foregrounds, Hi and thermal noise, as described in Section 3. In the simulations that include an independent foreground observation, we add the CBASS 5 GHz map (foregrounds plus noise) to the set of BINGO simulated data maps. The results obtained in these two steps for the simulation plan in the Table 1 are described in the following subsections.
6.1 21 cm plus noise maps reconstruction
When trying to recover the Hi signal as a single component using GNILC, it was observed that the reconstructed power spectrum was contaminated by a residual content of thermal noise, mainly at small scales (Olivari et al. 2016), which contributes to the 21 cm component estimation error. Since it is possible to obtain the thermal noise characteristics with good precision in an experiment, we chose to reconstruct the Hi and noise signals as a single component in a first step, as described in this section. Later, in Section 6.2, we use the debiasing procedure to estimate and remove the noise content present in our power spectra in order to be able to reconstruct the pure Hi signal.
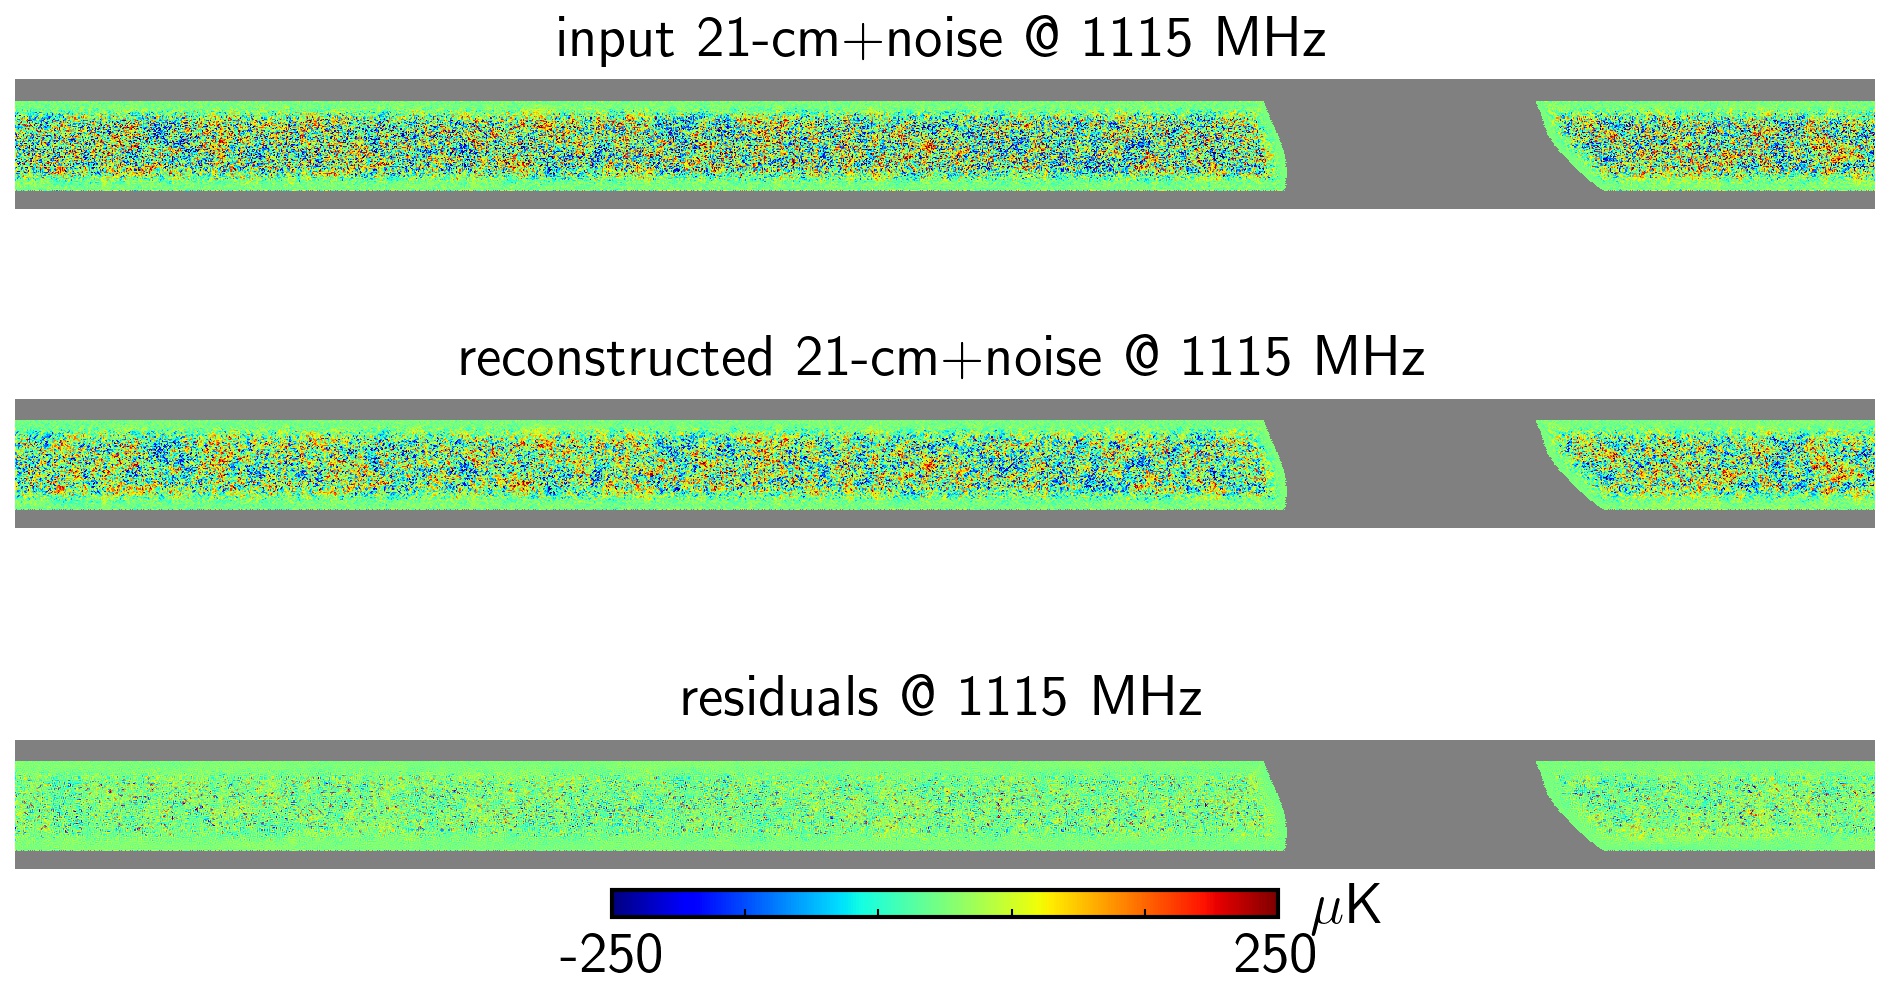
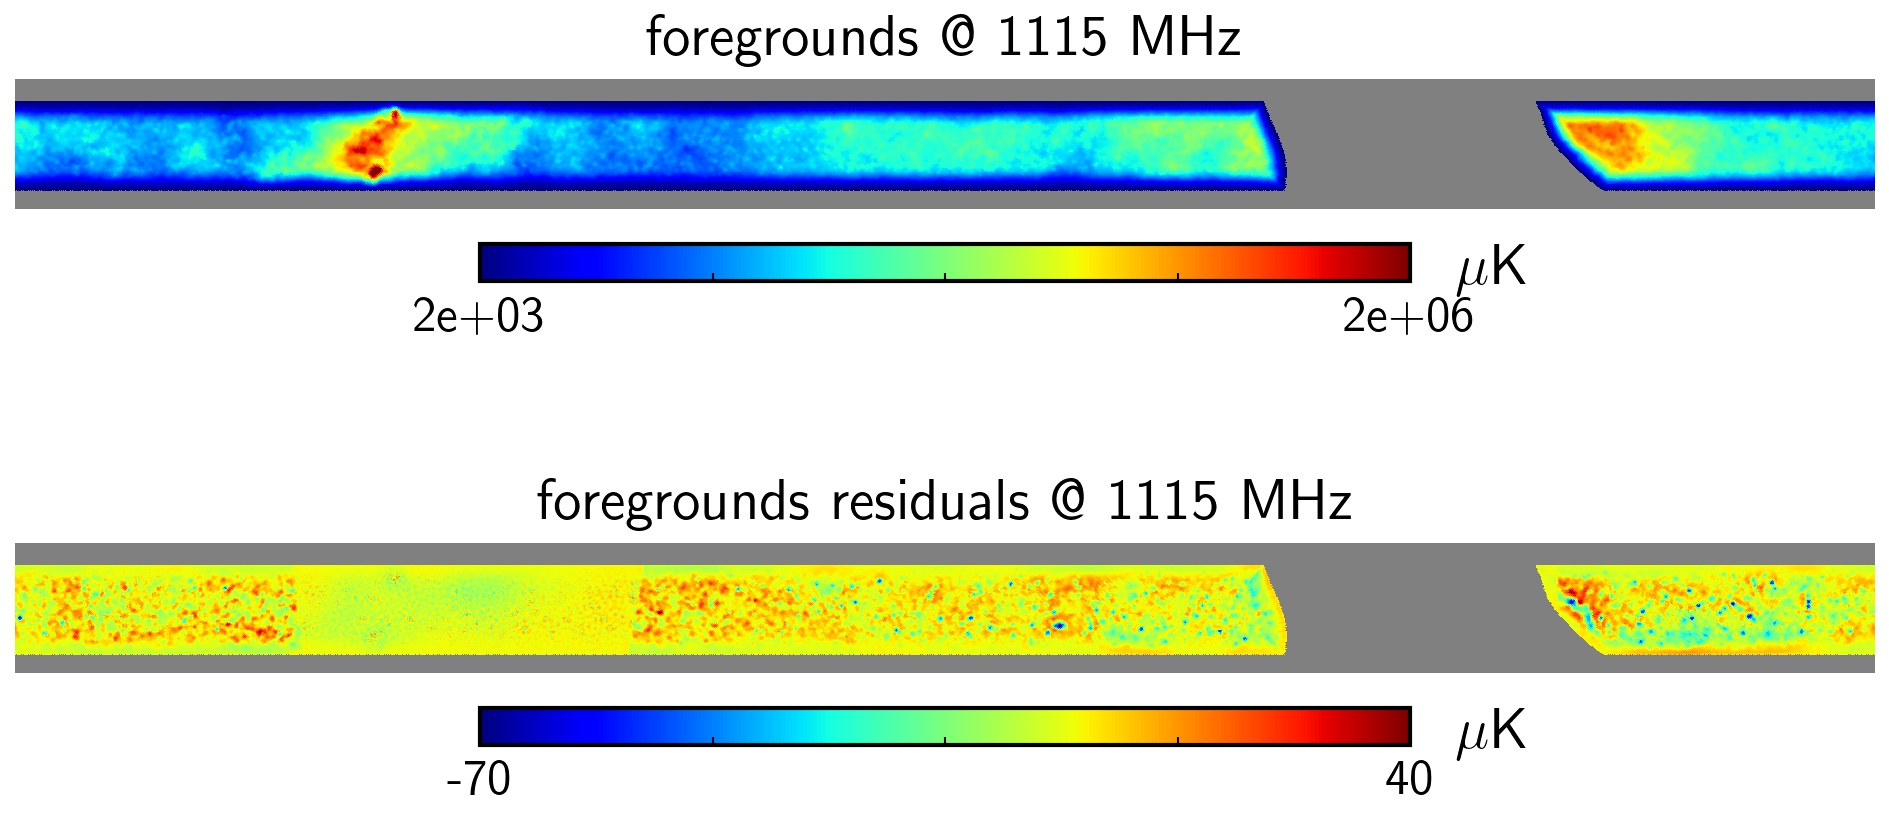
First, we present the results in the pixel domain for the MD30 case, the BINGO project baseline configuration. Figure 5 shows the input (expected), the reconstructed and the residual 21 cm plus noise maps, all observed near to the central frequency of the BINGO band (1120 MHz). Figure 6 shows the total foreground emission and the respective residual map after the component separation with GNILC. Note the effect of the apodized galactic mask on the edges of the apparent region of the maps. This result shows the effectiveness of GNILC in removing contaminants, since the content of foregrounds in the data is reduced from about to tens of K. Figure 7 shows the comparison between the real and reconstructed power spectra of Hi plus noise, as well as the residual foregrounds after GNILC.
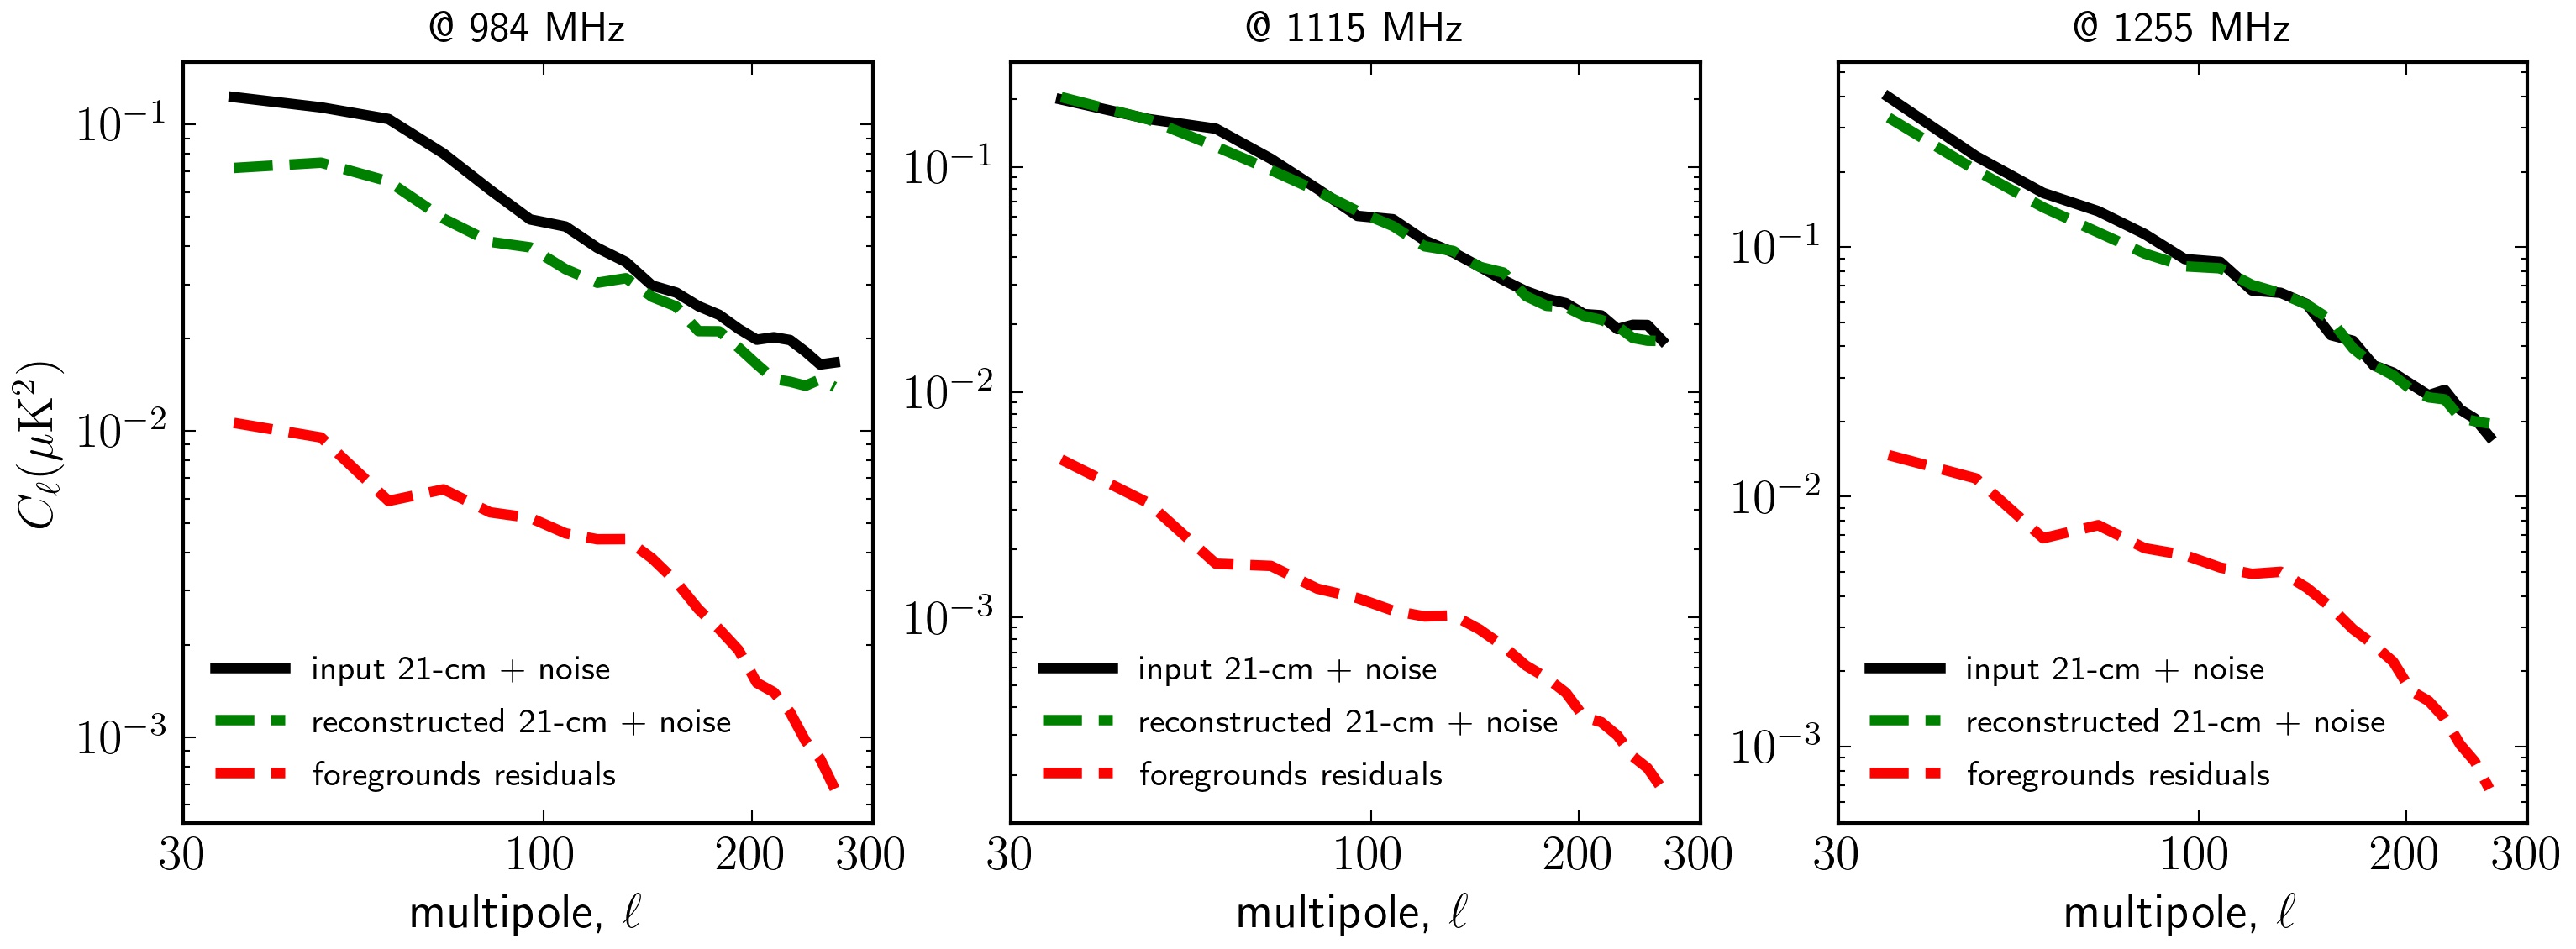
The power spectra were plotted in the range of multipoles , which is equivalent to angular scales to . We do not consider very large angular scales, , due to the area of the sky covered by BINGO, and small angular scales, , due to the angular resolution of the instrument, 40 arcmin. Furthermore, as BINGO covers a fraction of the sky, the power spectra of its maps suffer from a loss of angular resolution, given by , where is the maximum extent of the observed area (Ansari & Magneville 2010). In our case, considering the repositioning of the horns during the mission, as described in Wuensche et al. (2021) and Liccardo et al. (2021), we have . Thus, in order to respect this limitation and better adapt to the range of multipoles adopted (), we choose to use a resolution of .
We start checking the GNILC response against different synchrotron models, the dominant component. For that, we performed the component separation with the MD30 and GD30 data sets (see Table 1). To quantify the maps reconstruction efficiency, we used the Pearson coefficient, defined as
| (4) |
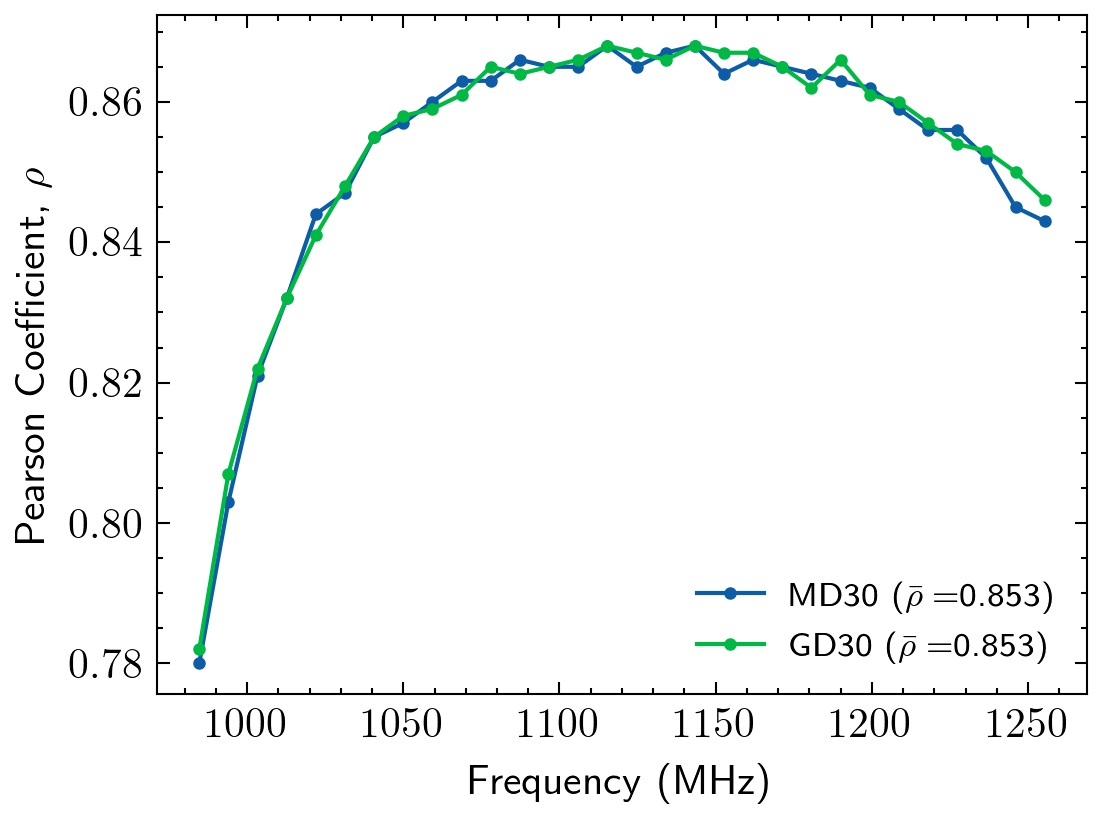
where and are the reconstructed and expected Hi plus noise maps, respectively, in a given pixel and frequency channel . The and terms are the mean value over the pixels of the reconstructed and expected Hi plus noise maps, respectively. The Pearson coefficients between the input and reconstructed Hi plus noise maps are presented in Figure 8. It can be seen that the result varies very little between the two configurations. Furthermore, the average Pearson coefficient over all channels is the same for both cases, , which shows that GNILC appears to be robust against different synchrotron models, in an analysis in the pixel domain.
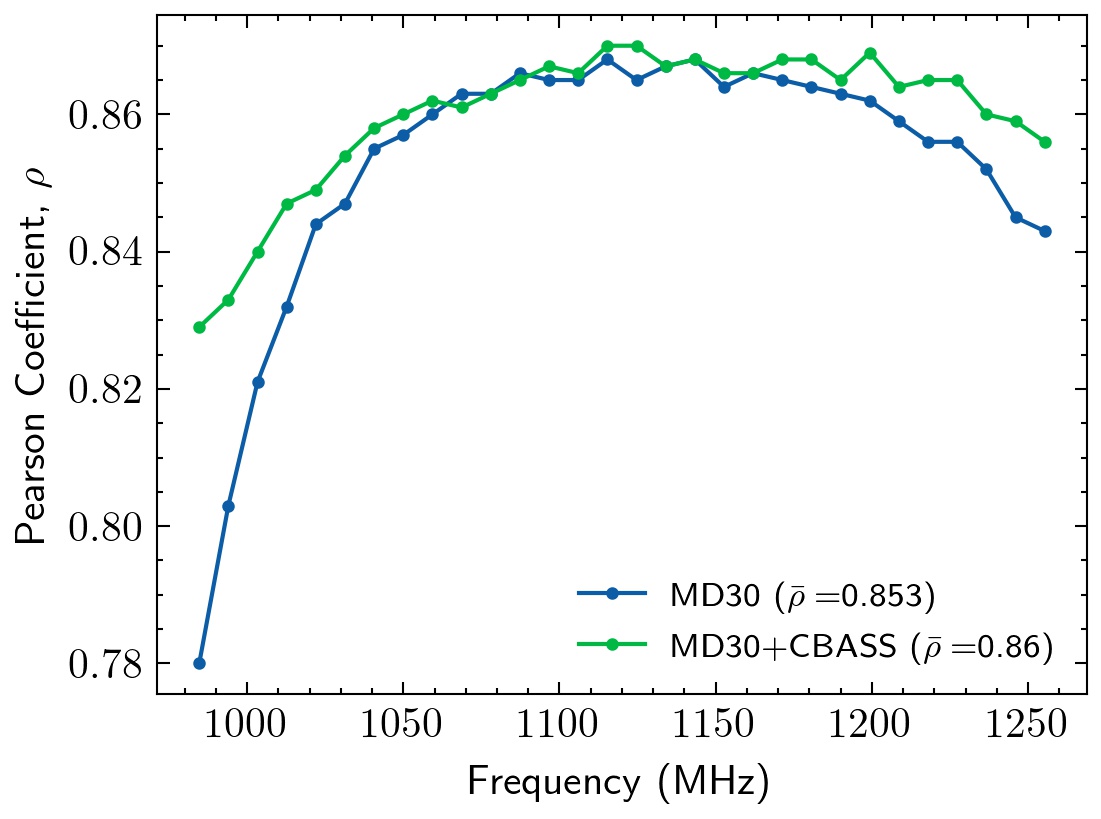
To verify the effect of adding an extra channel to the MD30 configuration, with the simulated data from CBASS experiment (see Section 3.3), we compared two cases: MD30 and MD30+CBASS. The Pearson coefficients between the GNILC output maps and the expected Hi plus noise maps are plotted in Figure 8. As expected, we can notice an improvement in the reconstruction of Hi plus noise maps when we add the CBASS channel compared to the MD30 case. The average Pearson coefficient calculated across all channels is without CBASS while is with the addition of the CBASS channel. Furthermore, the Pearson coefficient shows a more significant improvement in the extreme frequencies of the band.
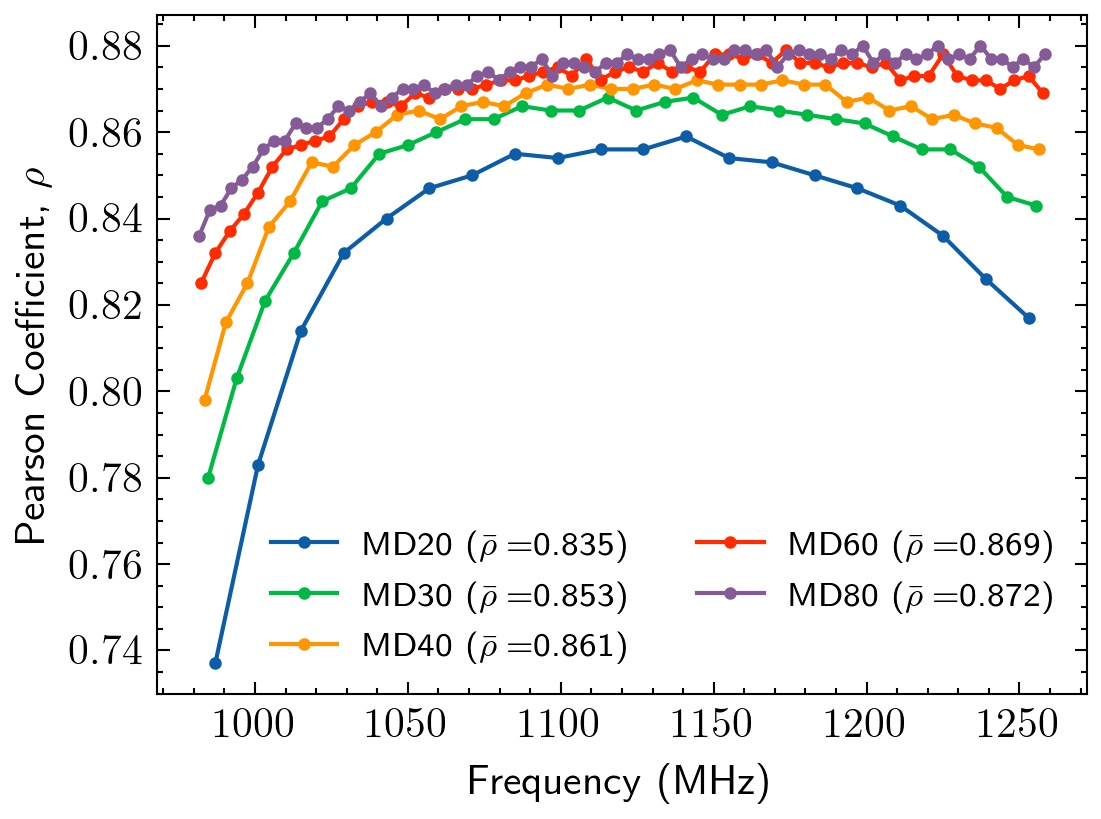
The accuracy with which GNILC reconstructs the Hi plus noise map depends mainly on the number of frequency channels adopted. Theoretically, as we increase the number frequency bins, better GNILC can remove astrophysical foregrounds from the data. The reason is that GNILC is able to adapt the number of degrees of freedom (see Section 4), dedicated to describing the foregrounds, to the number of channels. This is done both in the pixel domain and in the harmonic domain, optimizing the Hi plus noise signal reconstruction (see Olivari et al. 2016). Therefore, we tested the efficiency of the GNILC in reconstructing 21 cm plus noise maps considering 20, 30, 40, 60 and 80 channels. For that, we used the datasets in the MD20, MD30, MD40, MD60 and MD80 configurations (see Table 1).
The Pearson coefficients for configurations with different numbers of channels are shown in Figure 8. It is possible to observe that, in general, the Pearson coefficients values increase with the increase in the number of channels. However, the points seem to tend towards a limit. The difference in reconstruction efficiency improvement seems to decrease with increasing number of bins. Between the MD60 and MD80 configurations, this difference is already very small, indicating that there is a near optimal choice of the number of channels, which in our case appears to be around . The average Pearson coefficient, calculated over all channels, is also directly related to the number of frequency bins. The calculated values range from , in the MD20 configuration, to , in the MD80 case. As expected, an increase in the number of bins gives the method more degrees of freedom to describe and remove the foregrounds, improving the recovery of the Hi plus noise signal. However, there seems to be a limit in the number of channels, above which there is negligible improvement in the reconstruction of the signal of interest.
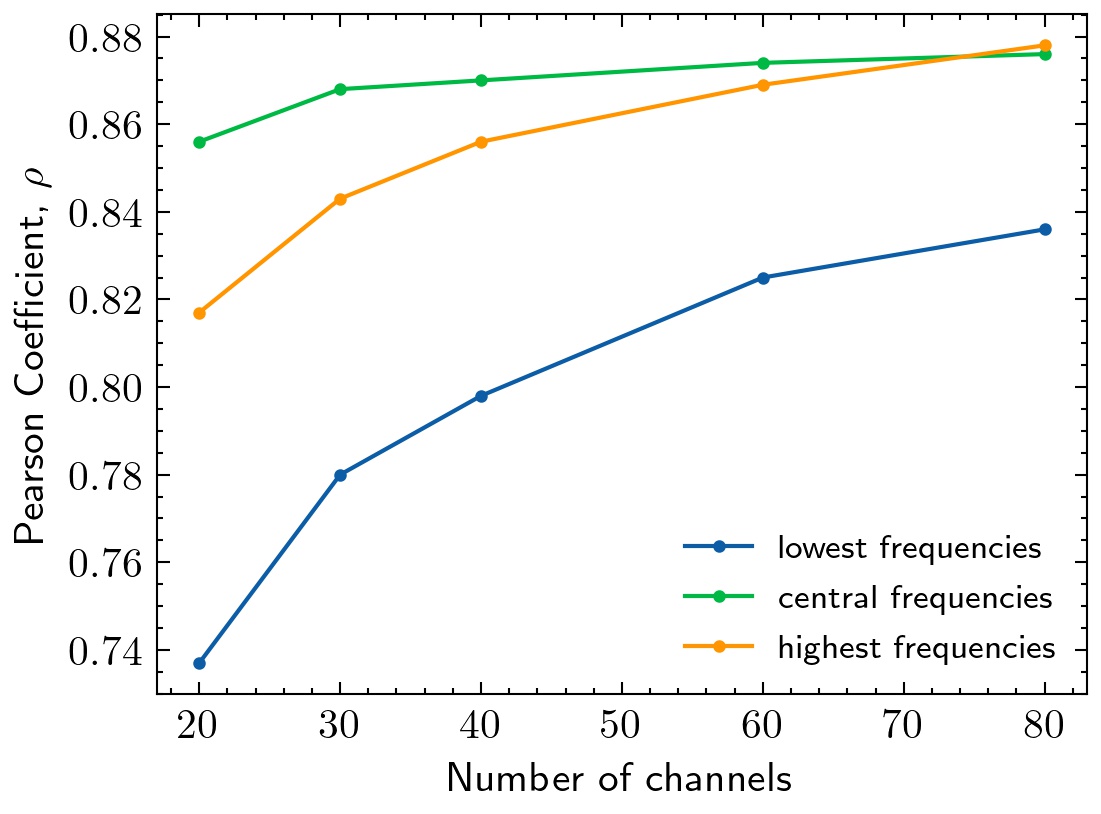
Figure 9 shows the Pearson coefficient as a function of the number of channels, calculated in channels centered at lower, central and higher frequencies, within the BINGO band (980-1260 MHz). In this figure it is possible to see better the stabilization trend in the efficiency of the reconstruction of the 21 cm plus noise maps with the increase in the number of channels. This effect is more evident in the central frequency channels, where the Pearson coefficients are already higher than in the other bins. This result reinforces what was said earlier regarding obtaining a near optimal reconstruction in the MD80 configuration.
So far we have presented the GNILC performance in the reconstruction of the 21 cm plus noise maps. In the following section, we show the results of using the debiasing procedure, described in the Section 5, to recover the noiseless 21 cm power spectra.
6.2 Noiseless 21 cm power spectrum reconstruction
In this section, we present the results of noiseless 21 cm signal recovery in the multipole domain using the debiasing procedure presented in the Section 5. The power spectra of the GNILC output maps (), obtained in the previous section, are used here as one of the inputs for the bias correction method (see Equation 3). To measure the reconstruction error of the 21 cm power spectrum, we define the index , given by the absolute mean difference between the recovered and real , normalized by the real power spectrum, according to
| (5) |
This index is calculated for each frequency channel and for a multipole range , as defined in Section 6.1.
To perform the debiasing for all cases proposed in the Table 1 in a reasonable time, we chose to work with a low number of realizations. Therefore, we initially adopted a base number and after correcting the bias for all the configurations, we performed a test increasing this amount for the configuration with the best results.
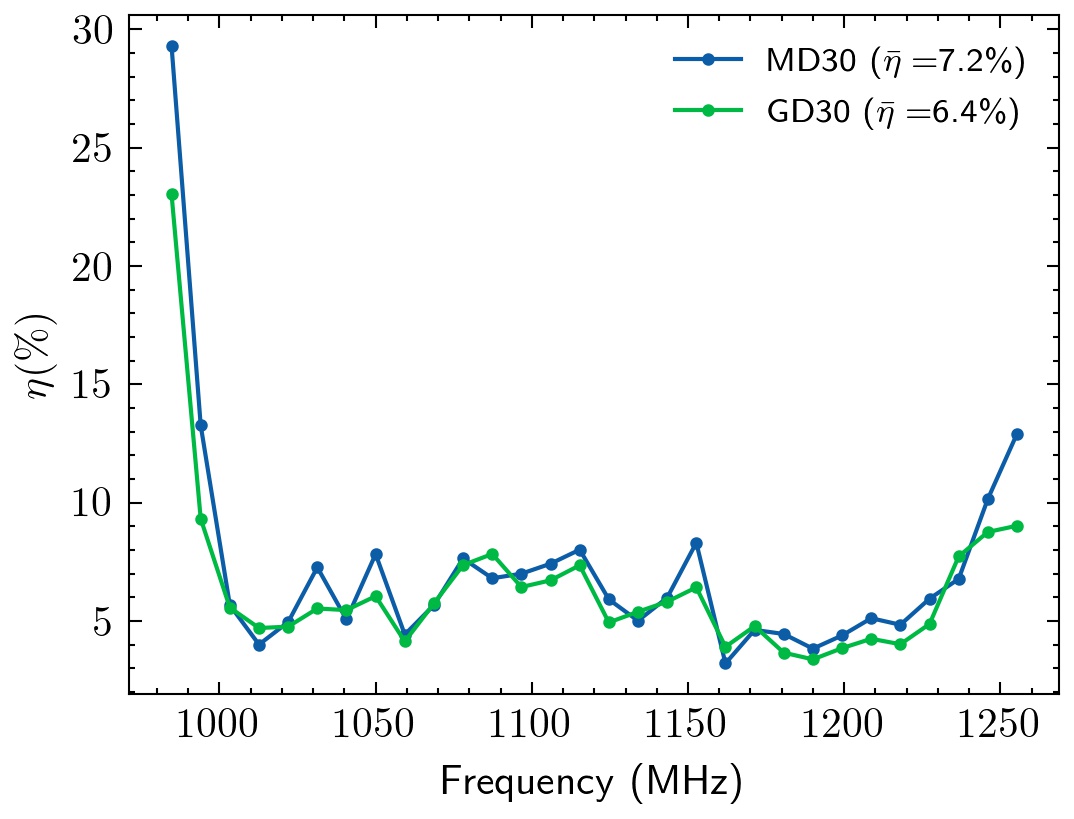
Initially, we performed the debiasing on the power spectra of the GNILC reconstructed maps, for the cases with different synchrotron models. Figure 8 shows the error of power spectrum reconstruction of the 21 cm signal in each frequency channel of the MD30 and GD30 configurations. The mean reconstruction error for the case MD30 is 7.2% and for the case GD30 is 6.4%. This difference is due to the ability of GNILC to adapt to the spatial variation of foregrounds to describe and remove them (see Section 4). Thus, maps generated with different models (MD and GD) may require different numbers of degrees of freedom to represent the contaminants in a given region of the sky, as well as to reconstruct the target signal.
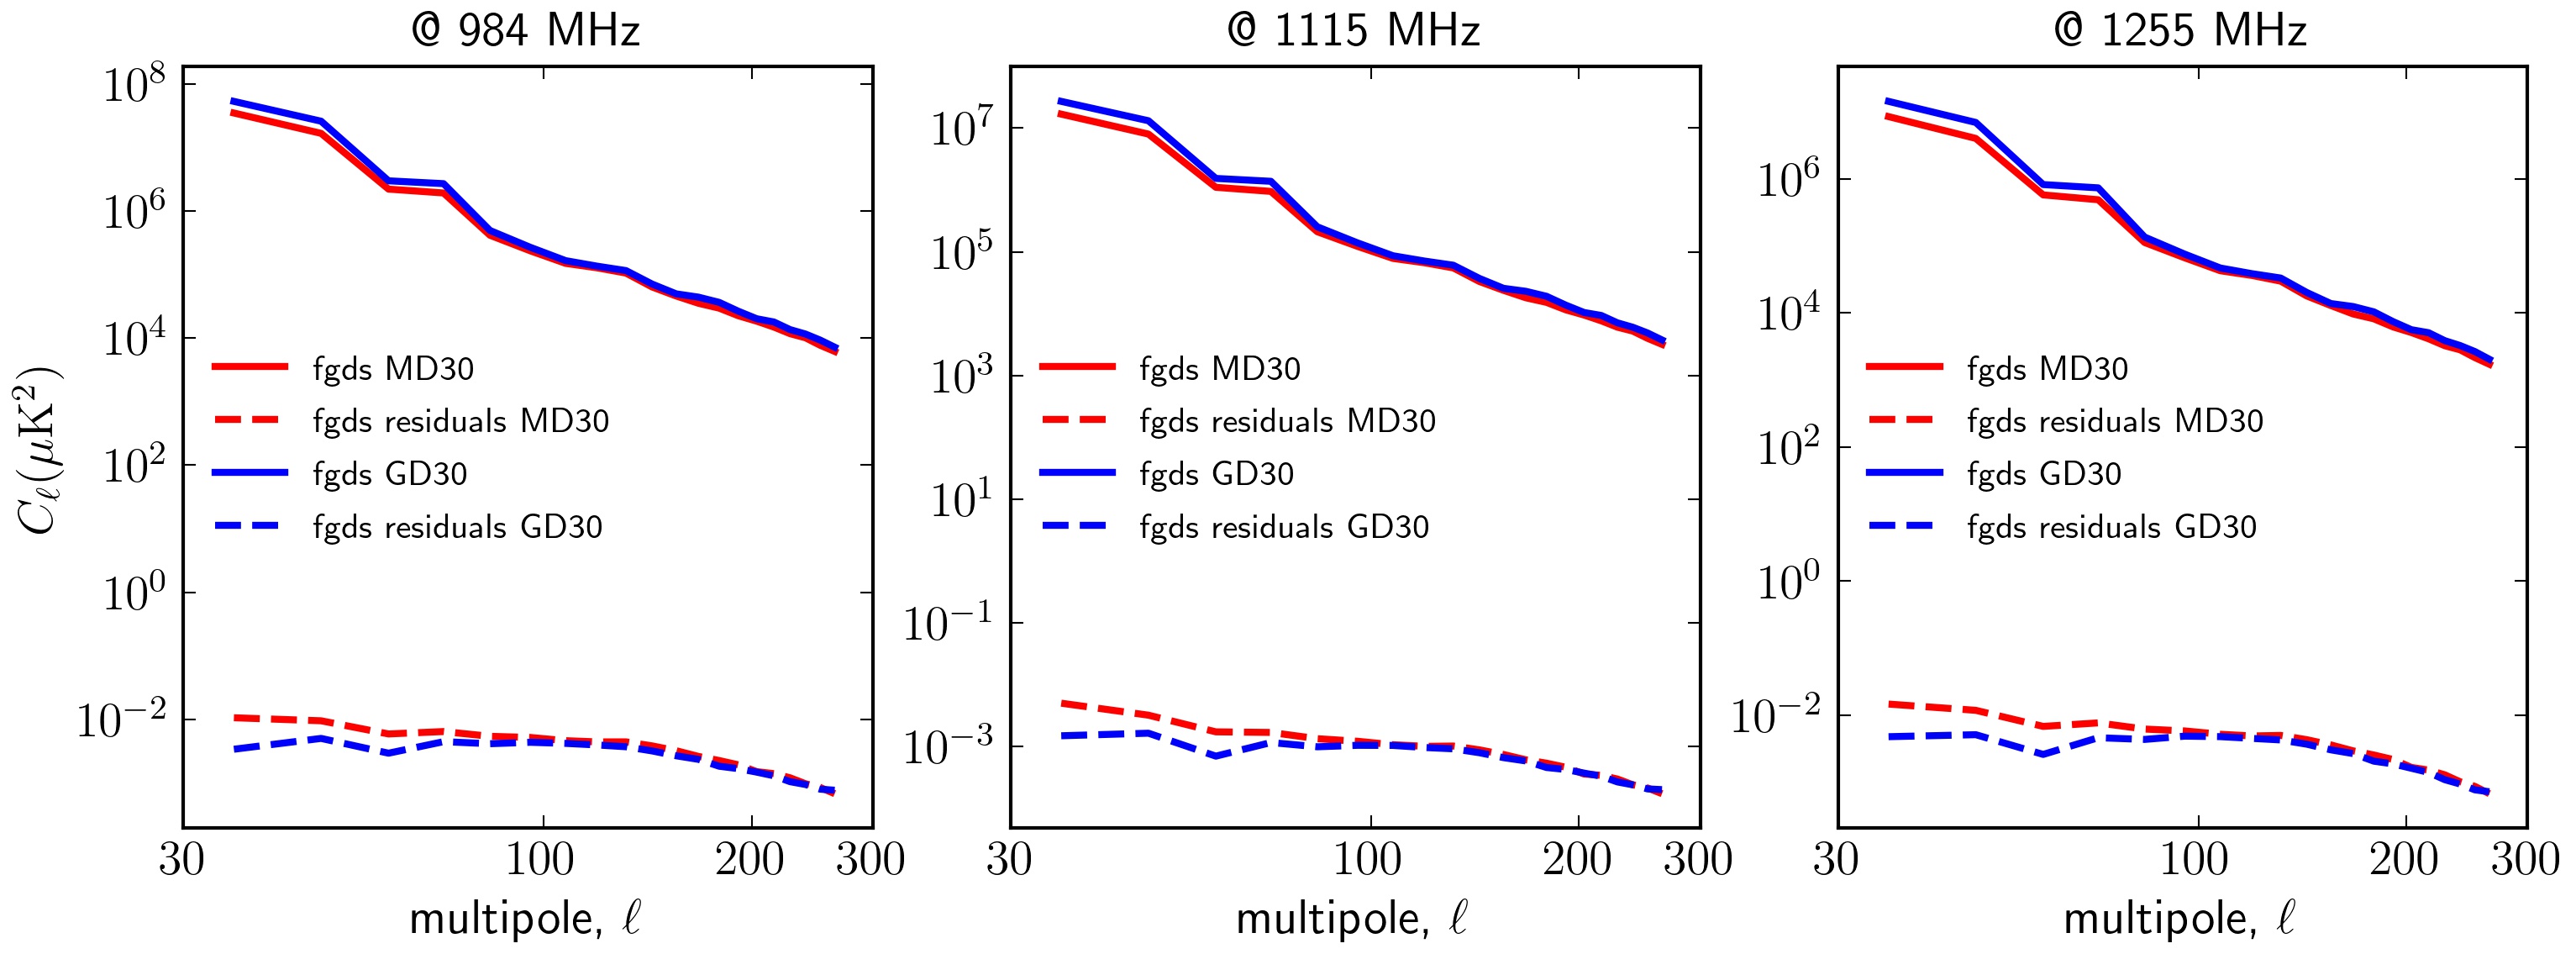
Figure 10 shows the foregrounds power spectra in MD30 and GD30 configurations and their respective residuals after component separation with GNILC. It is possible to notice that at scales , GNILC removes more foregrounds from the GD30 configuration than from the MD30. Furthermore, this residuals are preserved after the debiasing step, contributing to the error in estimating the power spectrum of the 21 cm signal.
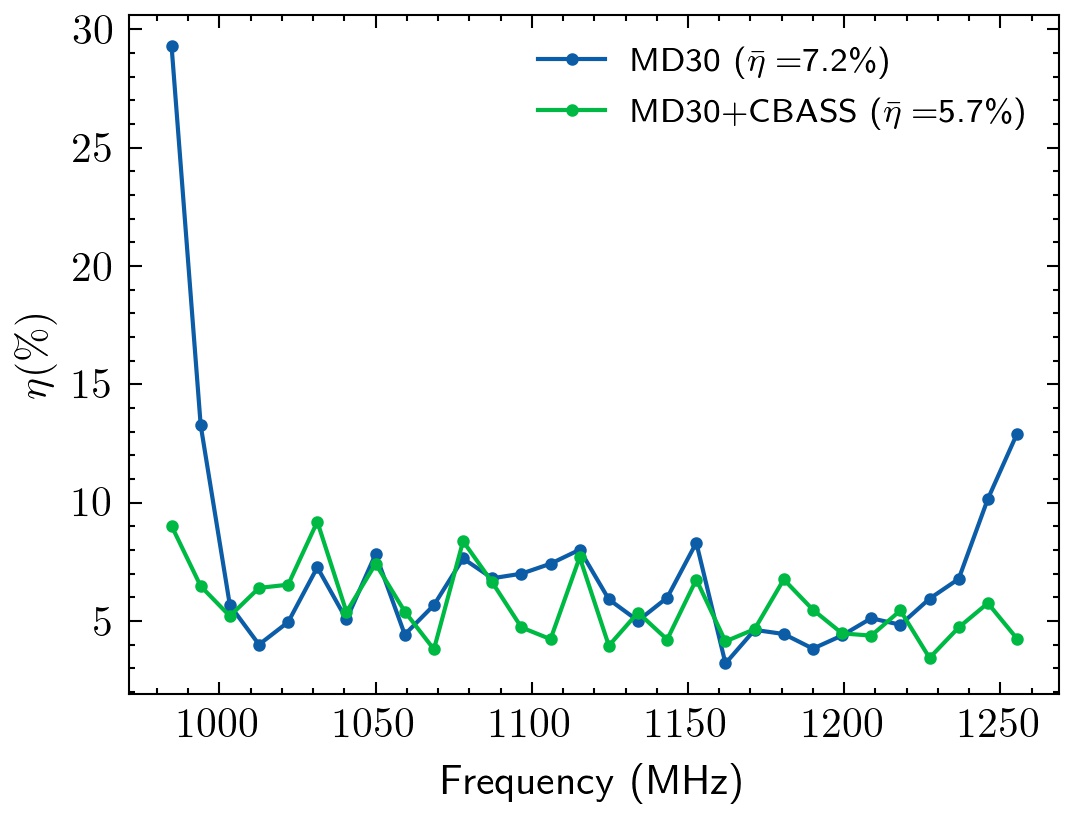
Next, we present the results of the debiasing procedure, considering the addition of a channel with simulated CBASS map to the BINGO data, in its basic project configuration (MD30 case). Figure 8 shows the error of power spectrum reconstruction of the 21 cm signal in each frequency channel. The reconstruction error for the case MD30 is 7.2% and for the case MD30+CBASS is 5.7%. As expected, the inclusion of an extra channel with CBASS data increased the number of degrees of freedom available to describe the foregrounds, improving the reconstruction of the 21 cm Hi signal.
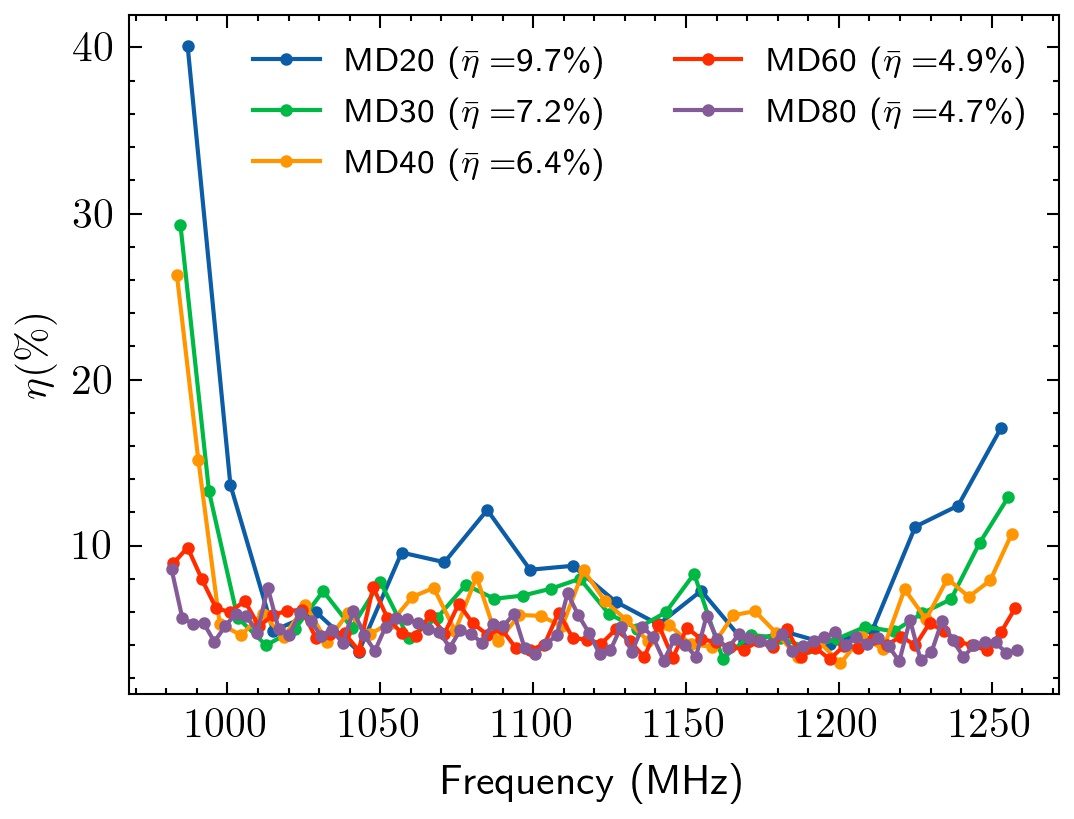
Figure 8 shows the reconstruction error of the 21 cm signal in the harmonic domain, in each frequency channel, considering simulated data with different numbers of channels: MD20, MD30, MD40, MD60 and MD80. An improvement in the cosmological signal reconstruction can be observed with the increase in the number of channels because the number of dimensions available to describe the components increases, as discussed in Sections 4 and 6.1. The smallest average error over all channels is , obtained with 80 frequency channels.
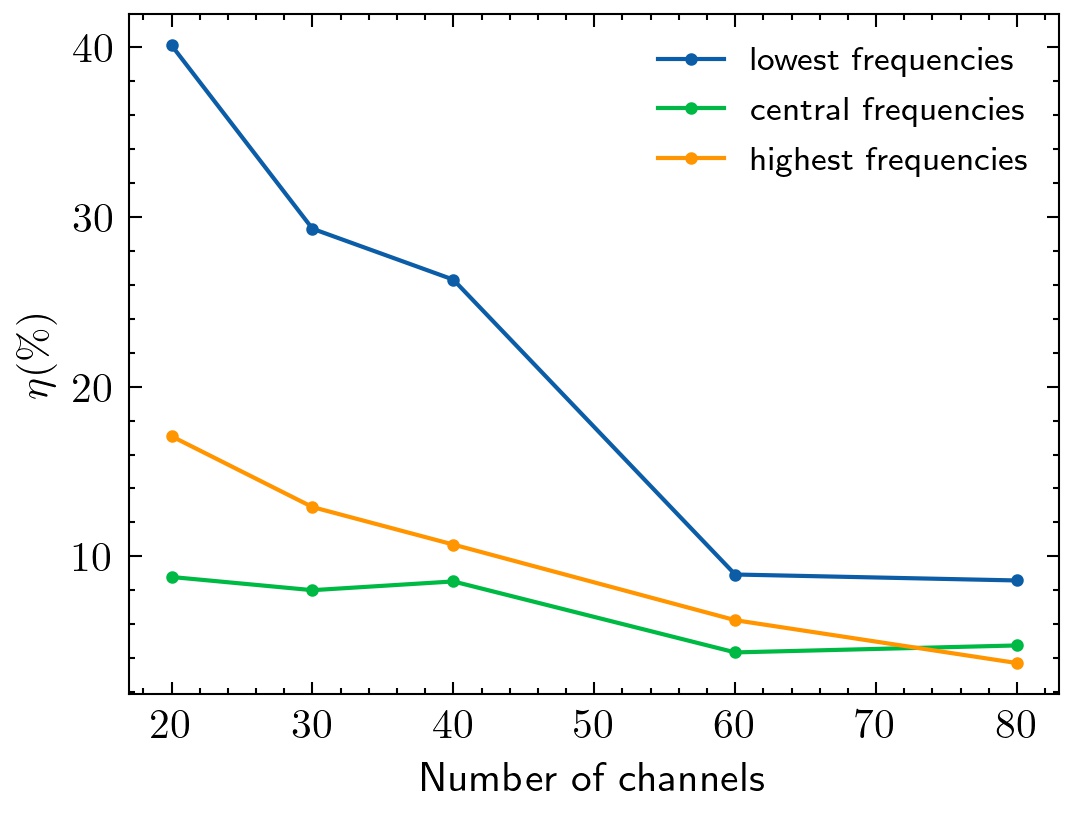
Figure 9 shows the power spectrum reconstruction error, calculated in three different channels, corresponding to the lowest, central and highest frequencies, within the BINGO band (980-1260 MHz). In this figure, it is possible to notice a reduction in the estimation error with the increase in the number of channels, in addition to a stabilization trend of this reduction. This effect is more evident in the lowest frequency channels, where the estimation error are already higher for smaller numbers of channels. This result corroborates what was presented in Section 6.1, regarding obtaining a near optimal reconstruction with 80 frequency bins.
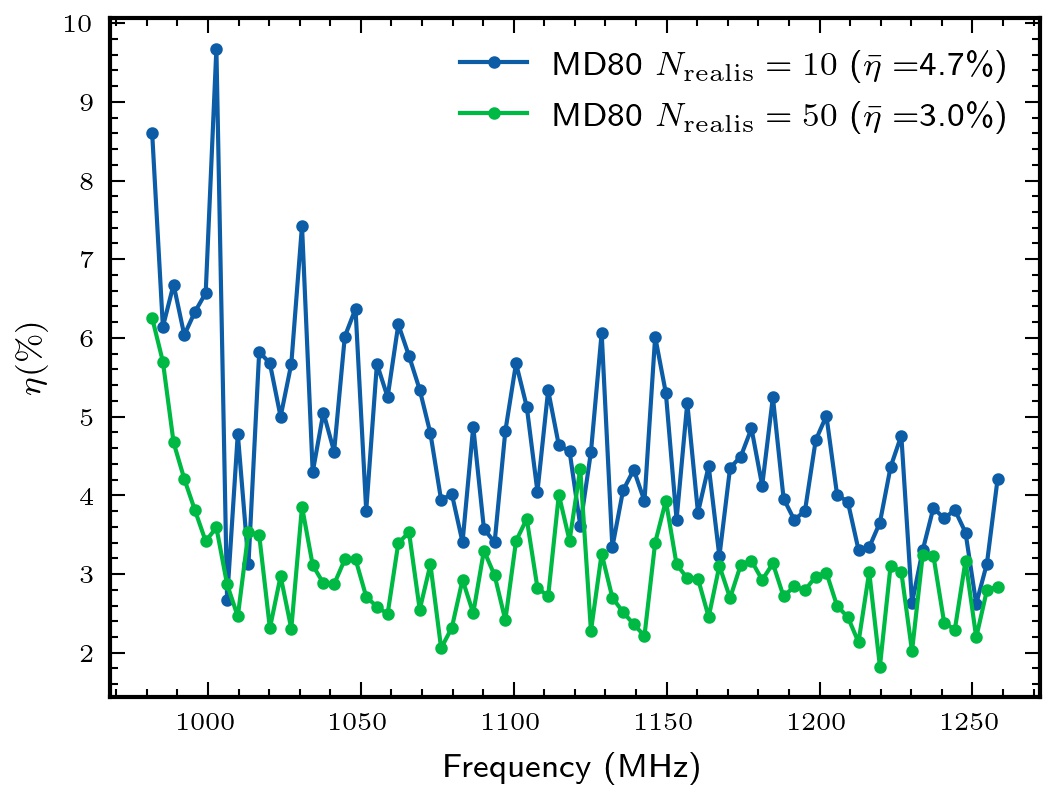
To evaluate the effect of varying the number of realisations on the 21 cm spectrum reconstruction error, we reprocessed the debiasing procedure with a greater number of Hi and noise realisations. For that, we chose the MD80 configuration, the case with the best results in the previous analysis, and performed the bias correction with realisations. Then, we compared with the previous results, as presented in the Figure 11. The 21 cm signal reconstruction error for the case MD80 with is 4.7% and with is 3.0%. As expected, the reconstruction of the 21 cm signal is better when we use more Hi and thermal noise realisations to estimate the additive and multiplicative bias present in the GNILC reconstructed 21 cm plus noise power spectrum. The reason is that with more realizations, the method improves the estimation of the reconstructed spectra bias. Our objective here is not to optimize the number of realizations, which would require much more computational processing time than we had available, but to perform a sensitivity analysis of the debiasing method with this parameter.
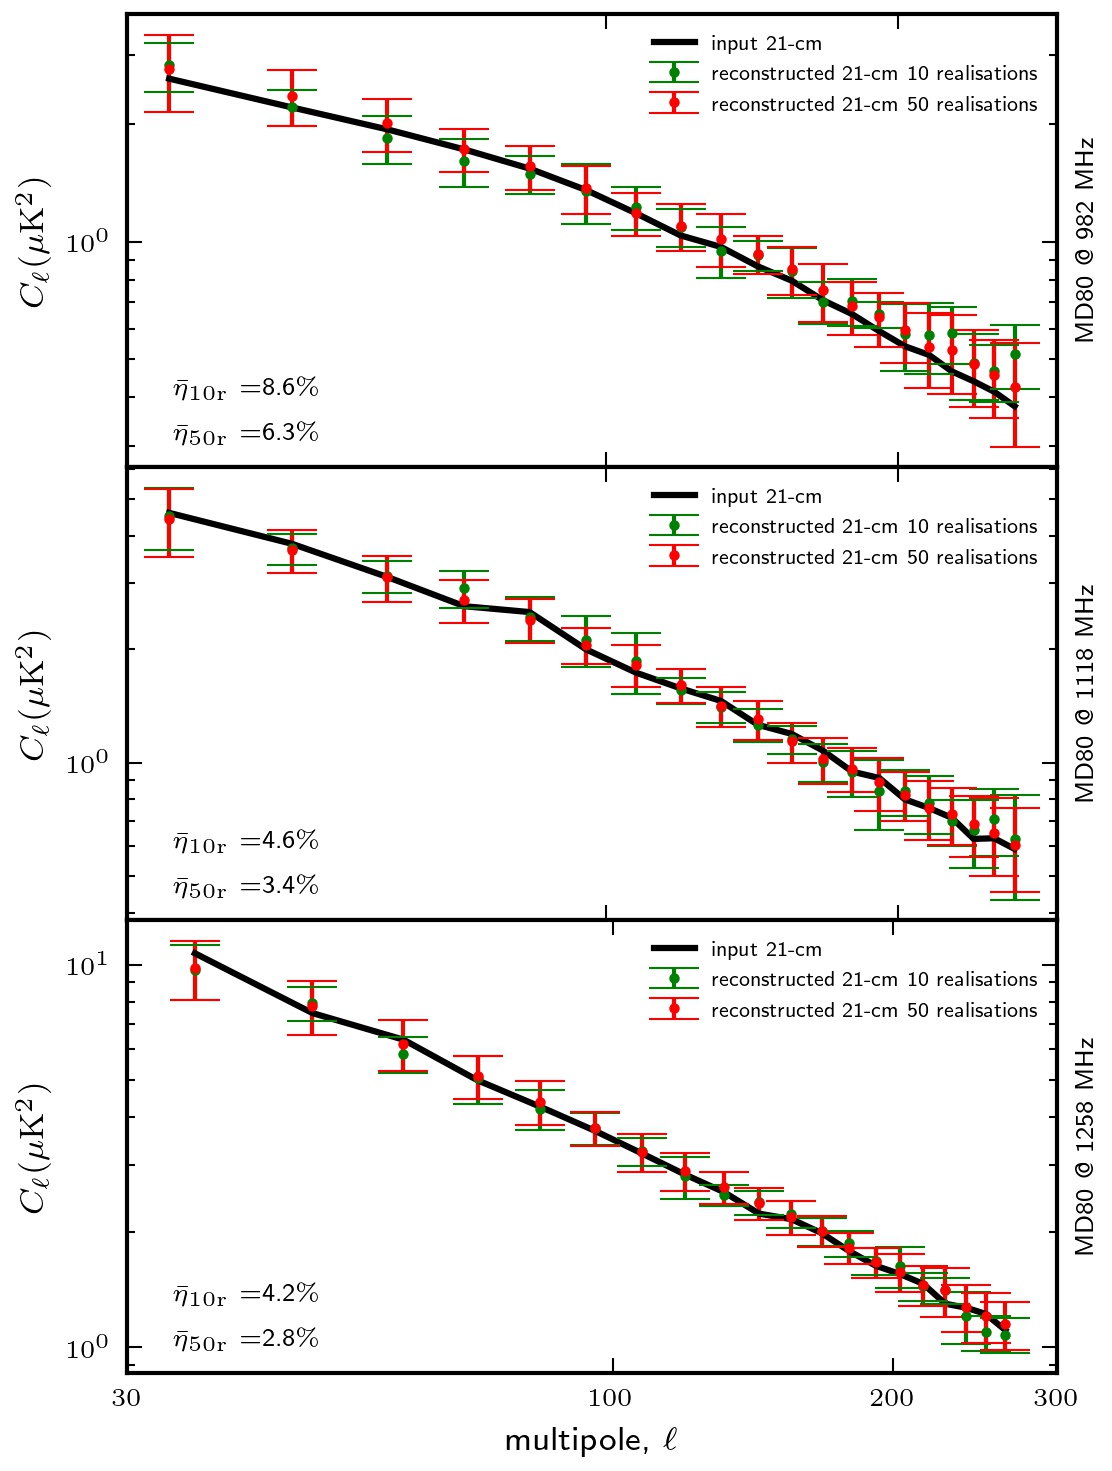
To make our final estimate of the 21 cm power spectrum, we repeat for times the entire component separation procedure presented so far, considering different realizations of the GNILC input maps (different realizations of Hi and noise plus foregrounds). Each debiasing procedure was performed with independent realizations of Hi and noise. Finally, we took the debiased power spectra and calculated the mean and the standard deviations (error bars). We did all this procedure for and , using the data in the MD80 configuration. Figure 12 shows the 21 cm all-sky real and estimated power spectra for two different and in three different frequency channels. It can be observed that the spectrum relative to is closer to the real power spectrum in all the frequencies presented. The best result is obtained for at 1258 MHz, where the average power spectrum reconstruction error is .
It is expected that a better estimate of the 21 cm power spectrum can be made with a larger . However, due to our available computational capacity, we limit the number of realizations to . The complete set of simulations for the MD80 configuration took two and a half months to be ready. For this we used 56 cores of the processor Intel Xeon Gold 5120 2.20 GHz and 512 GB of RAM.
7 Conclusions
This paper presents two new results relevant to the BINGO data analysis and hardware configuration before commissioning time. The component separation procedure described here is based on GNILC, as some previous papers from the collaboration (Liccardo et al. 2021; Fornazier et al. 2021) and is divided in two steps: first, we recovered the Hi thermal noise maps applying GNILC to the BINGO simulated data; second, we reconstructed the noiseless 21 cm power spectra passing the first step results through a debiasing procedure. For our analysis we used as default the BINGO project baseline configuration, MD30, and the number of Hi and noise realisations used in debiasing, .
The first result points that GNILC is robust against different foregrounds models. We tested two synchrotron models, finding that the reconstructed Hi plus noise maps in both cases have no significant differences in the pixel domain. In the harmonic domain, after the debiasing procedure, we obtained the mean Hi power spectra reconstruction error over all frequency channels of , for the MD30 case, and of for the GD30 case, in the interval. The difference between foreground residuals of the two models is evident for . This is due to the GNILC ability to adapt the foregrounds removal not only to different regions of the sky, but also to different angular scales.
We also confirmed, as expected, that an extra channel with a simulated sky from CBASS experiment improves our 21 cm power spectrum reconstruction. Considering the MD30 configuration, the mean error in the power spectrum reconstruction decreases from 7.2%, without CBASS information, to 5.7% when we include the CBASS 5 GHz channel in the simulated data (MD30CBASS case).
The second important result is a near optimal reconstruction of the Hi signal in a 80 frequency channel configuration for BINGO experiment. In this case, we obtained a mean error in our power spectrum reconstruction of 3% in the multipole interval of . This result was obtained by comparing the component separation results with simulated data with different numbers of frequency bins. These foregrounds removal runs indicated a stabilization trend in the reduction of the 21 cm signal estimation error with the increase in the number of channels. More precisely, we found that the recovery quality of the Hi signal starts stabilizing at to , suggesting that it would not be worth using more than 100 redshift bins in the component separation process. The definition of the optimal number of frequency (redshift) bins will have a significant impact in the hardware configuration, helping to define the number of binning channels to preserve information from the raw data, sampling mode.
We also tested the effect of the increase in the number of realizations of Hi and noise, used in the debiasing procedure, on the quality of the 21 cm signal estimate. The mean power spectrum reconstruction error, calculated over all channels, obtained with is and with is . These results indicate, as expected, that a greater number of Hi and noise realizations allows a better estimation and correction of additive and multiplicative biases of the GNILC output power spectra. For an optimal choice of a more detailed analysis is necessary.
Finally, we repeated the entire component separation process for 10 and 50 different realizations of the BINGO simulated input data (sky noise), in the MD80 configuration, and obtained our final estimates of the reconstructed 21 cm spectra. We compared these results with the power spectrum of an independent 21 cm full-sky realization, considered here as the real map of Hi. Our estimated spectra are in good agreement with the input ones (independent realization). As expected, with 50 realizations it is possible to obtain a more accurate reconstruction of the Hi signal than with 10 realizations. The mean reconstruction error calculated in the range is equal to 6.3%, 3.4% and 2.8% for channels centered at 982 MHz, 1118 MHz and 1258 MHz.
Our results indicate that the debiasing procedure described in this work should work efficiently in BINGO data analysis pipeline. This suggests that, despite recovering the signal with good efficiency in the harmonic space covered by BINGO, a more detailed analysis of the debiasing procedure should be carried out in future works, particularly because we did not include the contribution to the overall noise in this analysis.
References
- Abdalla et al. (2021a) Abdalla, E. et al. 2021a, arXiv reprint:astro-ph [arXiv:2107.01633]
- Abdalla et al. (2021b) Abdalla, F. B. et al. 2021b, arXiv reprint:astro-ph [arXiv:2107.01635]
- Akaike (1974) Akaike, H. 1974, IEEE transactions on automatic control, 19, 716
- Alonso et al. (2019) Alonso, D., Sanchez, J., & Slosar, A. 2019, Mon. Not. Roy. Astron. Soc., 484, 4127
- Ansari & Magneville (2010) Ansari, R. & Magneville, C. 2010, Monthly Notices of the Royal Astronomical Society, 405, 1421
- Baccigalupi et al. (2004) Baccigalupi, C., Perrotta, F., de Zotti, G., et al. 2004, MNRAS, 354, 55
- Basak & Delabrouille (2012) Basak, S. & Delabrouille, J. 2012, Mon. Not. R. Astron. Soc., 419, 1163
- Basak & Delabrouille (2013) Basak, S. & Delabrouille, J. 2013, MNRAS, 435, 18
- Bennett et al. (2003) Bennett, C. L., Halpern, M., Hinshaw, G., et al. 2003, ApJS, 148, 1
- Betoule et al. (2009) Betoule, M., Pierpaoli, E., Delabrouille, J., Le Jeune, M., & Cardoso, J. F. 2009, A&A, 503, 691
- Bunn et al. (1994) Bunn, E. F., Fisher, K. B., Hoffman, Y., et al. 1994, ApJ, 432, L75
- Delabrouille et al. (2013) Delabrouille, J., Betoule, M., Melin, J. B., et al. 2013, A&A, 553, A96
- Delabrouille & Cardoso (2009) Delabrouille, J. & Cardoso, J. F. 2009, in Data Analysis in Cosmology, ed. V. J. Martínez, E. Saar, E. Martínez-González, & M. J. Pons-Bordería, Vol. 665 (Springer), 159–205
- Delabrouille et al. (2009) Delabrouille, J., Cardoso, J. F., Le Jeune, M., et al. 2009, A&A, 493, 835
- Delabrouille et al. (2003) Delabrouille, J., Cardoso, J. F., & Patanchon, G. 2003, MNRAS, 346, 1089
- Dragone (1978) Dragone, C. 1978, AT T Technical Journal, 57, 2663
- Eriksen et al. (2004) Eriksen, H. K., Banday, A. J., Górski, K. M., & Lilje, P. B. 2004, ApJ, 612, 633
- Eriksen et al. (2008) Eriksen, H. K., Jewell, J. B., Dickinson, C., et al. 2008, Astrophys. J., 676, 10
- Fornazier et al. (2021) Fornazier, K. et al. 2021, submitted to A%A
- Giardino et al. (2002) Giardino, G., Banday, A. J., Górski, K. M., et al. 2002, A&A, 387, 82
- Górski et al. (2005) Górski, K. M., Hivon, E., Banday, A. J., et al. 2005, Astrophys. J., 622, 759
- Haslam et al. (1982) Haslam, C. G. T., Salter, C. J., Stoffel, H., & Wilson, W. E. 1982, Astron. Astrophys. Suppl., 47, 1
- Jewell et al. (2004) Jewell, J., Levin, S., & Anderson, C. H. 2004, ApJ, 609, 1
- Jonas et al. (1998) Jonas, J. L., Baart, E. E., & Nicolson, G. D. 1998, Monthly Notices of the Royal Astronomical Society, 297, 977
- Jones et al. (2018) Jones, M. E., Taylor, A. C., Aich, M., et al. 2018, Monthly Notices of the Royal Astronomical Society, 480, 3224
- Larson et al. (2007) Larson, D. L., Eriksen, H. K., Wandelt, B. D., et al. 2007, ApJ, 656, 653
- Liccardo et al. (2021) Liccardo, V. et al. 2021, arXiv reprint:astro-ph [arXiv:2107.01636]
- Loureiro et al. (2019) Loureiro, A. et al. 2019, Mon. Not. Roy. Astron. Soc., 485, 326
- Maino et al. (2003) Maino, D., Banday, A. J., Baccigalupi, C., Perrotta, F., & Górski, K. M. 2003, MNRAS, 344, 544
- Maino et al. (2002) Maino, D., Farusi, A., Baccigalupi, C., et al. 2002, MNRAS, 334, 53
- McLeod et al. (2017) McLeod, M., Balan, S. T., & Abdalla, F. B. 2017, Monthly Notices of the Royal Astronomical Society, 466, 3558
- Miville-Deschênes et al. (2008) Miville-Deschênes, M. A., Ysard, N., Lavabre, A., et al. 2008, Astron. Astrophys., 490, 1093
- Murtagh & Heck (1987) Murtagh, F. & Heck, A. 1987, Multivariate Data Analysis, Astrophys. Sp. Sc. Lib. 131
- Olivari et al. (2016) Olivari, L. C., Remazeilles, M., & Dickinson, C. 2016, Mon. Not. R. Astron. Soc., 456, 2749
- Patanchon et al. (2005) Patanchon, G., Cardoso, J. F., Delabrouille, J., & Vielva, P. 2005, MNRAS, 364, 1185
- Peel et al. (2019) Peel, M. W., Wuensche, C. A., Abdalla, E., et al. 2019, Journal of Astronomical Instrumentation, 8, 1940005
- Peterson et al. (2006) Peterson, J. B., Bandura, K., & Pen, U. L. 2006, arXiv reprint:astro-ph, 0606104
- Planck Collaboration et al. (2016) Planck Collaboration, Aghanim, N., Ashdown, M., et al. 2016, A&A, 596, A109
- Reich & Reich (1986) Reich, P. & Reich, W. 1986, Astron. Astrophys. Suppl., 63, 205
- Remazeilles et al. (2011a) Remazeilles, M., Delabrouille, J., & Cardoso, J.-F. 2011a, Mon. Not. R. Astron. Soc., 410, 2481
- Remazeilles et al. (2011b) Remazeilles, M., Delabrouille, J., & Cardoso, J.-F. 2011b, MNRAS, 418, 467
- Remazeilles et al. (2015) Remazeilles, M., Dickinson, C., Banday, A. J., Bigot-Sazy, M. A., & Ghosh, T. 2015, Mon. Not. R. Astron. Soc., 451, 4311
- Saha et al. (2006) Saha, R., Jain, P., & Souradeep, T. 2006, ApJ, 645, L89
- Tegmark et al. (2003) Tegmark, M., de Oliveira-Costa, A., & Hamilton, A. J. 2003, Phys. Rev. D, 68, 123523
- Tegmark & Efstathiou (1996) Tegmark, M. & Efstathiou, G. 1996, MNRAS, 281, 1297
- Wandelt et al. (2004) Wandelt, B. D., Larson, D. L., & Lakshminarayanan, A. 2004, Phys. Rev. D, 70, 083511
- Wolz et al. (2015) Wolz, L., Blake, C., Abdalla, F. B., et al. 2015, arXiv e-prints, arXiv:1510.05453
- Wuensche et al. (2020) Wuensche, C. A., Reitano, L., Peel, M. W., et al. 2020, Experimental Astronomy, 50, 125
- Wuensche et al. (2021) Wuensche, C. A. et al. 2021, arXiv reprint:astro-ph [arXiv:2107.01634]
- Xavier et al. (2016) Xavier, H. S., Abdalla, F. B., & Joachimi, B. 2016, Mon. Not. R. Astron. Soc., 459, 3693