Disc dichotomy signature in the vertical distribution of [Mg/Fe]
and the delayed gas infall scenario
Abstract
Context. The analysis of the Apache Point Observatory Galactic Evolution Experiment project (APOGEE) data suggests the existence of a clear distinction between two sequences of disc stars in the [/Fe] versus [Fe/H] abundance ratio space: known as the high- and low- sequence, respectively. This dichotomy also emerges from the analysis of the vertical distribution of the [/Fe] abundance ratio.
Aims. We aim to test whether the revised two-infall chemical evolution models designed to reproduce the low- and high- sequences in the [/Fe] versus [Fe/H] ratios in the solar neighbourhood are also capable to predict the disc bimodality observed in the vertical distribution of [Mg/Fe] in APOGEE DR16 data.
Methods. Along with the chemical composition of simple stellar populations born at different Galactic times predicted by our reference chemical evolution models in the solar vicinity, we provide their maximum vertical height above the Galactic plane computed assuming the relation between the vertical action and stellar age in APOGEE thin disc stars.
Results. The vertical distribution of the [Mg/Fe] abundance ratio predicted by the reference chemical evolution models is in agreement with the one observed combining the APOGEE DR16 data (chemical abundances) and the astroNN catalogue (stellar ages, orbital parameters) for stars younger than 8 Gyr (only low- sequence stars). Including the high- disc component, the dichotomy in the vertical [Mg/Fe] abundance distribution is reproduced considering the observational cut in the Galactic height of kpc. However, our model predicts a too flat (almost constant) growth of the maximum vertical height quantity as a function of [Mg/Fe] for high- objects in contrast with the median values from APOGEE data. Possible explanations for such a tension are: i) the APOGEE sample with kpc is more likely contaminated by halo stars, causing the median values to be kinematically hotter, ii) external perturbations such as minor mergers that the Milky Way experienced in the past could have heated up the disc, and the heating of the orbits cannot be modeled by only scattering processes. Assuming for APOGEE-DR16 stars ( kpc) a disc dissection based on chemistry, the observed distributions for high- and low- sequences are in good agreement with our model predictions if we consider in the calculation the errors in the vertical action estimates. Moreover, a better agreement between predicted and observed stellar distributions at different Galactic vertical heights is achieved if asteroseismic ages are included as a constraint in the best-fit model calculations.
Conclusions. The signature of a delayed gas infall episode which gives rise to a hiatus in the star formation history of the Galaxy are imprinted both in the [Mg/Fe] versus [Fe/H] relation and in vertical distribution of [Mg/Fe] abundances in the solar vicinity.
Key Words.:
Galaxy: abundances - Galaxy: evolution - Galaxy: disc - Galaxy: kinematics and dynamics - ISM: general1 Introduction
The analysis of the Apache Point Observatory Galactic Evolution Experiment project (APOGEE) data (Nidever et al., 2014; Hayden et al., 2015; Ahumada et al., 2020; Queiroz et al., 2020; Vincenzo et al., 2021) highlighted the presence of two distinct sequences in the [/Fe] versus [Fe/H] abundance ratio space for disc stars: the so-called high- sequence, classically associated with an old population of stars in the thick disc, and the low- sequence, which mostly comprises of relatively young stars in the thin disc. This dissection has been also revealed by other observational campaigns: the Gaia-ESO survey (e.g., Recio-Blanco et al., 2014; Rojas-Arriagada et al., 2016, 2017) and the Archéologie avec Matisse Basée sur les aRchives de l’ESO project (AMBRE; Mikolaitis et al. 2017; Santos-Peral et al. 2021), the Galactic Archaeology with HERMES survey (GALAH; Buder et al. 2019, 2021) and the Large sky Area Multi Object fiber Spectroscopic Telescope (LAMOST; Yu et al. 2021).
Cosmological hydrodynamic simulations of Milky Way-like galaxies, (Kobayashi & Nakasato, 2011; Snaith et al., 2016) predict such a bimodality in the distribution of chemical elements. While in Vincenzo & Kobayashi (2020) this dichotomy is mainly attributed to the interplay between infall and ouflow events, in the dynamical model presented by Clarke et al. (2019) it arises from the fragmentation of the early gas-rich disc. On the other hand, in several theoretical models of Galactic disc evolution, it has been proposed that this bimodality is strictly connected to a delayed gas-accretion episode of primordial composition (i.e. Noguchi, 2018; Buck, 2020; Lian et al., 2020; Khoperskov et al., 2021; Agertz et al., 2021). Moreover, the AURIGA simulations presented by Grand et al. (2018) clearly point out that a bimodal distribution in the [Fe/H]-[/Fe] plane is a consequence of a significantly lowered gas accretion rate at ages between 6 and 9 Gyr. Verma et al. (2021) compared AURIGA simulations with 7000 stars with asteroseismic, spectroscopic, and astrometric data available, and concluded that the emerged abundance dichotomies in the [/Fe] versus [Fe/H] plane look qualitatively similar to observations.
Spitoni et al. (2019b) and Spitoni et al. (2020, herafter ES20) revised the classical two-infall chemical evolution model (Chiappini et al., 1997) in order to reproduce APOKASC (APOGEE+ Kepler Asteroseismology Science Consortium, Silva Aguirre et al. 2018) sample. They invoked the presence of a delayed gas infall episode ( 4 Gyr) in order to reproduce the high- and low- sequence stars including also precise asteroseismic ages as constraint. This delayed infall of gas gives rise to the low- sequence by bringing pristine metal-poor gas into the system which dilutes the metallicity of interstellar medium while keeping [/Fe] abundance almost unchanged. Similarly, also in Spitoni et al. (2021, herafter ES21) a significant delay between the two gas infall episodes is fundamental in order to reproduce APOGEE DR16 data in the solar vicinity, whereas in the innermost regions a chemical enriched gas infall is required in order to reproduce observed [Mg/Fe] versus [Fe/H] ratios as also suggested by Palla et al. (2020).
An inside-out formation of the thin disc of the Galaxy naturally emerges from the multi-zone chemical evolution model of ES21, i.e. the Milky Way formed on much shorter timescales in the inner than the outer regions. Such a mechanism has been found also in complex cosmological simulations of galaxy formation (Brook et al., 2012; Bird et al., 2013; Kobayashi & Nakasato, 2011; Vincenzo & Kobayashi, 2020). As underlined by Bird et al. (2013), the growth of the simulated galaxy also follows an “upside-down” evolution in the vertical direction, namely old stars form in a relatively thick component and are kinematically heated very quickly after their birth. Later on, low- stellar populations form in successively thinner disc. In principle, this is in agreement with the assumptions of the two-infall model, shorter time-scales of gas accretion characterise the formation of the thick disc. However, the above-mentioned ES20 and ES21 models could make predictions just on projected quantities on the Galactic plane. Our principal aim with this work is to study the vertical distribution of chemical elements assuming simplified dynamical prescriptions using these chemical evolution models.
In fact, in order to better understand the processes that dominated the formation and evolution of the Galactic disc, it is crucial to compare model predictions with also the observed vertical [/Fe] distribution of stars at different heights above the Galactic plane. In the past, the vertical abundance gradients have been subject of several investigations. For instance, Schlesinger et al. (2014) analysed G dwarfs from the Sloan Extension for Galactic Understanding and Exploration (SEGUE) survey, and showed the presence of negligible vertical metallicity gradient in the Milky Way’s disc for different [/Fe] subsamples. It suggests that stars formed in different epochs shared similar star formation processes and evolution. Mikolaitis et al. (2014) used the spectra of around 2000 FGK dwarfs and giants from the Gaia-ESO survey iDR1, and found that thick disc stars show a shallower vertical metallicity gradient than the thin disc, an [/Fe] ratio gradient in the opposite sense than that of the thin disc, and positive vertical individual [/M] and [Al/M] gradients (where M is the metallicity). Duong et al. (2018), using data from the GALAH survey, determined the vertical properties of the Galactic thin and thick discs near the solar neighbourhood. The median [/M] increases as a function of height, as noted previously by Schlesinger et al. (2014) and Mikolaitis et al. (2014). However, unlike the metallicity, they find that the -abundance profile does not vary smoothly with .
Beside the chemical signatures, the orbital properties of stars and in particular the change of dynamical actions over time could provide important constraints on the main evolutionary processes that have determined stellar redistribution. In Beane et al. (2018) and Ness et al. (2019) the connections between dynamical actions, ages, and chemical abundances in disc stars were discussed. In particular, Gandhi & Ness (2019) found that at all ages, the high- and low- sequences are dynamically distinct and that selections in the actions space can provide an efficient method to separate distinct dynamical populations.
More recently, Vincenzo et al. (2021) highlighted the presence of bimodality in the vertical [/Fe] distribution of APOGEE DR16 that can be well modelled adopting a double Gaussian stellar distribution: one component describing the low- population with scale height kpc and one describing the high- population with scale-height kpc.
In this article, we compare the vertical structure of the [Mg/Fe] distribution as emerging from APOGEE DR16 data in the solar neighborhood with the results of revised two-infall chemical evolution models presented by ES20 and ES21. To do so, besides the predicted chemical composition of simple stellar populations (SSPs, defined as an assembly of coeval and chemically homogeneous stars) formed at different Galactic times, we also provide the respective orbital parameters (i.e. maximum vertical height above the Galactic plane ) computed using the recent relation between the vertical action and stellar age found for APOGEE thin disc stars (Ting & Rix, 2019). The main scope of this work is to confirm that the disc bimodality found in APOGEE DR16 stars in the [/Fe] versus Galactic vertical height (Vincenzo et al., 2021) can also be interpreted as the signature of a delayed accretion of gas which happened about Gyr after the Galactic formation.
The paper is organised as follows. In Section 2, the observational data will be presented. In Section 3, we draw the main characteristics of the reference chemical evolution models for the high- and low- adopted in this study. In Section 4, we describe the adopted methodology to compute for stars born at different Galactic times and the vertical [Mg/Fe] gradient. In Section 5, we present our results and finally, in Section 6, we draw our conclusions.
2 APOGEE DR16 data and astroNN catalogue
In this study, we consider Mg and Fe abundances provided by APOGEE DR16 (Ahumada et al., 2020) for investigating the region with Galactocentric distances between 6 and 10 kpc as computed by Leung & Bovy (2019) and reported in the value-added catalogue astroNN111https://data.sdss.org/sas/dr16/apogee/vac/apogee-astronn catalogue. astroNN is a deep-learning software, which was applied to APOGEE DR16 spectra in order to determine stellar parameters, distances (Leung & Bovy, 2019), and ages (Mackereth et al., 2019). In addition, the above-mentioned catalogue includes some of the most important orbital properties for stars (i.e. eccentricities, peri/apocenter radii, maximal disc height , orbital actions, frequencies and angles) computed by Mackereth & Bovy (2018) assuming the MWPotential2014 gravitational potential from Bovy (2015).
Following ES21, we choose only stars that are part of the Galactic disc with the same quality cuts suggested in Weinberg et al. (2019) assuming signal-to-noise ratio , logarithm of surface gravity between .
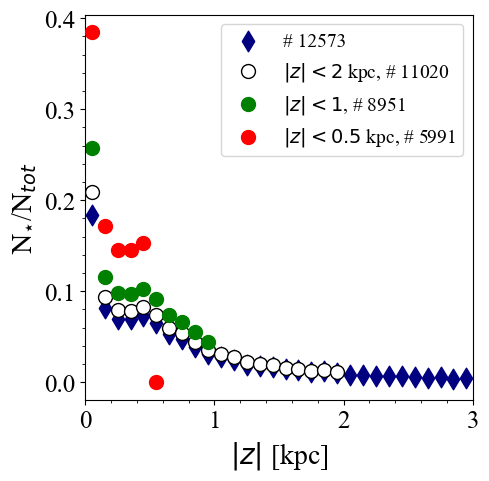
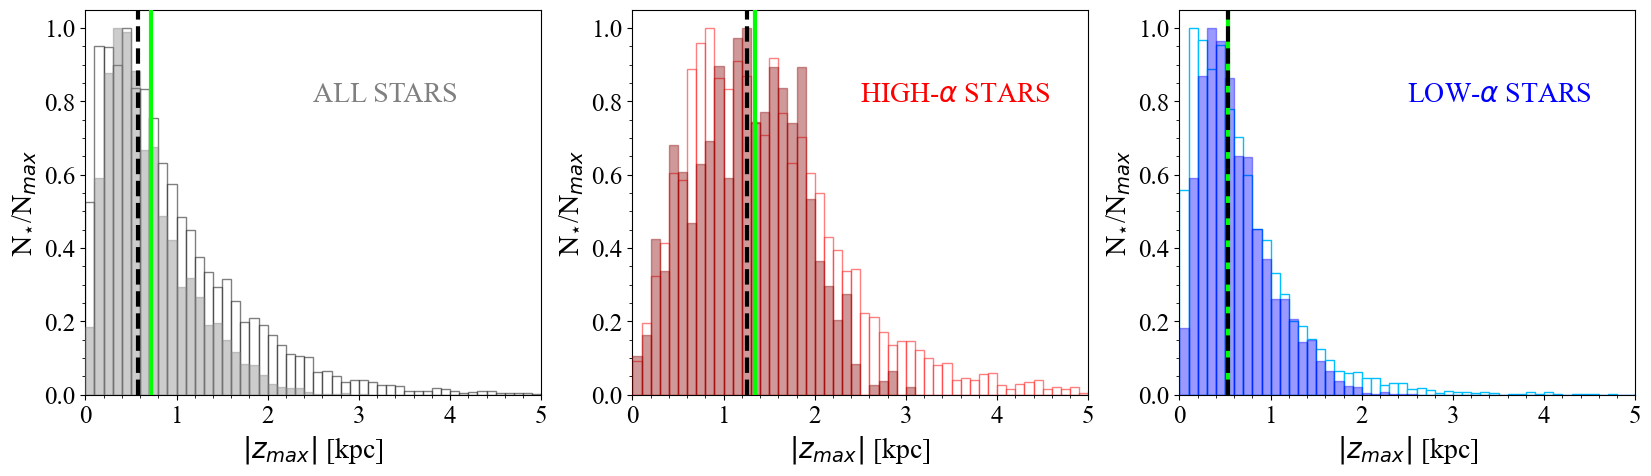
In this study, we analyse different regions above and below the Galactic planes, considering stars with the following observed vertical heights: kpc, kpc, and kpc in order to better analyse the vertical structure. In Fig. 1, we note that the vertical distribution with kpc resembles well the behaviour of the whole APOGEE-DR16 stellar sample in the region with Galactocentric distances enclosed between 6 and 10 kpc.
As underlined by Weinberg et al. (2019), the adopted selection in leaves only stars on the upper red giant branch (RGB), i.e. the most luminous ones. It ensures that the stars in our sample can be observed by APOGEE over most of the distance range considered in this study, minimizing distance-dependent changes in the population being analysed.
3 Chemical evolution models for solar vicinity
In this Section, we introduce the main assumptions of the two-infall chemical evolution model proposed by ES20 and ES21, providing a few details on the parametrization of the infall and star formation. In both models, the Milky Way disc is assumed to be formed by two distinct episodes of gas accretion onto the Galactic plane (i.e. with null vertical height, kpc). The gas infall rate is expressed as follows:
| (1) |
where and are the infall time-scales for the thick and thin disc components, respectively. The coefficient indicates the delay of the beginning of the second infall, hence the time for the maximum accretion rate on the second infall episode. Finally, the quantities and are obtained imposing a fit to the observed current total surface mass density in the solar neighbourhood. As for the total surface density in the solar neighborhood we adopted the value of 47.1 3.4 M suggested by McKee et al. (2015). We stress that these chemical evolution models do not make any assumption about the vertical growth of the gaseous and stellar discs.
In both ES20 and ES21 models the numerical treatment is based on Matteucci´s chemical evolution code (all the details could be retrieved in the review Matteucci 2021 and in the book Matteucci 2012). The star formation rate (SFR) is expressed as the Kennicutt (1998) law, , where is the gas surface density, and is the exponent. The quantity is the star formation efficiency (SFE) and it is fixed to the values of Gyr-1 and Gyr-1 for the high- and low- sequences, respectively (see Table 1). The type Ia SN rate has been computed following Greggio & Renzini (1983) and Matteucci & Greggio (1986) prescriptions (see Spitoni et al. 2009 for the rate expression).
Although the disc bimodality in the [/Fe] versus [Fe/H] space in a simulated Milky Way-like galaxy in the cosmological framework of Vincenzo & Kobayashi (2020) is attributed to the interplay between infall and ouflow events, in ES20 and ES21 no Galactic winds have been considered. This choice has been motivated by Melioli et al. (2008, 2009) and Spitoni et al. (2008, 2009) studies on the Galactic fountains (i.e., processes originated by the explosions of Type II SNe in OB associations). They found that the ejected metals fall back close to the same Galactocentric region where they are delivered and thus do not modify significantly the chemical evolution of the disc as a whole.
The adopted nucleosynthesis prescriptions are the ones suggested by François et al. (2004). We briefly recall here the main assumptions for the chemical elements analysed in our study (i.e., Mg and Fe). The authors modified the Mg yields from massive stars from Woosley & Weaver (1995) to reproduce the solar abundance value. Mg yields from stars in the range 11-20 M⊙ have been increased by a factor of 7 whereas those from stars in the mass range 20 MM 100 M⊙ are lower than predicted by Woosley & Weaver (1995) by a factor of 2 on average. No modifications are needed for the yields of Fe, as computed for solar chemical composition. The complete grid of the modified yields can be retrieved from Table 1 of François et al. (2004).
Concerning Type Ia SNe, the theoretical Mg yields by Iwamoto et al. (1999) have been increased by a factor of 5, in order to preserve the observed pattern of [Mg/Fe] versus [Fe/H]. The assumed IMF contains much less massive stars than other works in the community, and this affects the Mg enrichment, requiring more Mg from Type Ia SNe. The prescription for single low- and intermediate- mass stars is from van den Hoek & Groenewegen (1997), for the case of the mass loss parameter which varies with metallicity (see Chiappini et al., 2003, model5).
The choice of such ad-hoc nucleosynthesis prescriptions is supported by the fact that stellar yields are still a relatively uncertain component of chemical evolution models (Romano et al., 2010). This set of yields has been widely used in the past by Matteucci’s group in Trieste (see Matteucci 2021) and turned out to be able to reproduce the main features of the solar neighbourhood (e.g., Cescutti et al., 2007; Spitoni & Matteucci, 2011; Mott et al., 2013; Spitoni et al., 2014, 2017, 2015, 2019a, 2019b; Vincenzo et al., 2019). Updated nucleosynthesis prescriptions for massive stars in the galactic chemical evolution of Mg still present problems in reproducing the stellar data. For instance, Prantzos et al. (2018) presented chemical evolution with metallicity-dependent weighted rotational velocities by Chieffi & Limongi (2013) but, as adopting the yields of Woosley & Weaver (1995), the evolution of Mg is not well reproduced. In Kobayashi et al. (2020), using the coalescence’s for massive stars from Kobayashi & Nakasato (2011) and in presence of failed SNe, they were able to reproduce the [Mg/Fe] versus [Fe/H] in the solar neighbourhood. Côté et al. (2017) studying the chemical evolution of Sculptor using the NuGrid stellar yields (Ritter et al., 2018), highlighted that the model results underestimated the observed [Mg/Fe] versus [Fe/H] relation.
In order to be consistent with François et al. (2004) prescriptions, the initial stellar mass function (IMF) formalised by Scalo (1986) is adopted and assumed constant in time and space. More recent IMF formulations has been assumed in the chemical evolution model of Kobayashi et al. (2020) (Kroupa 2008 IMF), Prantzos et al. (2018) (Kroupa 2002 IMF) but still high-mass end is highly uncertain and affected by large systematic uncertainty (also due to binary fraction).
A Bayesian framework based on MCMC methods222The affine invariant MCMC ensemble sampler code, ”emcee: the mcmc hammer”, developed by Goodman & Weare (2010); Foreman-Mackey et al. (2013) was used to sample the posterior probability distribution. was used in ES21 to fit the APOGEE DR16 chemical abundance ratios at different Galactocentric distances, whereas models in ES20 were constrained by both chemical abundances and stellar ages (APOKASC sample). In both cases, the free parameters of the model were: the infall time-scales and , present-day total surface mass density ratio between the low- and high- sequences, and the delay . More details on these parameters are provided in the next Sections, 3.1 and 3.2.
3.1 The reference model from ES20
In ES20, the presented chemical evolution models have been designed to fit the observed chemical abundance ratios and asteroseismic ages of the APOKASC stars (Silva Aguirre et al., 2018). This sample had about 1200 red giants from an annular region with a width of 2 kpc in the solar vicinity. The stellar properties for this sample were determined by fitting the photometric, spectroscopic, and asteroseismic observables using the BAyesian STellar Algorithm code (BASTA; Silva Aguirre et al., 2015, 2017; Aguirre Børsen-Koch et al., 2021). In Table 1, we report the best-fit model parameters as predicted by the MCMC calculation performed with Gyr-1 and Gyr-1 (case M2 in their paper). In agreement with the classical two-infall model by Chiappini et al. (1997), the first gas infall is characterised by a short timescale of accretion (). Furthermore, we notice the presence of a significant delay between the two infall accretion episodes ( 4.6 Gyr), as originally found by Spitoni et al. (2019b) but without performing any quantitative analysis for parameter estimation. An additional observational evidence supporting this scenario has been presented by Nissen et al. (2020) analysing the High Accuracy Radial velocity Planet Searcher (HARPS) spectra of local solar twin stars. They found that the age-metallicity distribution shows the presence of two diverse populations characterised by a clear age separation. The authors suggested that these two sequences may be interpreted as evidence of two episodes of accretion of gas onto the Galactic disc with quenching of star formation in between them.
3.2 The reference model from ES21
In ES21, they presented a multi-zone two-infall chemical evolution model with quantitatively inferred free parameters by fitting the APOGEE DR16 (Ahumada et al., 2020) abundance ratios at different Galactocentric distances. In particular, the model computed at 8 kpc has been constrained by the [Mg/Fe] and [Fe/H] ratios of about 9200 stars located in the annular region enclosed between 6 and 10 kpc and vertical height ¡ 1 kpc. A significant difference between this model and that of ES20 emerges from Table 1; the shorter timescales and are predicted by ES21 model compared to ES20 model. This is due to the fact that stellar ages from asteroseismology were not available for constraining the chemical evolution models in the case of ES21. The predicted present-day total surface mass density ratio between the low- and high- sequences of , is in very good agreement with the ratio derived by Fuhrmann et al. (2017) for local mass density ratio of . The presence of an important delay is confirmed also in this case as shown in Table 1. In addition, the model reproduces important observational constraints of the whole Galactic disc, such as the present-day [Mg/H] abundance gradient, the profiles of the SFR, the stellar and gas surface densities radial distributions (see Section 4.3 of Spitoni et al. 2021 for a discussion on the global properties of the Galactic disc reproduced by ES21 model).
| Models | ||
|---|---|---|
| ES20 | ES21 | |
| [Gyr] | 1.264 | 0.103 |
| [Gyr] | 11.282 | 4.110 |
| / | 4.176 | 5.635 |
| [Gyr] | 4.624 | 4.085 |
4 Stellar Orbital properties: the vertical action, , and the maximum vertical height,
First in Section 4.1, we briefly recall the relation between the average vertical action and the stellar ages proposed by Ting & Rix (2019). In Section 4.2, we discuss the conservation of the vertical action in steady-state potentials and in “real” late-type galaxies. Finally, in Section 4.3 we compute the maximum vertical excursion from the Galactic midplane as a function of the stellar ages using both the Ting & Rix (2019) relation and the conservation of the vertical action.
4.1 Ting & Rix (2019) relation for solar vicinity
The action-angle variables are useful quantities to describe the evolution of stellar orbits in steady-state potentials. In particular, here we are interested in the vertical action , defined as:
| (2) |
where and indicate the vertical height and velocity along the orbit, respectively. The vertical action thus quantifies the movement along the direction of the orbit of a star. These actions are integrals of motions and thus in a static, axis-symmetric potential, they are conserved quantities (see the discussion in next Section). Ting & Rix (2019) presented a parametric model for the variation of vertical action distribution (i.e. global vertical temperature) analysing the subsample of APOGEE red clump stars in the Galactic disc (Ting et al., 2018) with proper motions from the Gaia DR2 (Gaia Collaboration et al., 2018). In Ting & Rix (2019), ages have been computed establishing an empirical, high-dimensional mapping from the APOGEE normalised spectra to stellar ages via a fully connected neural network.
Because red clump stars are strongly biased against stars older than 8 Gyr, Ting & Rix (2019) considered only thin disc stars as a function of the age , stars younger than 8 Gyr in their model. They claimed the existence of a neat relation between the vertical action and the stellar age, i.e. versus . Ting & Rix (2019) interpreted the distribution of the vertical actions as combination of the vertical action at birth (i.e. vertical birth temperature) which characterised stars when formed out of the Galactic disc, plus the subsequent heating (defined as an increase in ) that occurred subsequently). This relation computed at the solar radius can be written as:
| (3) |
where on the right side the factor is associated with vertical birth temperature, and the second term indicates the age dependence of the vertical action (after birth) which follows a power law of exponent . In Eq. (3), we label the vertical action with instead of to stress that the proposed model is designed to fit the global observed relation for stellar ages and it should not be interpreted as the temporal evolution of the vertical action of a single stellar population.
This relation suggests that the vertical heating of all stellar populations is dominated by orbit scattering but the scattering amplitude varies with the Galactic epoch. Ting & Rix (2019) showed that a model with an exponential decrease in the SFR and an inside-out growth of the stellar disc can reproduce the range of power-law indices.
4.2 On the conservation of the vertical action for Galactic disc stars
The existence of a non-classical integral of motion, associated with the actions of the system, including the vertical action , has been widely discussed by Binney & Spergel (1984). Moreover, in presence of a Galactic potential that changes slowly with time, the vertical action can be considered as an adiabatic invariant. For instance, the cylindrical adiabatic approximation was introduced by Binney (2010) to describe the distribution of stars in the Galactic disc. The author argued that since the vertical frequency of a disc star is significantly larger than its radial frequency, the potential that affects vertical oscillations may be considered to vary slowly as the star oscillates radially, with the consequence that is adiabatically invariant. Hence, if the vertical action is an adiabatic invariant, it can also be considered as an approximate invariant under radial migration through churning (Carlberg, 1987; Sellwood, 2013). For this reason, it seems appropriate to characterise the vertical motions of stars by their vertical actions, , rather than their vertical velocities or velocity dispersion (in fact, will change in a growing potential and under radial migration).
In principle, external spiral galaxies characterised by high frequency of vertical motion compared to in-plane evolution should be the perfect candidates where vertical action is a conserved quantity. However, Solway et al. (2012) showed that for isolated galaxies the vertical action is not a constant of motion of individual stars, and is only conserved on average for a sample of stars, with an intrinsic dispersion of . Furthermore, Vera-Ciro & D’Onghia (2016) using high-resolution N-body simulations of Milky Way-like discs showed that stars deviate from near-circular orbits, reducing the degree at which the actions are conserved for individual stars.
Bearing in mind all the above-mentioned caveats for late-type galactic systems in presence of spiral arms like the Milky Way, in the next Section we will compute orbits for Galactic disc SSPs born at different times considering the vertical action as a conserved quantity for coeval stars.
4.3 Computing the orbital maximum vertical excursion and the vertical [Mg/Fe] gradient
We assume for the Galaxy the three component steady-state MWPotential2014 gravitational potential of Bovy (2015). The potential model consists of: i) a bulge modeled as a power-law density profile that is exponentially cut-off; ii) a Miyamoto-Nagai (Miyamoto & Nagai, 1975) disc; and iii) a dark-matter halo described by the Navarro, Frenk & White (NFW, Navarro et al. 1996) profile. All parameters and properties of MWPotential2014 potential are listed in the Table 1 of Bovy (2015).
Following the discussion in Section 4.2, we impose that each SSP born at 8 kpc in the Galactic plane and initial vertical height coordinate kpc at a certain Galactic evolutionary time , conserves the average vertical action in their orbit subject to the gravitational potential of the Galaxy.
In the calculations, we consider SSPs formed in constant age intervals fixed at the value of 0.005 Gyr (the total number of SSPs is 2740), which is identical to the time-step of the chemical evolution model. Recalling the Ting & Rix (2019) relation introduced in Section 4.1 and associated discussion, the value of conserved vertical action for a SSP with age can be estimated using Eq. (3), where is the age of the Galaxy.
We integrate stellar orbits for different SSPs() using the galpy333http://github.com/jobovy/galpy package subject to the MWPotential2014 gravitational potential (Bovy, 2015). For the rotational velocity at the solar distance we use the one computed by Ablimit et al. (2020) applying the three-dimensional velocity vector method for Cepheids ( ± 0.83 ) that is consistent with the most recent estimation by Nitschai et al. (2021) with a dynamical model of the Milky Way using APOGEE and Gaia data. The initial vertical velocity for the SSP born at the evolutionary time has been chosen by satisfying the following condition:
| (4) |
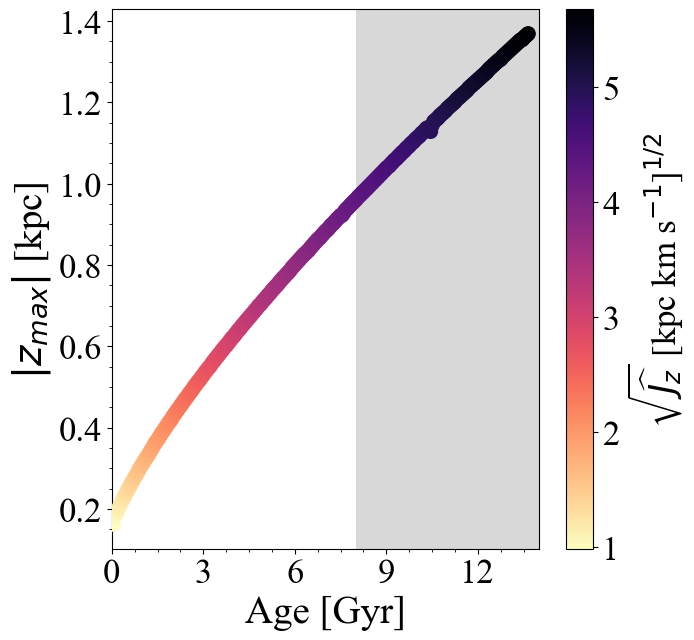
i.e., the computed vertical action with galpy and the one with Eq. (3) differ less than [kpc km s-1]. In Fig. 2, we show the maximum vertical excursion from the midplane as a function of the SSP ages and vertical action with an age resolution of Gyr assuming that initial vertical height is kpc at any Galactic time (all the stars are born exactly right in the disc plane).
One of the most important conclusions of Ting & Rix (2019) is that orbital scattering is a plausible and viable mechanism to explain the age-dependent vertical motions of disc stars. Hence, here we assume that the star formation happens in the disc plane with null vertical height ( kpc) where the infalling gas gets accreted (see Eq. 1). Higher vertical coordinates (see Fig. 2) can be reached only by older SSPs because of the kinematic scattering. Here, we are ignoring the extra-heating processes from merging events in which stars from galactic systems are engulfed by the Galaxy (Helmi et al., 2018).
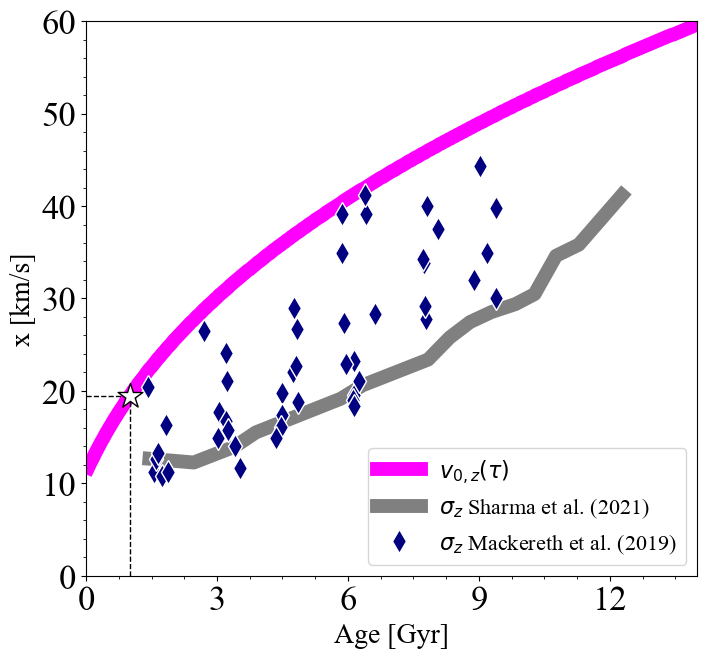
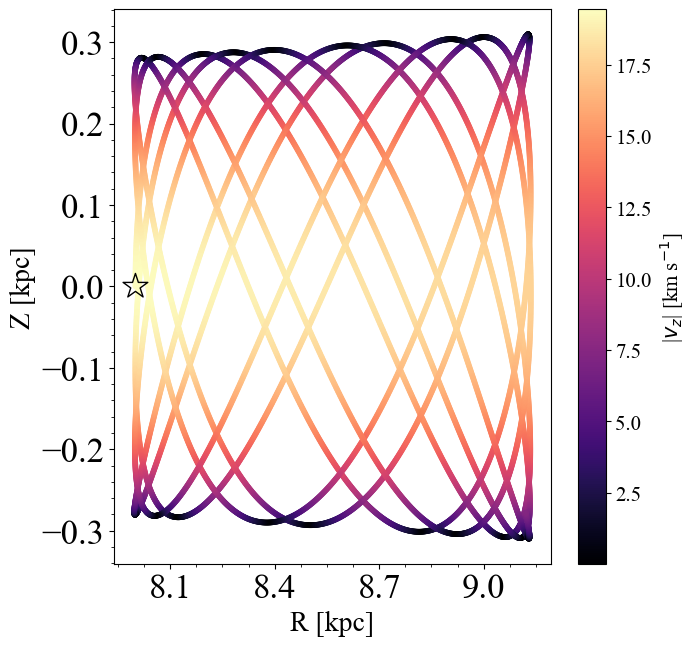
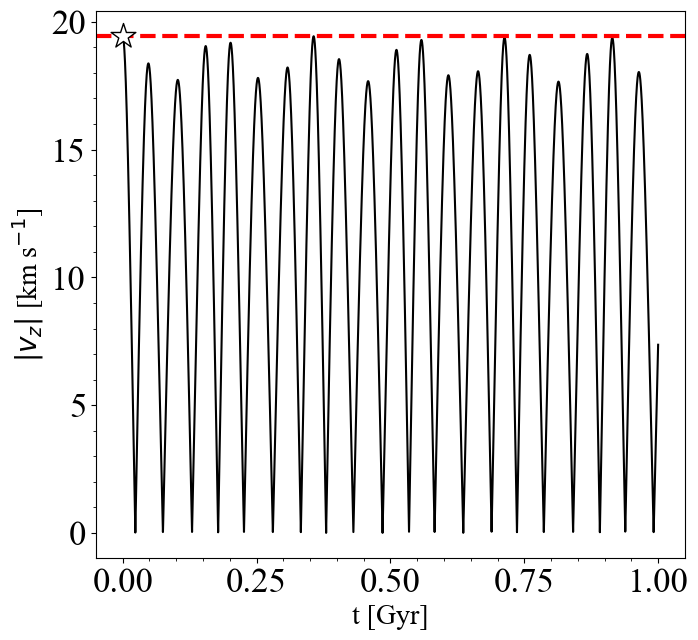
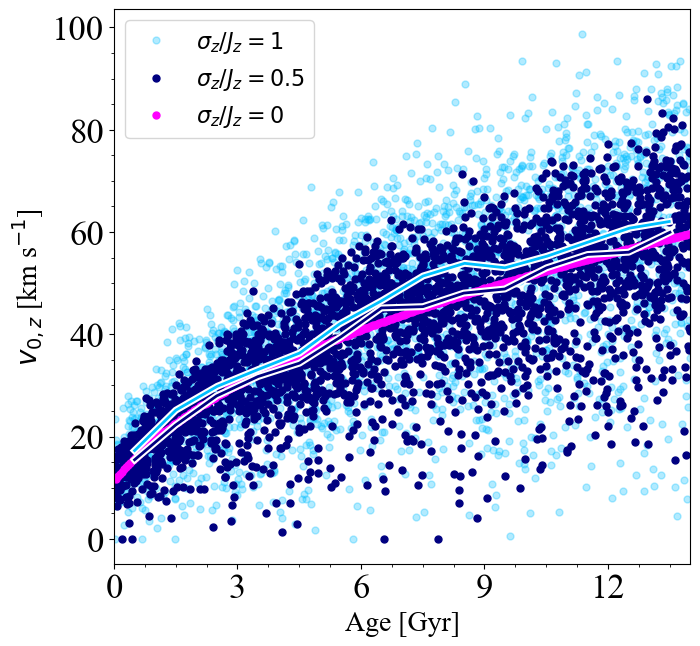
In Fig. 3, we show the initial vertical velocities as the function of the Galactic age for the SSPs born at different evolutionary times . In presence of the steady-state gravitational potential MWPotential2014, the initial vertical velocity of one SSP formed in the Galactic plane (with initial vertical height kpc) in the solar neighborhood also corresponds to the maximum vertical velocity of the orbit. In fact, in Fig. 3 we also show the temporal evolution of the modulus of the vertical velocity component of the SSP born in the Galactic plane ( kpc) at 8 kpc at the Galactic time Gyr and integrated for 1 Gyr. It is evident that the vertical velocity at the SSP birth Gyr) corresponds to the maximum value of the modulus of vertical velocity .
Because of the symmetry of the system, we can consider this quantity as an estimate for the upper limit of the vertical velocity dispersion at the Galactic age . Hence, considering all the SSPs born at different evolutionary times we can estimate the upper limit of the observed vertical velocity dispersion versus Galactic age relation. In Fig. 3, we compare the predicted values with the age- relations observed in the solar vicinity by Mackereth et al. (2019) analysing APOGEE stars and by Sharma et al. (2021) for GALAH objects. In Fig. 3, each Mackereth et al. (2019) data point represents a mono-[Fe/H] bins that have more than 200 stars. We note that the computed initial velocity distribution traces very well the upper limit of the age- relation.
As mentioned in the Introduction, the ES21 model predicts that the Galactic disc follows an inside-out formation and consequently the Galactic potential should evolve as a function of time as well. In the Milky Way-like galaxy in the cosmological context presented by Bird et al. (2013) and characterised by an inside-out formation, the surface stellar mass density and the median height above the disc (of stellar populations born at different Galactic ages) did not vary much in the last 8 Gyr at the solar distance. This implies that the inside-out formation did not affect substantially the Galactic potential at Galactic ages ¡ 8 Gyr. Hence, a static potential for the integration of the orbit of stars with ages ¡ 8 Gyr (see Fig. 4) is a valid approximation. However, this could not be true when we extend the Ting & Rix (2019) relation to older ages, then it is important to stress this caveat of our approach.
In the next Section we will show model predictions combining together the [Mg/Fe] abundance ratio for stars born at different Galactic times (i.e. with different ages ) as predicted with chemical evolution models presented in Section 3 with the maximum orbital height above the plane ( computed as described in Section 4.3.
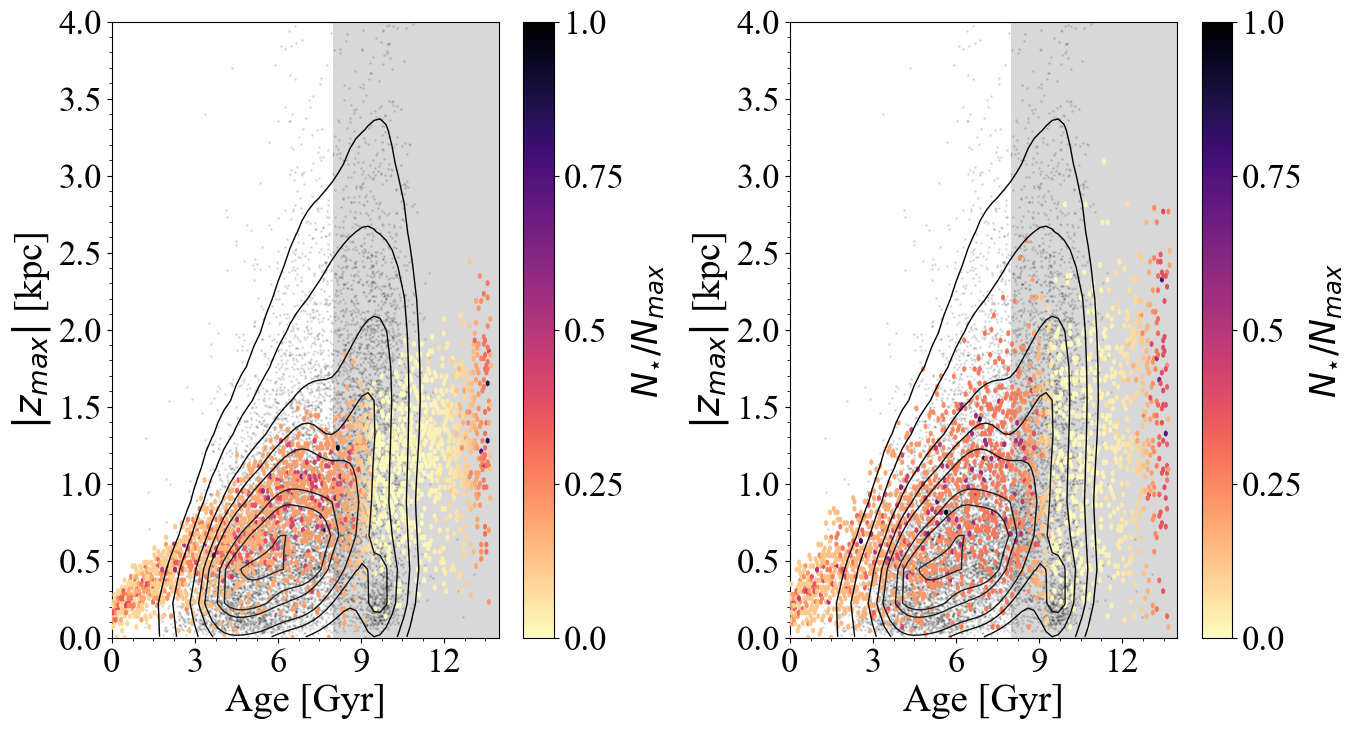
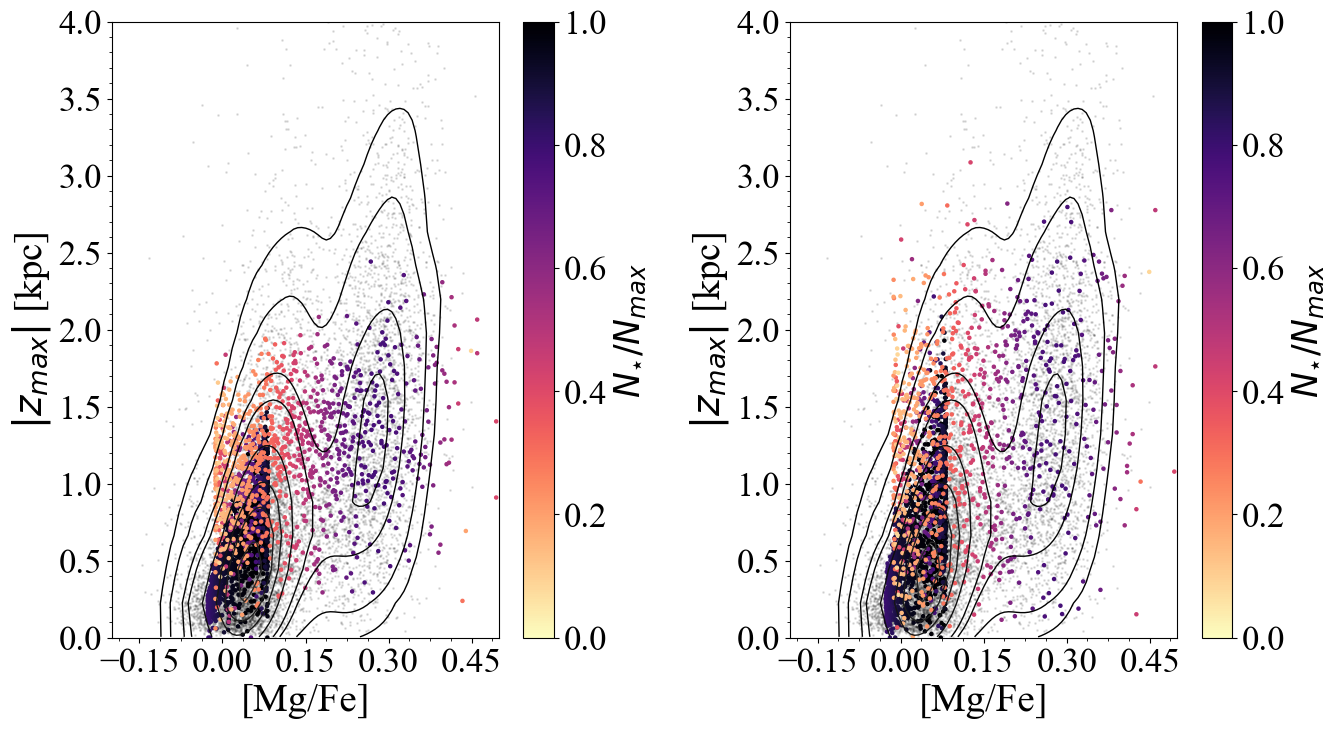
The vertical maximum excursion versus age relation for the ES21 model. The grey points indicate stars within Galactocentric region between 6 and 10 kpc and kpc as reported in the astroNN catalogue. The contour lines enclose fractions of 0.95, 0.90, 0.75, 0.60, 0.45, 0.30, 0.20 and 0.05 of the total number of observed stars. The colour coding represents the total number of stars predicted by the ES21 model in that region. In the left panel we draw model results considering a Gaussian error (see Eq. 5) with standard deviation , whereas in the right one we assume . The shaded grey area highlights the region with ages larger than 8 Gyr, for which the use of Eq. (3) may not be justified. Lower panels: As the upper ones but for the versus [Mg/Fe] relations.
5 Results
We compare the vertical [Mg/Fe] abundance distribution in the solar vicinity predicted by chemical evolution models presented in Section 3 to the observed APOGEE DR16 stellar abundance ratios and the associated orbital properties and ages as presented in the astroNN catalogue (see Section 2). We show results for both in the case where all stars are younger than 8 Gyr and in the case including all ages. We recall that Ting & Rix (2019) relation for the vertical action (Eq. 3) has been recovered for stellar ages smaller than 8 Gyr (thin disc stars). Here, we test whether extending this relation to older stellar populations allow us to reproduce the vertical distribution of the [Mg/Fe] abundances in APOGEE data for the full age range.
5.1 ES21 model
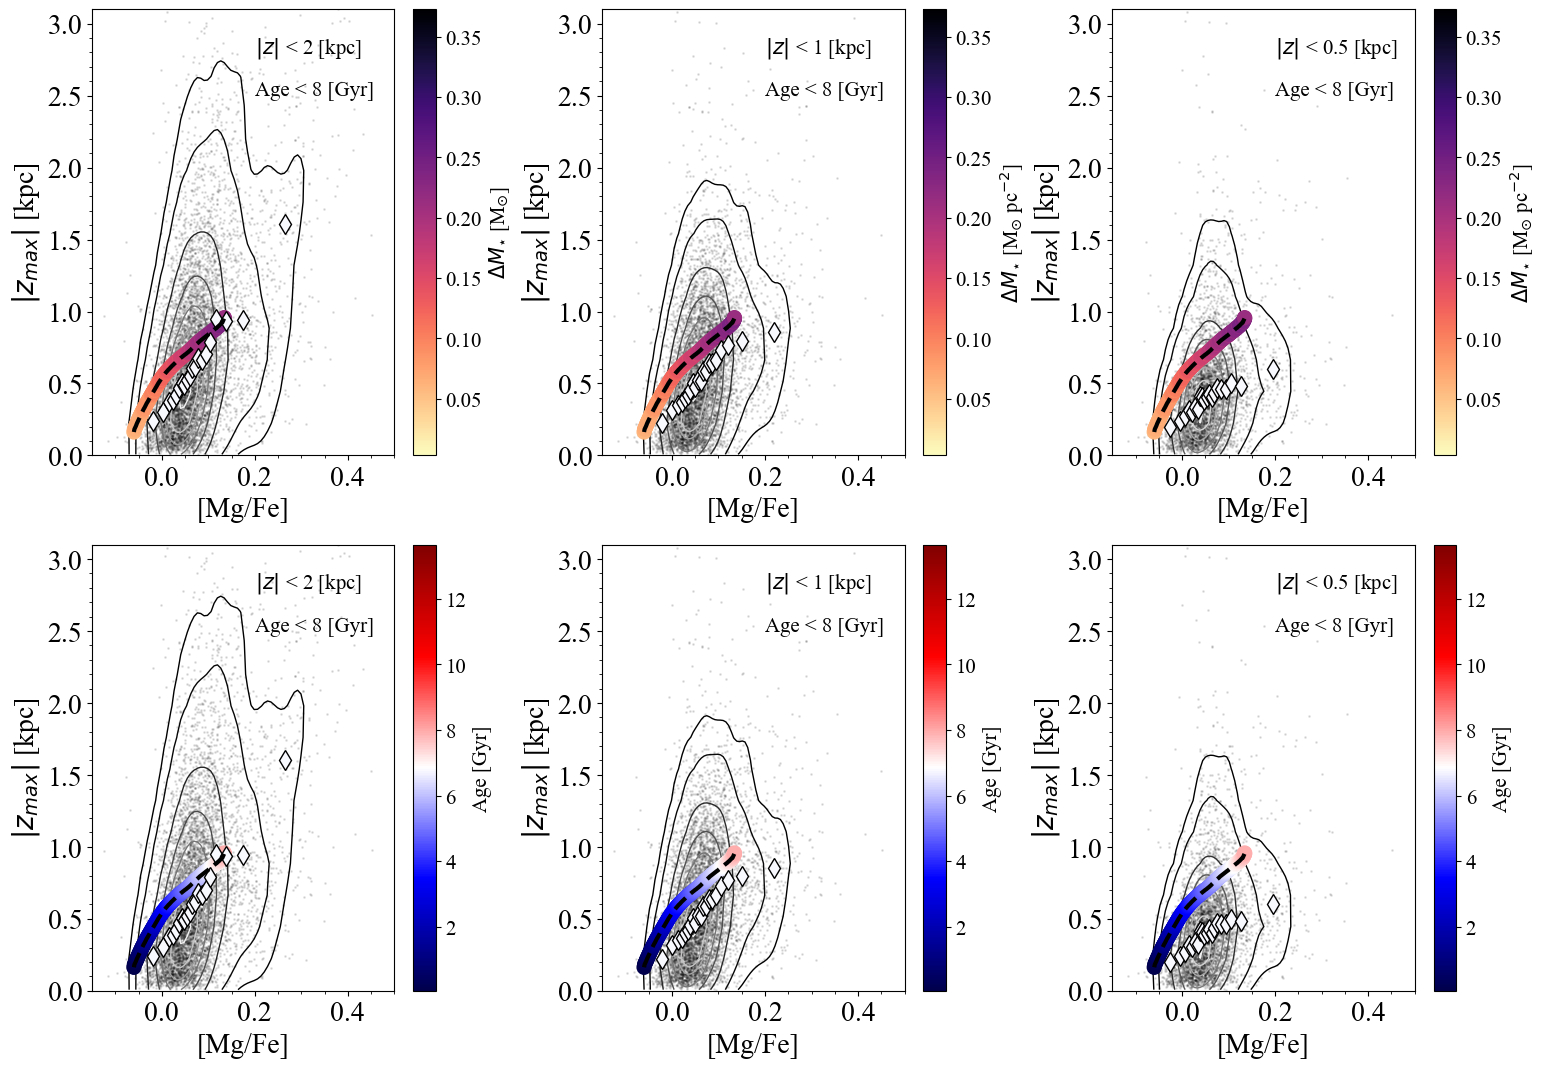
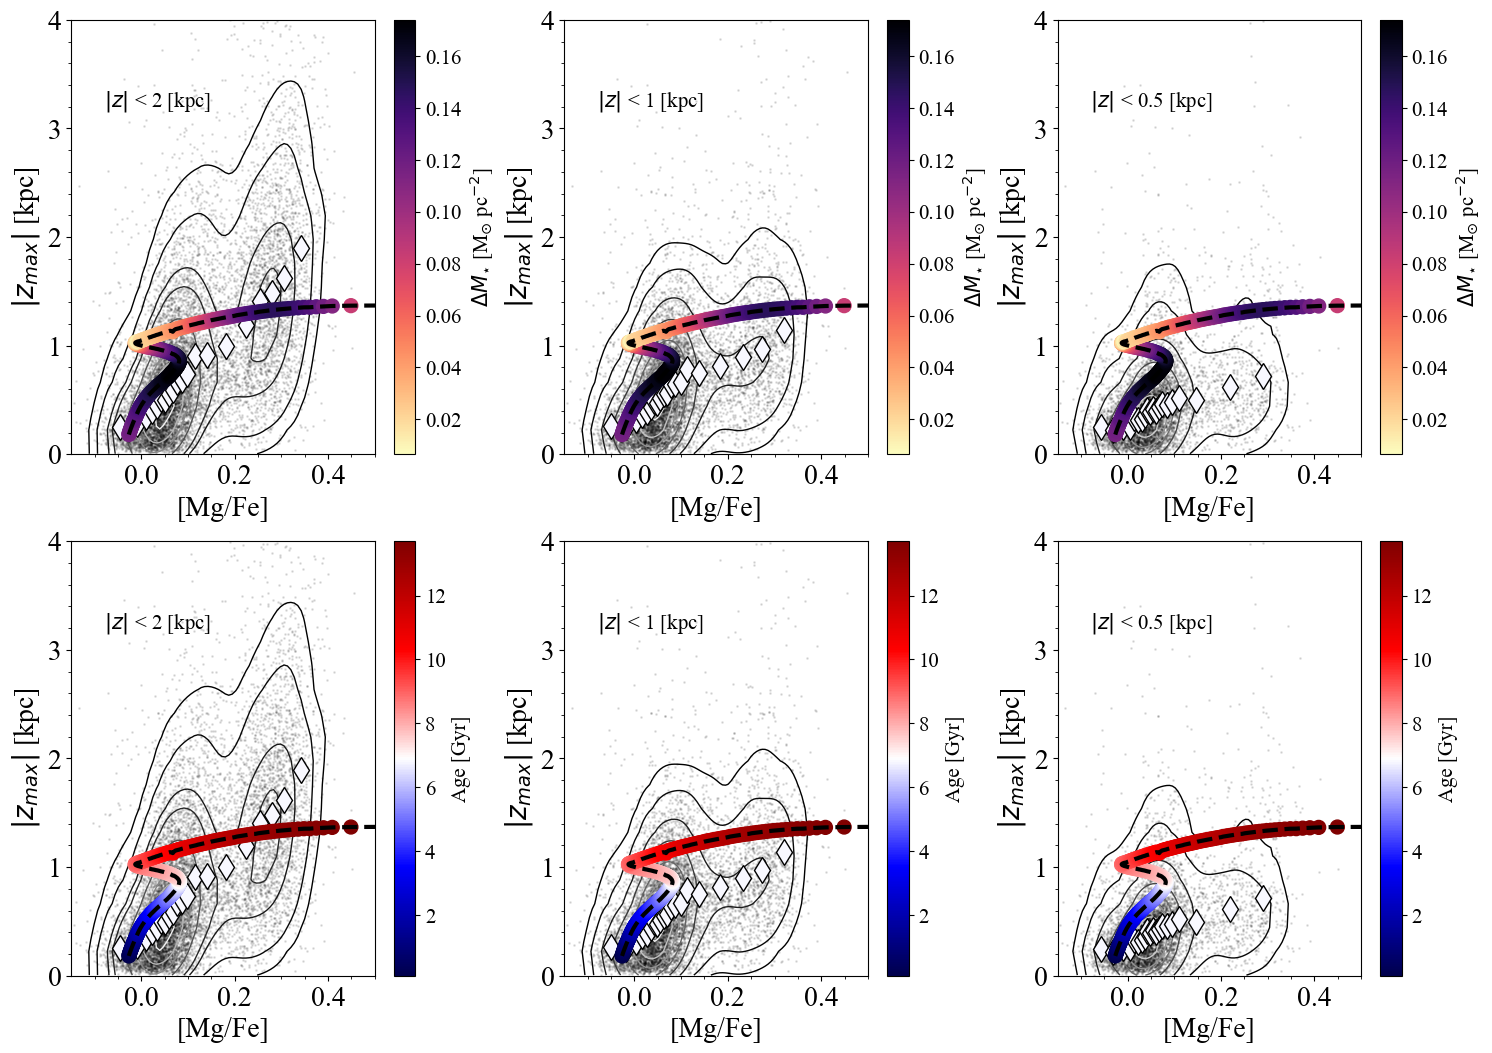
In Fig. 4, we show vertical abundance distributions using ES21 model computed at 8 kpc as expressed by relation between the maximum vertical height (see the methodology in Section 4.3) versus the [Mg/Fe] abundance ratios for stars with ages ¡ 8 Gyr. We considered different cuts in the observed Galactic vertical heights, i.e. kpc, kpc and kpc, in order to better analyse the vertical structure.
Observed stars with astroNN ages younger than 8 Gyr are more likely part of the low- sequence. In fact, the vertical [Mg/Fe] abundance gradient seems to be traced by a single stellar sequence as visible from the contour density lines: the contour which encloses the 75% of the stars presents the absence of any elongated structure towards higher [Mg/Fe] values and hence without trace of bimodality.
In Fig. 4, we note that the observed versus [Mg/Fe] relations traced by stars having observed vertical heights (left panels) and kpc (middle panels) are well reproduced by our model predictions. In contrast, smaller values than the computed one emerge from the data in the right panel with kpc: in fact in this case a consistent number of observed low- stars have been discarded.
In our model computed in the solar neighborhood, an age smaller than 8 Gyr corresponds to an evolutionary time larger than 5.7 Gyr. In ES21, the quantity (i.e. the delay between the peaks of the two gas infall) is Gyr (see Table 1). Hence, with considering only stars with ages ¡ 8 Gyr, we exclude some thin disc stars, specifically the ones formed as soon after the beginning of the second gas infall (born at evolutionary time enclosed between 4.085 and 5.7 Gyr), and totally ignoring the thick disc component.
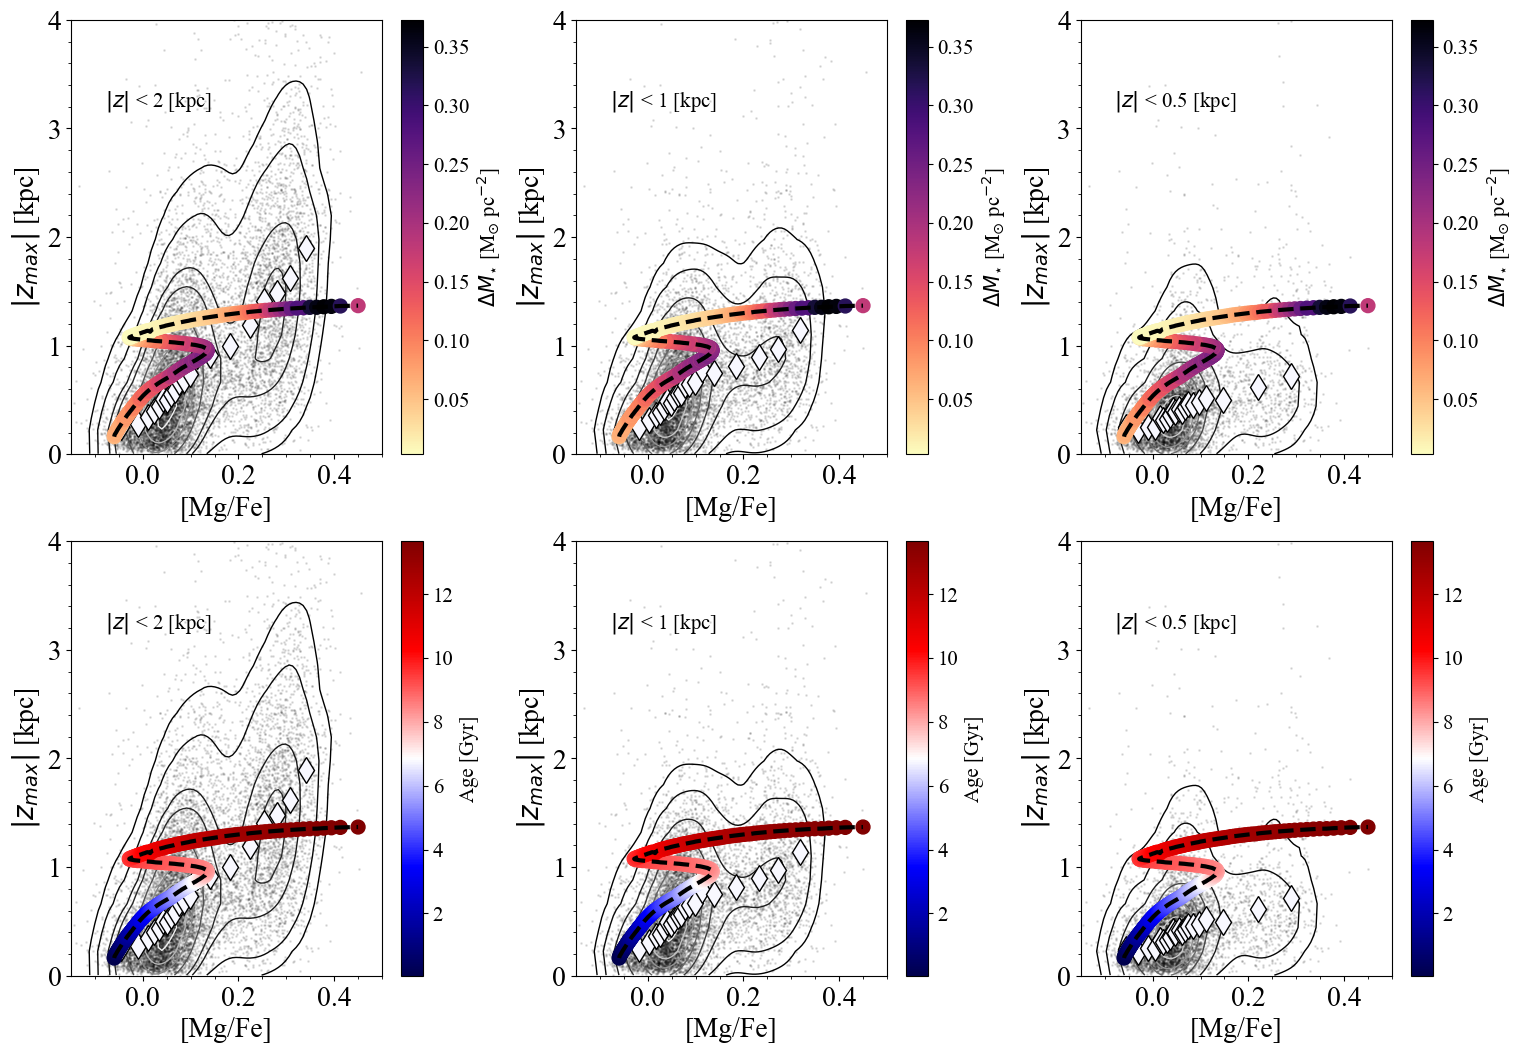
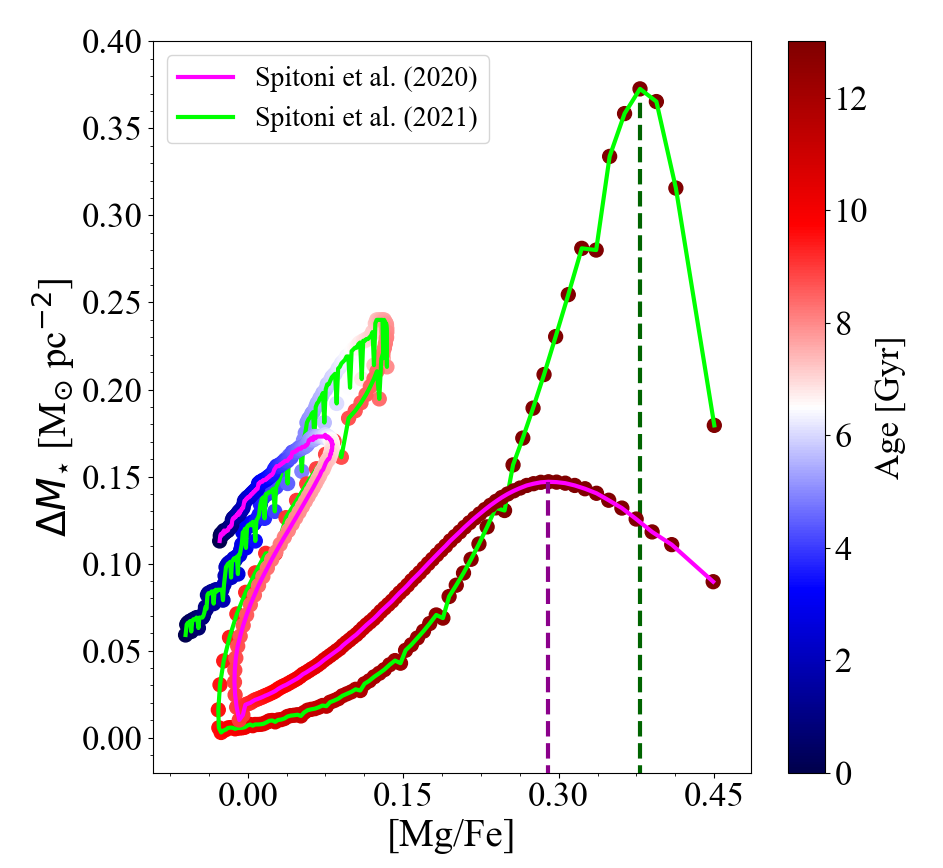
In Fig. 5, we show model results extending the Ting & Rix (2019) relation to high- sequence stars (ages ¿ 8 Gyr, i.e. the grey shaded area in Fig. 2). The stellar sample with the full age range of the astroNN catalogue shows a clear bimodality in the relation versus [Mg/Fe], more evident with the cut kpc (left panels in Fig. 5). Our model is able to predict such a dichotomy displaying two different sequences in the versus [Mg/Fe] relation. In the phase when the star formation resumes immediately after the beginning of the second gas infall, ejecta from Type II SNe produce a steep rise in the [/Fe] ratio, followed by a decrease due to pollution from Type Ia SNe as visible in Fig. 5. This kind of transition between the two disc sequences is not obvious in the data. However, as pointed out by the coloured coded points indicating the stellar mass produced in constant age interval of Gyr, the ”upturning” feature in the chemical evolution track is characterised by a low stellar mass content compared to other Galactic evolutionary phases.
In Fig. 5, we see that the predicted curve for the vertical [Mg/Fe] distribution by the model nicely overlaps with the regions with the highest densities of stars in both low- and high- APOGEE stars with observed heights kpc (left panels). However, the observed median values (computed in bins of [Mg/Fe] with the same number of stars) for high- stars are larger than our model results. In fact, we predict a too flat (almost constant) growth of the maximum vertical height for thick disc sequence stars.
One possible explanation for such a discrepancy is that the stellar sample could be contaminated by the presence of halo stars. However, it is more likely that other dynamical processes - such as merger and accretion episodes - have played a crucial role in perturbing stellar orbits of the high- sequence in addition to simple scattering processes as assumed by the Ting & Rix (2019) model. for thin disc stars (stellar ages ¡ 8 Gyr). Cosmological simulations have shown that Milky Way-like galaxies are frequently experiencing minor mergers (Quinn et al., 1993; Walker et al., 1996; Velazquez & White, 1999; Kazantzidis et al., 2009; House et al., 2011; Gómez et al., 2013; D’Onghia et al., 2016; Moetazedian & Just, 2016), external perturbations that can heat up the disc. Helmi et al. (2018) demonstrated that the inner halo is dominated by debris from an accreted object more massive than the Small Magellanic Cloud, alias Gaia-Enceladus (Vincenzo et al., 2019). Gaia–Enceladus must have led to the dynamical heating of the precursor of the Galactic thick disc (stars with the same [/Fe] versus [Fe/H] as thick disc but with different kinematics). Moreover, radial stellar migration (Sellwood & Binney, 2002; Schönrich & Binney, 2009; Minchev & Famaey, 2010) should cause more extended vertical motion at reduced velocity dispersion for stars that move outward, and the opposite effect for stars that move inward (Loebman et al., 2011; Minchev et al., 2012).
In Fig. 5, we note that the median values of the observed vertical [Mg/Fe] distribution for kpc (middle panels) and kpc case (right panels) show an evident change in the slope as we moved from the low- (steeper) to high- stars (flatter) more in agreement with our model predictions compared with kpc cut (left panels). Hence, it is likely that applying kpc and kpc cuts, we are excluding from the APOGEE sample objects that possibly have been affected by extra-heating from past merging events.
We conclude that, if we consider as high- sequence stars the objects with kpc, some extra-heating from gravitational perturbers (i.e., the constellation of clusters, small dwarf galaxies) should be taken into account to achieve a better agreement between model results and observed versus [Mg/Fe] median values. Recently, Conroy et al. (2021) showed that the Large Magellanic Cloud (LMC) had an impact on the position of the centre of mass of the Milky Way + LMC system, and creating important dynamical signatures in the MW (and LMC) halo as well.
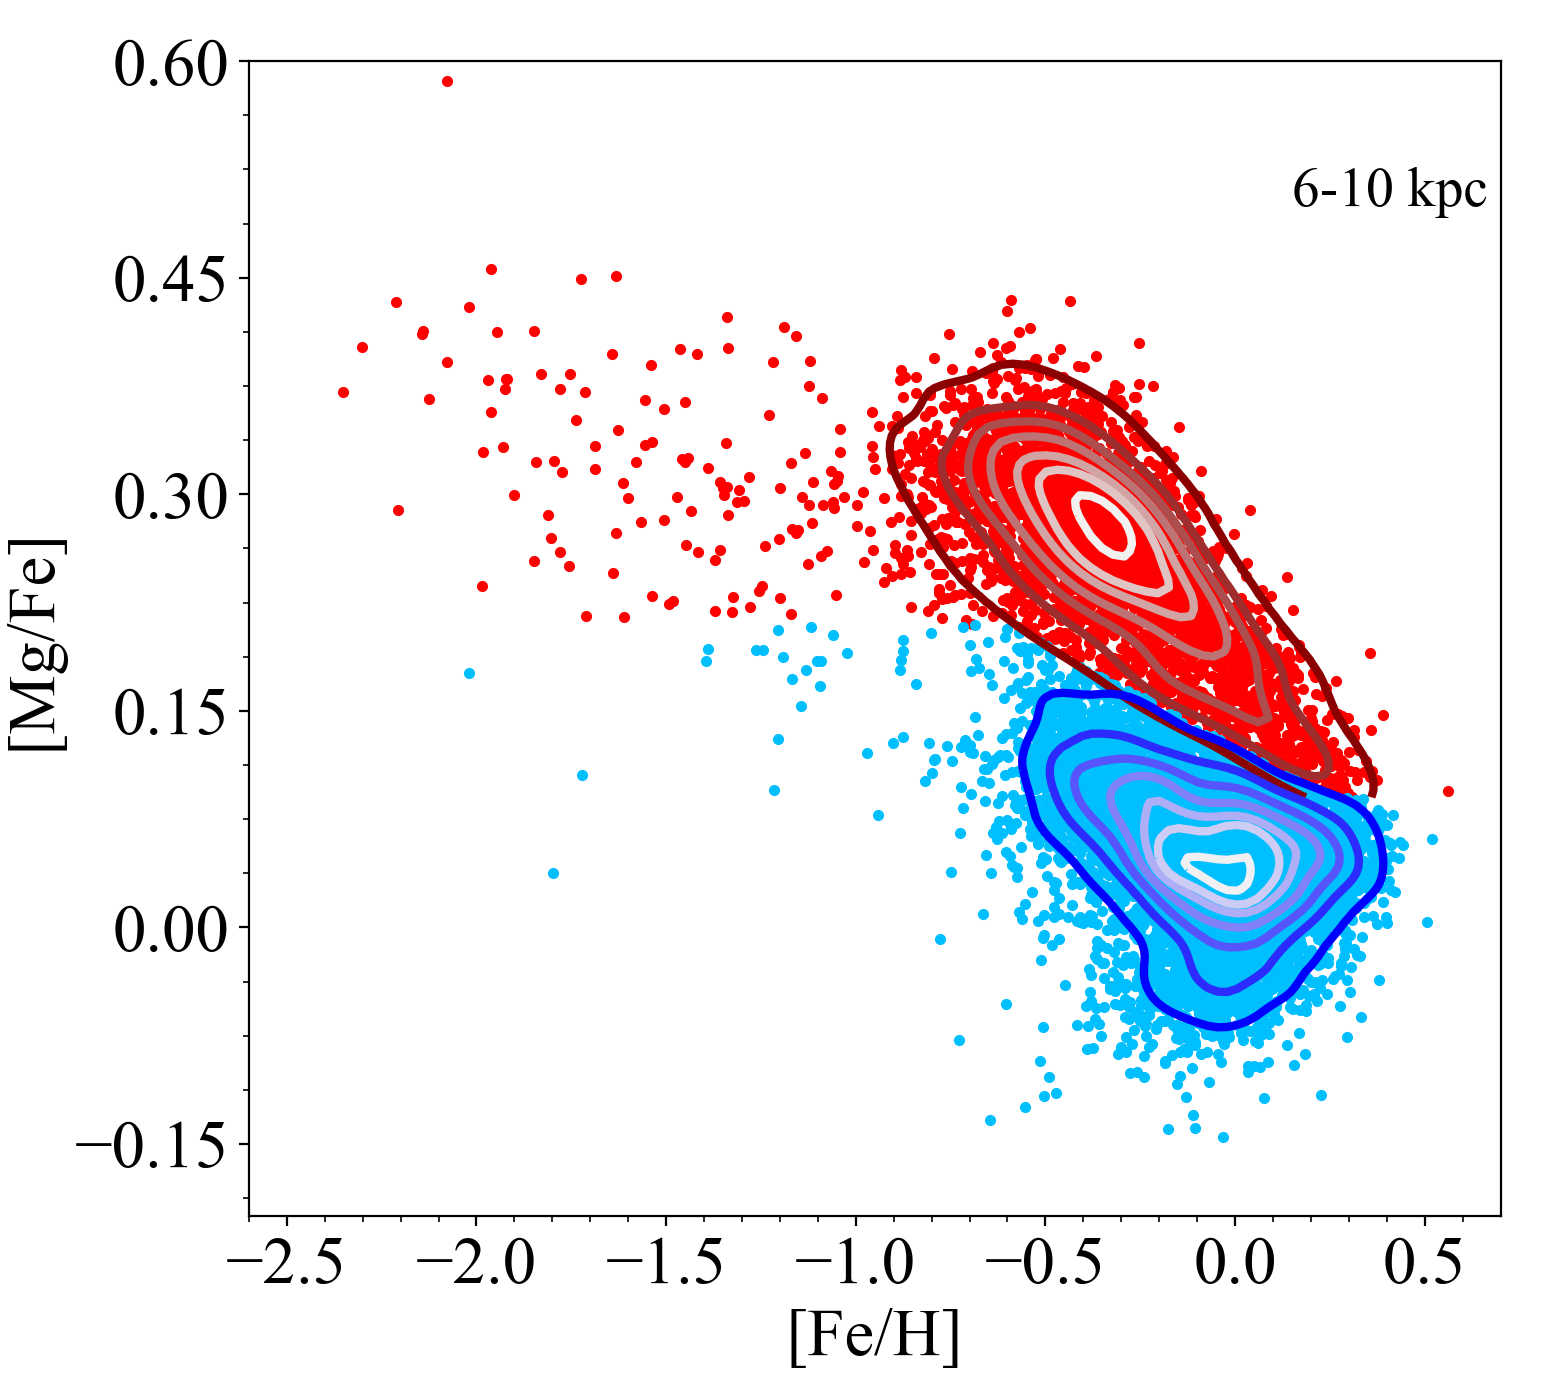
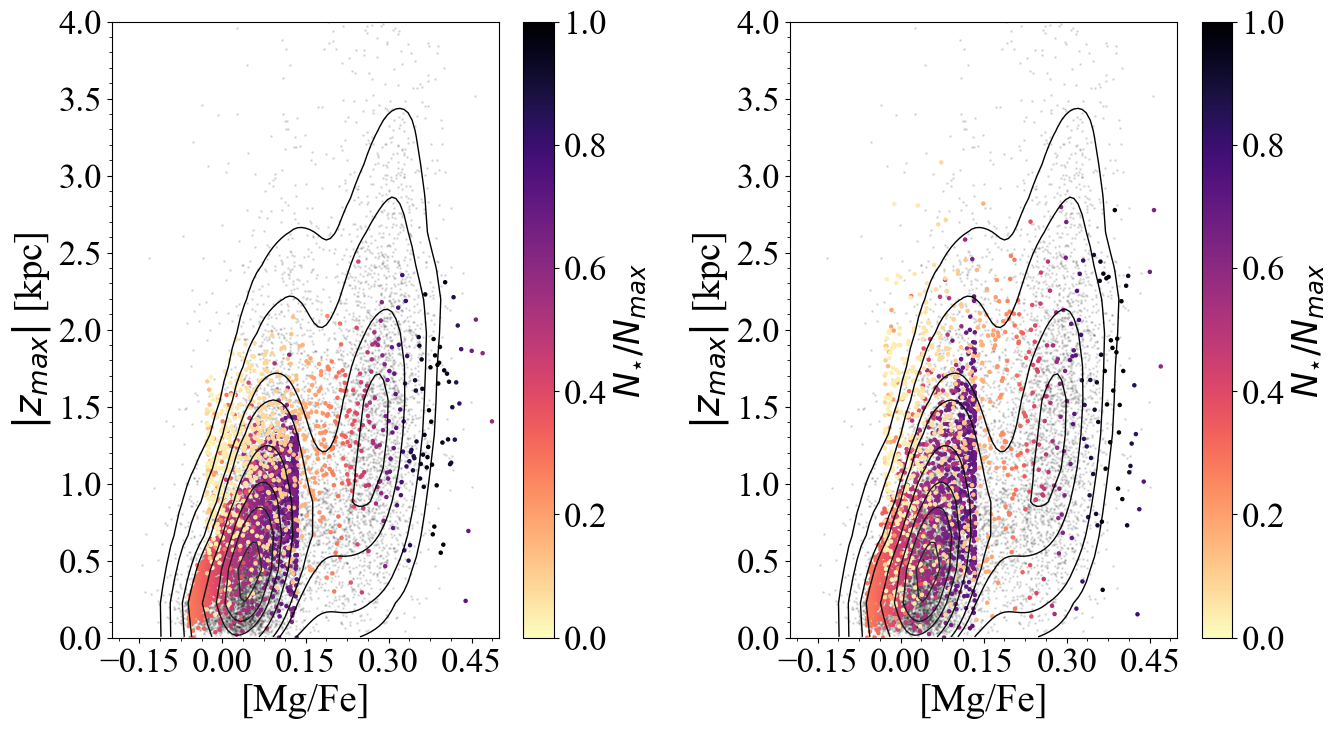
In order to further investigate the validity of the proposed two-infall model, we compare the observed and predicted distributions (studying only the case with kpc because of the evident bimodality in the [Mg/Fe] versus space) assuming a separation between high- and low- stars based on the chemistry. In Fig. 6, we report the APOGEE-DR16 stars with the same selection criteria as presented in Section 2, where we impose a disc dissection based on chemistry similar to the one suggested by Silva Aguirre et al. (2018) for the APOKASC sample and by Ness et al. (2019).
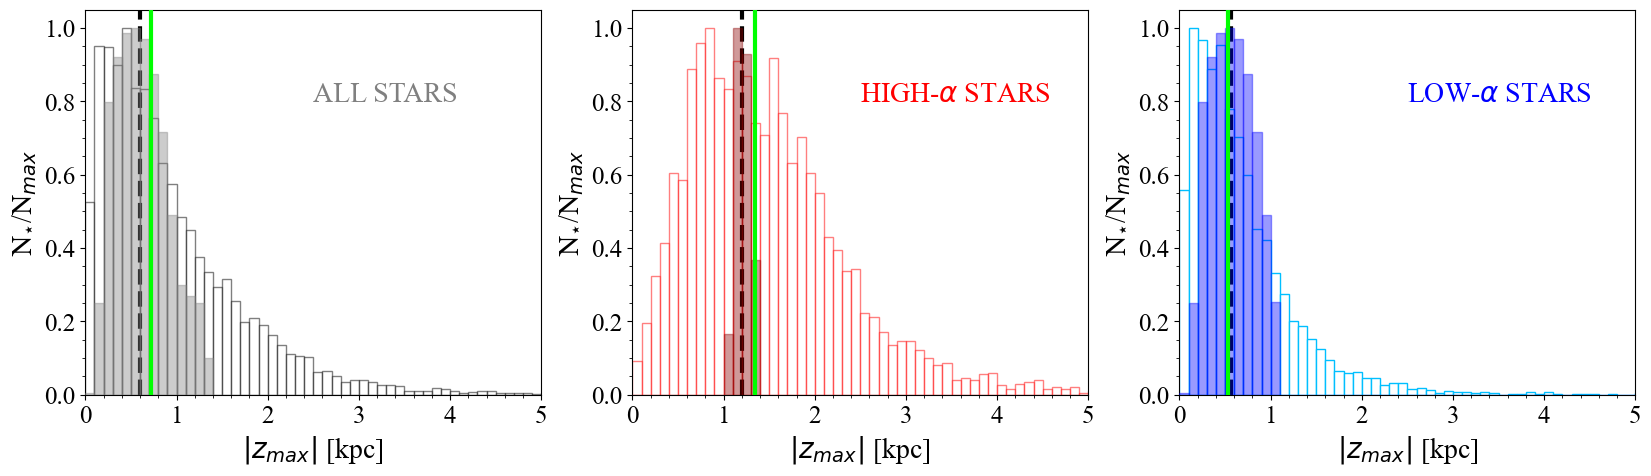
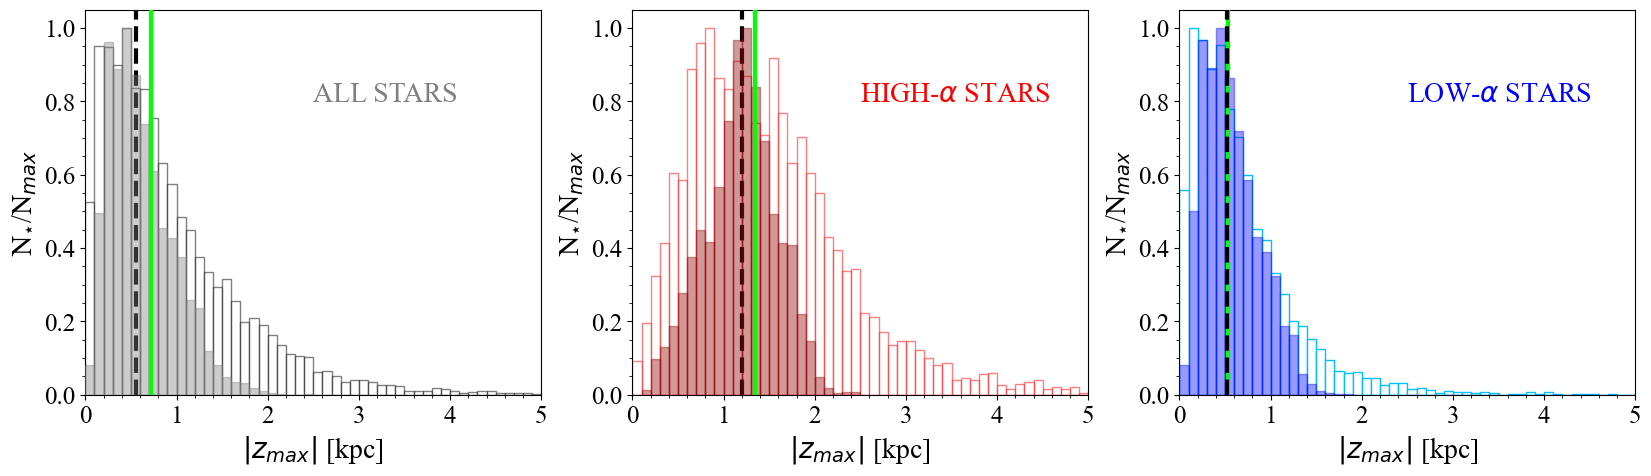
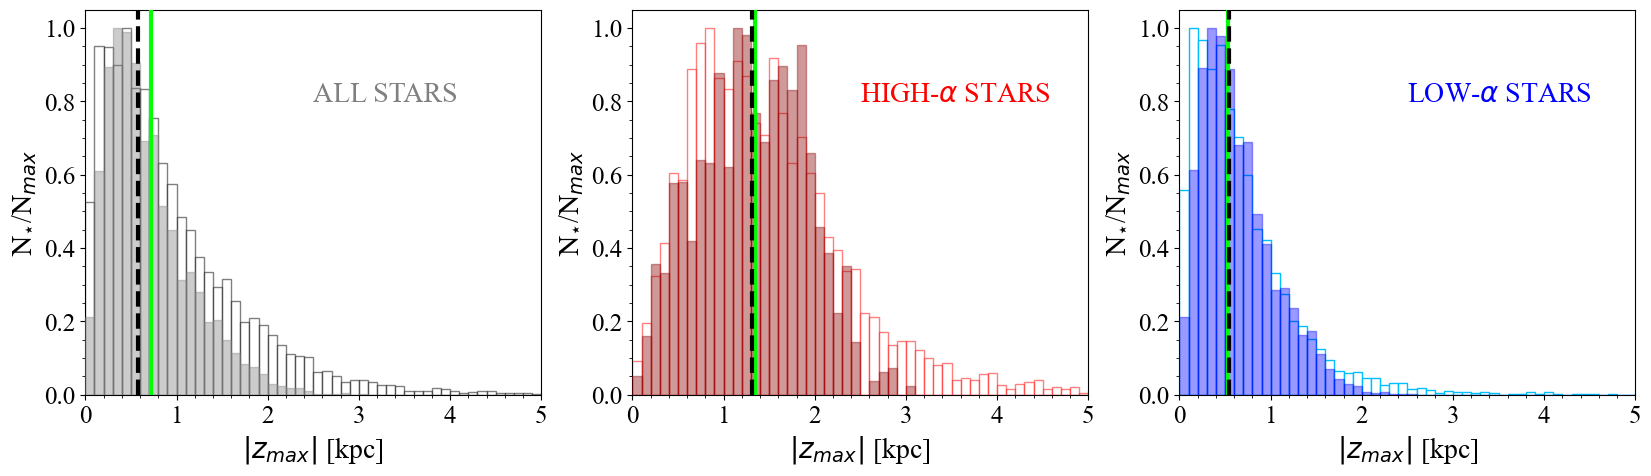
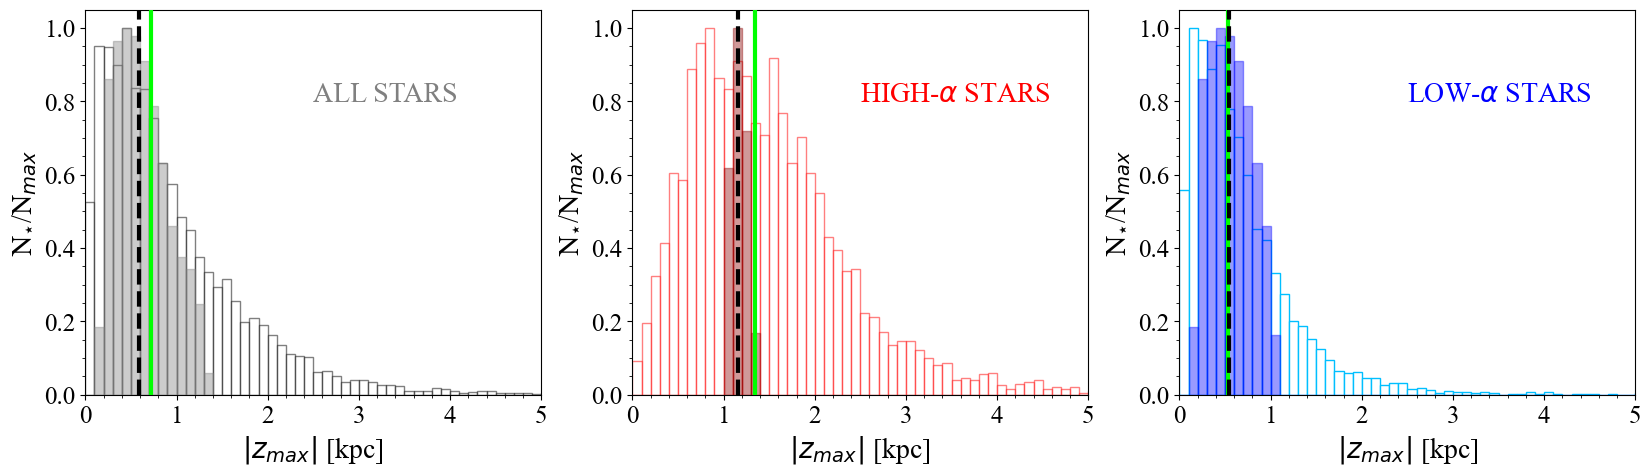
In the first row of Fig. 7, we compare distributions predicted by the ES21 model with data for the whole stellar sample (left panel), high- (middle panel) and low- sequence stars (right panel), respectively. Following the same procedure adopted in Spitoni et al. (2019b), we assume that SSPs formed at evolutionary times smaller (larger) than (time delay between the two gas infall events) are considered as part of the high (low)- sequence. As in Fig. 5 for the versus [Mg/Fe] distributions, here we are primarily interested in reproducing the trend of the observations. In fact, in Fig. 7 the predicted median values by the ES21 model are consistent with the APOGEE DR16+astroNN catalogue stars. However, we notice that especially for the high- case we fail in reproducing the large spread of the observed distribution.
Gandhi & Ness (2019), studying the stellar dynamics for LAMOST stars with distances smaller than 2 kpc from the Sun, found a large dispersion in the computed vertical action versus age relation, i.e. for the high- sequence they find and for low- stars. Similar results are found by Ting & Rix (2019).
We take into account this dispersion in our model by adding, at each Galactic time , a random error which has a Gaussian distribution to the vertical action of Ting & Rix (2019) associated to the SSP formed at Galactic time .
The “new” vertical action is defined as:
| (5) |
where is a perturbation which follows a Normal distribution with standard deviation . In conclusion, we perturbed the -age relation of Ting & Rix (2019), and is taken as the new constraint when we compute with galpy varying the initial vertical velocity as indicated in Eq. (4).
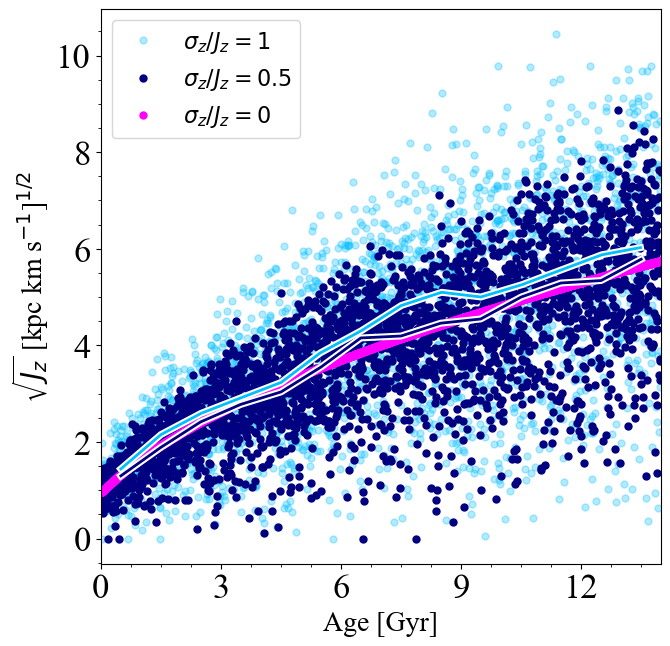
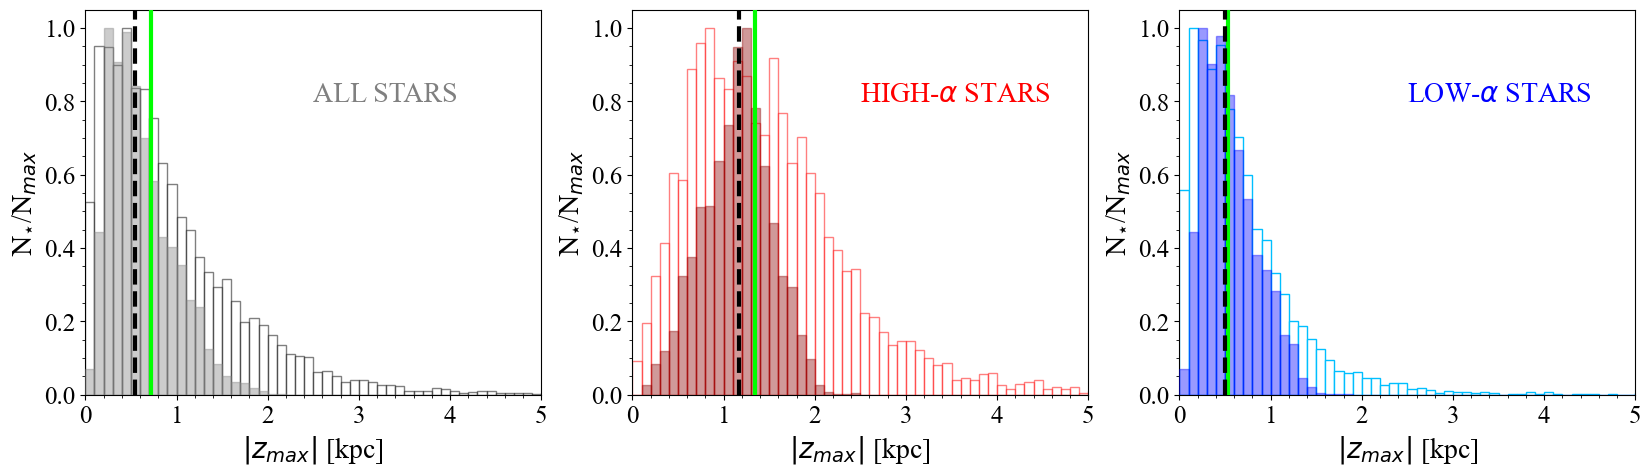
In the light of Gandhi & Ness (2019) and Ting & Rix (2019) results, in Fig. 8 we show the versus age relations and the initial vertical velocities for the SSPs in the solar neighbourhood with and . In Fig. 7, we also show the distributions with (second row) and (third row). We note that the predicted medians of the distribution with for both the high- and low- sequences are in good agreement with the data. Moreover, the observed spread of the distribution is satisfactory reproduced. On the other hand, the case (as reported in the second row) does not allow to mimic the observed spread in the high- sequence. Actually, also with the high tail of the distribution (stars with ¿ 3 kpc) cannot be predicted by the model. We think that other sources of errors could be the origin of this discrepancy. However, here we want to focus solely on the effects of uncertainties on the determination.
In Fig. 9, we also show the predicted age versus distributions assuming (left panel) and (right panel) compared to astroNN ages (computed by Mackereth et al. 2019 using a Bayesian neural network model trained on asteroseismic ages). We can appreciate that the trend of observed spread in the versus age distribution is better reproduced with . In the lower panels of Fig. 9 we can appreciate that the distributions of the predicted SSPs in the versus [Mg/Fe] space including the observed dispersion in the vertical action estimates, highlight the presence of the disc dichotomy signature, in agreement with data.
As already noticed in ES21, the predicted distribution of surface stellar mass density (computed in constant age intervals fixed at the value of 0.05 Gyr) in the [Mg/Fe] versus [Fe/H] relation is in contrast with APOGEE DR16 stellar distribution. Also in Fig. 5, the model forms too many stars as soon the first infall begins, and in the [Mg/Fe] vs they populate a region where APOGEE DR16 are rare, i.e. [Mg/Fe] with values larger than 0.3 dex. This is due to the fact that the best fit-model parameter value for the infall time-scale of the high- sequence is Gyr, hence the bulk of high- stars are created in region in the versus [Mg/Fe] plane, where population density is small in the APOGEE DR16. In the Section 5.2 we will show that a longer time-scale of gas accretion in the high- sequence which characterised the ES20 model (see Table 1), is able to alleviate this tension.
5.2 ES20 model
In this Section, we compare the combined APOGEE data + astroNN catalogue with model predictions based on the chemical evolution model M2 of ES20. In Fig. 10 we show model results with extended Ting & Rix (2019) relation to high- sequence stars in computing the maximum height . As for the ES21 model (see Section 5.1), a better agreement with the data is obtained when APOGEE DR16 stars with observed vertical heights kpc are considered.
As we pointed out in Section 5.1, there is a discrepancy between the most densely populated regions in the maximum vertical heights versus [Mg/Fe] by APOGEE DR16 stars and the peaks of the predicted distribution of the stellar mass density found by ES21 model. On the other hand, in Fig. 10 we note that the distribution of the formed stars predicted by ES20 model throughout the curve in the versus [Mg/Fe] space shows no tensions with the data. In fact, the two peaks of the predicted stellar mass density are in correspondence to the highest data density regions as traced by the contour density curves. We recall that the best-fit parameters in model M2 of ES20 have been constrained by the APOKASC sample, taking into account also stellar ages computed with asteroseismology in the MCMC calculations. As discussed in Section 3, longer timescales and for the gas accretion are predicted by this model constrained by APOKASC sample (see Table 1). Regarding the high- sequence, the main consequence of the slower gas accretion is to delay the peak of the star formation towards smaller [Mg/Fe] values.
In Fig. 11 we report the predicted surface stellar mass density formed in age intervals of Gyr as function of the [Mg/Fe] abundance ratio predicted by ES20 and ES21 models, respectively. Here, it is even more evident that in the ES20 model the peak of the stellar mass formed during the high- sequence phase is shifted towards smaller [Mg/Fe] values.
In Fig. 12 we notice that the distributions of the predicted SSPs in the versus [Mg/Fe] space including in the ES20 model the observed dispersion in the vertical action estimates, show the presence of the disc dichotomy feature, in good agreement with data.
Finally, in Fig. 13 we show that also for the ES20 model the median values of the observed distributions of APOGEE-DR16+astroNN stars are well reproduced for both the high- and low- sequences. However, as already discussed in Section 5.1, in order to mimic the observed spread we have to include in the model the errors of in the considered vertical action (see the last row of Fig. 13).
5.3 [Mg/Fe] distribution functions and 3D space ([Mg/Fe], [Fe/H], ) analysis
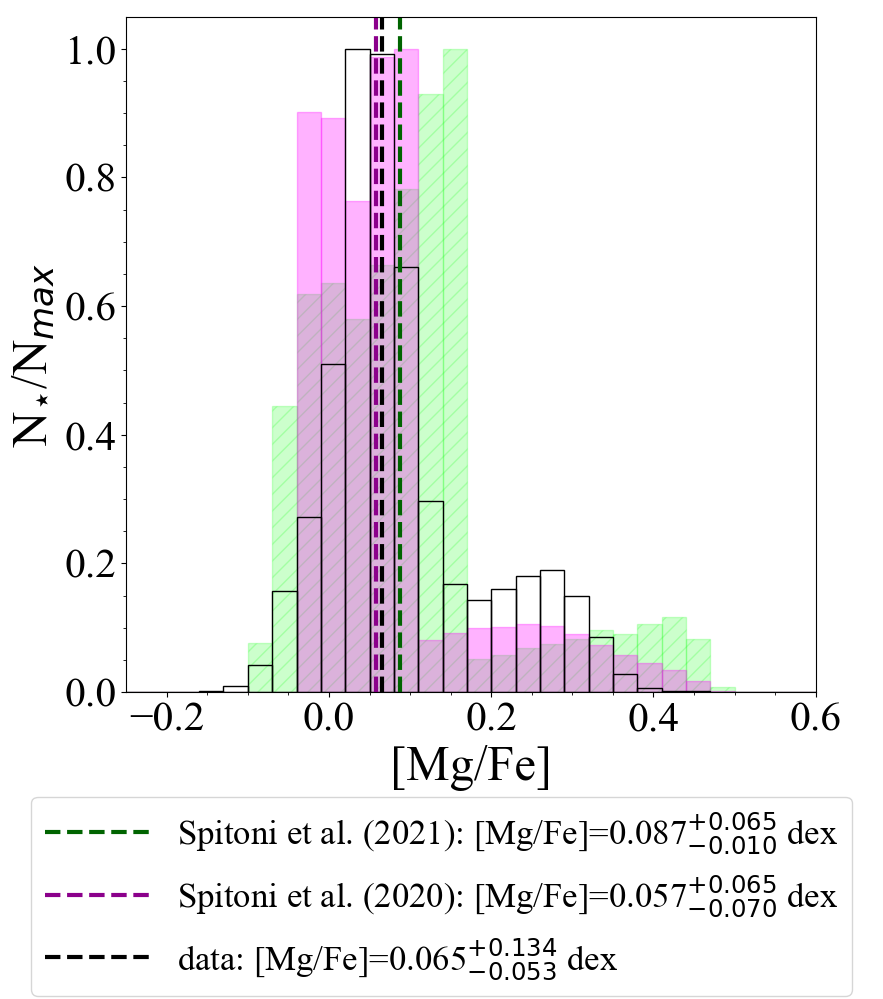
In Section 5.1, we pointed out that the predicted distribution in the versus [Mg/Fe] relation by ES21 of the newly formed stellar mass in the same age bins (i.e., Gyr) in the high- sequence is in contrast with the APOGEE data. On the other hand, this tension is resolved when adopting the ES20 model. In Fig. 14, we compare the [Mg/Fe] distribution function computed by ES21 and ES20 models with the APOGEE DR16 data in the annular Galactic region enclosed between 6 and 10 kpc (to be consistent with the distribution reported in Fig. 16 of Spitoni et al. 2021 we consider stars with vertical heights kpc). ES21 best-fit model (green histogram) accounts for the observed bimodality, however the predicted peaks are significantly shifted towards higher [Mg/Fe] values. As underlined in Section 5.1, this is due to the short timescale of accretion and as obtained by the MCMC calculation when only chemical APOGEE DR16 abundances are fitted, which push the star formation activity to be concentrated close to the peaks of maximum gas infall rates. On the contrary, model M2 by ES20 characterised by longer time-scales of accretion (see Table 1) predicts the above-mentioned bimodality and is capable to reproduce the [Mg/Fe] values of high- and low- distribution peaks as shown in APOGEE DR16 data. We conclude that the inclusion of precise stellar ages inferred from asteroseismology is fundamental in order to properly constrain chemical evolution models of the Milky Way disc components.
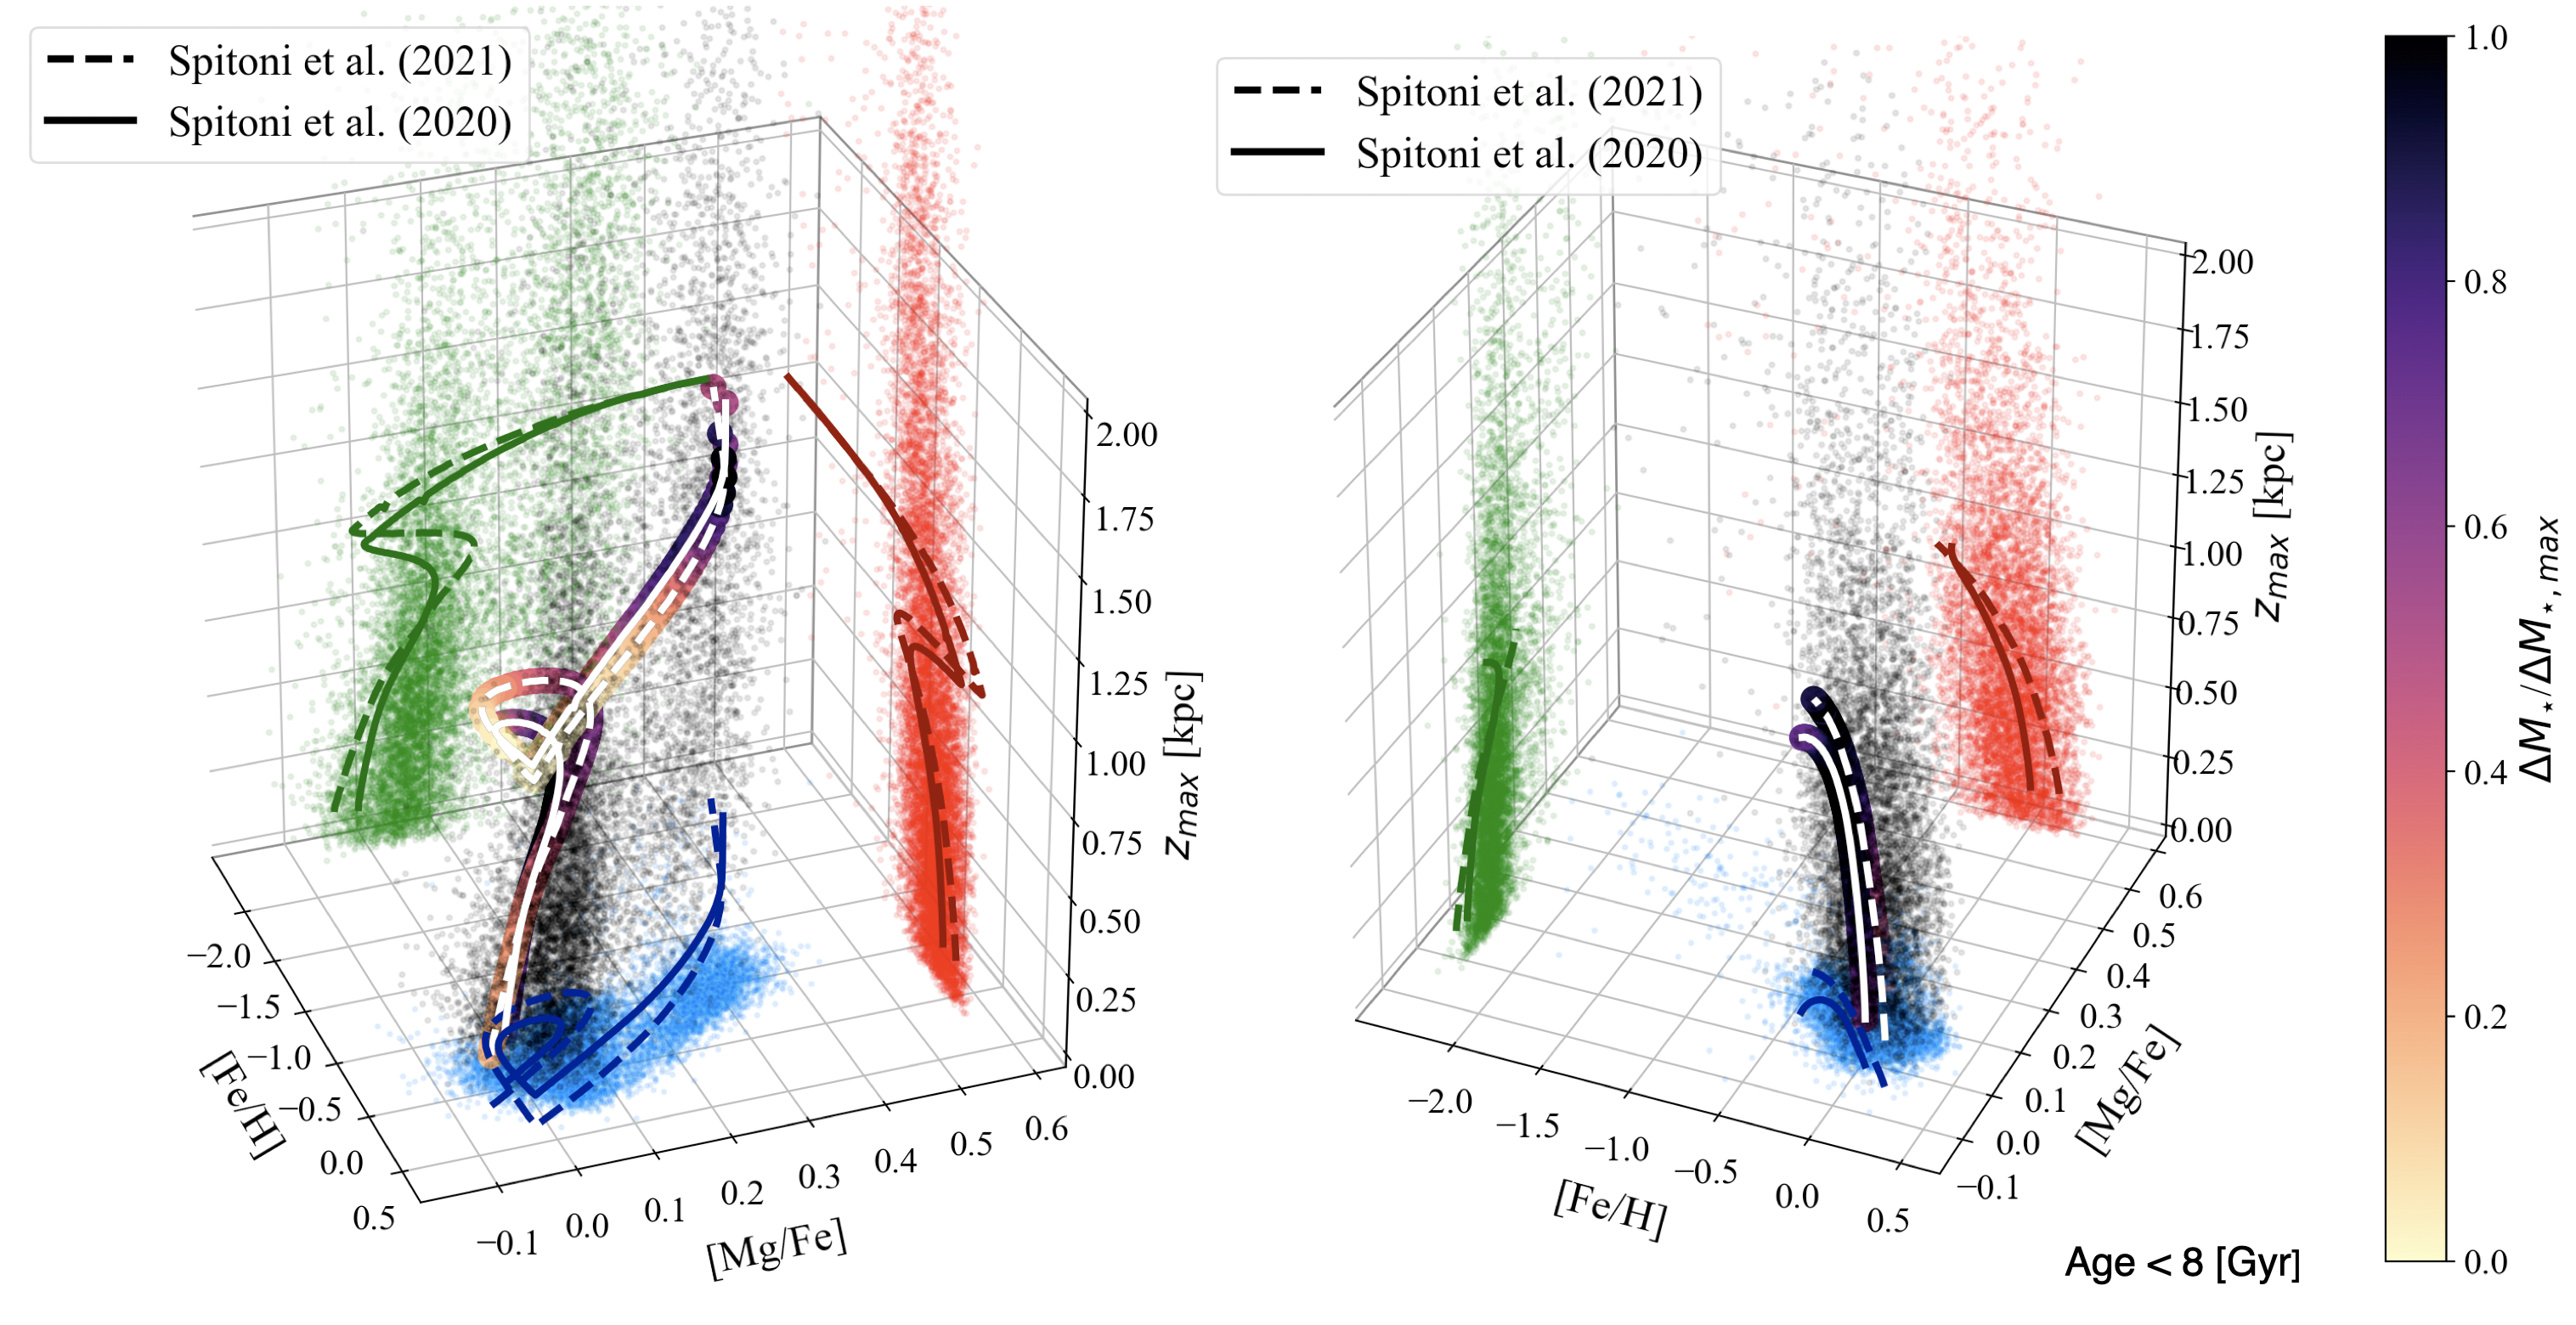
Finally, in Fig. 15 we compare models predictions in the 3D space formed by the abundance ratios [Mg/Fe], [Fe/H] and the orbital parameter with APOGEE DR16 data (observed Galactic heights kpc). In the left panel of Fig. 15 we analyse the whole stellar ages range. Colour-coded points indicating the stellar mass formed in age intervals of 0.05 Gyr, highlight that in ES21 model the star formation in the high- sequence is concentrated towards the infall rate peak (see also Fig. 11), whereas in ES20 it is characterised by a more extended star formation history and as mentioned above the predicted [Mg/Fe] distribution function is in agreement with APOGEE DR16. In the projections, it can be noted that the evident dichotomy present in the data in the plane versus [Mg/Fe] is not so clear in versus [Fe/H]. On the right panel of Fig. 15, where we consider only stars younger than 8 Gyr it is possible to appreciate a good agreement between model predictions and data.
6 Conclusions
Recent chemical evolution models designed to reproduce APOGEE DR16 data (Spitoni et al., 2021) and APOKASC sample (Spitoni et al., 2020) suggested the presence of a significant delay time between the two gas infall episodes for the thick-disc and thin-disc formation. In this work, we presented results for the vertical distribution of the [Mg/Fe] abundance ratio in the solar neighborhood and showed how this is consistent with recent observations combining the APOGEE DR16 data (chemical abundances) and the astroNN catalogue (stellar ages, orbital parameters). We computed the vertical maximum heights using the Ting & Rix (2019) relation in computing the orbits around the Galaxy of SSPs born at different evolutionary times. Our main conclusions can be summarised as follows:
- 1.
-
2.
The distribution of the initial vertical velocities as the function of the Galactic age for the computed SSPs can be interpreted as the upper limit of the observed vertical velocity dispersion versus age relation in the solar vicinity.
-
3.
Extending Ting & Rix (2019) relation to the whole stellar age range the predicted curves for the vertical [Mg/Fe] distribution by the models nicely overlap with the regions characterised by the highest densities of stars in both low- and high- APOGEE sequences with observed heights kpc. However, the median values of APOGEE data in the high- sequence generally show a steeper growth of compared to model predictions. This is due to the fact that in the past the Milky Way could have been affected by important merger episodes, and such as external perturbations could have heated up the thick disc. Hence, an extra-vertical action component is missing if we consider stellar scattering as the only heating process as assumed by Ting & Rix (2019).
-
4.
Assuming for APOGEE-DR16 stars ( kpc) a disc dissection based on chemistry, the observed distributions for high- and low- sequences are in good agreement with our model predictions if we consider in the calculation an error in the vertical action of Ting & Rix (2019) with standard deviation (such an error has been inspired by the study of Gandhi & Ness 2019 based on GALAH stars and Ting & Rix 2019).
-
5.
When we also include the information about the predicted surface stellar mass density throughout the chemical evolution in Spitoni et al. (2021) model results, there is a tension between the location of most densely populated regions in APOGEE DR16 stars and the model peaks in the versus [Mg/Fe] relation if we consider the full stellar age range. In fact, Spitoni et al. (2021) model forms too many stars as soon the first infall begins, and in the versus [Mg/Fe] many stars are predicted in a region where APOGEE DR16 stars are rare. This is the consequence of the best fit-model parameter value for the infall time-scale of the high- sequence is quite short ( i.e, Gyr).
-
6.
On the contrary, model M2 by Spitoni et al. (2020) characterised by longer time-scales of accretion (see Table 1) reproduces the above-mentioned bimodality in the versus [Mg/Fe] relation. The distribution of the formed stars predicted by Spitoni et al. (2020) model in the versus [Mg/Fe] relation shows no tensions with the data. In fact, the two peaks of the predicted stellar mass density are in correspondence to the highest density regions in the data. We conclude that the inclusion of precise stellar ages inferred from asteroseismology is fundamental to properly constrain chemical evolution models of the Milky Way disc components.
-
7.
The distributions of the predicted SSPs in the versus [Mg/Fe] space including the observed dispersion in the vertical action estimates, show the presence of the disc dichotomy signature, in good agreement with data.
Acknowledgement
The authors thank the referee F. Vincenzo for various suggestions that improved the paper. E. Spitoni thanks A. Recio-Blanco and P. A. Palicio for useful discussions. E. Spitoni received funding from the European Union’s Horizon 2020 research and innovation program under SPACE-H2020 grant agreement number 101004214 (EXPLORE project). E. Spitoni acknowledges support from the ERC Consolidator Grant (Hungary) programme (Project RADIOSTAR, G.A. n. 724560). Funding for the Stellar Astrophysics Centre is provided by The Danish National Research Foundation (Grant agreement no.: DNRF106). E. Spitoni and V. Aguirre Børsen-Koch acknowledge support from the Independent Research Fund Denmark (Research grant 7027-00096B). This work was partially supported by the program Unidad de Excelencia María de Maeztu CEX2020-001058-M. K. Verma is supported by the Juan de la Cierva fellowship (IJC2019-041344-I). A. Stokholm acknowledges support from the European Research Council Consolidator Grant funding scheme (project ASTEROCHRONOMETRY, G.A. n. 772293, http://www.asterochronometry.eu).
In this work, we have made use of SDSS-IV APOGEE-2 DR16 data. Funding for the Sloan Digital Sky Survey IV has been provided by the Alfred P. Sloan Foundation, the U.S. Department of Energy Office of Science, and the Participating Institutions. SDSS-IV acknowledges support and resources from the Center for High-Performance Computing at the University of Utah. The SDSS web site is www.sdss.org. SDSS is managed by the Astrophysical Research Consortium for the Participating Institutions of the SDSS Collaboration which are listed at www.sdss.org/collaboration/affiliations/. With this paper we also made use of the Python package for Galactic dynamics GALPY (http://github.com/jobovy/galpy).
References
- Ablimit et al. (2020) Ablimit, I., Zhao, G., Flynn, C., & Bird, S. A. 2020, ApJ, 895, L12
- Agertz et al. (2021) Agertz, O., Renaud, F., Feltzing, S., et al. 2021, MNRAS, 503, 5826
- Aguirre Børsen-Koch et al. (2021) Aguirre Børsen-Koch, V., Rørsted, J. L., Justesen, A. B., et al. 2021, arXiv e-prints, arXiv:2109.14622
- Ahumada et al. (2020) Ahumada, R., Allende Prieto, C., Almeida, A., et al. 2020, ApJS, 249, 3
- Beane et al. (2018) Beane, A., Ness, M. K., & Bedell, M. 2018, ApJ, 867, 31
- Binney (2010) Binney, J. 2010, MNRAS, 401, 2318
- Binney & Spergel (1984) Binney, J. & Spergel, D. 1984, MNRAS, 206, 159
- Bird et al. (2013) Bird, J. C., Kazantzidis, S., Weinberg, D. H., et al. 2013, ApJ, 773, 43
- Bovy (2015) Bovy, J. 2015, ApJS, 216, 29
- Brook et al. (2012) Brook, C. B., Stinson, G. S., Gibson, B. K., et al. 2012, MNRAS, 426, 690
- Buck (2020) Buck, T. 2020, MNRAS, 491, 5435
- Buder et al. (2019) Buder, S., Lind, K., Ness, M. K., et al. 2019, A&A, 624, A19
- Buder et al. (2021) Buder, S., Sharma, S., Kos, J., et al. 2021, MNRAS[arXiv:2011.02505]
- Carlberg (1987) Carlberg, R. G. 1987, ApJ, 322, 59
- Cescutti et al. (2007) Cescutti, G., Matteucci, F., François, P., & Chiappini, C. 2007, A&A, 462, 943
- Chiappini et al. (1997) Chiappini, C., Matteucci, F., & Gratton, R. 1997, ApJ, 477, 765
- Chiappini et al. (2003) Chiappini, C., Matteucci, F., & Meynet, G. 2003, A&A, 410, 257
- Chieffi & Limongi (2013) Chieffi, A. & Limongi, M. 2013, ApJ, 764, 21
- Clarke et al. (2019) Clarke, A. J., Debattista, V. P., Nidever, D. L., et al. 2019, MNRAS, 484, 3476
- Conroy et al. (2021) Conroy, C., Naidu, R. P., Garavito-Camargo, N., et al. 2021, Nature, 592, 534
- Côté et al. (2017) Côté, B., O’Shea, B. W., Ritter, C., Herwig, F., & Venn, K. A. 2017, ApJ, 835, 128
- D’Onghia et al. (2016) D’Onghia, E., Madau, P., Vera-Ciro, C., Quillen, A., & Hernquist, L. 2016, ApJ, 823, 4
- Duong et al. (2018) Duong, L., Freeman, K. C., Asplund, M., et al. 2018, MNRAS, 476, 5216
- Foreman-Mackey et al. (2013) Foreman-Mackey, D., Hogg, D. W., Lang, D., & Goodman, J. 2013, PASP, 125, 306
- François et al. (2004) François, P., Matteucci, F., Cayrel, R., et al. 2004, A&A, 421, 613
- Fuhrmann et al. (2017) Fuhrmann, K., Chini, R., Kaderhandt, L., & Chen, Z. 2017, MNRAS, 464, 2610
- Gaia Collaboration et al. (2018) Gaia Collaboration, Katz, D., Antoja, T., et al. 2018, A&A, 616, A11
- Gandhi & Ness (2019) Gandhi, S. S. & Ness, M. K. 2019, ApJ, 880, 134
- Gómez et al. (2013) Gómez, F. A., Minchev, I., O’Shea, B. W., et al. 2013, MNRAS, 429, 159
- Goodman & Weare (2010) Goodman, J. & Weare, J. 2010, Communications in Applied Mathematics and Computational Science, 5, 65
- Grand et al. (2018) Grand, R. J. J., Bustamante, S., Gómez, F. A., et al. 2018, MNRAS, 474, 3629
- Greggio & Renzini (1983) Greggio, L. & Renzini, A. 1983, A&A, 118, 217
- Hayden et al. (2015) Hayden, M. R., Bovy, J., Holtzman, J. A., et al. 2015, ApJ, 808, 132
- Helmi et al. (2018) Helmi, A., Babusiaux, C., Koppelman, H. H., et al. 2018, Nature, 563, 85
- House et al. (2011) House, E. L., Brook, C. B., Gibson, B. K., et al. 2011, MNRAS, 415, 2652
- Iwamoto et al. (1999) Iwamoto, K., Brachwitz, F., Nomoto, K., et al. 1999, ApJS, 125, 439
- Kazantzidis et al. (2009) Kazantzidis, S., Zentner, A. R., Kravtsov, A. V., Bullock, J. S., & Debattista, V. P. 2009, ApJ, 700, 1896
- Kennicutt (1998) Kennicutt, Jr., R. C. 1998, ApJ, 498, 541
- Khoperskov et al. (2021) Khoperskov, S., Haywood, M., Snaith, O., et al. 2021, MNRAS, 501, 5176
- Kobayashi et al. (2020) Kobayashi, C., Karakas, A. I., & Lugaro, M. 2020, ApJ, 900, 179
- Kobayashi & Nakasato (2011) Kobayashi, C. & Nakasato, N. 2011, ApJ, 729, 16
- Kroupa (2002) Kroupa, P. 2002, in Astronomical Society of the Pacific Conference Series, Vol. 285, Modes of Star Formation and the Origin of Field Populations, ed. E. K. Grebel & W. Brandner, 86
- Kroupa (2008) Kroupa, P. 2008, in Astronomical Society of the Pacific Conference Series, Vol. 390, Pathways Through an Eclectic Universe, ed. J. H. Knapen, T. J. Mahoney, & A. Vazdekis, 3
- Leung & Bovy (2019) Leung, H. W. & Bovy, J. 2019, MNRAS, 489, 2079
- Lian et al. (2020) Lian, J., Thomas, D., Maraston, C., et al. 2020, MNRAS, 494, 2561
- Loebman et al. (2011) Loebman, S. R., Roškar, R., Debattista, V. P., et al. 2011, ApJ, 737, 8
- Mackereth & Bovy (2018) Mackereth, J. T. & Bovy, J. 2018, PASP, 130, 114501
- Mackereth et al. (2019) Mackereth, J. T., Bovy, J., Leung, H. W., et al. 2019, MNRAS, 489, 176
- Matteucci (2012) Matteucci, F. 2012, Chemical Evolution of Galaxies
- Matteucci (2021) Matteucci, F. 2021, A&A Rev., 29, 5
- Matteucci & Greggio (1986) Matteucci, F. & Greggio, L. 1986, A&A, 154, 279
- McKee et al. (2015) McKee, C. F., Parravano, A., & Hollenbach, D. J. 2015, ApJ, 814, 13
- Melioli et al. (2008) Melioli, C., Brighenti, F., D’Ercole, A., & de Gouveia Dal Pino, E. M. 2008, MNRAS, 388, 573
- Melioli et al. (2009) Melioli, C., Brighenti, F., D’Ercole, A., & de Gouveia Dal Pino, E. M. 2009, MNRAS, 399, 1089
- Mikolaitis et al. (2017) Mikolaitis, S., de Laverny, P., Recio-Blanco, A., et al. 2017, Astronomy and Astrophysics, 600, A22
- Mikolaitis et al. (2014) Mikolaitis, Š., Hill, V., Recio-Blanco, A., et al. 2014, A&A, 572, A33
- Minchev & Famaey (2010) Minchev, I. & Famaey, B. 2010, ApJ, 722, 112
- Minchev et al. (2012) Minchev, I., Famaey, B., Quillen, A. C., et al. 2012, A&A, 548, A126
- Miyamoto & Nagai (1975) Miyamoto, M. & Nagai, R. 1975, PASJ, 27, 533
- Moetazedian & Just (2016) Moetazedian, R. & Just, A. 2016, MNRAS, 459, 2905
- Mott et al. (2013) Mott, A., Spitoni, E., & Matteucci, F. 2013, MNRAS, 435, 2918
- Navarro et al. (1996) Navarro, J. F., Frenk, C. S., & White, S. D. M. 1996, ApJ, 462, 563
- Ness et al. (2019) Ness, M. K., Johnston, K. V., Blancato, K., et al. 2019, ApJ, 883, 177
- Nidever et al. (2014) Nidever, D. L., Bovy, J., Bird, J. C., et al. 2014, The Astrophysical Journal, 796, 38
- Nissen et al. (2020) Nissen, P. E., Christensen-Dalsgaard, J., Mosumgaard, J. R., et al. 2020, A&A, 640, A81
- Nitschai et al. (2021) Nitschai, M. S., Eilers, A.-C., Neumayer, N., Cappellari, M., & Rix, H.-W. 2021, ApJ, 916, 112
- Noguchi (2018) Noguchi, M. 2018, Nature, 559, 585
- Palla et al. (2020) Palla, M., Matteucci, F., Spitoni, E., Vincenzo, F., & Grisoni, V. 2020, MNRAS, 498, 1710
- Prantzos et al. (2018) Prantzos, N., Abia, C., Limongi, M., Chieffi, A., & Cristallo, S. 2018, MNRAS, 476, 3432
- Queiroz et al. (2020) Queiroz, A. B. A., Anders, F., Chiappini, C., et al. 2020, A&A, 638, A76
- Quinn et al. (1993) Quinn, P. J., Hernquist, L., & Fullagar, D. P. 1993, ApJ, 403, 74
- Recio-Blanco et al. (2014) Recio-Blanco, A., de Laverny, P., Kordopatis, G., et al. 2014, Astronomy and Astrophysics, 567, A5
- Ritter et al. (2018) Ritter, C., Herwig, F., Jones, S., et al. 2018, MNRAS, 480, 538
- Rojas-Arriagada et al. (2017) Rojas-Arriagada, A., Recio-Blanco, A., de Laverny, P., et al. 2017, Astronomy and Astrophysics, 601, A140
- Rojas-Arriagada et al. (2016) Rojas-Arriagada, A., Recio-Blanco, A., de Laverny, P., et al. 2016, Astronomy and Astrophysics, 586, A39
- Romano et al. (2010) Romano, D., Karakas, A. I., Tosi, M., & Matteucci, F. 2010, A&A, 522, A32
- Santos-Peral et al. (2021) Santos-Peral, P., Recio-Blanco, A., Kordopatis, G., Fernández-Alvar, E., & de Laverny, P. 2021, A&A, 653, A85
- Scalo (1986) Scalo, J. M. 1986, Fund. Cosmic Phys., 11, 1
- Schlesinger et al. (2014) Schlesinger, K. J., Johnson, J. A., Rockosi, C. M., et al. 2014, ApJ, 791, 112
- Schönrich & Binney (2009) Schönrich, R. & Binney, J. 2009, MNRAS, 396, 203
- Sellwood (2013) Sellwood, J. A. 2013, ApJ, 769, L24
- Sellwood & Binney (2002) Sellwood, J. A. & Binney, J. J. 2002, MNRAS, 336, 785
- Sharma et al. (2021) Sharma, S., Hayden, M. R., Bland-Hawthorn, J., et al. 2021, MNRAS, 506, 1761
- Silva Aguirre et al. (2018) Silva Aguirre, V., Bojsen-Hansen, M., Slumstrup, D., et al. 2018, Monthly Notices of the Royal Astronomical Society, 475, 5487
- Silva Aguirre et al. (2015) Silva Aguirre, V., Davies, G. R., Basu, S., et al. 2015, MNRAS, 452, 2127
- Silva Aguirre et al. (2017) Silva Aguirre, V., Lund, M. N., Antia, H. M., et al. 2017, ApJ, 835, 173
- Snaith et al. (2016) Snaith, O. N., Bailin, J., Gibson, B. K., et al. 2016, MNRAS, 456, 3119
- Solway et al. (2012) Solway, M., Sellwood, J. A., & Schönrich, R. 2012, MNRAS, 422, 1363
- Spitoni et al. (2019a) Spitoni, E., Cescutti, G., Minchev, I., et al. 2019a, A&A, 628, A38
- Spitoni et al. (2017) Spitoni, E., Gioannini, L., & Matteucci, F. 2017, A&A, 605, A38
- Spitoni & Matteucci (2011) Spitoni, E. & Matteucci, F. 2011, A&A, 531, A72
- Spitoni et al. (2009) Spitoni, E., Matteucci, F., Recchi, S., Cescutti, G., & Pipino, A. 2009, A&A, 504, 87
- Spitoni et al. (2014) Spitoni, E., Matteucci, F., & Sozzetti, A. 2014, MNRAS, 440, 2588
- Spitoni et al. (2008) Spitoni, E., Recchi, S., & Matteucci, F. 2008, A&A, 484, 743
- Spitoni et al. (2015) Spitoni, E., Romano, D., Matteucci, F., & Ciotti, L. 2015, ApJ, 802, 129
- Spitoni et al. (2019b) Spitoni, E., Silva Aguirre, V., Matteucci, F., Calura, F., & Grisoni, V. 2019b, A&A, 623, A60
- Spitoni et al. (2020) Spitoni, E., Verma, K., Silva Aguirre, V., & Calura, F. 2020, A&A, 635, A58
- Spitoni et al. (2021) Spitoni, E., Verma, K., Silva Aguirre, V., et al. 2021, A&A, 647, A73
- Ting et al. (2018) Ting, Y.-S., Hawkins, K., & Rix, H.-W. 2018, ApJ, 858, L7
- Ting & Rix (2019) Ting, Y.-S. & Rix, H.-W. 2019, ApJ, 878, 21
- van den Hoek & Groenewegen (1997) van den Hoek, L. B. & Groenewegen, M. A. T. 1997, A&AS, 123, 305
- Velazquez & White (1999) Velazquez, H. & White, S. D. M. 1999, MNRAS, 304, 254
- Vera-Ciro & D’Onghia (2016) Vera-Ciro, C. & D’Onghia, E. 2016, ApJ, 824, 39
- Verma et al. (2021) Verma, K., Grand, R. J. J., Silva Aguirre, V., & Stokholm, A. 2021, MNRAS, 506, 759
- Vincenzo & Kobayashi (2020) Vincenzo, F. & Kobayashi, C. 2020, MNRAS, 496, 80
- Vincenzo et al. (2019) Vincenzo, F., Spitoni, E., Calura, F., et al. 2019, MNRAS, L74
- Vincenzo et al. (2021) Vincenzo, F., Weinberg, D. H., Miglio, A., Lane, R. R., & Roman-Lopes, A. 2021, MNRAS, 508, 5903
- Walker et al. (1996) Walker, I. R., Mihos, J. C., & Hernquist, L. 1996, ApJ, 460, 121
- Weinberg et al. (2019) Weinberg, D. H., Holtzman, J. A., Hasselquist, S., et al. 2019, ApJ, 874, 102
- Woosley & Weaver (1995) Woosley, S. E. & Weaver, T. A. 1995, ApJS, 101, 181
- Yu et al. (2021) Yu, Z., Li, J., Chen, B., et al. 2021, ApJ, 912, 106