Explainable analysis of Deep Learning Methods
for SAR Image Classification
Abstract
Deep learning methods exhibit outstanding performance in synthetic aperture radar (SAR) image interpretation tasks. However, these are black box models that limit the comprehension of their predictions. Therefore, to meet this challenge, we have utilized explainable artificial intelligence (XAI) methods for the SAR image classification task. Specifically, we trained state-of-the-art convolutional neural networks for each polarization format on OpenSARUrban dataset and then investigate eight explanation methods to analyze the predictions of the CNN classifiers of SAR images. These XAI methods are also evaluated qualitatively and quantitatively which shows that Occlusion achieves the most reliable interpretation performance in terms of Max-Sensitivity but with a low-resolution explanation heatmap. The explanation results provide some insights into the internal mechanism of black-box decisions for SAR image classification.
Index Terms— SAR Image Classification; Explainable Artificial Intelligence; Deep Learning; Sentinel-1; OpenSARUrban
1 INTRODUCTION
Deep learning methods are playing an increasingly remarkable and irreplaceable role in practical applications of various fields [1], including the field of synthetic aperture radar (SAR) [2]. In order to fit complex data distribution and obtain better performance, they generally have an intricate network structure of opacity and extreme non-linearity. However, from a more rigorous perspective, the application of deep learning models in many fields is still limited, for lacking more reliable interpretability and explainability [3].
To circumvent these limitations, various explainable artificial intelligence (XAI) methods have been proposed, which provide some detailed explanations for the decision-making process of deep neural networks. The XAI methods could analyze and reveal the internal mechanisms to some extent, so as to give corresponding explanations and further evaluate the deep learning models [4].
In the field of Remote Sensing (RS), Ioannis et al. recently employed the XAI methods to analyze the deep learning models for optical remote sensing image classification based on the BigEarthNet and SEN12MS datasets [5]. Nevertheless, there is little work of explainable analysis of the deep neural networks for SAR image classification, despite their success in it.
In this paper, we conducted an explainable analysis for deep convolutional neural networks (DCNNs) for SAR image classification. Our contributions are:
- •
-
•
We employ eight XAI methods to explain the predictions of the ResNet101 network. We also evaluate these XAI methods qualitatively and quantitatively.
-
•
We conduct an in-depth analysis of the experimental results and draw some inspiration from explainable SAR image classification.
2 methodology
| Max-Sensitivity | XAI entropy (KB) | |||
| VH | VV | VH | VV | |
| Integrated Gradients | 0.0742 | 0.0952 | 28.663 | 30.841 |
| Input × Gradient | 0.1362 | 0.1527 | 29.123 | 29.812 |
| Guided Backpropagation | 0.0412 | 0.0392 | 24.34 | 24.099 |
| Deconvolution | 0.0766 | 0.0754 | 29.638 | 30.058 |
| Saliency | 0.1376 | 0.1534 | 52.624 | 52.14 |
| Occlusion | 0.0178 | 0.0195 | 4.305 | 4.191 |
| Guided Grad-CAM | 0.1819 | 0.1824 | 11.682 | 11.451 |
| Grad-CAM | 0.4528 | 0.4942 | 15.107 | 14.916 |
2.1 XAI Methods
We firstly train a ResNet101[6] on the OpenSARUrban dataset[7] which achieves state-of-the-art performance, and then apply eight XAI methods to understand the internal behavior of the SAR image classifier, including Saliency [8], Input × Gradient [9], Integrated Gradients [10], Guided Backpropagation [11], Grad-CAM [12], Guided Grad-CAM [12] and Deconvolution [13] .
The Input × Gradient (InputXGrad) method multiplies the input with the gradient by Equation 1. Compared with using the gradient alone, it shows more reliability [5].
| (1) |
The Guided Backpropagation method computes the gradient of the target output with respect to the input, but only non-negative gradients are backpropagated in that the gradients of ReLU functions are overridden.
The Integrated Gradients (IntGrad) method represents the integral of the gradients along the straightline path from a base input to the input [10]. The base input can be a root point of the desired function, which, for instance, can be the black image for the networks.
| (2) |
The Occlusion is a perturbation based approach that replaces each rectangular region with a given baseline / reference, and compares their output differences.
| (3) |
2.2 Evaluating Metrics
In order to evaluate the performance of the XAI methods, quantitative evaluation and qualitative evaluation were adopted by the metrics Max-Sensitivity [14] and XAI entropy, namely,File Size[15].
The Max-Sensitivity [14] metric measures the stability on the basis of the maximum explanation change with a subtle input disturbance, as in Equation 4. The smaller Max-Sensitivity score indicates a more reliable explanation.
| (4) |
The XAI entropy metric is the auxiliary evaluation index that measures the amount of information a XAI visualization image contains.
3 EXPERIMENTS
3.1 Experimental Setup
3.1.1 Dataset
Experiments were conducted on the OpenSARUrban dataset[7]. It is built on the Sentinel-1 imagery and consists of 10 different urban categories, covering 21 major cities in China. Each image patch includes 2 kinds of polarization, VV and VH polarization.
3.1.2 Implementation Details
Due to the different polarization modes, we divide the OpenSARUrban dataset into two parts: one is the VH-polarized part and the other is the VV-polarized part. We conduct the following experiments on these two parts separately.
We firstly adopt the ResNet101 mode[6] that achieves 83.44 percent classification accuracy in VH-polarized part and 84.44 in VV-polarized part of OpenSARUrban, by the data augmentation and integrating learning rate scheduler strategies. In the following, the XAI methods are utilized to comprehend the prediction of the trained models: Saliency, Input × Gradient, Integrated Gradients, Guided Backpropagation, Grad-CAM, Guided Grad-CAM, Occlusion, Deconvolution. We apply attribution analysis with visual examination and visualized the attributions by generating the heat maps for each image for every XAI method. At the same time, Max-Sensitivity and XAI entropy are applied to quantitatively evaluate the performance of the above XAI methods. The XAI experiments are implemented using the Captum library [16].
3.2 Results and Discussion
3.2.1 Quantitative Evaluation
Table 1 exhibits the experimental results of different XAI methods on the urban scenes classification task in SAR images.
In terms of the Max-Sensitivity metric, it is worth noting that lower scores indicate higher performance. Specifically, Occlusion, Guided Backpropagation and Integrated Gradients are among the top three lowest scores in the VH-polarized part while Occlusion, Guided Backpropagation and Deconvolution are among the three lowest scores in the VV-polarized part. On the other hand, Grad-CAM attains the highest score in both polarized data. For all cases, Occlusion is the most prominent XAI method with a Max-Sensitivity score of less than 0.05, while Grad-CAM performs the worst under Max-Sensitivity metric in interpreting the SAR image classifier’s prediction result.
In terms of the XAI entropy metric, the ranking results are roughly the same in both polarized datasets. Specifically, Occlusion, Guided Grad-CAM and Grad-CAM obtain the top three lowest scores in both polarized data. In addition, Occlusion ( 15 × 15 sliding window with 5 × 5 strides) provides us with more low-resolution information and rough explanations in interpreting the SAR image classifier’s prediction result, which possibly makes it easier for humans to understand this model.
3.2.2 Qualitative Evaluation
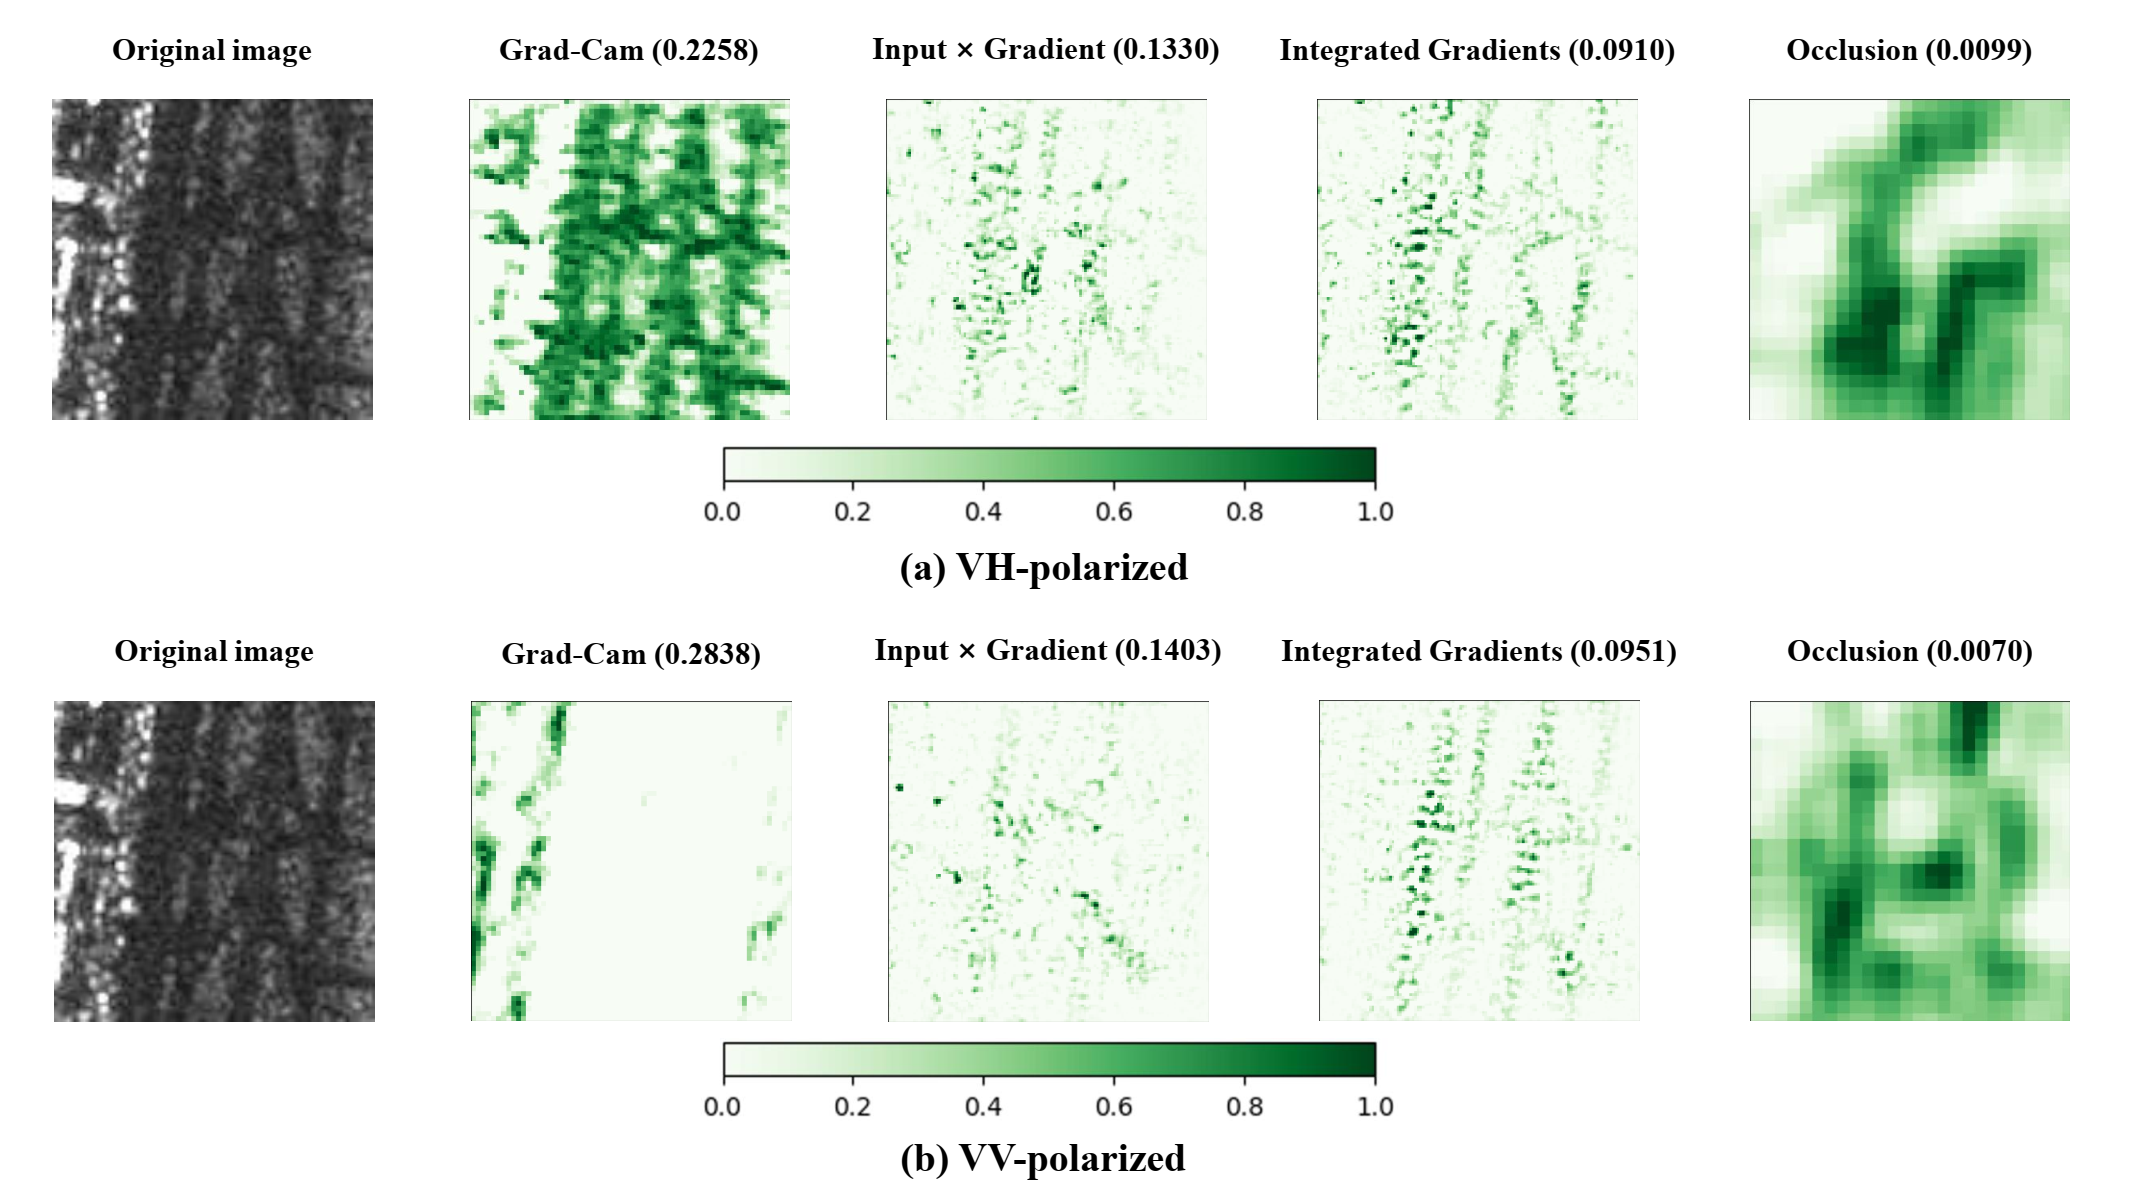
A representative case that we visualize the attributions of the XAI methods is presented in Fig. 1. Overall, after careful observation, all of the XAI methods manage to analyze and reveal the internal mechanism in both VH- and VV-polarized dataset.
Concerning visual examination, Occlusion, Integrated Gradients and Input × Gradient generally successfully mark the airstrip as an important area that corresponds to the airport class in both VH- and VV-polarized dataset, which is similar to our human cognition. However, it is worth mentioning that Grad-CAM exhibits too much explanation of many details, resulting in poorer anti-interference and higher Max-Sensitivity scores in the VH-polarized dataset. It seemed that less attention was focused on the airstrip in the VV-polarized dataset, leading to insufficient interpretability.
3.2.3 Discussion
Regarding the performance of XAI methods, on the one hand, Occlusion and Integrated Gradients are the most interpretable XAI methods in both quantitative evaluation and qualitative evaluation. They successfully explained the SAR image classification task by targeting the most relevant area of each image. Moreover, they achieved the lowest Max-Sensitivity scores, which indicates that when the input slightly changes, the interpretation result has no obvious difference, resulting in the highest reliability.
On the other hand, for quantitative evaluation, Grad-CAM performed worst, which exhibited too much explanation of many details and ignored the main relevant regions of each image, resulting in poorer anti-interference and higher Max-Sensitivity scores. Additionally, for qualitative evaluation, Deconvolution was the least interpretable XAI method, although it achieved relatively low Max-Sensitivity scores. The reason is that the internal mechanism of Deconvolution causes gradients of ReLU functions to be overridden.
4 CONCLUSIONS
In this paper, we utilized eight XAI methods to explain the ResNet101’s prediction of SAR image classification on OpenSARUrban and evaluate them qualitatively and quantitatively. We observe that each method has its own merits. Occlusion achieves the most reliable interpretation performance with the lowest Max-Sensitivity score. However, it failed to provide high-resolution information and detailed explanations. The XAI methods can reveal the internal mechanism of deep learning methods and provide some insights into SAR image classification tasks to some extent.
References
- [1] L. Deng and D. Yu, “Deep learning: Methods and applications,” Found. Trends Signal Process., vol. 7, p. 197–387, jun 2014.
- [2] Y. Zhou, H. Wang, F. Xu, and Y.-Q. Jin, “Polarimetric sar image classification using deep convolutional neural networks,” IEEE Geoscience and Remote Sensing Letters, vol. 13, no. 12, pp. 1935–1939, 2016.
- [3] K. Cheng, N. Wang, and M. Li, “Interpretability of deep learning: A survey,” in Advances in Natural Computation, Fuzzy Systems and Knowledge Discovery, H. Meng, T. Lei, M. Li, K. Li, N. Xiong, and L. Wang, Eds. Cham: Springer International Publishing, 2021, pp. 475–486.
- [4] S. Lapuschkin, S. Wäldchen, A. Binder, G. Montavon, W. Samek, and K.-R. Müller, “Unmasking clever hans predictors and assessing what machines really learn,” Nature Communications, vol. 10, 03 2019.
- [5] I. Kakogeorgiou and K. Karantzalos, “Evaluating explainable artificial intelligence methods for multi-label deep learning classification tasks in remote sensing,” International Journal of Applied Earth Observation and Geoinformation, vol. 103, p. 102520, 2021.
- [6] K. He, X. Zhang, S. Ren, and J. Sun, “Deep residual learning for image recognition,” in Proceedings of the IEEE Conference on Computer Vision and Pattern Recognition (CVPR), June 2016.
- [7] J. Zhao, Z. Zhang, W. Yao, M. Datcu, H. Xiong, and W. Yu, “Opensarurban: A sentinel-1 sar image dataset for urban interpretation,” IEEE Journal of Selected Topics in Applied Earth Observations and Remote Sensing, vol. 13, pp. 187–203, 2020.
- [8] K. Simonyan, A. Vedaldi, and A. Zisserman, “Deep inside convolutional networks: Visualising image classification models and saliency maps,” in In Workshop at International Conference on Learning Representations, 2014.
- [9] A. Shrikumar, P. Greenside, and A. Kundaje, “Learning important features through propagating activation differences,” in Proceedings of the 34th International Conference on Machine Learning - Volume 70, ser. ICML’17. JMLR.org, 2017, p. 3145–3153.
- [10] M. Sundararajan, A. Taly, and Q. Yan, “Axiomatic attribution for deep networks,” in Proceedings of the 34th International Conference on Machine Learning - Volume 70, ser. ICML’17. JMLR.org, 2017, p. 3319–3328.
- [11] J. Springenberg, A. Dosovitskiy, T. Brox, and M. Riedmiller, “Striving for simplicity: The all convolutional net,” 12 2014.
- [12] R. R. Selvaraju, M. Cogswell, A. Das, R. Vedantam, D. Parikh, and D. Batra, “Grad-cam: Visual explanations from deep networks via gradient-based localization,” in 2017 IEEE International Conference on Computer Vision (ICCV), 2017, pp. 618–626.
- [13] A. Mahendran and A. Vedaldi, “Salient deconvolutional networks,” in Computer Vision – ECCV 2016, B. Leibe, J. Matas, N. Sebe, and M. Welling, Eds. Cham: Springer International Publishing, 2016, pp. 120–135.
- [14] C.-K. Yeh, C.-Y. Hsieh, A. S. Suggala, D. I. Inouye, and P. Ravikumar, “On the (in)fidelity and sensitivity of explanations,” in NeurIPS, 2019.
- [15] W. Samek, G. Montavon, S. Lapuschkin, C. Anders, and K.-R. Müller, “Toward interpretable machine learning: Transparent deep neural networks and beyond,” 03 2020.
- [16] N. Kokhlikyan, V. Miglani, M. Martin, E. Wang, B. Alsallakh, J. Reynolds, A. Melnikov, N. Kliushkina, C. Araya, S. Yan, and O. Reblitz-Richardson, “Captum: A unified and generic model interpretability library for pytorch,” 2020.