ALMA Survey of Orion Planck Galactic Cold Clumps (ALMASOP): Evidence for a Molecular Jet Launched at an Unprecedented Early Phase of Protostellar evolution
Abstract
Protostellar outflows and jets play a vital role in star formation as they carry away excess angular momentum from the inner disk surface, allowing the material to be transferred toward the central protostar. Theoretically, low velocity and poorly collimated outflows appear from the beginning of the collapse, at the first hydrostatic core (FHSC) stage. With growing protostellar core mass, high-density jets are launched which entrain an outflow from the infalling envelope. Until now, molecular jets have been observed at high velocity ( 100 km/s) in early Class 0 protostars. We, for the first time, detect a dense molecular jet in SiO emission with small-velocity ( 4.2 km s-1, deprojected 24 km s-1) from source G208.89-20.04Walma (hereafter, G208Walma) using ALMA Band 6 observations. This object has some characteristics of FHSCs, such as a small outflow/jet velocity, extended 1.3 mm continuum emission, and N2D+ line emission. Additional characteristics, however, are typical of early protostars: collimated outflow and SiO jet. The full extent of the outflow corresponds to a dynamical time scale of 930 years. The spectral energy distribution also suggests a very young source having an upper limit of Tbol 31 K and Lbol 0.8 L☉. We conclude that G208Walma is likely in the transition phase from FHSC to protostar, and the molecular jet has been launched within a few hundred years of initial collapse. Therefore, G208Walma may be the earliest object discovered in the protostellar phase with a molecular jet.
1 Introduction
In the standard theory of low-mass star formation (Shu et al., 1987), a prestellar core contracts quasistatically into a dense core (e.g., Larson, 1969; Nakano, 1979; Lizano & Shu, 1987), and dynamical inside-out collapse follows the formation of a singular isothermal sphere (Shu, 1977). In the presence of a magnetic field, an extended pseudo-disk (appearing as a flattened envelope) of a few thousand AU forms perpendicular to the field threading the core (Galli & Shu, 1993) during this transition phase from prestellar core to protostar formation (Li & Shu, 1996; Allen et al., 2003). Very slow and poorly collimated outflows, with velocity 10 km/s, can emerge from cores having initial rotation (Allen et al., 2003; Mellon & Li, 2008; Hennebelle & Fromang, 2008). In some Magneto hydrodynamic (MHD) simulations, a transient object called the first (opaque) core (later often dubbed the first hydrostatic core; FHSC) can appear at the center of the pseudo-disk (e.g., Tomisaka, 2002; Ciardi & Hennebelle, 2010). The candidate FHSC may have an observed spectral energy distribution (SED) intermediate between those of prestellar cores and Class 0 sources (Maureira et al., 2020).
Protostellar outflows and jets are among the most intriguing phenomena associated with the accretion process during star formation since they are believed to carry away excess angular momentum from the disk surface, therefore, allowing material to fall onto the central protostar (Bally, 2016; Lee, 2020). Theoretically, an outflow of low-density, extended material is expected to appear at the earliest phase of the collapse process, i.e., the first core formation stage (Larson, 1969; Machida, 2014). In contrast, high-density jets are expected to be launched a few hundred years after the initial collapse, possibly from the second core (protostar). With time, the fast jet will catch up with the tips of the previous, slow outflow (Tomisaka, 2002; Machida, 2014; Machida & Basu, 2019). To date, molecular jets with very high jet velocities, 100 km s-1 and mass-loss rates, 10-6 M☉ yr-1, have been observed around Class 0 protostars (Lee, 2020). While FHSC candidates and their associated outflows have been reported (e.g., Chen et al., 2012; Maureira et al., 2020), the start of the fast jet-launching phase during protostellar collapse, i.e., the intermediate stage between the FHSC and protostar formation, remains less explored observationally.
A sample of extremely cold dense cores has been observed as a part of the ALMA Survey of Orion Planck Galactic Cold Clumps (ALMASOP; Dutta et al., 2020), which opens the opportunity to detect the earliest stage of protostars and investigate the initial condition of protostellar evolution. In this manuscript, we present the detection of a dense molecular SiO jet at an unprecedentedly early protostellar stage, possibly the FHSC-to-protostellar transition phase, in the dense core G208.89-20.04Walma (hereafter, G208Walma), located at a distance of 400 pc (an average distance of Orion star-forming regions, Kounkel et al., 2018). This is potentially the first detection of an SiO jet at such an early evolutionary stage. In section 2, we describe the observations used. Section 3 deals with the outflow, jet, and envelope properties. The evolutionary phase of G208Walma is discussed in section 4, with the conclusion in section 5.
2 Observations
G208Walma was observed with ALMA as a part of the ALMASOP survey of extremely young dense cores (Project ID:2018.1.00302.S; PI: Tie Liu) in Band 6 (see Dutta et al., 2020, for more details on ALMASOP). This paper discusses 1.3 mm dust continuum, C18O (21), N2D+ (32), CO (21), SiO (54) and three H2CO transitions: 3(0,3)2(0,2), 3(2,2)2(2,1), 3(2,1)2(2,0). The calibration of the acquired visibilities was performed with the standard pipeline in CASA 5.4 (McMullin et al., 2007). Two sets of continuum and line-cubes were generated with the TCLEAN task: (i) combining visibilities of three configurations (i.e., TM1+TM2+ACA), which produces an image of a typical synthesized beam size 041 034 (69), and (ii) only using the 7-m ACA configuration to produce a typical synthesized beam size 792 442 (80) for continuum and 842 467 (79) for line cubes. From here on, we refer to the first case as high-resolution and the latter case as low-resolution. We applied a robust weighting factor of Rw = 2.0 (natural weighting) for the 1.3-mm ACA continuum, which is adequate to achieve maximum continuum flux for dust mass estimation. For the remaining cases, we utilized Rw = 0.5. The continuum maps were generated with a threshold of 3 , where is the theoretical sensitivity. The line-cubes have a velocity resolution of 1.4 km s-1, and typical sensitivity of 3 mJy beam-1 at high-resolution and 30 mJy beam-1 at low-resolution. More details on the data analyses are presented by Dutta et al. (2020).
| Parameter (Unit) | South | North | Total |
|---|---|---|---|
| Jet | |||
| Vobs,out∗ (km s-1) | 4.2 | 4.2 | |
| NCO (1016 cm-2) | 2.30 | 2.02 | |
| Ṁj (10-7 M☉ yr-1) | 1.01 | 0.95 | 1.96 |
| Lmech (10-3 L☉) | 1.03 | 0.75 | 1.78 |
| NSiO (1013 cm-2) | 2.7 | 1.8 | |
| X[SiO/CO] (10-4) | 5.8 | 4.2 | |
| Outflow | |||
| Size† (103 au) | 4.5 | 5.0 | |
| tdyn † (yr) | 890 | 970 | |
| FCO (10-8 M☉km s-1/yr) | 0.5 | 0.3 | 0.8 |
Note. — ∗ The outflow/jet velocity (Vobs,out) is estimated to be 4.2 km s-1. The deprojected jet velocity, Vj = 24 km s-1, was obtained for an inclination angle of 10.
† Estimated based on full outflow extension as observed at 7-m ACA primary beam.
3 Results
3.1 Physical Structure of CO outflow
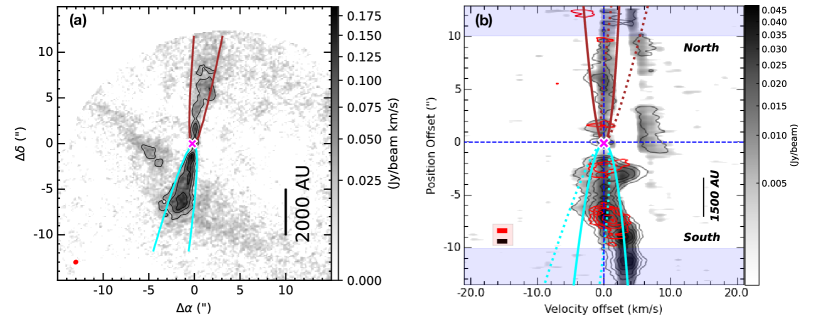
The 12CO emission map integrated over velocity range 2.8 – 8.4 km s-1 and the position-velocity (PV) diagram along the outflow/jet axis are shown in Figure 2a and b, respectively. SiO contours are over-plotted in red in Figure 2b. CO and SiO emissions are extended in the North-East direction with a position angle of 80. The velocity axis in Figure 2b is the velocity offset from the systemic velocity, Vsys = 7 km s-1, estimated from the N2D+ emission. Here velocity offset, Voff = – , where is the observed channel velocity. Visual inspection of the channel maps (Figure A1) and CO/SiO spectra (Figure A4) suggest that emission beyond 4.2 km s-1 velocity offset is tracing ambient material. In Figure 2b, the emission in the Northern lobe (positive position offset) has two clear isolated parallel components: one around the source velocity and another beyond 4.2 km s-1 velocity offset, which is likely the ambient material. Similarly, the Southern lobe (negative position offset) is combined with ambient cloud at 4.2 km s-1 velocity offset. In Figure 2b, the shaded region in blue at the end of each lobe, beyond 10, is dominated by ambient material in the combined configuration TM1+TM2+ACA maps. Based on SiO and CO emission, the maximum observed velocity offset (Vobs,out) of the outflow/jet is 4.2 kms-1. The PV diagrams and the spectra of CO and SiO do not exhibit any high-velocity component, therefore it is difficult to disentangle the velocity distribution of the outflow, swept up material, and jet components.
Following the simple analytical model by Lee et al. (2000), the physical structure of the outflow shell in CO emission is described by the equation , where is the (cylindrical) radial distance from the outflow axis and is a proportionality constant. In Figure 2a, fitting a parabola to the outermost contour of the outflow yields C = 3.3 and 5.0 for the Southern and Northern lobe, respectively. With these values, we aim to fit parabolas to the respective outflow lobes in the PV diagram (Figure 2b). We are unable to obtain a fit to the PV structures. We display two example fits assuming inclination angles = 1 and 10 for both the lobes. From the ratio of major and minor axis in 1.3 mm continuum and N2D+ emission (see section 3.4), we estimated an 20. However geometrically thick emission from young stars might not demonstrate the actual orientation of the disk. Thus, we conclude that the could be in the range 120. We therefore assume an intermediate 10 for G208Walma, which is utilized for deprojection of other observed parameters.
3.2 Detection of a dense molecular jet
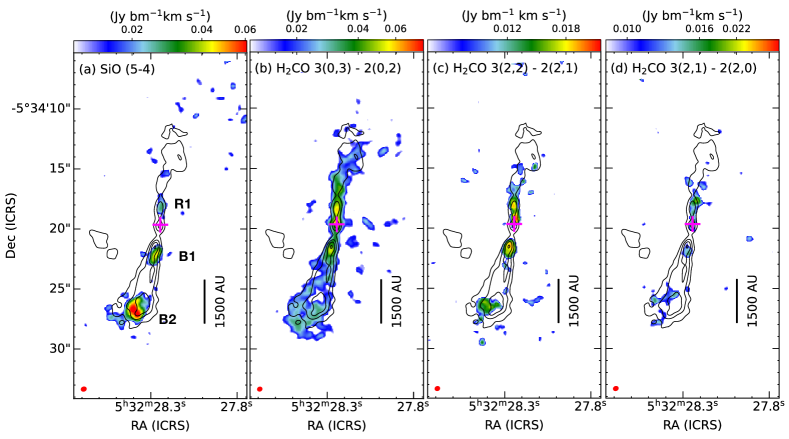
Figures 4a-d show the high-resolution integrated intensity maps in SiO (5–4) and three H2CO transitions. A rotation diagram using the energy levels of H2CO transitions is shown in Figure 6. High-resolution integrated intensity CO contours from Figure 2a are over plotted in Figures 4a-d for comparison and the low-resolution CO contours are displayed in Figure 8c.
In section 3.1, we found that the maximum flow velocity in CO emission is Vmax,CO 4.2 km s-1 (Table 1) and similarly in SiO, Vmax,SiO 4.2 km s-1. Both SiO and CO emission exhibit low-velocity components with a very similar velocity range, complicating the separation of the jet component from swept-up material (outflow) based on flow velocity only. Therefore, we define the jet component by considering the density perspective using SiO and CO. CO emission above the 3 contour is considered as outflow shell, as shown in Figure 2a. On the other hand, observations of other sources in SiO (5–4) have shown that it traces the dense shocked gas, and SiO (5–4) emission along the outflow axis mainly implies the high-density jet (e.g., Bally, 2016; Lee, 2020, references therein). We compute the critical density for SiO (5–4) emission as 2.53.0 106 cm-3 for jet temperatures between 50 - 300 K, where the Einstein A coefficient is adopted from CDMS database (Müller et al., 2001) and collisional rate coefficients from (Balança et al., 2018). Such critical densities should be reached only in the jet or knots. Therefore, despite the low velocity of the outflow/jet material, we consider the SiO (5–4) emission, found along the outflow/jet axis of G208Walma, to indicate the jet component.
A few knot-like structures (B1, B2, R1 in Figure 4) are prominent in SiO emission, and are also traced by CO and higher transitions of H2CO emission (Figures 4c-d). Two knots closest to the source (B1 and R1 in Figure 4a) on the Southern and Northern lobes are possibly part of the jet, whereas the SiO emission at outermost part of Southern lobe (B2 in Figure 4a) might be part of the collision zone between the jet/outflow and ambient material (see also Figure 2b, 8d, and A1). The maximum outflow and jet observed velocity, Vobs,out = 4.2 km s-1, based on CO and SiO emission, corresponds to a de-projected jet velocity of V 24 km s-1 for an assumed inclination angle, =10 (see section 3.1 for details). These outflow/jet properties are listed in Table 1.
The jet mass-loss rate Ṁ${}_{j}$ was derived using the average CO emission from the two knot-areas close to the source (B1 and R1 in Figure 4). Assuming optically thin emission in the jet, we estimate a beam-average CO column density (NCO) of 2.16 1016 cm-2. We assume a high CO excitation temperature of Tex,jet 150 K, since the jet emission is associated with internal shocks at high temperature (Gibb et al., 2004; Lee et al., 2007, 2010). NCO is then converted into beam-averaged H2 column density, N, assuming a CO abundance ratio, XCO = NCO/N = 4 10-4 (Glassgold et al., 1991). However, we note that this ratio could be as small as 10-4 (Hirano et al., 2010; Yıldız et al., 2015), hence the measured N should be considered a lower limit. Using equation A1 from Appendix A.2, the total jet mass-loss rate (Ṁj) is estimated to be 1.96 10-7 M☉ yr-1, considering the deprojected velocity. A very small mechanical luminosity (Lmech 1.78 10-3 L☉) is found. Similar values of Ṁj and Lmech were also observed toward other Class 0 and Class I protostars with SiO jets (e.g., Podio et al., 2021; Dutta et al., 2021).
For the low-density outflow, we assume a smaller mean specific excitation temperature of Tex,out = 50 K with a smaller abundance ratio, XCO 10-4, than that for the jet (Yıldız et al., 2015; Dutta et al., 2022). We use a lower temperature here since the low-density outflow is coasting into ambient material of cooler environment. Using equation A3 from Appendix A.3, we estimate a total outflow force (FCO) of 0.8 10-8 M☉km s-1/yr for the entire CO emission. We note that FCO for each channel is proportional to the velocity of that channel, Vk. G208Walma has velocity dispersion on both sides of the systemic velocity (Vsys = 7.0 km -1), which makes it difficult to estimate the exact Vk from our low-velocity resolution ( 1.4 km s-1) observations. High velocity-resolution observations, therefore, might alter the outflow force measurement by a factor of 2–4. Furthermore, for G208Walma, the outflow emission is collimated and mostly covers the emitting area of the jet, where Tex,out is likely higher. Therefore, the estimated FCO should be a lower limit.
Low-resolution ACA maps offer maximum field-of-view, covering the full extent of the outflow lobes (Figure 8c). From this map, we estimate an average length for the lobes of 12 ( 4800 au), which corresponds to an average deprojected dynamical time scale of tdyn 930 yr (Table 1) for = 10. Here, the error bars are derived based on the uncertainty in the before-projection lobe length estimation. A change of 5 can alter this value by 50%.
Similar to the CO analysis, we estimate a mean SiO column density (NSiO) of 4.5 1013 cm-2 from the mean integrated SiO emission with the assumption of optically thin emission and a Tex,jet of 150 K within the jet. The average SiO/CO abundance ratio, X[SiO/CO] is 5.0 10-4. Such high SiO abundance has been previously observed during the a very early stage of the protostellar collapse (Hirano et al., 2010; Tabone et al., 2020; Podio et al., 2021; Dutta et al., 2021). .
3.3 H2CO along the jet axis
H2CO commonly traces both outflow and disk/envelope emission. If carbon molecules dissociate due to high temperatures ( 20 K), H2CO molecules synthesize around protostars (Öberg et al., 2017). Figure 4b-d displays three transitions of H2CO. From the maps, it is not clear whether H2CO traces either the disk or envelope for this source, although it efficiently traces the outflow lobes. The lower transitions are excited at low temperatures, which can trace the entire outflow lobe (e.g., Figure 4b). The higher transitions are more concentrated toward the dense knot structures along with the jet (e.g., Figure 4d).
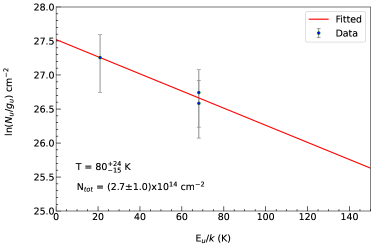
The average observed integrated flux at the knot-positions for the three transitions of H2CO are listed in Table 2. The Einstein coefficients (Aul) and upper energy levels (Eu) are obtained from Spatalogue (https://splatalogue.online//). We derive the mean excitation temperature and column density in the outflow/jet using the 12CO rotational temperature diagram. Here we assume optically thin emission and the same excitation temperature for all transitions. Figure 6 displays the column density per statistical weight (N/) as a function of the upper energy level (Eu) of the lines (see Table 2 for parameters). Here N = (8 /)I, where the integrated line intensity is I = TBd for brightness temperature TB. The best fit rotational temperature is derived as Trot = 80 K. Assuming this temperature represents the excitation temperature of the jet/outflow, we estimated a total column density, N (2.7 1.0) 1014 cm-2. Note that the H2CO transitions may trace different components in different transitions, such as the outflow in the lower transitions and the jet in the higher transitions. Thus, the computed Trot may represent an intermediate temperature between the jet and outflow and is therefore not used in section 3.2 as either outflow or jet excitation temperature.
| Transition | Frequency | (Aul) | Eu | W | Line |
|---|---|---|---|---|---|
| (GHz) | (s-1) | (K) | (Jy bm-1 km s-1) | ||
| 3( 0, 3)- 2( 0, 2) | 218.222192 | -3.55037 | 20.95640 | 0.084 | JPL |
| 3( 2, 2)- 2( 2, 1) | 218.475632 | -3.80403 | 68.09370 | 0.028 | JPL |
| 3( 2, 1)- 2( 2, 0) | 218.760066 | -3.80235 | 68.11081 | 0.024 | JPL |
3.4 Envelope Emission
Figure 8(a) shows the 1.3 mm dust continuum emission. At high-resolution, the continuum emission is resolved out, whereas at low-resolution (ACA) the emission is quite extended, revealing the source envelope. The observed line emission associated with the outflow is mostly confined within the envelope. Gaussian fitting to the low-resolution ACA image provides a flux density (Fν) of 69.0 mJy, with a peak emission of 34.5 mJy beam-1. The Gaussian fitted deconvolved parameters are tabulated in Table 3. The core has an effective radius of Reff = 2500 AU.
We derive the dust mass corresponding to this Fν under the assumption of optically thin emission, using the equation:
| (1) |
where D is the distance to the Orion molecular cloud 400 pc (Kounkel et al., 2018) and Bν stands for the Planck blackbody function at a dust temperature of Tdust. Fitting the Planck blackbody function to the multiwavelength fluxes provided in Appendix B, we estimate Tdust of 15 5 K. represents the mass opacity of the protostellar core at 1.3 mm, which can be expressed as = 0.00899(/231 GHz)β cm2 g-1 (Lee et al., 2018) in the early phase for coagulated dust particles with no ice mantles (see also, OH5: column 5 of Ossenkopf & Henning, 1994), given a gas-to-dust mass ratio of 100 and spectral index 1.7 for the envelope. The final mass is estimated to be MEnv 0.38 0.14 M☉.
| Deconvolved Parameters | value (Unit) |
|---|---|
| Flux | 69.0 3.5 (mJy) |
| Peak | 34.5 1.3 (mJy/bm) |
| Maj | 8.77 0.77 () |
| Min | 4.45 0.34 () |
| PA | 94.45 4.75 () |
| Mass | 0.38 0.14 () |
| Reff | 2500 (AU) |
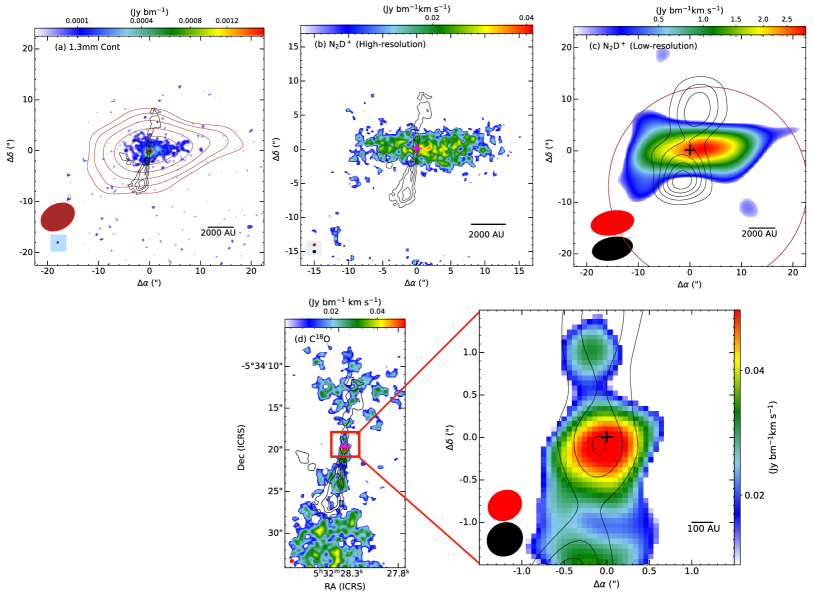
Deuterated species mainly trace the prestellar stage or very early phase of protostar evolution. Figure 8(b) and (c) delineate N2D+ emission at high and low-resolution, respectively. Only two channels, at velocity 5.6 – 7.0 km s-1, display N2D+ emission. The channel at 7.0 km s-1 has the strongest emission and is considered the Vsys for G208Walma. G208Walma exhibits very extended N2D+ emission, which is quite similar in morphology to the 1.3 mm continuum emission. Interestingly, the N2D+ peak is 500300 AU apart from the dust continuum peak, estimated from Gaussian fitting to both images. Here, we assume the error bar to be of order twice the high-resolution beam size. This separation is evident in both the high-resolution as well as the low-resolution map. Assuming optically thin emission and an excitation temperature of 10 K, we derive an average N2D+ column density N 1.2 1012 cm-2.
C18O emission, displayed in Figure 8(d), usually originates from the compact central part of the source. Only two channels, at velocity 7.0 and 8.4 km s-1, show C18O emission. For this source, the C18O emission is likely tracing the object as well as the ambient material. Given such complicated morphology, the true object emission is difficult to disentangle from our low-velocity resolution observations. Considering the uncertainties in estimation, we suggest that the C18O emission in the central part (zoomed view of 8c) is possibly originating from a small central compact core where N2D+ is weak. This implies that the gas surrounding the central protostar is heated above the CO evaporation temperature ( 20 K). Another interesting fact to note is that, comparing Figure 4a and 8c, the Southern lobe of the outflow tip is possibly interacting with ambient material. Thus, the SiO emission there may be due to collisional excitation.
4 Discussion
A small observed outflow velocity, Vobs,out 10 km s-1 is one of the main characteristics of candidate FHSCs (Hirano & Liu, 2014; Maureira et al., 2020). G208Walma exhibits Vobs,out 4.2 km s-1, analogous to those of FHSCs. However, the deprojected Vj 24.0 km s-1 is higher than that of the FHSC limit. The outflow is spatially extended up to 4800 AU when deprojected and has a tdyn 930 years, which suggests that the object could be at a very early phase. The outflow lobes appear to be collimated in the high resolution maps (Figure 4a-d), similar to Class 0 protostars.
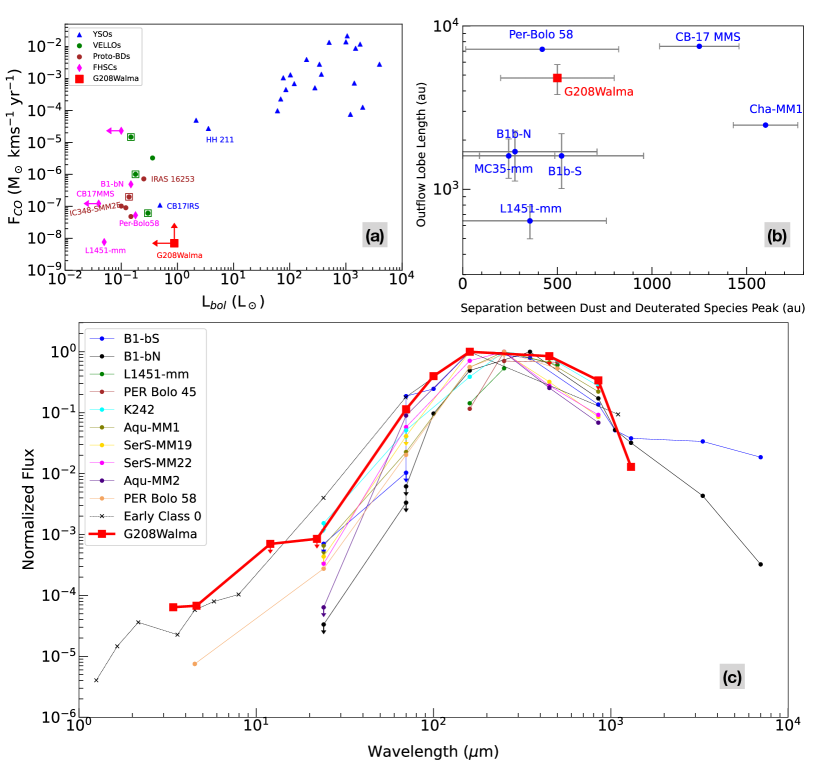
A correlation between FCO and Lbol has been investigated in the literature to probe the evolutionary stages of protostars (e.g., Bontemps et al., 1996). Using multiwavelength observed flux, we estimate the bolometric luminosity (Lbol) and bolometric temperature (Tbol) for G208Walma (see Appendix B for the details). In Figure 10a, we compare G208Walma with normal young stellar objects (YSOs), very low-luminosity objects (VeLLOs), proto brown dwarfs (proto-BDs), and candidate FHSCs from Palau et al. (2014, see their Table 4 and Figure 7, and references therein) and Hsieh et al. (2016, see their Figure 13). Here we note that proto-BDs are also in the VeLLOs category. When the protostar evolves from the initial collapse phase, the luminosity of the central core increases. The accretion/ejection activity is also expected to increase up to a certain phase, possibly up to the late Class 0 or early Class I, consequently the FCO should increase with protostellar evolution. Therefore, the YSOs in Figure 10a exhibit higher Lbol and higher FCO compared with the youngest protostars and candidate FHSCs, VeLLOs, proto-BDs.
G208Walma appears much younger than YSOs like HH 211, and shares a lower limit of FCO and an upper limit for Lbol with the VeLLOs, Proto-BDs and FHSCs in Figure 10a. It is likely more evolved than the candidate FHSCs L1451-mm. G208Walma is embedded within a large reservoir (effective radius 16,500 au) with mass 4.78 M☉, estimated from the 850 m emission obtained by the James Clerk Maxwell Telescope (JCMT) (island #25 in Mairs et al., 2016). From the 1.3 mm continuum emission, it possesses a thick envelope of mass 0.38 M☉. If we assume 1/3 of the envelope would be accreted to the central protostar then even with the mass observed with ALMA, a star of mass 0.12 M☉ will form. Thus, G208Walma may not form a proto-BDs but rather a very low-mass star, and it may have already passed the FHSC phase or be transiting from an FHSC to a protostar.
Detection of SiO in a jet signifies very high accretion/ejection activity within a protostar. The SiO jet is usually launched from the earliest Class 0 protostars having very high jet mass-loss (Ṁj 10-6 M☉ yr-1) and very high Vj ( 100 km s-1) e.g., B 335 (Bjerkeli et al., 2019), HH 211 (Lee et al., 2018). Dense SiO emission is detected within the outflow cavity of G208Walma, although it exhibits a smaller Vj and Ṁj ( 1.96 10-7 M☉ yr-1; Table 1), indicating that a protostar may have already formed inside the core which has passed through the second collapse phase or is transitioning from an FHSC to a protostar. To form SiO in the jet, the SiO needs to be synthesized from larger dust grains either (i) at the shock region in the jet through grain sputtering or (ii) at the dust sublimation zone near the protostellar core. In the first case, the shock velocity (Vs) is predicted to be 10 Vs 40 km s-1 (Schilke et al., 1997). For G208Walma, the observed Vs is 4 km s-1 in the Northern lobe, whereas the southern part is blended with ambient material and difficult to measure (Figure 2b). The Vs could be affected largely due to our low sensitivity and low velocity resolution. For the latter case, the Si could have been released from grain surfaces in the dust sublimation zone near the object and synthesized into SiO. The Lbol of 0.80 L☉ suggests that the dust sublimation radius could be 0.1 AU (Millan-Gabet et al., 2007). Comparison of the measured X[SiO/CO] and Ṁj from Table 1 with the astrochemical model of Tabone et al. (2020, their Figure 12) suggests that the jet may have been launched from the outermost region of the dust-free zone, where the dust-to-gas ratio (Q) is relatively higher (0.1 to 0.01).
Schnee et al. (2012) detected extended SiO (2–1) emission from another very young source, Per-Bolo 45, at a distance of 20 south of the object and with velocities within 1 km s-1 of the ambient velocity. They interpreted this detection as tentative evidence for a jet in Per-Bolo 45. However, Maureira et al. (2020) extensively studied this object and suggested that this SiO (2-1) emission is possibly not associated with Per-Bolo 45, rather it is a collision zone between Per-Bolo 45 and the outflow tip of another source SVS 13c. They also concluded that Per-Bolo 45 is pre-stellar in nature where a compact object is not formed yet, such as a case of an FHSC.
As starless cores evolve toward collapse, the molecular deuterium fraction in the gas phase (e.g., N2D+/N2H+) increases and reaches maximum at the onset of star formation (Crapsi et al., 2005; Emprechtinger et al., 2009; Tatematsu et al., 2021). Once the protostar is formed inside the core, the deuterium fraction declines (Gerner et al., 2015; Sakai et al., 2021) as the star heats up the surrounding medium and dissociates deuterated species. As a consequence, the centre of the observed N2D+ peak could be shifted away from the protostar, whereas the dust continuum peak remains unaltered and represents the envelope emission around the central protostar. Therefore, the shift in N2D+ emission and dust continuum peak could provide a possible indication of the evolution of the dense core. In the case of G208Walma, the continuum peak is observed at the middle of the dense core (in Figure 8c) and the approximate size of the dense core on both sides of the continuum peak appears the same. The N2D+ peak, however, is shifted by 500300 AU. We compare this separation and outflow lobe length with other young known FHSC candidates and young protostars in Figure 10b. G208Walma appears to be more evolved than the most promising candidate FHSC L1451-mm (Maureira et al., 2020), and comparable with the young protostar/candidate FHSC B1b-S (Hirano & Liu, 2014). It might also be younger than Cha-MM1, CB-17 MMS (Chen et al., 2012). We caution, however, that high uncertainties in the measured separation prevent drawing a specific evolutionary trend.
The estimated Tbol and Lbol for G208Walma (Appendix B) suggest that a protostar may have already formed inside the core, although it is not much evolved towards Class 0 phase. In Figure 10c, we compare the SED of G208Walma with other known candidate FHSCs and average early Class 0 spectra (Tbol 50 K) from Enoch et al. (2009). From 24 m and above, G208Walma spectra fairly resembles to the candidate FHSCs with the SED peak is around 150-250 m.
5 Conclusions
In this work we analyze ALMA observations at 1.3 mm continuum and molecular line emission for the object G208Walma. The observations suggest a low-velocity outflow from G208Walma is present (observed velocity 4.2 km s-1 and corresponding deprojected Vj 24.0 km s-1), with compact SiO emission along the outflow suggesting the presence of a dense jet. We estimate a smaller jet mass-loss rate (Ṁj 1.96 10-7 M☉ yr-1) and smaller outflow force (FCO 0.8 10-8 M☉km s-1/yr) than that of other observed protostars in the literature. Dynamical time (tdyn 930 years), extended 1.3 mm emission (Reff 2500 AU), extended and offset N2D+ emission, and the SED suggest that the source is at the very early stage of protostellar evolution, possibly within a few hundred years of the second collapse. Therefore, G208Walma could be the earliest protostellar object with a molecular jet observed to date.
.
Appendix A CO emission and Jet/Outflow parameters
A.1 Channel Maps and Spectra
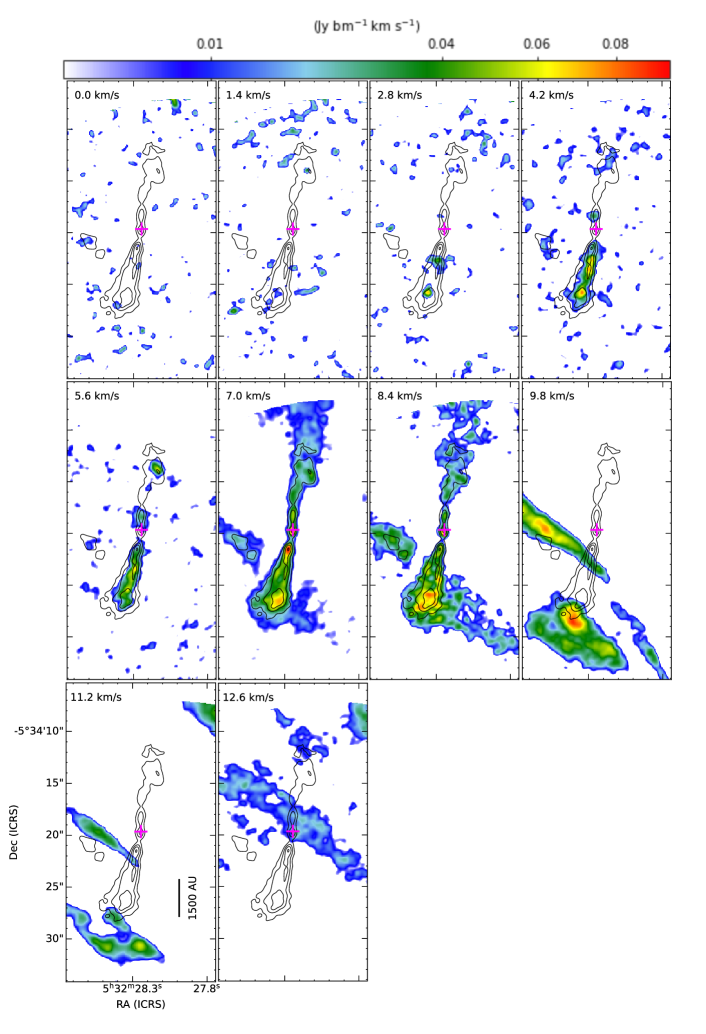
Figure A1 displays the CO channel maps at different velocities. The outflow emission channels in the Southern lobe range from Vobs = 2.8 to 8.4 km s-1. The channel at Vobs 8.4 km s-1 is possibly showing both outflow and ambient material. The Northern channels range from Vobs = 4.2 to 8.4 km s-1, where the channel at Vobs = 2.8 km s-1 also shows some faint emission. The systemic velocity of G208Walma is Vsys = 7.0 km s-1. For both the lobes, the maximum flow velocities are considered to be Voff = – = 4.2 km s-1. The outflow emission in the southern and northern velocity channels are not equally distributed on both side of Vsys, therefore, it is difficult to define blueshifted and redshifted emission precisely for G208Walma. Such outflow velocity structure around Vsys suggests a small inclination angle of the system. The channels from Vobs = 7.0 to 11.2 km s-1 indicate that the tip of the southern jet/outflow lobe is possibly colliding with ambient material. Thus, the SiO emission at the outermost part of the Southern lobe could be a combination of jet emission and a collision zone.
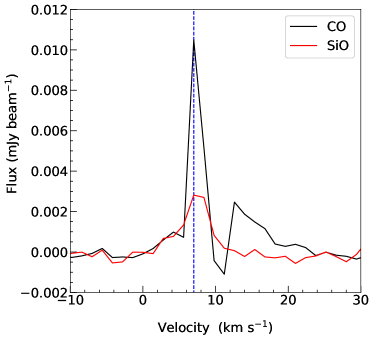
Spectra in CO and SiO emission from a rectangular region along the outflow/jet axis are displayed in Figure A4. The SiO emission is confined between 2.8 to 10 km s-1. The CO emission has two peaks: one at Vsys 7.0 km s-1 and another at 12.0-14.0 km s-1. From channel maps in Figure A1, it is obvious that there is no counterpart in the CO outflow at velocity 9.8 km s-1 and above. The SiO spectra also confirmed that the second peak at 12.0-14.0 km s-1 is not associated with G208Walma. In the spectra of CO and SiO, there is no clear differentiation between the high-velocity and low-velocity component. Therefore, it is difficult to distinguish between the low-velocity CO outflow (wind component) and the high-velocity jet component based on the velocity distribution only.
A.2 Jet mass-loss rate
The jet mass-loss rate Ṁ${}_{j}$ was derived from the CO emission flux for a specific excitation temperature of Tex within the jet. Under the assumption of optical thin CO emission, the beam-average CO column densities (NCO) were measured, which is then converted into beam-averaged H2 column density N for CO abundance ratio, XCO = NCO/N. We assume that the molecular jet is flowing through a uniform cylinder at a constant density and speed of gas along the transverse beam direction. Since the jet is not resolved at the present spatial resolution, the beam size () is taken to be the jet width. Thus, Ṁj can be expressed as:
| (A1) |
where = 2.8 is the mean molecular weight and is the mass of a hydrogen atom. Vj is the mean deprojected jet velocity.
A.3 Outflow force
We derive the outflow force (FCO) from CO the emission. First, the outflow emission above 3 in the k-th channel is converted to outflow mass (Mk) for each velocity channel following the equation (Yıldız et al., 2015):
| (A2) |
where the sum is over all outflow pixels on the k-th channel. NCO is the beam-average CO column density. A is the surface area of each pixel and CO abundance ratio of XCO 10-4 in the jet. In the next step, for the outflow extension of RCO and maximum outflow velocity (VCO,max), FCO can be expressed as (Yıldız et al., 2015):
| (A3) |
where the momentum () on k-th channel is MkVk for a mass Mk with the central velocity, Vk (= Vobs Vsys ). The factor deals with the inclination correction.
Appendix B Spectral Energy Distribution
We searched published catalogues for a compact continuum counterpart to G208Walma within a search radius of 3 from the 1.3 continuum peak (see Dutta et al., 2015, for more details on catalog matching method). The Wide-field Infrared Survey Explorer (WISE; Wright et al., 2010) and Herschel Space Observatory (https://sci.esa.int/web/herschel) data were obtained from IRSA IPAC catalog (https://irsa.ipac.caltech.edu/). It matches with WISE catalogue source J053228.14-053420.6. James Clerk Maxwell Telescope (JCMT) data were obtained from Mairs et al. (2016) (island #25). The multiwavelength fluxes are listed in Table B1. Based on the poor signal-to-noise ratio, the fluxes at WISE 12 m, 24 m and JCMT 450m, 850 m are considered as an upper limit measurement.
Tbol and Lbol were derived using trapezoid-rule of integration over all the observed fluxes. Following Myers & Ladd (1993), the flux weighted mean frequencies in the observed SED were used to estimate Tbol. We obtained Tbol 31 K and Lbol 0.8 L☉. Based on the uncertainty in the observed fluxes, we assume these values are at the upper limit.
| Wavelength | Flux | Error | Reference |
|---|---|---|---|
| (m) | (mJy) | (mJy)) | Telescope |
| 3.4 | 0.3435 | 0.0261 | WISE |
| 4.6 | 0.3626 | 0.0256 | WISE |
| 12.0 | 3.7558 | 1.2804 | WISE |
| 22.0 | 4.45537 | WISE | |
| 70.0 | 609.079 | 13.356 | Herschel |
| 100.0 | 2139.573 | 58.847 | Herschel |
| 160.0 | 5359.623 | 17.7 | Herschel |
| 450.0 | 4540.0 | JCMT | |
| 850.0 | 1820.0 | JCMT | |
| 1300.0 | 69.0 | 3.5 | ALMA; This study |
| Sources | Catalog reference |
|---|---|
| B1-bN | Hirano & Liu (2014) |
| B1-bS | Hirano & Liu (2014) |
| L1451-mm | Maureira et al. (2020) |
| PER Bolo 45 | Maureira et al. (2020) |
| K242 | Young et al. (2018) |
| Aqu-MM1 | Young et al. (2018) |
| SerpS-MM19 | Young et al. (2018) |
| SerpS-MM22 | Young et al. (2018) |
| Aqu-MM2 | Young et al. (2018) |
| PER Bolo 58 | Enoch et al. (2010); Maureira et al. (2020) |
| Average Early Class 0 | Enoch et al. (2009) |
References
- Allen et al. (2003) Allen, A., Li, Z.-Y., & Shu, F. H. 2003, ApJ, 599, 363, doi: 10.1086/379243
- Astropy Collaboration et al. (2013) Astropy Collaboration, Robitaille, T. P., Tollerud, E. J., et al. 2013, A&A, 558, A33, doi: 10.1051/0004-6361/201322068
- Balança et al. (2018) Balança, C., Dayou, F., Faure, A., Wiesenfeld, L., & Feautrier, N. 2018, MNRAS, 479, 2692, doi: 10.1093/mnras/sty1681
- Bally (2016) Bally, J. 2016, ARA&A, 54, 491, doi: 10.1146/annurev-astro-081915-023341
- Bjerkeli et al. (2019) Bjerkeli, P., Ramsey, J. P., Harsono, D., et al. 2019, A&A, 631, A64, doi: 10.1051/0004-6361/201935948
- Bontemps et al. (1996) Bontemps, S., Andre, P., Terebey, S., & Cabrit, S. 1996, A&A, 311, 858
- Chen et al. (2012) Chen, X., Arce, H. G., Dunham, M. M., et al. 2012, ApJ, 751, 89, doi: 10.1088/0004-637X/751/2/89
- Ciardi & Hennebelle (2010) Ciardi, A., & Hennebelle, P. 2010, MNRAS, 409, L39, doi: 10.1111/j.1745-3933.2010.00942.x
- Crapsi et al. (2005) Crapsi, A., Caselli, P., Walmsley, C. M., et al. 2005, ApJ, 619, 379, doi: 10.1086/426472
- Dutta et al. (2015) Dutta, S., Mondal, S., Jose, J., et al. 2015, MNRAS, 454, 3597, doi: 10.1093/mnras/stv2190
- Dutta et al. (2020) Dutta, S., Lee, C.-F., Liu, T., et al. 2020, ApJS, 251, 20, doi: 10.3847/1538-4365/abba26
- Dutta et al. (2021) Dutta, S., Lee, C.-F., Johnstone, D., et al. 2021, arXiv e-prints, arXiv:2110.14035. https://arxiv.org/abs/2110.14035
- Dutta et al. (2022) —. 2022, ApJ, 925, 11, doi: 10.3847/1538-4357/ac3424
- Emprechtinger et al. (2009) Emprechtinger, M., Caselli, P., Volgenau, N. H., Stutzki, J., & Wiedner, M. C. 2009, A&A, 493, 89, doi: 10.1051/0004-6361:200810324
- Enoch et al. (2009) Enoch, M. L., Evans, Neal J., I., Sargent, A. I., & Glenn, J. 2009, ApJ, 692, 973, doi: 10.1088/0004-637X/692/2/973
- Enoch et al. (2010) Enoch, M. L., Lee, J.-E., Harvey, P., Dunham, M. M., & Schnee, S. 2010, ApJ, 722, L33, doi: 10.1088/2041-8205/722/1/L33
- Galli & Shu (1993) Galli, D., & Shu, F. H. 1993, ApJ, 417, 220, doi: 10.1086/173305
- Gerner et al. (2015) Gerner, T., Shirley, Y. L., Beuther, H., et al. 2015, A&A, 579, A80, doi: 10.1051/0004-6361/201423989
- Gibb et al. (2004) Gibb, A. G., Richer, J. S., Chandler, C. J., & Davis, C. J. 2004, ApJ, 603, 198, doi: 10.1086/381309
- Glassgold et al. (1991) Glassgold, A. E., Mamon, G. A., & Huggins, P. J. 1991, ApJ, 373, 254, doi: 10.1086/170045
- Hennebelle & Fromang (2008) Hennebelle, P., & Fromang, S. 2008, A&A, 477, 9, doi: 10.1051/0004-6361:20078309
- Hirano et al. (2010) Hirano, N., Ho, P. P. T., Liu, S.-Y., et al. 2010, ApJ, 717, 58, doi: 10.1088/0004-637X/717/1/58
- Hirano & Liu (2014) Hirano, N., & Liu, F.-c. 2014, ApJ, 789, 50, doi: 10.1088/0004-637X/789/1/50
- Hsieh et al. (2016) Hsieh, T.-H., Lai, S.-P., Belloche, A., & Wyrowski, F. 2016, ApJ, 826, 68, doi: 10.3847/0004-637X/826/1/68
- Hunter (2007) Hunter, J. D. 2007, Computing in Science & Engineering, 9, 90, doi: 10.1109/MCSE.2007.55
- Kounkel et al. (2018) Kounkel, M., Covey, K., Suárez, G., et al. 2018, AJ, 156, 84, doi: 10.3847/1538-3881/aad1f1
- Larson (1969) Larson, R. B. 1969, MNRAS, 145, 271, doi: 10.1093/mnras/145.3.271
- Lee (2020) Lee, C.-F. 2020, A&A Rev., 28, 1, doi: 10.1007/s00159-020-0123-7
- Lee et al. (2010) Lee, C.-F., Hasegawa, T. I., Hirano, N., et al. 2010, ApJ, 713, 731, doi: 10.1088/0004-637X/713/2/731
- Lee et al. (2007) Lee, C.-F., Ho, P. T. P., Hirano, N., et al. 2007, ApJ, 659, 499, doi: 10.1086/512540
- Lee et al. (2018) Lee, C.-F., Li, Z.-Y., Hirano, N., et al. 2018, ApJ, 863, 94, doi: 10.3847/1538-4357/aad2da
- Lee et al. (2000) Lee, C.-F., Mundy, L. G., Reipurth, B., Ostriker, E. C., & Stone, J. M. 2000, ApJ, 542, 925, doi: 10.1086/317056
- Li & Shu (1996) Li, Z.-Y., & Shu, F. H. 1996, ApJ, 472, 211, doi: 10.1086/178056
- Lizano & Shu (1987) Lizano, S., & Shu, F. H. 1987, in NATO Advanced Study Institute (ASI) Series C, Vol. 210, Physical Processes in Interstellar Clouds, ed. G. E. Morfill & M. Scholer, 173–193
- Machida (2014) Machida, M. N. 2014, ApJ, 796, L17, doi: 10.1088/2041-8205/796/1/L17
- Machida & Basu (2019) Machida, M. N., & Basu, S. 2019, ApJ, 876, 149, doi: 10.3847/1538-4357/ab18a7
- Mairs et al. (2016) Mairs, S., Johnstone, D., Kirk, H., et al. 2016, MNRAS, 461, 4022, doi: 10.1093/mnras/stw1550
- Maureira et al. (2020) Maureira, M. J., Arce, H. G., Dunham, M. M., et al. 2020, MNRAS, 499, 4394, doi: 10.1093/mnras/staa2894
- McMullin et al. (2007) McMullin, J. P., Waters, B., Schiebel, D., Young, W., & Golap, K. 2007, Astronomical Society of the Pacific Conference Series, Vol. 376, CASA Architecture and Applications, ed. R. A. Shaw, F. Hill, & D. J. Bell, 127
- Mellon & Li (2008) Mellon, R. R., & Li, Z.-Y. 2008, ApJ, 681, 1356, doi: 10.1086/587542
- Millan-Gabet et al. (2007) Millan-Gabet, R., Malbet, F., Akeson, R., et al. 2007, in Protostars and Planets V, ed. B. Reipurth, D. Jewitt, & K. Keil, 539. https://arxiv.org/abs/astro-ph/0603554
- Müller et al. (2001) Müller, H. S. P., Thorwirth, S., Roth, D. A., & Winnewisser, G. 2001, A&A, 370, L49, doi: 10.1051/0004-6361:20010367
- Myers & Ladd (1993) Myers, P. C., & Ladd, E. F. 1993, ApJ, 413, L47, doi: 10.1086/186956
- Nakano (1979) Nakano, T. 1979, PASJ, 31, 697
- Öberg et al. (2017) Öberg, K. I., Guzmán, V. V., Merchantz, C. J., et al. 2017, ApJ, 839, 43, doi: 10.3847/1538-4357/aa689a
- Ossenkopf & Henning (1994) Ossenkopf, V., & Henning, T. 1994, A&A, 291, 943
- Palau et al. (2014) Palau, A., Zapata, L. A., Rodríguez, L. F., et al. 2014, MNRAS, 444, 833, doi: 10.1093/mnras/stu1461
- Podio et al. (2021) Podio, L., Tabone, B., Codella, C., et al. 2021, A&A, 648, A45, doi: 10.1051/0004-6361/202038429
- Robitaille & Bressert (2012) Robitaille, T., & Bressert, E. 2012, APLpy: Astronomical Plotting Library in Python. http://ascl.net/1208.017
- Sakai et al. (2021) Sakai, T., Sanhueza, P., Furuya, K., et al. 2021, arXiv e-prints, arXiv:2111.13325. https://arxiv.org/abs/2111.13325
- Schilke et al. (1997) Schilke, P., Walmsley, C. M., Pineau des Forets, G., & Flower, D. R. 1997, A&A, 321, 293
- Schnee et al. (2012) Schnee, S., Di Francesco, J., Enoch, M., et al. 2012, ApJ, 745, 18, doi: 10.1088/0004-637X/745/1/18
- Shu (1977) Shu, F. H. 1977, ApJ, 214, 488, doi: 10.1086/155274
- Shu et al. (1987) Shu, F. H., Adams, F. C., & Lizano, S. 1987, ARA&A, 25, 23, doi: 10.1146/annurev.aa.25.090187.000323
- Tabone et al. (2020) Tabone, B., Godard, B., Pineau des Forêts, G., Cabrit, S., & van Dishoeck, E. F. 2020, A&A, 636, A60, doi: 10.1051/0004-6361/201937383
- Tatematsu et al. (2021) Tatematsu, K., Kim, G., Liu, T., et al. 2021, ApJS, 256, 25, doi: 10.3847/1538-4365/ac0978
- Tomisaka (2002) Tomisaka, K. 2002, ApJ, 575, 306, doi: 10.1086/341133
- Wright et al. (2010) Wright, E. L., Eisenhardt, P. R. M., Mainzer, A. K., et al. 2010, AJ, 140, 1868, doi: 10.1088/0004-6256/140/6/1868
- Yıldız et al. (2015) Yıldız, U. A., Kristensen, L. E., van Dishoeck, E. F., et al. 2015, A&A, 576, A109, doi: 10.1051/0004-6361/201424538
- Young et al. (2018) Young, A. K., Bate, M. R., Mowat, C. F., Hatchell, J., & Harries, T. J. 2018, MNRAS, 474, 800, doi: 10.1093/mnras/stx2669