Copiloting Autonomous Multi-Robot Missions:
A Game-inspired Supervisory Control Interface
Abstract
Real-world deployment of new technology and capabilities can be daunting. The recent DARPA Subterranean (SubT) Challenge, for instance, aimed at the advancement of robotic platforms and autonomy capabilities in three one-year development pushes. While multi-agent systems are traditionally deployed in controlled and structured environments that allow for controlled testing (e.g., warehouses), the SubT challenge targeted various types of unknown underground environments that imposed the risk of robot loss in the case of failure. In this work, we introduce a video game-inspired interface, an autonomous mission assistant and test and deploy these using a heterogeneous multi-agent system in challenging environments. This work leads to improved human-supervisory control for a multi-agent system reducing overhead from application switching, task planning, execution, and verification while increasing available exploration time with this human-autonomy teaming platform.
I Introduction
Autonomous Exploration and SubT: Robotic exploration and the advancement of autonomy offer new ways to explore potentially dangerous and hard-to-access underground environments. Multi-agent systems have matured in controlled and structured environments like warehouses, factories, and laboratories, while current robotic challenges seek to advance these technologies for search and rescue scenarios, planetary prospecting, and subsurface exploration [1, 2, 3]. Motivated by the search for life on other planets, NASA JPL’s team CoSTAR [4] took part in the Defense Advanced Research Projects Agency’s (DARPA) Subterranean Challenge (SubT) seeking to advance robotic multi-agent systems and their technology readiness for potential future missions. If brought to other planets (e.g. Mars), subsurface missions could bring new insights into their geologic past as well as on their potential for supporting life in the environmentally protected undergrounds [5]. In contrast to traditional exploration missions where a team of operators and scientists controls one rover, SubT introduced the challenging requirement that only a single human supervisor can directly interface with the deployed multi-agent team in real-time and when a communication link is established. SubT is divided into three, one year development pushes with major field testing demonstrations. This work focuses on the advancements in our supervisor autonomy and game-inspired user interface that were developed under the restrictions of a worldwide pandemic and deployed during the SubT final competition comprising two preliminary missions (P1 and P2) and the final prize run (F).
Human-Robot Collaboration: Achieving man-computer symbiosis [6] has been a long-time goal of the community to promote a close coupling of human and machine capabilities and ultimately inspire the evolving field of human-robot interaction [7]. This work improves collaborative human multi-robot exploration and search performance fusing our extended autonomy assistant Copilot [8] that uses automated planning techniques with a game-inspired interface design for effective robot deployment, operations, and single operator supervision to create a more symbiotic interaction.
We present key design choices that are breaking away from common robot interfacing strategies that were deployed in similar challenge contexts [9, 10] and used interfaces based on the Robot Operating System’s (ROS) visualization tool RViz. Further, we leverage human-robot interdependencies to inform the design and development of supervised autonomy and interaction paradigms to achieve our set interaction objectives. The latest results from the SubT competition “Finals” are compared to a baseline from previous competition runs, namely the “Urban Circuit”, which deployed earlier interface and system implementations and interaction paradigms that we improve with our combined game-inspired interface and enhanced supervisory autonomy.
In Section II, we look at related work from human-robot interaction and user interface design. Section III outlines the SubT requirements and interaction objectives for our multi-agent exploration scenario. We then describe our supervisory autonomy Copilot and its latest implementation in Section IV, while Section V outlines the user interface components and human-robot interaction capabilities. Finally, we present results from our development pushes in Section VI and close with conclusions and an outlook on future work in Section VII.
II Related Work
Human-Robot Interaction and Interface Design: More than sixty years after the introduction of man-computer symbiosis by Licklider [6], Chen and Barnes [7] conclude that the boundaries of long-term human-robot symbiosis are still to be pushed by interdisciplinary collaborations. Szafir and Szafir [11] have identified best practices in the field of data visualization as a key driver to advance both HRI and data visualization. Complex visualizations and renderings have become achievable with off-the-shelf hardware, which allows the integration of visualization principles such as sensemaking [11] that helps a human digest information. In human-space systems Rahmani et al. [12] identified that interface technologies are currently in development, but their technology readiness levels are not very mature. Multiple design methods have been introduced in the literature, for instance, Coactive Design [13] which is a structured approach to analyze human and robot requirements and was used in the context of the 2015 DARPA Virtual Robotics Challenge that aimed at advancing disaster response capabilities. Roundtree et al. [14] found that abstract interface designs that visualize collective status over single agent information could increase performance; however such designs depend on the task at hand, team size and mission goals [7]. A common testing strategy in computer game development is Playtesting [15], which is comparable to simulation and field testing in the multi-robot domain. The game-inspired development technique RITE, which was introduced in the context of interface development for the computer game Age of Empires [16], was used and adapted for fast development sprints. Additionally, we drew inspiration from real-time strategy games like Age of Empires, which guided the design of the 3D portion of the interface.
Robot Challenge Interfaces: During 2013’s DARPA Robotics Challenge, team ViGIR leveraged ROS to control a humanoid robot. The team decided to implement their interfaces using RViz and built an Operation Control Center consisting of at least six screens. Robot challenges are found to typically influence human-robot interaction design and interfaces [11] and for DARPA’s SubT teams, the common design practice was based on RViz and ROS plugins ([17, 18, 19, 20, 10]). Even our team started off using RViz as a quick way to prototype interfaces [21] and used it as the main way to interact with the robot agents due to its tight integration with ROS and ability to access robot data for debugging purposes. We shifted away from this approach for the final competition, and the resulting HRI modalities and supervisory interface are presented in this work.
III Background and Objectives
Challenge Requirements: The overall SubT goals are two common problems faced by real-world multi-agent systems: first, the autonomous exploration of unknown environments, and second, the search for objects of interest hidden within. While exploration and search provide a need for specific capabilities, DARPA further introduced a set of guidelines and rules to motivate higher levels of autonomy for the deployed systems: (i) only a single human operator is allowed to interact, supervise, and interface with the robots; (ii) each mission is bound by a fixed setup time limit of 30 minutes and an exploration time limit between 30 and 60 minutes; (iii) a pit crew of four (Finals) or nine (Urban Circuit) can support the supervisor by setting up hardware in a designated area without access to wireless data streams, robot control, or interface; (iv) there is a limited number of attempts to submit discovered objects of interest; (v) the final challenge environment comprises tunnel, urban, and cave terrains to be explored.
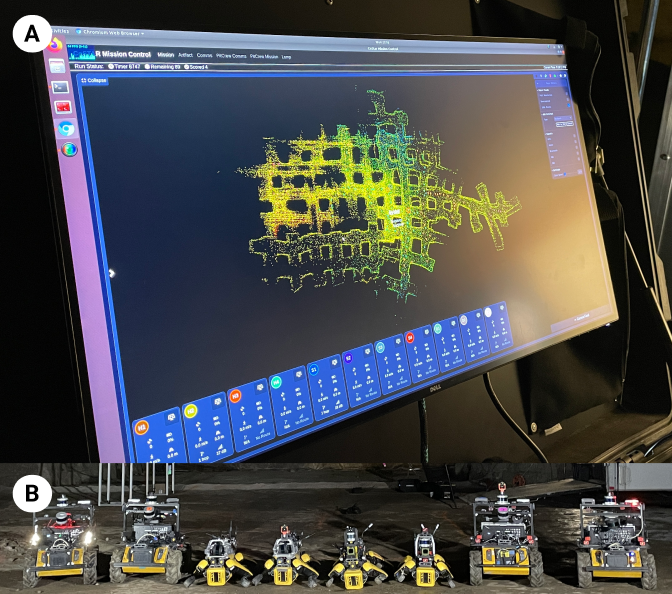
Objectives: Deploying and operating large teams of robots like Team CoSTAR’s robot fleet, shown in Figure 1B, are complex real-world problems. Addressing this set of problems creates the need for a resource-efficient and robust human and multi-agent system to i) not overwhelm the single human supervisor, ii) meet the timing requirements, and iii) increase the performance of both exploration and search tasks.
To tackle this challenge and develop a system that can deploy reliably even beyond the SubT challenge, we embed the following interaction objectives into our system design: (1) Reducing overhead and human workload (e.g., from application switching and manual task execution) (2) Creating and maintaining situational awareness (3) Managing large teams of robots (from setup, deployment to exploration) while allowing for a flexible configuration (4) Accessing critical information in a single unified interface (5) Maintaining an enjoyable performance that can visualize the complete robot team (6) Collaborating with autonomy and trusting automation.
IV Supervised Autonomy
IV-A Copilot
Motivation: After SubT’s “Urban Circuit”, the allowed personnel in the competition staging area was reduced from ten to five team members which includes the main supervisor. This required a shift in how robots were strategically and physically handled (minimum 2 people are needed to lift and stage a single robot). Task coordination was done by a pit crew member directing the operator and influencing their actions while following static paper checklist procedures. Developing and deploying a computerized assistant that could take over this role was soon desired.
Original Implementation: A first version of Copilot, “an autonomous assistant for human-in-the-loop multi-robot operations” was introduced in [8]. This early Copilot was only tested in realistic cave simulations or during preparatory missions with one deployed robot. Copilot supports a single human supervisor in monitoring robot teams, aids with strategic task planning, scheduling, and execution, and communicates high-level commands between agents and a human supervisor if a communication link exists. The autonomy assistant aims at keeping workload acceptable while maintaining high situational awareness that allows rapid responses in case system failures are observed.
Task Interaction: Copilot takes over the decision-making processes regarding planning and scheduling, which reduces the need to memorize tasks and task sequences or the need to delegate a team member to take over such checklist-like tasks. Some tasks were implemented with higher autonomy levels and automatically executed limited actions, but most required the human to start the task, manually execute parts of it, and confirm that the task had been completed successfully or unsuccessfully while monitoring the system. On one hand, it reduced the need to remember tasks; on the other hand, more interactions with the newly introduced system were needed.
Scalability Limitations: Due to computational limitations, a full mission simulation could not be achieved with more than three robots at reduced real-time and not more than two in real-time. However, upon tightly integrating Copilot with multiple real robot platforms, we noticed that the current concept of operations didn’t scale well when adding more robots to a mission. We learned that task execution on the real hardware requires different timing and introduces many sources for machine and human errors (e.g., if cables are loose, sensors don’t power up, or unknown unknowns occur).
Visualization Limitations: In robotics interfaces, scheduling, and timeline views are often presented in a robot- or task-centric way, focusing on who or which agent is scheduled for a certain task and when, respectively [22]. The main task-centric approach that was used in early Copilot tests showed a vertical list view with a scrollable timeline. This timeline showed the four tasks closest in time on top. As the number of tasks scaled linearly with the number of deployed robots this list view became inefficient — especially when tasks had to be deferred and worked on in a non-sequential order.
IV-B Improved Copilot
The identified shortcomings motivated a redesigning and rethinking of Copilot’s back-end and front-end to reduce and not just shift workload; thus, we implemented higher levels of automation.
Architecture Changes: Figure 2 provides a simplified overview of Copilot’s updated task management architecture. A multi-robot task auto-generator and verifiable task executor have been added to the system, and the underlying planner has been replaced. All modules access a centralized task database which stores pending, active, successful, or failed mission tasks for setup, deployment, and during exploration.
Task Dependency Graph: A robot mission can be fairly complex, even when looking at the deployment of a single robot. In Figure 3 such a single robot mission is shown as a directed graph indicating the temporal constraints and execution dependencies with arcs between the nodes that represent a pre-defined set of mission tasks. Each task is defined by its duration, earliest start time, latest end time, and its dependency relations with other tasks.
To deploy multiple robots without the need to hard-coding all possible agent combinations and graphs, we use a scalable auto generator. The preceding superscript O in the graph (see Figure 3) indicates that human inputs or actions are required for the task. In the case of the Launch base software task, this means that the operator has to initiate the software launch as a pre-condition and is prompted to select the robots that they would like to deploy for the upcoming mission. Similarly, superscripts at the end of a task indicate that human action is needed before the next task can begin. Tasks without either have been fully automated for nominal cases in this newer Copilot version.
Task Planning and Scheduling: The aforementioned task dependency graph for the selected robots forms the input for Copilot’s task planner and is stored in the MongoDB task database. The generation of a task plan for setting up, deploying, and assisting the operator during exploration is framed as an automated temporal planning problem. In the first version of Copilot, we formulated such problem as a Simple Temporal Network (STN), encoded as a linear program. In the improved version of Copilot, deployed in the final events of SubT, we moved to a PDDL temporal planning formulation to allow 1) flexibility on task representation with respect to state constraints, resources, and planning, and 2) use the body of planners available in the literature. Herein we integrated the OPTIC planner [23], a PDDL temporal planner that handles time window specification (timed initial literals), and discrete and continuous resources.
To perform planning, OPTIC uses both a PDDL domain file and a problem file. The domain file has been designed to represent tasks (modelled as operators) and its dependencies (preconditions). The problem file is generated prior to calling the planner, and it is built based on the current state of mission and tasks execution. For example, if a task is ongoing, the PPDL file would represent the task as ongoing and add constraints to ensure it continues the execution to meet the necessary constraints. As a notional example of the scale of the planning problem, a mission with four robots would have approximately 60 tasks to be scheduled during setup and deployment. Planning is performed at a predefined cadence (e.g., every 1.5 seconds), but it also follows an event-based approach when task execution is late, or the human-in-the-loop changes their strategy — this helps mitigate execution uncertainty. The generated plan is parsed and stored in a Task Database (for logging and visualization across the system); each task is then dispatched for execution.
If a plan is not found by OPTIC due to temporal constraint violations (e.g., delays in task execution), Copilot will attempt to increasingly relax some of the key temporal constraints, such as the latest end time of certain activities (e.g., allowing setup tasks to end a few minutes after the setup time, overlapping with the beginning of the exploration time window). In critical scenarios, Copilot would notify the operator of a schedule relaxation to allow for further strategy changes.
Task Verification and Execution: A verifiable and generic task framework is introduced to Copilot, allowing for quick implementations and standardized task automation. Each task follows a strict precondition, execution, and post-condition template. Condition checks and execution can be triggered across agents, including the base station at which the human can oversee all automated processes at a high level in the new Copilot interface, which is described in Section V. The task template execution covers both fully automated tasks and semi-automated tasks where an operators confirmation is required (e.g. deploying a robot into a cave requires a Go/No-go decision from the supervisor — deploying itself is an automated process). If a task fails during execution or post-condition checking, Copilot will try to resolve the issue by retrying tasks several times and allowing for more execution time. Failed tasks will be reported to the supervisor, who can choose to debug the issue at hand or trigger another automated retry. Retries and resets are possible at all levels, and completed tasks can be reset during an active mission in case a robot platform has to be rebooted.
V Game-Inspired Interface
Game Inspiration: Inspiration for multi-agent interaction and interface design is partially drawn from real-time strategy games such as Age of Empires, StarCraft, and Command & Conquer. When played competitively, these games require a high sense of micro and macro-management of units and their environment and the ability to efficiently switch between these two ways of managing a team. Micromanagement involves short-term strategy and decision-making, where individual units may require critical attention to win a battle, overcome an obstacle, or navigate to the next point of interest, while macromanagement refers to longer-term strategizing that involves resource gathering, unit production over time, and overall exploration and control of the map [24]. Parallels can be applied to the management of a robot team in the SubT competition. Even autonomous robots can benefit from or require human intervention and commanding, especially if critical attention towards failing subsystems is needed. Supervised multi-agent control draws from the human’s situational awareness regarding the environment and robot states to effectively coordinate multi-agent behaviors, successfully locate artifacts, and score points.
Mission Phases: The user interface is designed to be adaptable to the overall mission and two major phases of an individual robot’s competition run in particular: 1) setup and deployment, and 2) mission execution with its exploration and search components. Across these phases, the visibility and abstraction of information need to be flexible to facilitate focus on the anticipated operator interactions. In deployment, the user interface uses the Copilot-generated tasks and status information to guide the sole operator through the multitude of individual tasks while allowing them to maintain their situational awareness, manage the entire robot team, and coordinate with the pit crew.
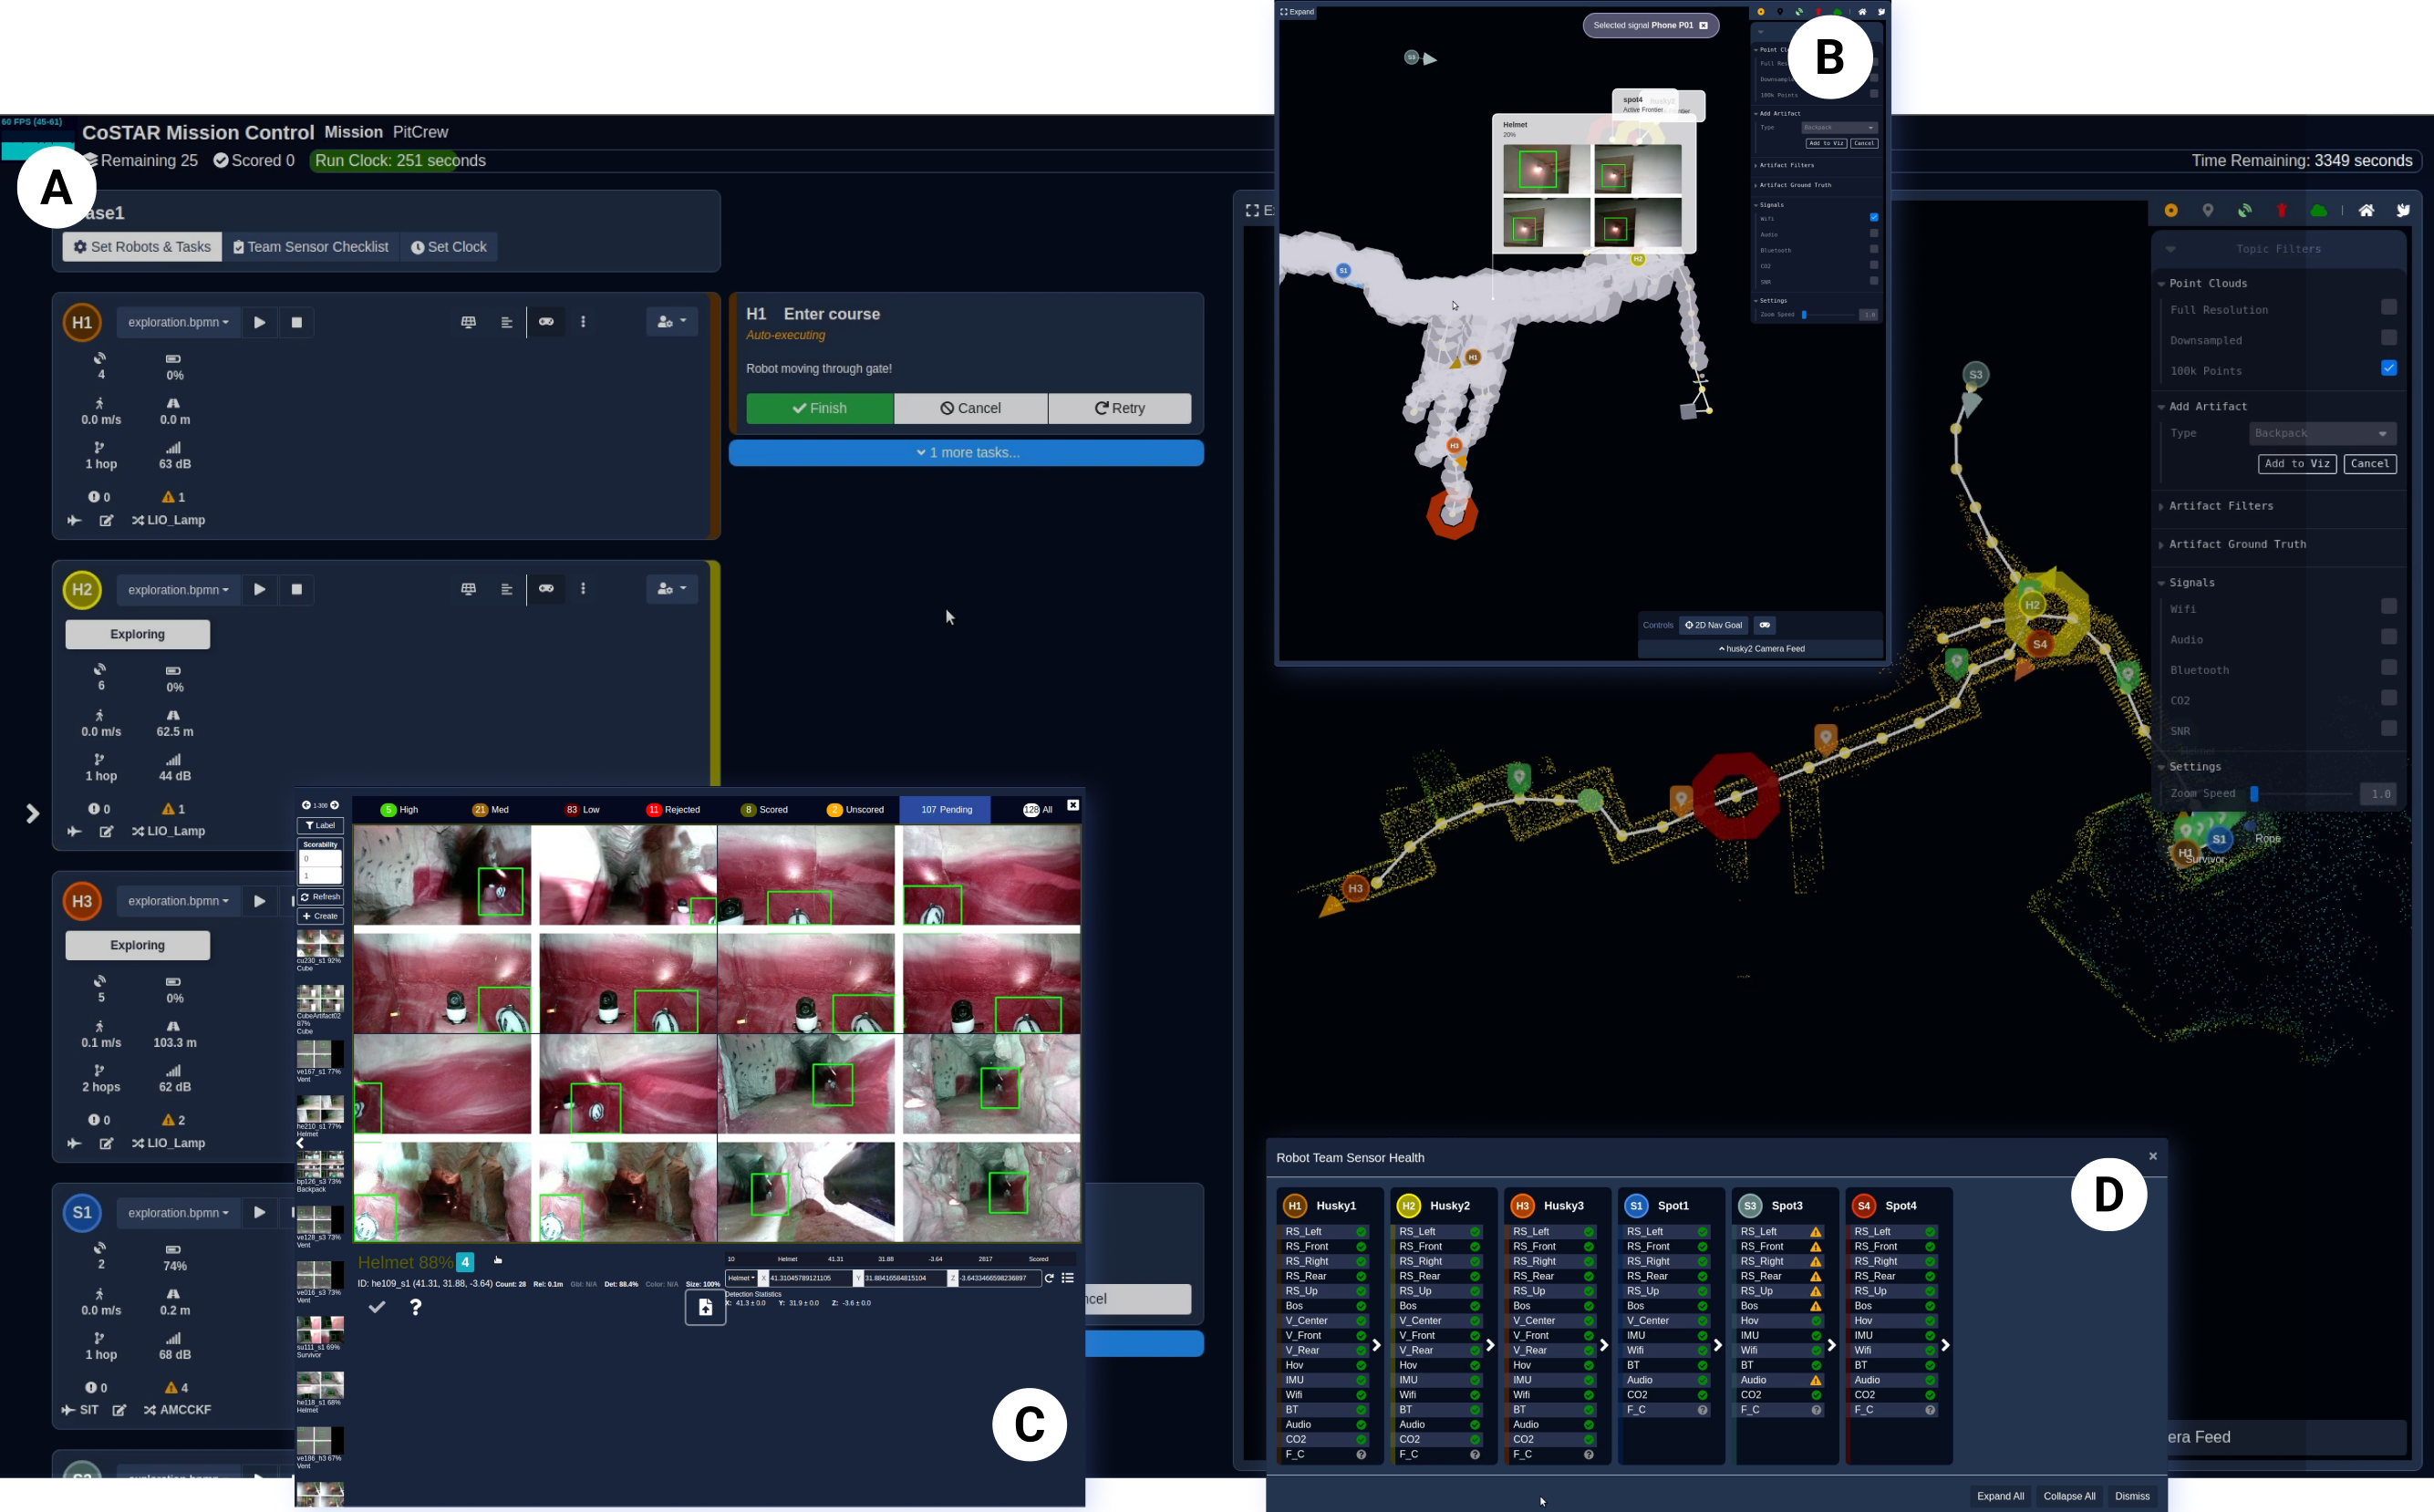
Three Column Layout: The Mission Control interface is organized into different view components. Figure 4 shows the main split-screen with three columns aiming at creating reliable locations for the operator to look at when needing to accomplish functionally distinct tasks (A). The aim here is to reduce the amount of visual scanning, application switching, and to parse robot needs on an individual or team level swiftly. Individual robot information pertinent to monitoring health systems is available on the left, planned and actively re-scheduled Copilot tasks for individual robots are placed alongside each agent in the middle, and a 3D interactive visualization of the robots in their environment is anchored to the right. During mission execution, the primary goal of the user interface is to keep the operator situationally aware of a multitude of individual robot health systems and data sensed from the surrounding environment while presenting the most important information and thus reducing their cognitive workload. In Figure 1 the 3D visualization is expanded, and robot sensor and status information is minimized to select mission-critical information.
Health Systems and Robot Status: In order to effectively survey the status of any individual robot in the team, visibility into over 30 unique sensors and statuses needed to be surfaced to the operator per robot. This required identifying which indicators were critical to display at all times, which could be hidden within a sub-view, which were good candidates to be combined and abstracted, and which would be prioritized across either the deployment (split) or mission execution (split and expanded visualization) modes of the user interface. In addition to sensors visible at an individual level, an additional view was created to organize sensors compactly across the team, providing easy visual scanning for the operator during macro-management and deployment, as shown in Figure 4D. An abstraction of robot behaviors (e.g., exploring, dropping a communications node) and mobility states presents an overall status of each robot to the operator by color and a high-level description. This status is prioritized based on criticality to ensure the operator’s attention will be requested for the most important issue at any given time.
Previously, Copilot tasks resided in an entirely separate module of the interface with limited screen estate, requiring the operator to move other related and necessary sensor and status information out of physical view. A reorganization where Copilot tasks are paired alongside their respective robots is utilized to reduce context loss and pair necessary information to complete the tasks together, as shown in Figure 4A. Over time during the development roll-out, this pairing of health, sensor, and status indicators alongside Copilot tasks facilitated a level of trust from the operator where focus on a particular robot was not necessary unless a critical task requiring operator intervention appeared.
3D Visualization View: A 3D interactive visualization leveraging React Three Fiber (a React-based renderer for three.js) was created within the UI with the aim of achieving a significant reduction in operator task and application switching. Prior to this version of the interface, the operator was required to switch between a web browser to view robot health systems and status information and RViz (a visualizer for ROS) to view the robots within the 3D environment and command them. In the split view of the UI, the operator can have the full context of robot sensors and status information along with any outstanding Copilot tasks. When in the expanded visualization view, the layout shares similarities with layouts of traditional Real-Time Strategy (RTS) games, where content is functionally organized from the corners of the view and leave the center-most screen real estate where the operator will primarily interact with robots and information unobstructedly. From this view, the operator can take on any of the following tasks: surveying the mapped environment and robot positions for locations to scout, locating, and submitting object or signal artifacts, directing or course-correcting robot autonomy with manual navigation commands, viewing signal strength of the communications backbone within the environment, and assigning robots to drop communication nodes manually. The visualization allows the operator to navigate the 3D environment through panning, zooming, and filtering points of interest categories. To effectively manage the switching between micro and macro-level interactions, a single-click shortcut was implemented on each robot status card for the operator to quickly focus on any robot that requires attention. An additional shortcut is provided to zoom back out to an overview of the map.
Improvements over traditional RTS commanding controls were also made to minimize the amount of mouse control and coordination necessary. Instead of requiring to select or drag a bounding box prior to commanding a robot, the operator could simply interact with the visualized information roadmap (IRM) — a breadcrumb trail used for safely navigating the environment constructed by the team of robots [25] — and assign any robot with a high priority navigation point or communications node drop location through a context menu, regardless of whether the particular robots are currently in view or not.
To help with artifact management, the locations of detected artifacts are visualized and interactivity is added to allow the operator to quickly hover into a thumbnail and click to navigate to the dedicated Artifact Drawer Figure 4C for deeper analysis and submission. Additional interactions are, for example, manually adding and manipulating detected artifact locations within the 3D space, by dragging its location across a plane for fine-tuning if a submission location was deemed incorrect and needed adjustment.
While in the expanded visualization view, compressed versions of the robot status modules are shown horizontally in the bottom left of the view with the mission status indicator made more prominent and placed above each module. These overall status indicators were given visual priority to ensure grabbing the operator’s attention. For instance, the indicator would flash red when a robot had fallen over, was low on battery, or required assistance. The operator could immediately click the respective robot module and be oriented over it for micromanagement.
Artifact Drawer: Artifact submission was a critical part of SubT that also has many real-world parallels, for instance, in search and rescue. Especially under time constraints, it is necessary to quickly identify artifacts of interest in the environment, whether these be human survivors or other objects of interest. Detecting and localizing artifacts automatically is done using a state-of-the-art image processing pipeline [26], but no AI system is infallible, especially in unknown environments, so having a system for an operator to manually review artifacts efficiently was critical considering mission time and submission attempts.
In the old system [26], a manual artifact review system did exist, but it was built with a focus on only basic functionality and a high reliance on initially accurate artifact detections. Each artifact report took roughly 90 seconds to review. In redesigning this component, we wanted to focus on improving the review process from an ease of use perspective and decrease the time spent to confidently review an artifact report down to 15 seconds. Beyond simply making the system more intuitive for the operator, this actually had a major functional benefit from a trustability standpoint in that it allowed us to decrease the confidence threshold for flagging artifact detections and have the operator go through and verify nearly 6 times more potential artifact reports while not increasing total time spent.
To better design the new system for speed, it was important to understand which areas of the old one were slowing the process down the most. Testing the old system in simulation and operator feedback revealed that the artifact review process needed too many clicks. Then, time had to be spent zooming in on and reviewing images and checking with RViz separately to verify that artifact coordinates were correct. No visual aid was given if corrections were necessary, and coordinates had to be updated by manually entering them for each axis in . Borrowing from game interface design, integrating the 3D visualization view directly into the web UI removed the need for application switching, and drag controls were added to adjust locations providing correctly scaled coordinate updates from the 3D environment. A minified list that provides an overview of all artifact reports by confidence levels, plus maximizing the screen real estate of a single selected artifact helped increase efficiency. Finally, adding keyboard shortcuts as commonly used in gaming made meeting our target goal of 15 seconds possible.
VI Results
Over the course of the last challenge year, we conducted a limited series of field tests in three testing locations, including the abandoned tunnels at the Los Angeles Subway Terminal building, the Lava Bed National Monument in Northern California, and the Kentucky Underground lime-stone cave for which we applied our rapid development and testing strategy. We experimented with different robot configurations and in different stages of readiness as our system’s capabilities matured. We deployed up to 11 vehicles simultaneously during these tests stressing the overall system (including Copilot and all the UI elements) and learning about its technical limitations like bandwidth and computing resources which will be presented in upcoming work.
We deployed the presented game-inspired user interface and supervised autonomy system during the SubT challenge using four to six ground robots nominally. While we could have exceeded the number of six robots using the newly designed interface and autonomy, six became the preferred number of agents to explore large-scale environments while allowing reliable communication links that would not exceed bandwidth limitations when robots disseminated information from autonomously explored out-of-comms areas. This allowed meeting the set interaction objectives, especially maintaining an enjoyable performance that can visualize the complete robot team while contributing to a lower workload due to fewer deployed agents.
In what follows, we analyzed screen recordings and log files (approved by Caltech IRB protocol number 19-0461 and Polytechnique Montreal project CER-2122-50-D) collected during the SubT final competition. We extracted time-to-task information, robot deployment times, mouse locations, and application usage from runs P1, P2, and F that consist of a setup-time and mission phase of 30+30 and 30+60 minutes, respectively. Robots were only allowed to leave the setup area and enter the course when the mission time began. Readying the team of robots and not bleeding into the mission time was a crucial effort to maximize available mission and exploration time. The results are compared to an earlier state of the system that did not implement Copilot and used different interfaces, namely the SubT “Urban Circuit” similar to [21]. During the “Urban Circuit” task, coordination was done by humans only.
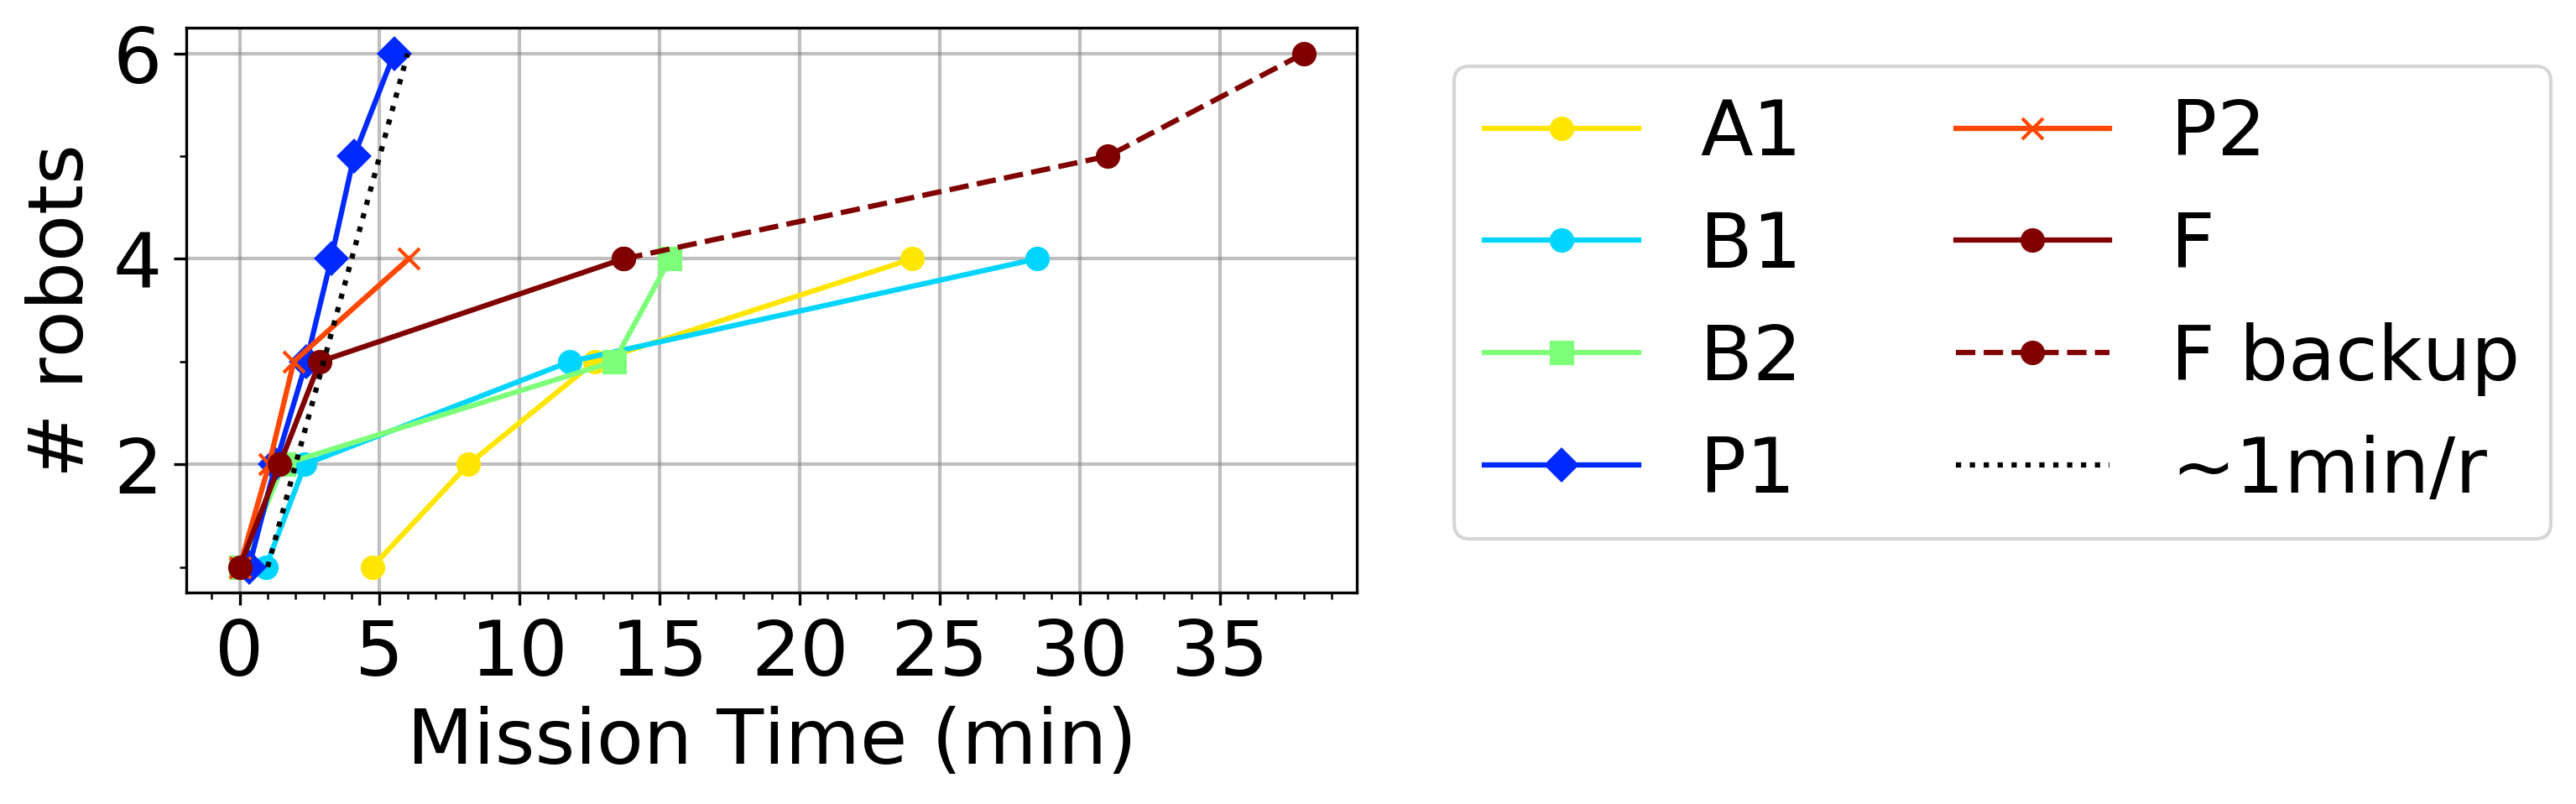
Robot Deployment: Figure 5 shows the robot deployment times that were achieved by deploying Copilot and compares them to the baseline. We can see that during run P1, we achieved sending one robot in less than 60 seconds each, deploying a total of 6 ground vehicles in 5 minutes and 31 seconds. In runs P2 and F, we achieved staying below the one minute mark for the first three robots. Deploying the robots without Copilot and the new interface in the ‘Urban Circuit” runs A1, B1, and B2 took more than 5.5 min per robot on average, thus significantly reducing the time available for exploration and consequently reducing ground coverage and information gain regarding the search task.
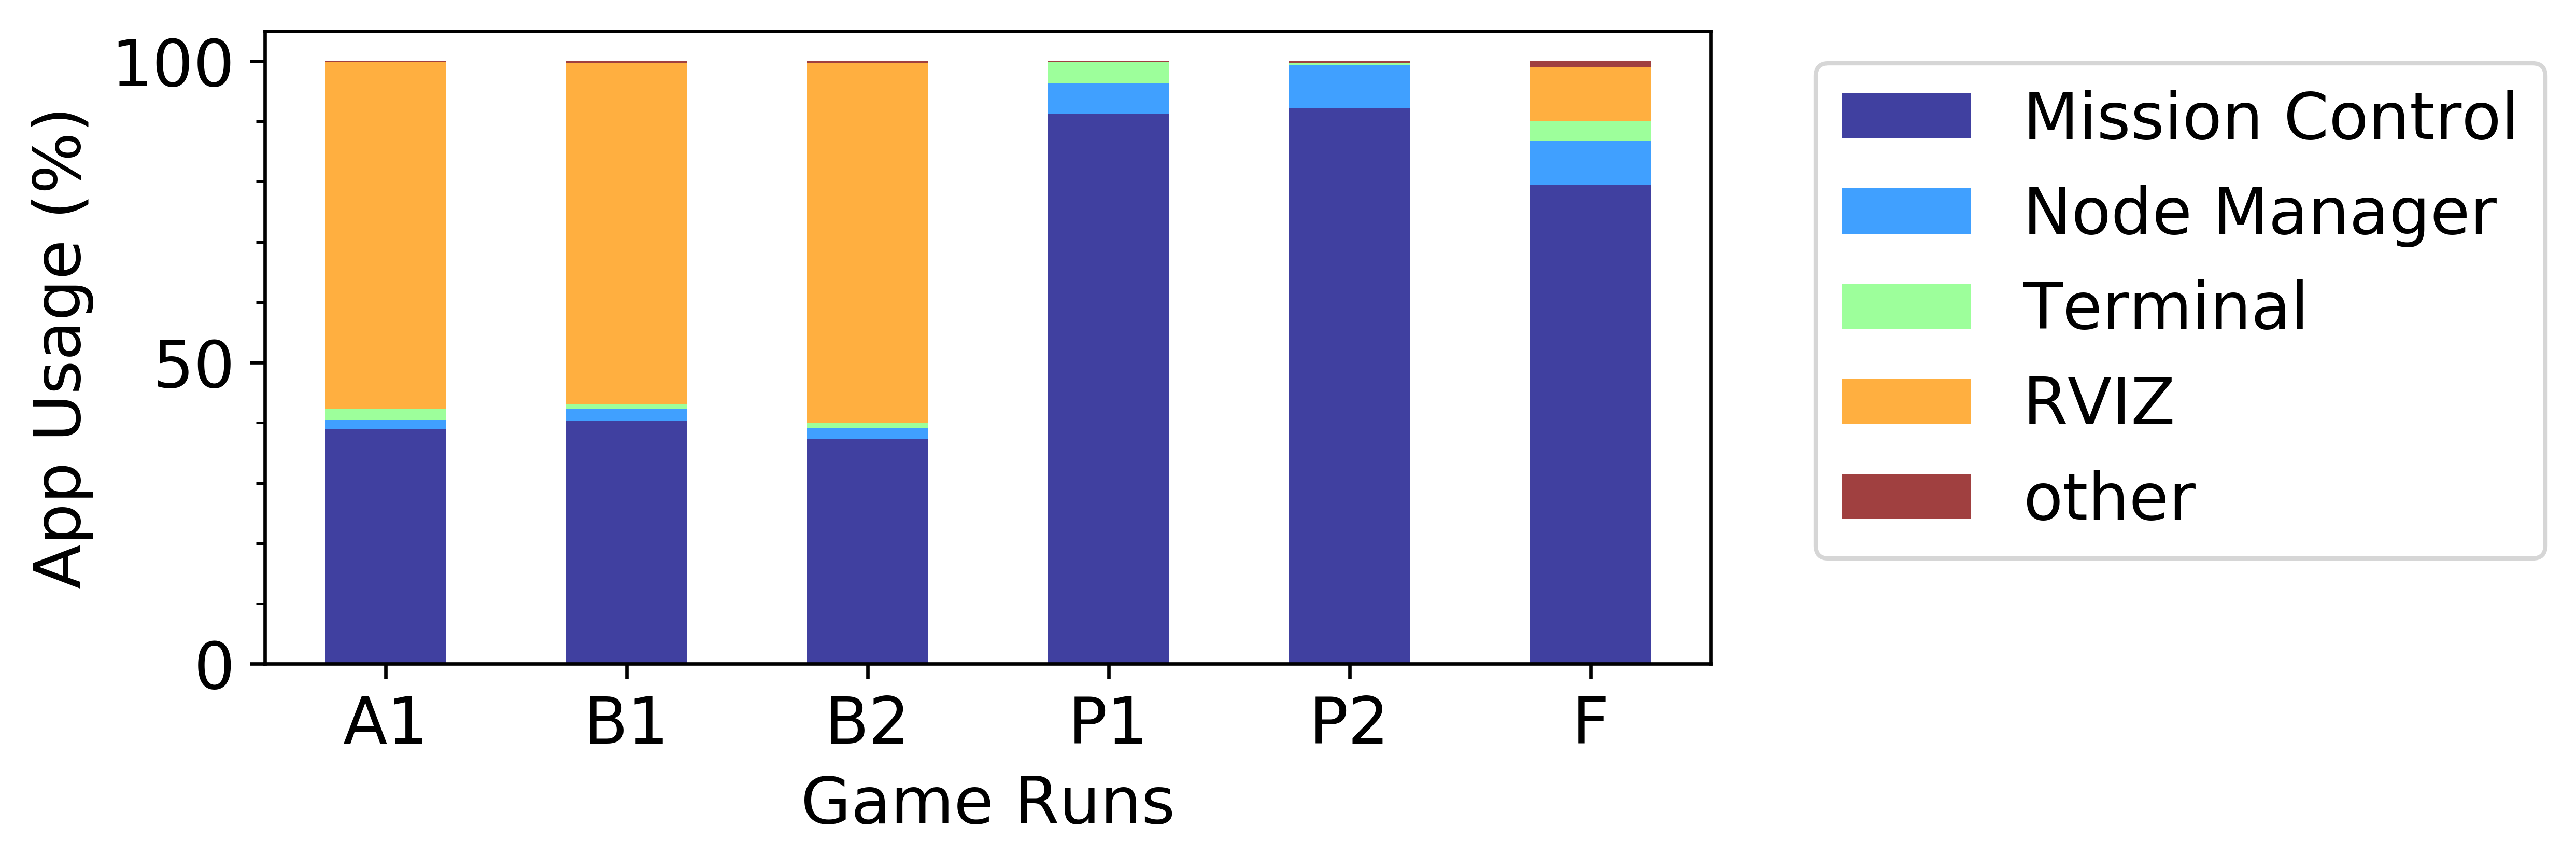
Application Usage: The new interface resulted in a shift in application usage and reduced switching between different applications and computers with a second set of peripherals, as RViz was running on a second device during the “Urban Circuit”. Figure 6 presents the relative usage of applications for six SubT runs. Designing a unified interface resulted in a shift in application usage that reduced the use of RViz significantly. While more than 50% of time was spent on RViz during the “Urban Circuit” runs, we were able to unify user interactions and situation awareness in a single Mission Control interface. Only run F uses RViz for some time as a debugging tool that gave access to the robot’s cost maps depicting the perceived risks around them. This information was not visualized by the new interface, but presents valuable key information in case of unexpected and off-nominal operations.
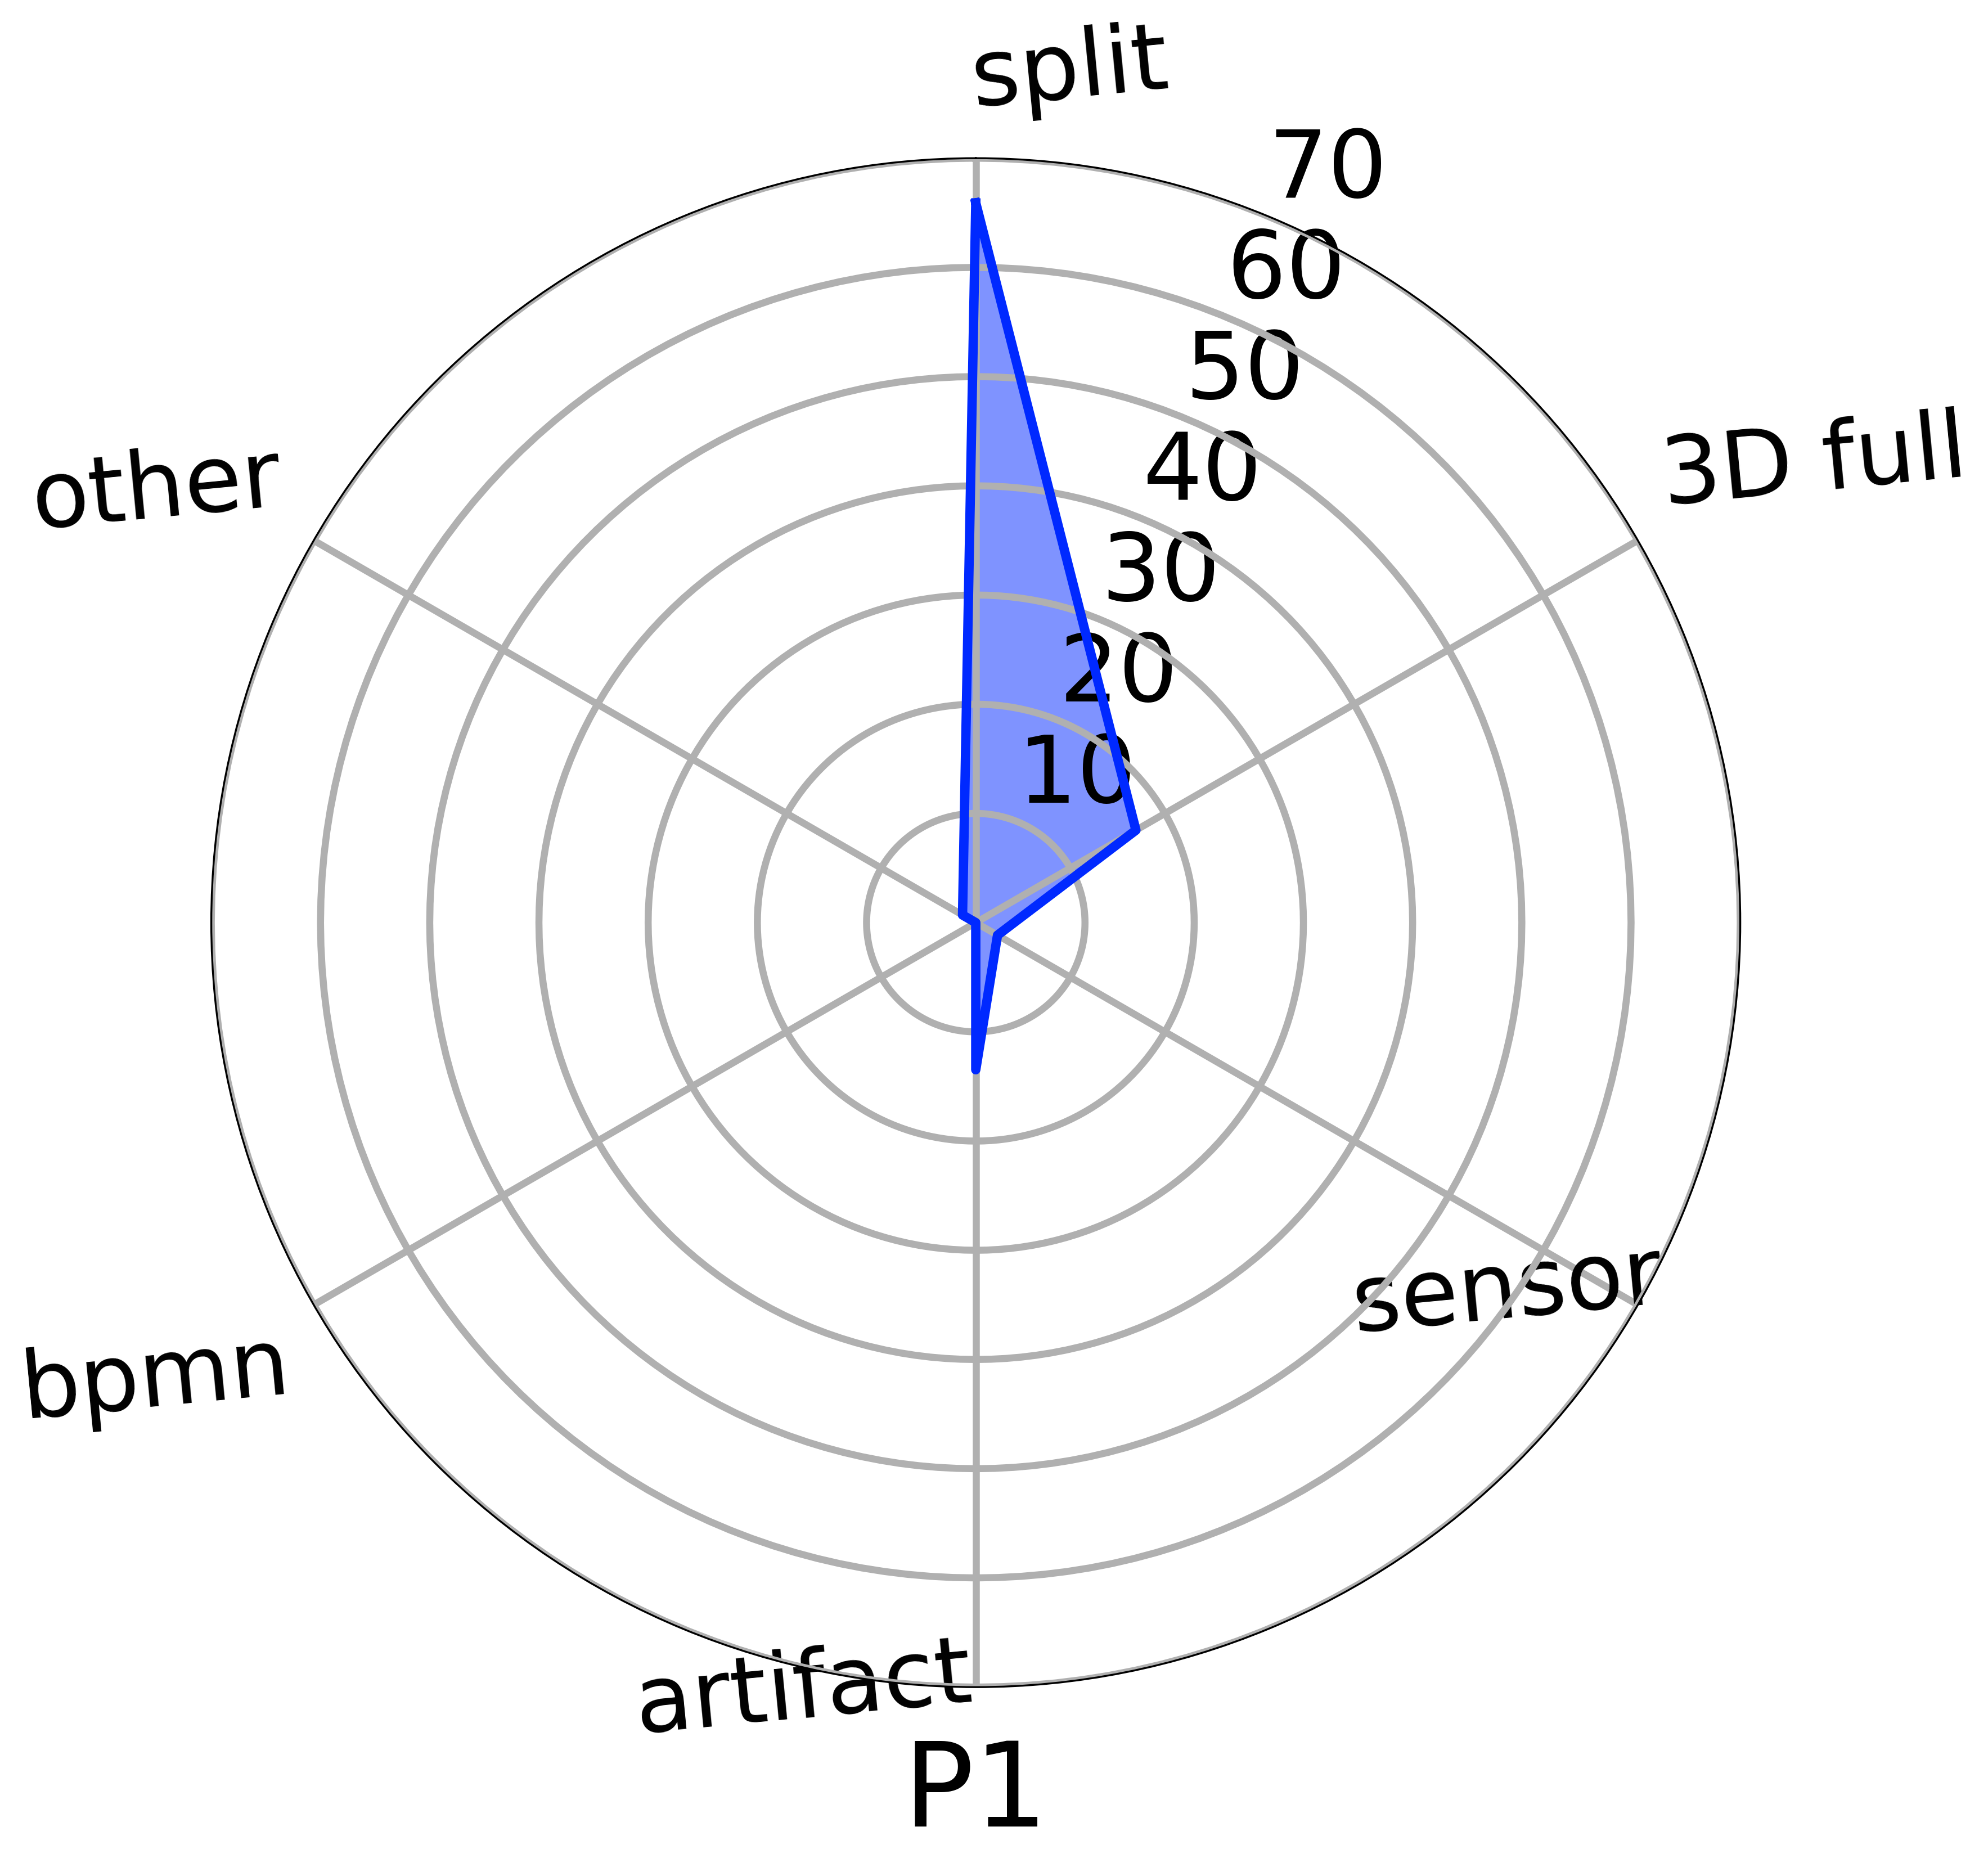
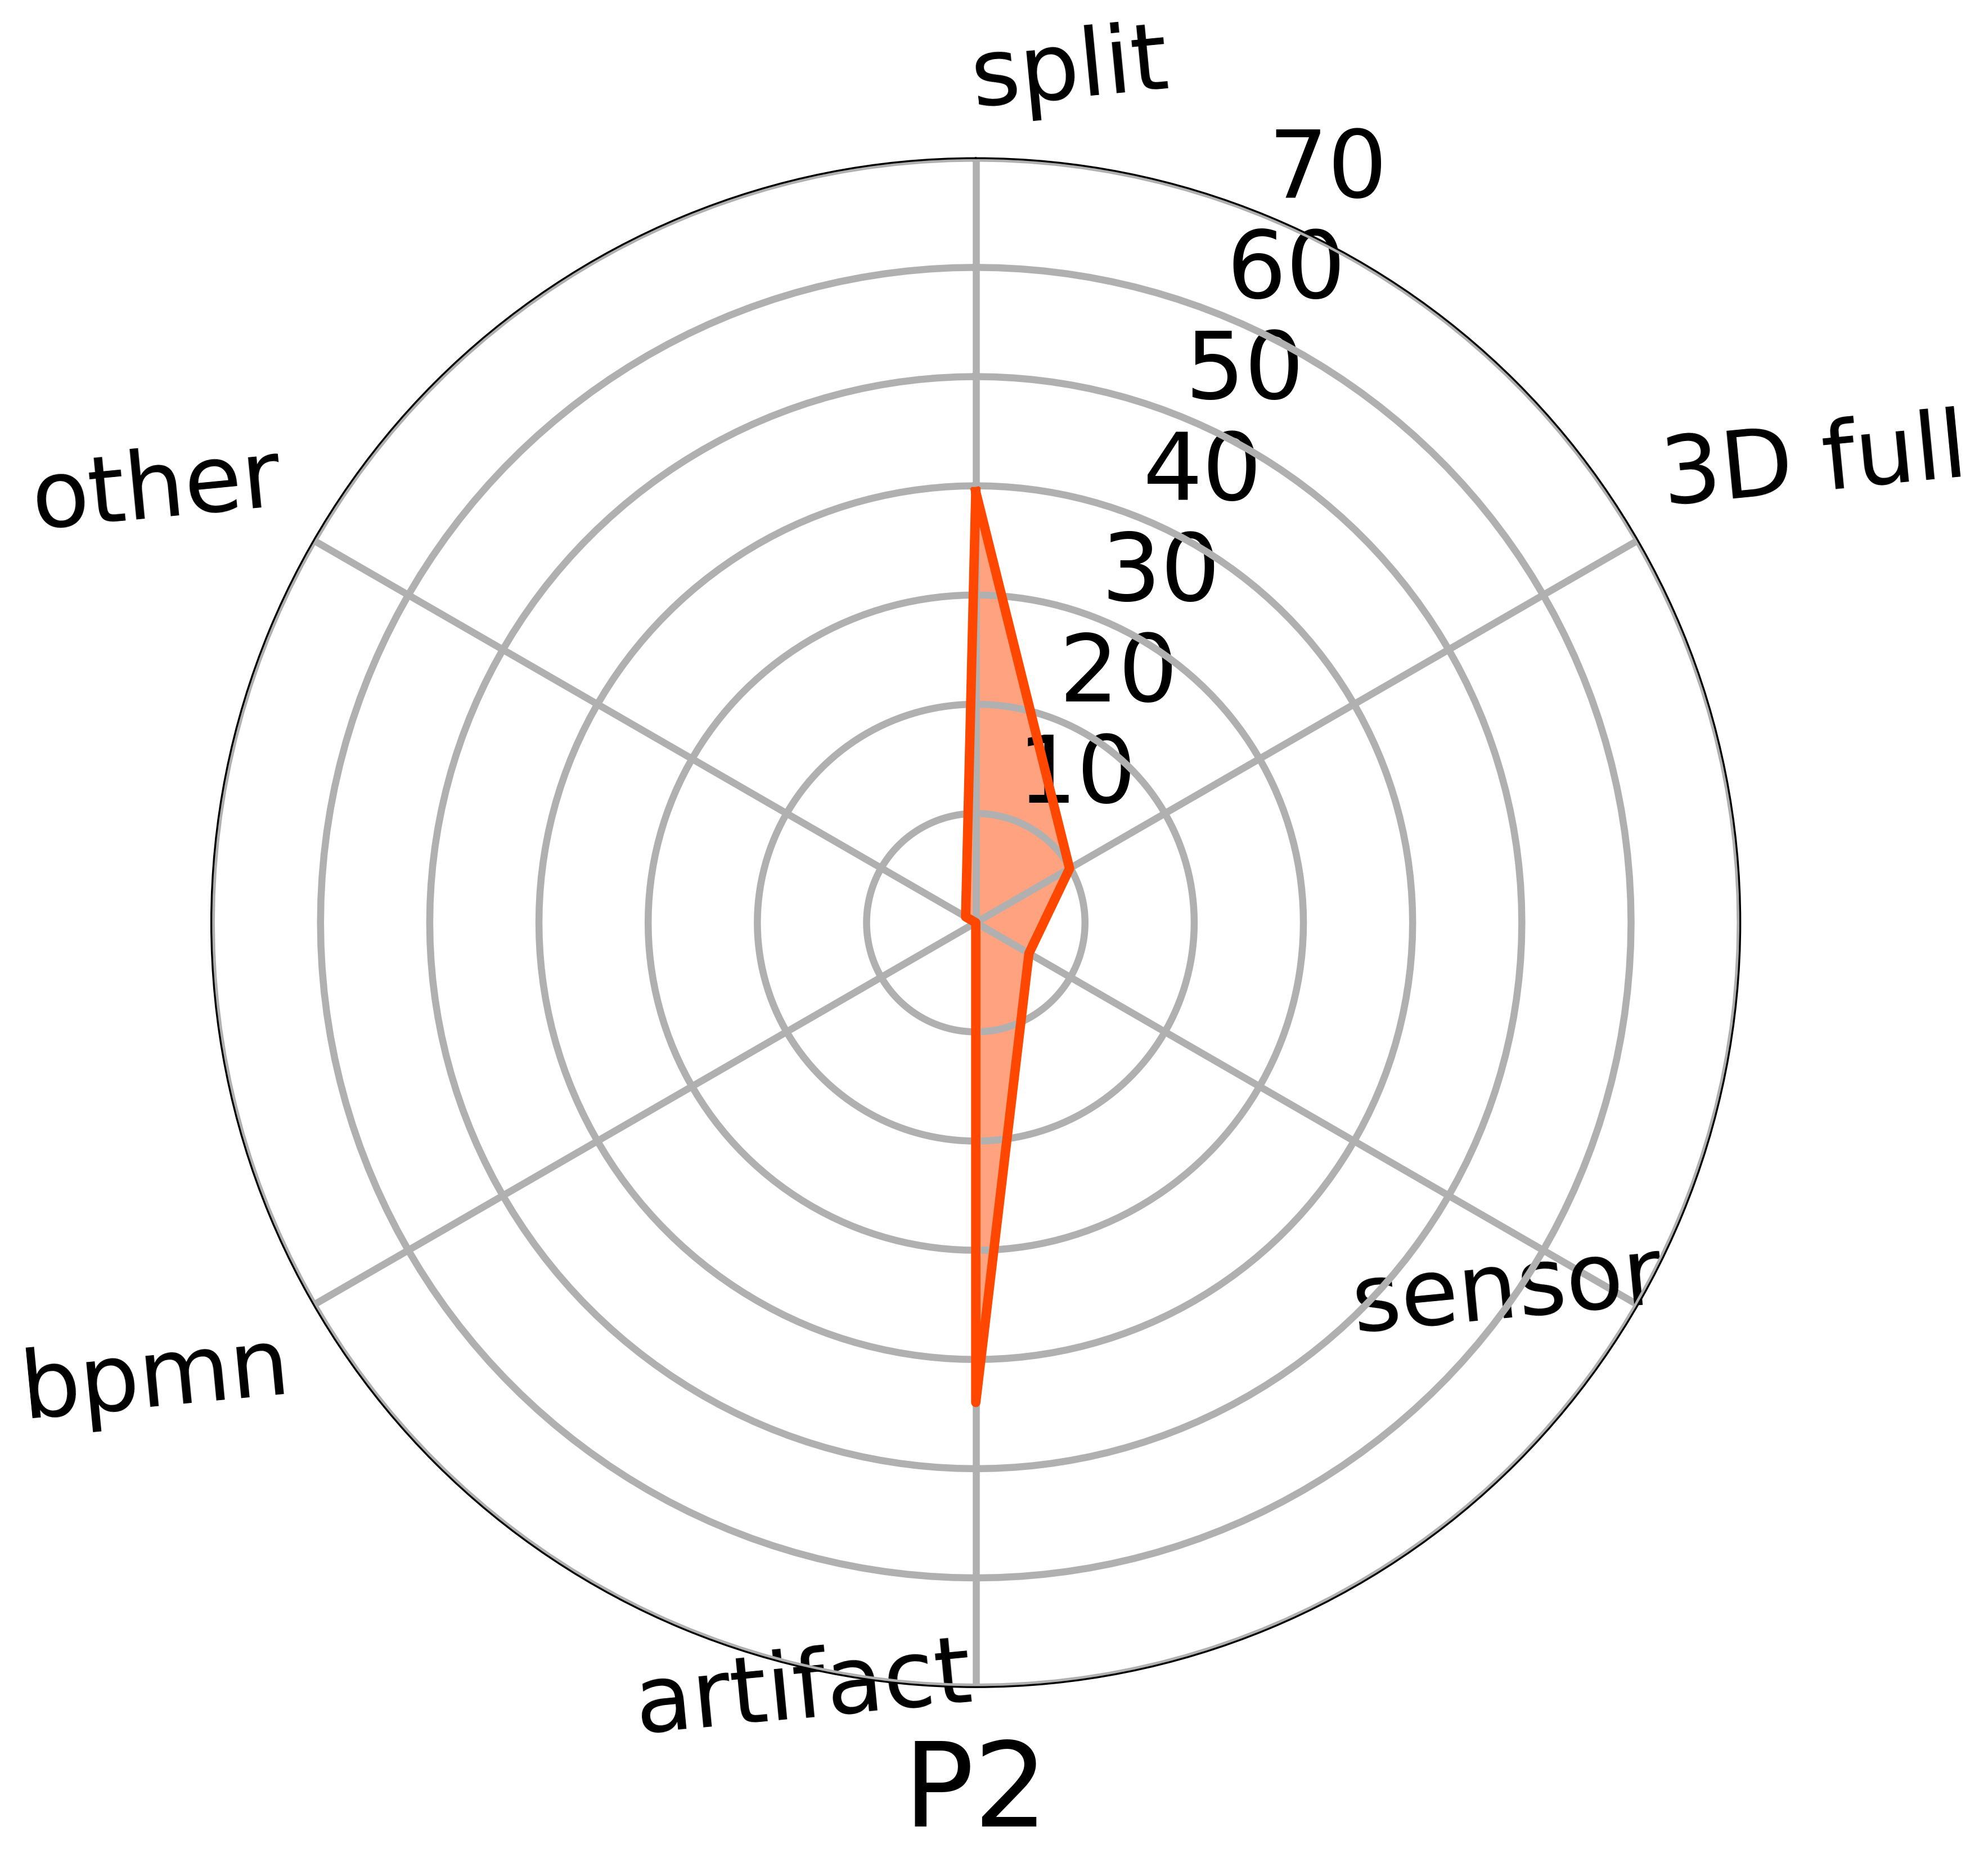
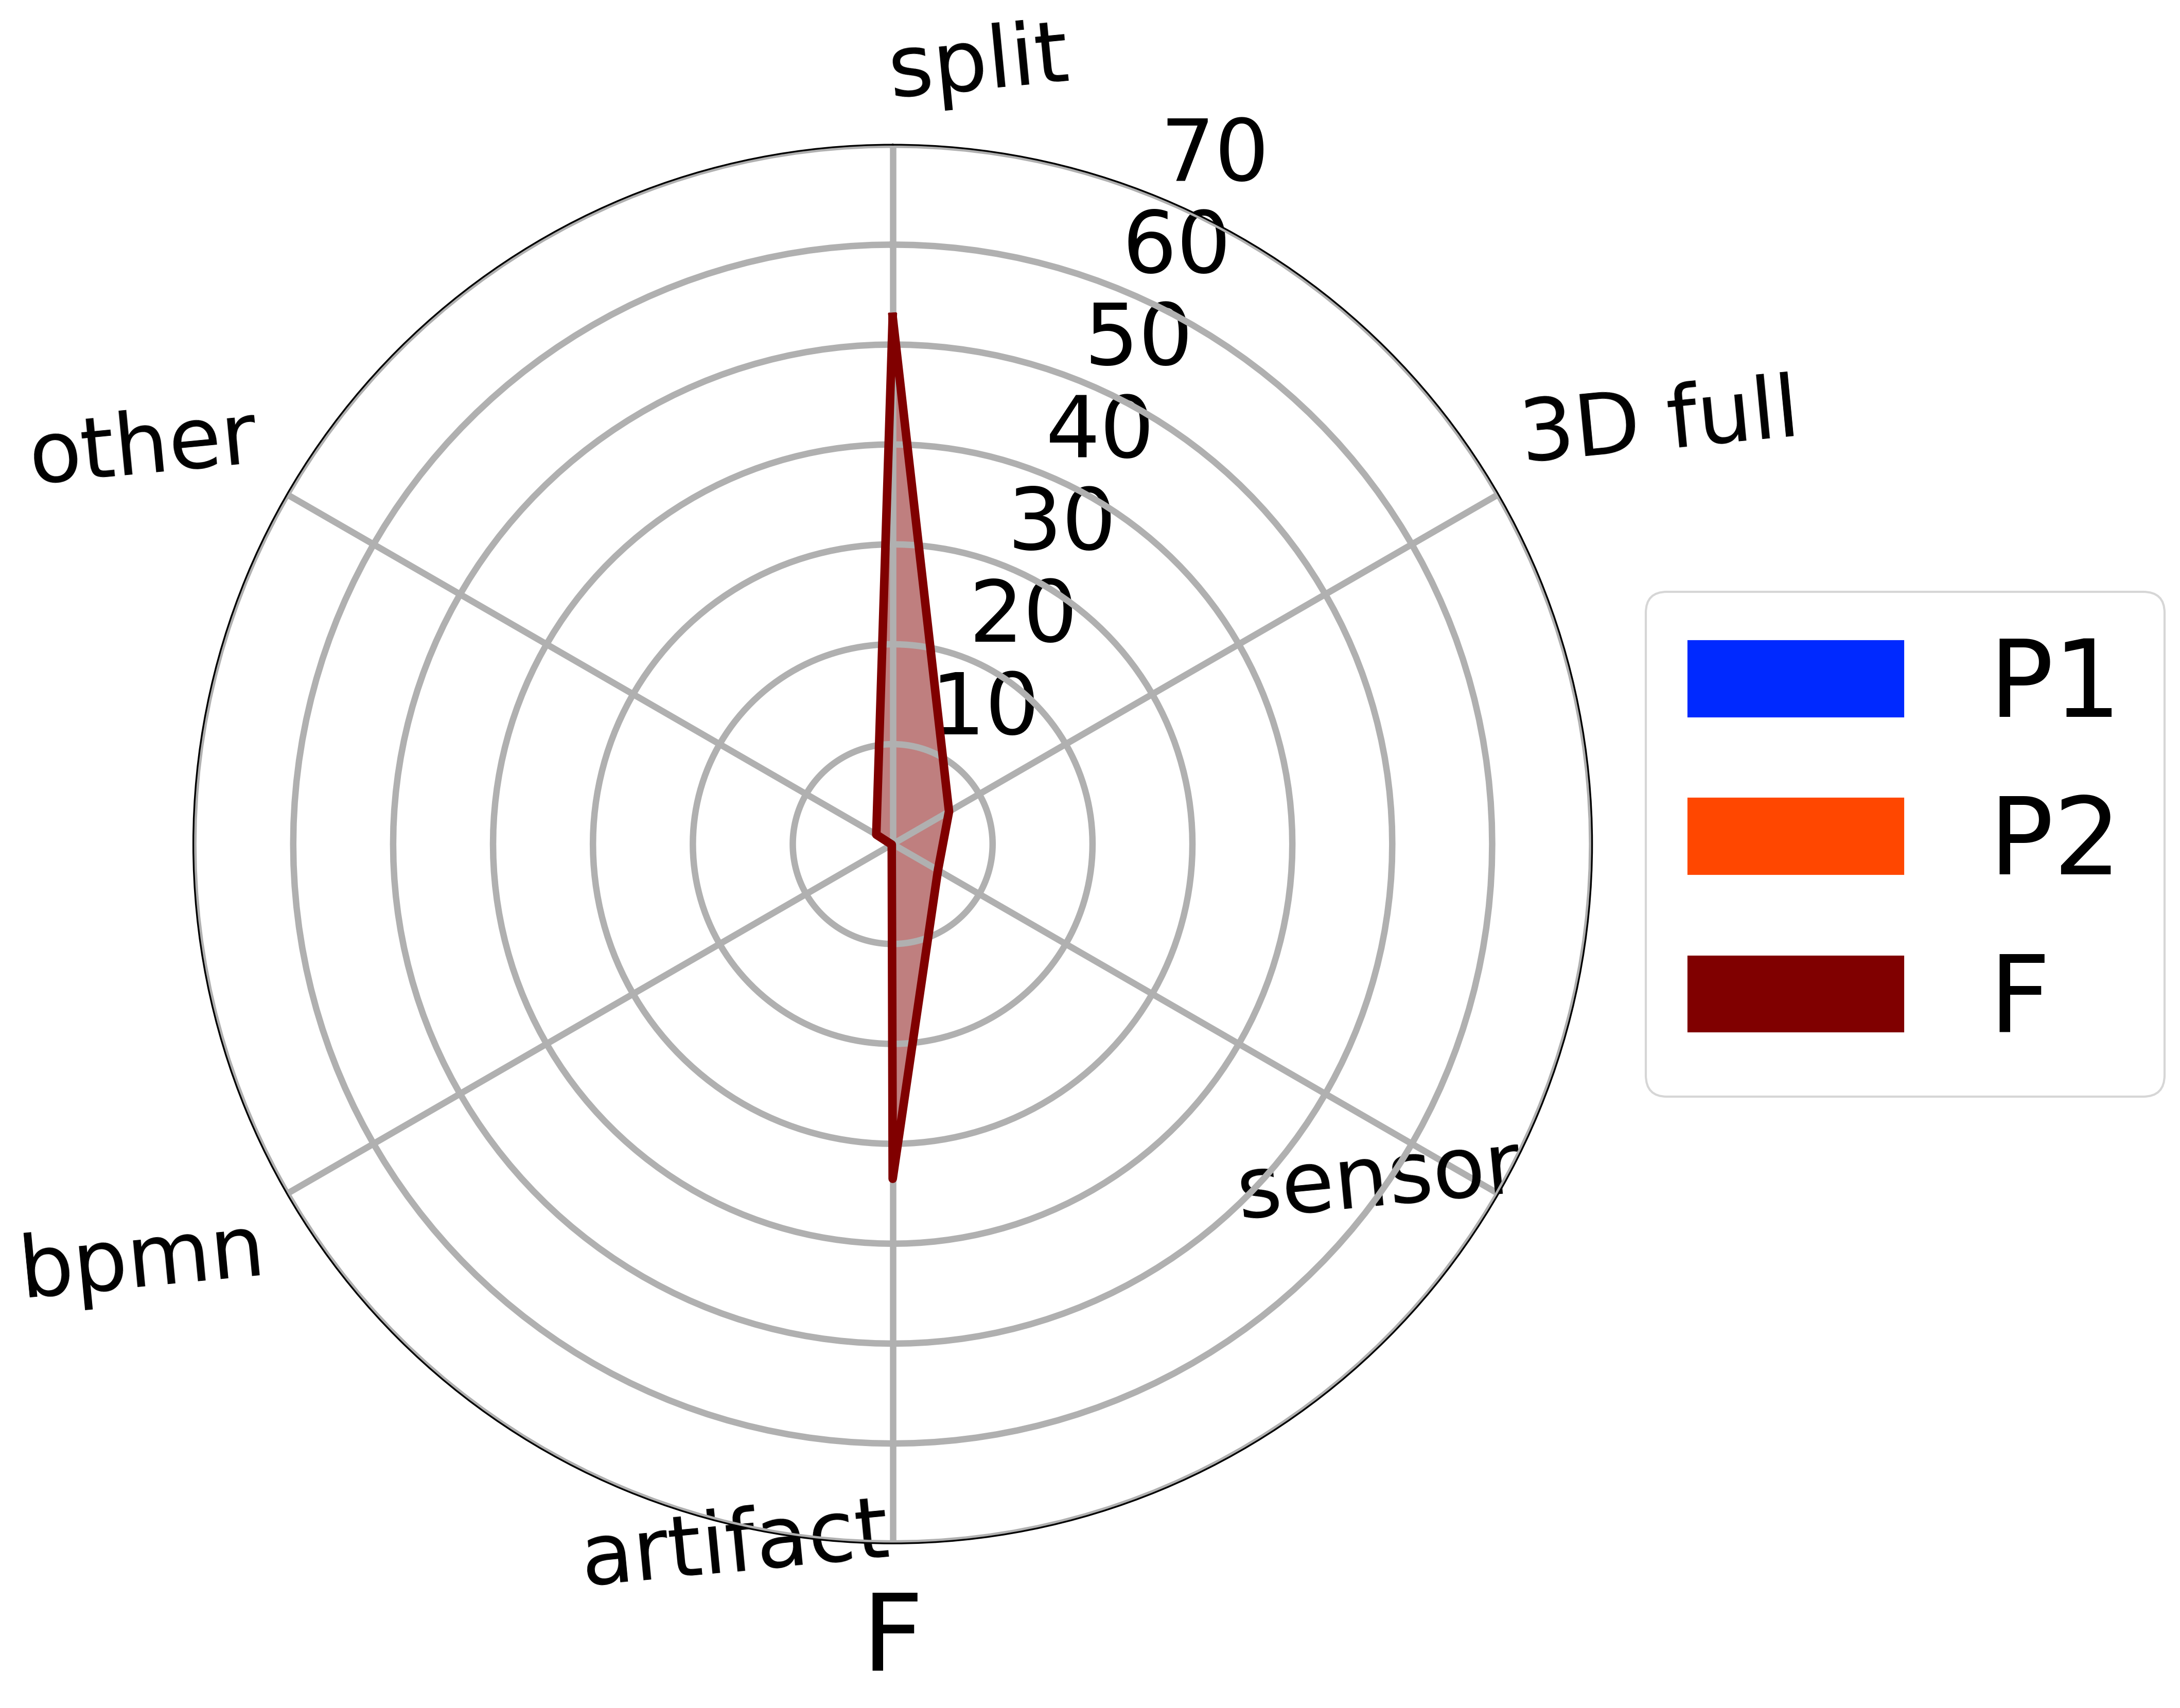
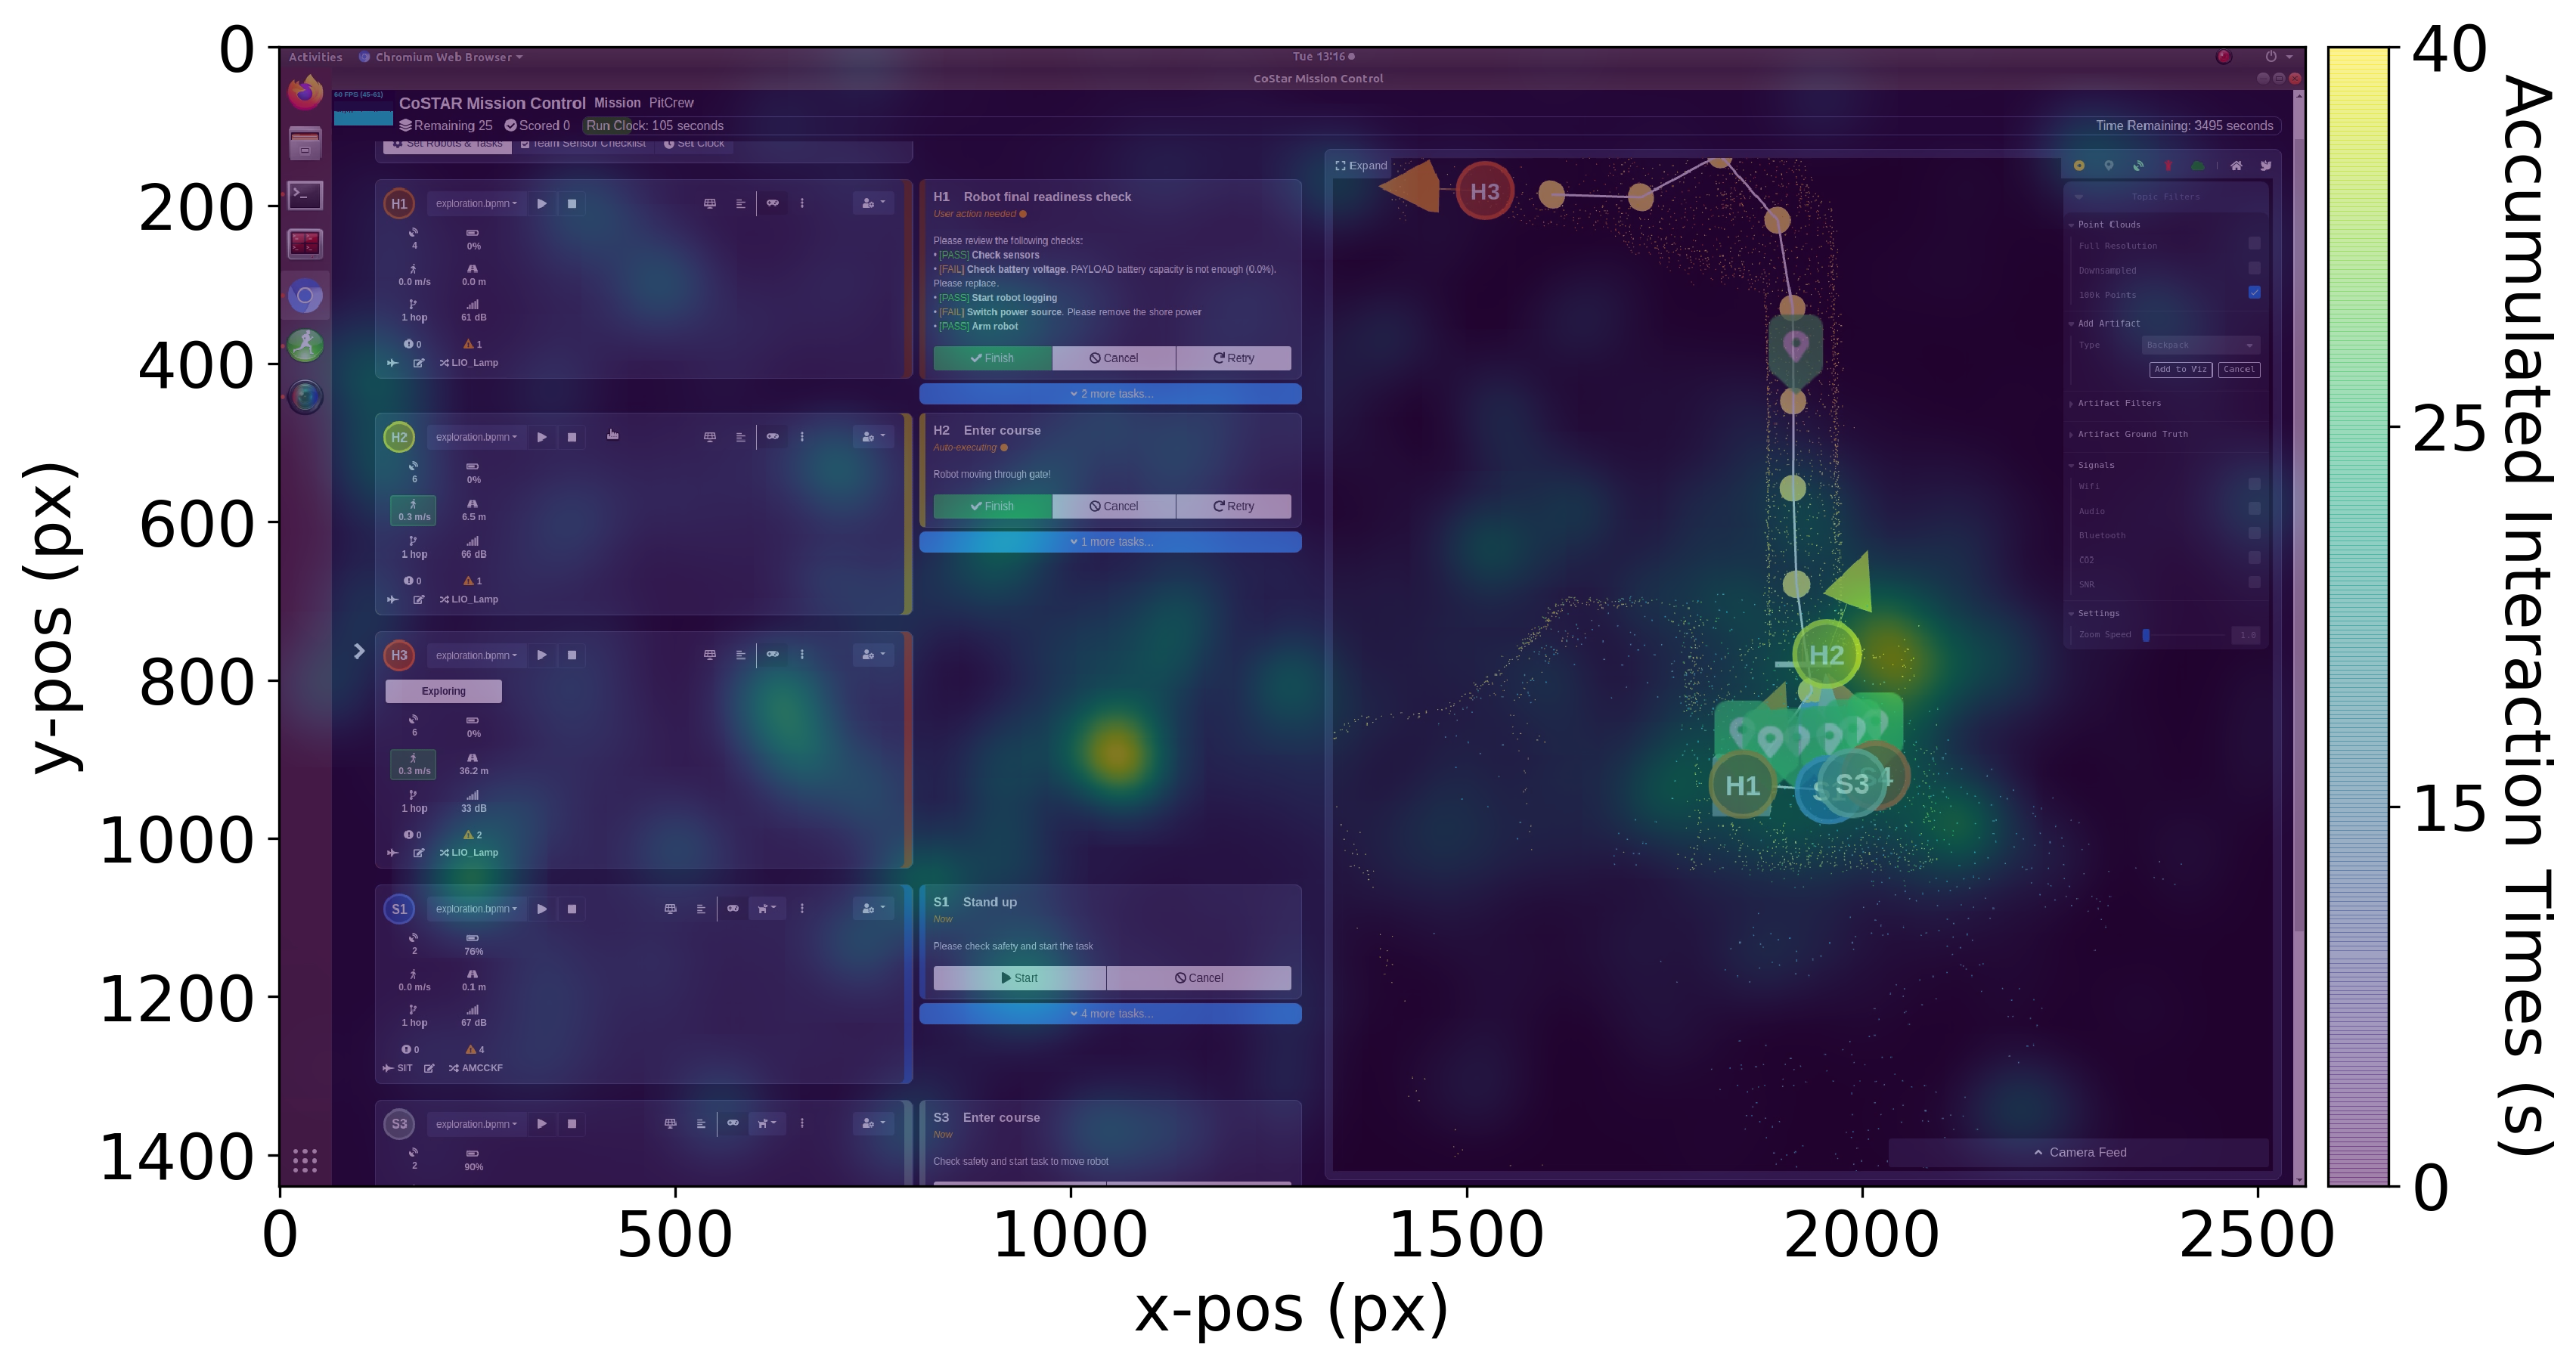
UI Feature Usage: With the main Mission Control interface being the main interaction point for human supervisory control, we then look at the feature usage within the interface itself. Figure 7 shows the relative interaction times with the split-screen view, the 3D full-screen console view, the sensor health overview, artifact submission drawer, and the BPMN modal that gives a detailed overview of a robot’s inner state machine (which was relied upon during the “Urban Circuit”). We see that, especially during runs P2 and F, large amounts of time were spent on the artifact drawer and thus performing the search task analyzing the artifact reports that were generated by the multi-agent system. To gain situational awareness and potentially interact with the robot team, the human supervisor primarily relied on the split-screen view of the Mission Control app that is shown in the background of Figure 8 overlaid by a heat map that indicates the most active areas derived from mouse cursor positions sampled at 1.5 Hz. In this analysis, an area is deemed inactive if the mouse has been stationary for more than ten seconds. Huang et al. [27] found that the median difference between human gaze and mouse position during an active task is 77 pixels with a standard deviation of 33.9 pixels at 96 dpi screen resolution. A Gaussian kernel with and adjusting for 122 dpi is used to derive our heat maps. Figure 8 indicates that the robot cards, Copilot tasks and the 3D view were all crucial tools while overseeing the robotic system and performing the exploration and search tasks.
VII Conclusions and Future Work
In this work we (i) create a game-inspired user interface for multi-agent robot missions (ii) integrate an automated planner for task planning and scheduling, (iii) add a verifiable task framework for increased reliability, and (iv) present results on how the overall system performed over the course of several real-world deployments, including the DARPA SubT Challenge final. In future work, we plan to deploy our interface and Copilot during scientific exploration missions to autonomously map and identify geological features and assess exploration strategies in lava tubes. This will lead to further validation of the subsystems and a structured assessment of a supervisor’s workload outside the realm of the SubT challenge with experts and potentially non-expert users. Ultimately, we would like to assess operator workload from wearable sensors in real-time and consider such constraints in Copilot’s task planning.
Acknowledgment
The work is partially supported by the Jet Propulsion Laboratory, California Institute of Technology, under a contract with the National Aeronautics and Space Administration (80NM0018D0004), and Defense Advanced Research Projects Agency (DARPA). This work was conducted in collaboration with the Making Innovative Space Technologies Laboratory (MIST Lab) at Polytechnique Montreal. The first author would like to thank the Natural Sciences and Engineering Research Council of Canada (NSERC) for their generous support in the form of a Vanier Canada Graduate Scholarship. Thank you to all members of Team CoSTAR for their valuable discussions and support.
References
- [1] M. Asada, P. Stone, et al., “RoboCup: A treasure trove of rich diversity for research issues and interdisciplinary connections [TC Spotlight],” IEEE Robotics Automation Magazine, vol. 26, no. 3, pp. 99–102, 2019.
- [2] K. A. Hambuchen, M. C. Roman, et al., NASA’s Space Robotics Challenge: Advancing Robotics for Future Exploration Missions. American Institute of Aeronautics and Astronautics, 2017. [Online]. Available: https://arc.aiaa.org/doi/abs/10.2514/6.2017-5120
- [3] M. Link and B. Lamboray, European Space Resources Innovation Centre – ESRIC. American Institute of Aeronautics and Astronautics, 2021. [Online]. Available: https://arc.aiaa.org/doi/abs/10.2514/6.2021-4012
- [4] A. Agha, K. Otsu, et al., “Nebula: Quest for robotic autonomy in challenging environments; TEAM costar at the DARPA subterranean challenge,” Submitted to the Journal of Field Robotics, 2021. [Online]. Available: https://arxiv.org/abs/2103.11470
- [5] T. N. Titus, J. J. Wynne, et al., “A roadmap for planetary caves science and exploration,” Nature Astronomy, vol. 5, no. 6, pp. 524—525, 2021. [Online]. Available: https://doi.org/10.1038/s41550-021-01385-1
- [6] J. C. R. Licklider, “Man-computer symbiosis,” IRE Transactions on Human Factors in Electronics, vol. HFE-1, no. 1, pp. 4–11, 1960.
- [7] J. Y. Chen and M. J. Barnes, “Human–robot interaction,” Handbook of human factors and ergonomics, pp. 1121–1142, 2021.
- [8] M. Kaufmann, T. S. Vaquero, et al., “Copilot mike: An autonomous assistant for multi-robot operations in cave exploration,” in IEEE Aerospace Conference, 2021.
- [9] S. Kohlbrecher, A. Romay, et al., “Human-robot teaming for rescue missions: Team vigir’s approach to the 2013 darpa robotics challenge trials,” Journal of Field Robotics, vol. 32, no. 3, pp. 352–377, 2015.
- [10] M. Tranzatto, F. Mascarich, et al., “Cerberus: Autonomous legged and aerial robotic exploration in the tunnel and urban circuits of the darpa subterranean challenge,” Field Robotics, 2022.
- [11] D. Szafir and D. A. Szafir, “Connecting human-robot interaction and data visualization,” in Proceedings of the 2021 ACM/IEEE International Conference on Human-Robot Interaction. New York, NY, USA: Association for Computing Machinery, 2021, p. 281–292. [Online]. Available: https://doi.org/10.1145/3434073.3444683
- [12] A. Rahmani, S. Bandyopadhyay, et al., “Space vehicle swarm exploration missions: A study of key enabling technologies and gaps,” Proceedings of the 70th International Astronautical Congress, 2019.
- [13] M. Johnson, J. M. Bradshaw, et al., “Coactive design: Designing support for interdependence in joint activity,” J. Hum.-Robot Interact., vol. 3, no. 1, p. 43–69, feb 2014. [Online]. Available: https://doi.org/10.5898/JHRI.3.1.Johnson
- [14] K. A. Roundtree, J. R. Cody, et al., “Visualization design for human-collective teams,” Proceedings of the Human Factors and Ergonomics Society Annual Meeting, vol. 63, no. 1, pp. 417–421, 2019. [Online]. Available: https://doi.org/10.1177/1071181319631028
- [15] G. Wallner, N. Halabi, and P. Mirza-Babaei, “Aggregated visualization of playtesting data,” in Proceedings of the 2019 CHI Conference on Human Factors in Computing Systems (CHI). New York, NY, USA: Association for Computing Machinery, 2019. [Online]. Available: https://doi.org/10.1145/3290605.3300593
- [16] M. C. Medlock, D. Wixon, et al., “Using the RITE method to improve products: A definition and a case study,” Usability Professionals Association, vol. 51, 2002.
- [17] N. Hudson, F. Talbot, et al., “Heterogeneous ground and air platforms, homogeneous sensing: Team CSIRO data61’s approach to the DARPA subterranean challenge,” CoRR, 2021. [Online]. Available: https://arxiv.org/abs/2104.09053
- [18] M. T. Ohradzansky, E. R. Rush, et al., “Multi-agent autonomy: Advancements and challenges in subterranean exploration,” CoRR, 2021. [Online]. Available: https://arxiv.org/abs/2110.04390
- [19] S. Scherer, V. Agrawal, et al., “Resilient and modular subterranean exploration with a team of roving and flying robots,” Submitted to the Journal of Field Robotics, 2021.
- [20] T. Roucek, M. Pecka, et al., “System for multi-robotic exploration of underground environments CTU-CRAS-NORLAB in the DARPA subterranean challenge,” CoRR, 2021. [Online]. Available: https://arxiv.org/abs/2110.05911
- [21] K. Otsu, S. Tepsuporn, et al., “Supervised autonomy for communication-degraded subterranean exploration by a robot team,” in IEEE Aerospace Conference, 2020.
- [22] S. S. Bae, F. Rossi, et al., “A visual analytics approach to debugging cooperative, autonomous multi-robot systems’ worldviews,” in IEEE Conference on Visual Analytics Science and Technology (VAST), 2020.
- [23] J. Benton, A. Coles, and A. Coles, “Temporal planning with preferences and time-dependent continuous costs,” in Proceedings of the Twenty-Second International Conference on International Conference on Automated Planning and Scheduling. AAAI Press, 2012.
- [24] A. Khan, K. Yang, et al., “A competitive combat strategy and tactics in rts games ai and starcraft,” in Advances in Multimedia Information Processing – PCM 2017, B. Zeng, Q. Huang, et al., Eds. Cham: Springer International Publishing, 2018.
- [25] S. Kim, A. Bouman, et al., “PLGRIM: hierarchical value learning for large-scale exploration in unknown environments,” CoRR, 2021. [Online]. Available: https://arxiv.org/abs/2102.05633
- [26] E. Terry, X. Lei, et al., “Object and gas source detection with robotic platforms in perceptually-degraded environments,” in RSS Workshop: Robots in the Wild: Challenges in Deploying Robust Autonomy for Robotic Exploration, 2020.
- [27] J. Huang, R. White, and G. Buscher, “User see, user point: Gaze and cursor alignment in web search,” in Proceedings of the 2012 Conference on Human Factors in Computing Systems (CHI), 2012. [Online]. Available: https://www.microsoft.com/en-us/research/publication/user-see-user-point-gaze-and-cursor-alignment-in-web-search/